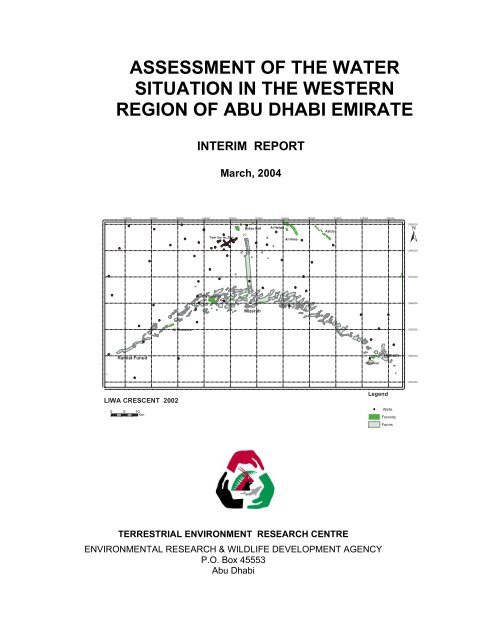
Assessment of the Water Situation in the Western Region
Assessment of the Water Situation in the Western Region
Assessment of the Water Situation in the Western Region

Create successful ePaper yourself
Turn your PDF publications into a flip-book with our unique Google optimized e-Paper software.
Project Number: 03-33-0001DOCUMENT ISSUE SHEETProject Title:<strong>Water</strong> Resources Management Plan for Abu Dhabi EmiratePrepared by:Mike Brook, Huda AlHouqaniName Signature Date10.3.04Submitted by: Mike Brook 10.3.04Approved by:Authorized for Issue by:Issue Status:Recommended Circulation:File Reference Number:Team MembersJohn NewbyJohn Newbyf<strong>in</strong>alpublicI:\Shared\TERC Publications 2004\<strong>Water</strong> ResourcesProgramme\Interim <strong>Western</strong> <strong>Region</strong>\<strong>in</strong>terim report westernregion.docMike Brook, Mohamed Dawoud, Huda Al HouqaniDOCUMENT REVISION SHEETRevision No. Date AffectedpagesDate <strong>of</strong>ChangeBy2
TABLE OF CONTENTS1. INTRODUCTION............................................................................ 41.1 BACKGROUND & ERWDA WATER RESOURCES MANAGEMENTSTRATEGY DEVELOPMENT ................................................................... 41.2 SCOPE OF REPORT........................................................................ 52. STUDY PROGRESS...................................................................... 62.1 INTRODUCTION............................................................................62.2 OTHER WATER RESOURCE STUDIES: NDC-USGS & GTZ............ 63. CURRENT UNDERSTANDING OF WATER RESOURCESDEVELOPMENT & USE ..................................................................... 93.1 INTRODUCTION............................................................................ 93.2 DOMESTIC WATER SUPPLY & SEWAGE....................................... 103.3 GROUNDWATER DEVELOPMENT ................................................. 113.4 STRATEGIC AQUIFER STORAGE AND RECOVERY ......................... 123.5 AGRICULTURAL DEVELOPMENT................................................... 143.6 FORESTRY DEVELOPMENT......................................................... 193.7 AMENITY WATER SUPPLY .......................................................... 213.8 INDUSTRIAL WATER USE............................................................ 224. GIS DATABASE DEVELOPMENT & POPULATION ................. 255. WORK PROPOSED FOR FINAL STAGE OF PREPARATIONFOR DEVELOPING A WATER RESOURCES MANAGEMENTSTRATEGY ....................................................................................... 286. REFERENCES............................................................................. 29APPENDIX A Details <strong>of</strong> <strong>Western</strong> <strong>Region</strong> Forestry Developments3
70 wells are monitored on a monthly basis and once a year, about 400 wells aremonitored for water levels dur<strong>in</strong>g <strong>the</strong> same week. All wells are monitored manuallys<strong>in</strong>ce <strong>the</strong> collapse <strong>of</strong> <strong>the</strong> automatic monitor<strong>in</strong>g system some years ago.Despite several attempts, access to <strong>the</strong> database stor<strong>in</strong>g all water level and waterquality data for <strong>the</strong> monitor<strong>in</strong>g wells has not yet been achieved.The GTZ project began <strong>in</strong> 1996 and to date 699 wells have been drilled. In recentyears, exploration has concentrated on <strong>the</strong> western region and also <strong>the</strong> new ASRProject site near Med<strong>in</strong>at Zayed. A total depth <strong>of</strong> 99,990m has been drilled on <strong>the</strong>project with an average completed well depth <strong>of</strong> 124m. The maximum drilled depth is1500m. 282 wells are monitored cont<strong>in</strong>uously with data – loggers, mostly just for waterlevels, however, some have water quality data loggers as well. At <strong>the</strong> beg<strong>in</strong>n<strong>in</strong>g <strong>of</strong> <strong>the</strong>Exploration project, <strong>in</strong> 1996, drill<strong>in</strong>g activities concentrated on <strong>the</strong> area <strong>of</strong> <strong>the</strong> Al Jawwpla<strong>in</strong>, on <strong>the</strong> Al A<strong>in</strong> – Buraimi border and deep wells (up to 1000m) penetrated <strong>the</strong> Umer Radhuma limestone, but no major <strong>in</strong>flows were discovered at depths greater than300m. Only three deep wells were drilled, <strong>the</strong> rema<strong>in</strong>der has concentrated on <strong>the</strong>exploration <strong>of</strong> <strong>the</strong> surficial alluvium aquifer.Data for <strong>the</strong> GTZ project was obta<strong>in</strong>ed <strong>in</strong> December, 2003, compris<strong>in</strong>g geophysical andlithological logs and also monitor<strong>in</strong>g well hydrographs and monitor<strong>in</strong>g records forsal<strong>in</strong>ity. All data is be<strong>in</strong>g compiled <strong>in</strong>to a s<strong>in</strong>gle spreadsheet and will be comb<strong>in</strong>ed withall o<strong>the</strong>r relevant groundwater data obta<strong>in</strong>ed <strong>in</strong> order to create a series <strong>of</strong>hydrogeological maps for <strong>the</strong> Emirate <strong>of</strong> Abu Dhabi, generated from ARC GIS.7
3. CURRENT UNDERSTANDING OF WATER RESOURCESDEVELOPMENT & USE3.1 IntroductionThe year 2002 has been chosen as <strong>the</strong> base year for study <strong>of</strong> <strong>Water</strong> Supply andDemands. The Inception report (ERWDA, 2003) provided a breakdown <strong>of</strong> water useaccord<strong>in</strong>g to <strong>the</strong> last major study (USGS, 1996) devoted to evaluat<strong>in</strong>g Abu Dhabi wateruse, but <strong>the</strong> statistics for <strong>the</strong> <strong>Water</strong> Production and Consumption for <strong>the</strong> <strong>Western</strong><strong>Region</strong> reported <strong>in</strong> this <strong>in</strong>terim report have been taken from <strong>the</strong> 2002 <strong>Water</strong> ResourcesStatistics Bullet<strong>in</strong> published by ERWDA (ERWDA, 2004) and from o<strong>the</strong>r work carriedout by <strong>the</strong> ERWDA <strong>Water</strong> Resources Programme.<strong>Water</strong> consumption is met from groundwater abstraction, from treated sewage effluent(TSE) and from desal<strong>in</strong>ation. Whilst groundwater reserves have been heavily exploitedover <strong>the</strong> last 10-15 years <strong>in</strong> <strong>the</strong> region, result<strong>in</strong>g <strong>in</strong> decl<strong>in</strong><strong>in</strong>g water levels caus<strong>in</strong>g<strong>in</strong>creases <strong>in</strong> groundwater sal<strong>in</strong>ity, groundwater still provides almost 70% <strong>of</strong> all waterrequired <strong>in</strong> <strong>the</strong> western region and thus must be treated as <strong>the</strong> major water source,deserv<strong>in</strong>g <strong>in</strong>creased attention with regard to its exploration, assessment andmanagement <strong>in</strong> order to help achieve susta<strong>in</strong>able <strong>Water</strong> Resources Management.Figure 3 provides <strong>in</strong>formation on water use and water sources for <strong>the</strong> western region.Figure 3 <strong>Western</strong> <strong>Region</strong> <strong>Water</strong> Use and <strong>Water</strong> Sources<strong>Western</strong> <strong>Region</strong> <strong>Water</strong> Use2002<strong>Western</strong> <strong>Region</strong> <strong>Water</strong> Sources2002Amenity8.6%Forestry24%Domestic19.6%Industry2.2%Agriculture45.6%Desal<strong>in</strong>ated22%TreatedEffluent10%Groundwater68%Groundwater provides <strong>the</strong> bulk <strong>of</strong> water requirements, followed by desal<strong>in</strong>ated water(22% from six co-generation power companies) and treated effluent from 8 ma<strong>in</strong> plants.Table 2 shows a breakdown <strong>of</strong> water used <strong>in</strong> <strong>the</strong> western region.Table 2 Breakdown <strong>of</strong> <strong>Water</strong> Use <strong>in</strong> <strong>the</strong> <strong>Western</strong> <strong>Region</strong>Sector<strong>Water</strong> Used(Mm³/yr)% <strong>of</strong> Total<strong>Western</strong> <strong>Region</strong>% <strong>of</strong> Total forwhole Abu DhabiEmirate% change <strong>in</strong> uses<strong>in</strong>ce 1994Domestic 332.8 19.6 73 90Industry 36.9 2.2 57 1745Agriculture 772.9 45.6 40 279Forestry 407 24.0 21 248Amenity 145.98 8.6 57 No 1994 dataTOTAL 1695.58 100 -
The last, published detailed assessment <strong>of</strong> <strong>the</strong> water consumption <strong>in</strong> <strong>the</strong> <strong>Western</strong><strong>Region</strong> was undertaken by <strong>the</strong> USGS/NDC groundwater research project <strong>in</strong> 1996 withan assessment <strong>of</strong> water use <strong>in</strong> 1994(USGS/NDC, 1996). There have been substantial<strong>in</strong>creases <strong>in</strong> water consumption <strong>in</strong> all sectors, rang<strong>in</strong>g from 90-1745%. Agriculture andForestry, <strong>the</strong> two largest water sector uses, have both quadrupled <strong>the</strong>ir consumptionover <strong>the</strong> last 8 years.3.2 Domestic <strong>Water</strong> Supply & Sewage19.6% <strong>of</strong> all water utilised <strong>in</strong> <strong>the</strong> western region is for domestic purposes. Mirfa and Silaare <strong>the</strong> only ADWEA desal<strong>in</strong>ation plants currently operat<strong>in</strong>g <strong>in</strong> <strong>the</strong> <strong>Western</strong> <strong>Region</strong>;Mirfa plant produces 27.15 Mm³/yr and is used almost exclusively for Liwa and Med<strong>in</strong>atZayed and Sila produces only 2.4 Mm³/yr from two small reverse osmosis plants . Thema<strong>in</strong> demands for potable water are Mad<strong>in</strong>at Zayed, Ghayathi, Mirfa, Liwa, Delma,Asab, Habshan and Sila.O<strong>the</strong>r small plants with a typical capacity <strong>of</strong> up to 10,000 m³/d are operated privately onislands e.g. Sir Baniyas, Delma, Abu Al Abyad etc and by ADNOC at Ruwais IndustrialEstate where 15,000 m³/d is produced from <strong>the</strong> multi-stage flash desal<strong>in</strong>ation process.The water is used by <strong>the</strong> Ruwais Industrial and residential complex, <strong>the</strong> lattercompris<strong>in</strong>g 42 multi-storey build<strong>in</strong>gs. The irrigation requirements <strong>of</strong> <strong>the</strong> complex areapproximately 3810 m³/d met 36% by desal<strong>in</strong>ated water and 54% from treated effluent.The amount <strong>of</strong> desal<strong>in</strong>ated water used <strong>in</strong> irrigation has been reduced drastically with<strong>the</strong> <strong>in</strong>troduction, <strong>in</strong> 2003, <strong>of</strong> a <strong>in</strong>telligent central irrigation system at <strong>the</strong> new RuwaisHous<strong>in</strong>g Complex (ADNOC, 2003).A new multi-stage flash desal<strong>in</strong>ation plant is be<strong>in</strong>g constructed at Jebel Dhana nearShweihat, <strong>in</strong> between Sila and Ruwais. The desal<strong>in</strong>ated water will be re-m<strong>in</strong>eralised toproduce potable water which meets <strong>the</strong> Abu Dhabi standard for dr<strong>in</strong>k<strong>in</strong>g water. <strong>Water</strong>will be delivered to <strong>the</strong> distribution networks <strong>of</strong> Sila, Mirfa and Abu Dhabi. The plantcomprises six evaporator units each with a design <strong>of</strong> 16.67 MIGD and with a totalcapacity <strong>of</strong> 100 MIGD. Construction is expected to be completed by mid-2004.Generally, costs <strong>of</strong> desal<strong>in</strong>ated water are decreas<strong>in</strong>g, brought about by a comb<strong>in</strong>ation<strong>of</strong> two ma<strong>in</strong> factors, namely:1) Greater efficiencies <strong>of</strong> production brought about by privatisation <strong>of</strong> <strong>the</strong>management <strong>of</strong> most desal<strong>in</strong>ation plants <strong>in</strong> <strong>the</strong> region2) Introduction <strong>of</strong> more efficient new technologies and larger scale desal<strong>in</strong>ationunits which, because <strong>of</strong> economy <strong>of</strong> scale, have significantly reduced generalproduction costs from Dh 17 to Dh11 per 1000 gallons.Wellfields <strong>in</strong> <strong>the</strong> Liwa area, previously operated by AADC, have been closed down <strong>in</strong><strong>the</strong> last 2 years because <strong>of</strong> high chromium values <strong>in</strong> groundwater which pose potentialcarc<strong>in</strong>ogenic risks to human health.Due to <strong>the</strong> mostly brackish nature <strong>of</strong> groundwater <strong>in</strong> areas <strong>of</strong> habitation <strong>in</strong> <strong>the</strong> westernregion, <strong>the</strong>re are very few <strong>in</strong>dividual citizen wells which are operated for dr<strong>in</strong>k<strong>in</strong>g waterpurposes; <strong>the</strong> only area <strong>the</strong>y exist are <strong>in</strong> <strong>the</strong> fresh water groundwater mound whichoccurs <strong>in</strong> between Liwa Oasis and Beda Zayed (see Figure 4).10
Table 3 shows <strong>the</strong> production <strong>of</strong> <strong>the</strong> eight ma<strong>in</strong> sewage treatment plants <strong>in</strong> <strong>the</strong> region.Table 3 Sewage Treatment Plant ProductionSewage Treatment PlantProduction, Mm3/yrMafraq 95.13Mad<strong>in</strong>at Zayed 1.75Ba<strong>in</strong>oona 0.365Mirfa 1.46Ghayathi Ww T Plant 0.91Delma Island 0.91Khatam 0.5Ghantoot 0.24Total 101.265Comb<strong>in</strong>ed, <strong>the</strong>y produce 101 Mm³/yr and virtually all production is used <strong>in</strong> amenityirrigation for parks, gardens and o<strong>the</strong>r recreational/sports ground areas.3.3 Groundwater DevelopmentThe groundwater resources <strong>of</strong> <strong>the</strong> <strong>Western</strong> region, and <strong>the</strong>ir likely developmentpotential, is considered to have reasonable expectation for meet<strong>in</strong>g demands forbrackish groundwater although future potable supply demands can only be reasonablymet from desal<strong>in</strong>ated seawater e.g. Al Mirfa and Shuweihat (near<strong>in</strong>g completion)plants. The brackish groundwater reserve is still substantial, estimated at 227 billioncubic meters (USGS/NDC,1996). By 1995, it was estimated that less than 1% <strong>of</strong> <strong>the</strong>total useable volume <strong>of</strong> brackish water had been utilised, not consider<strong>in</strong>g any rechargeto <strong>the</strong> system.The follow<strong>in</strong>g ma<strong>in</strong> conclusions can be drawn with regards to groundwater<strong>in</strong>vestigation and development.−−−−Freshwater is very limited and is restricted to <strong>the</strong> groundwater bas<strong>in</strong> immediatelynorth <strong>of</strong> Liwa cover<strong>in</strong>g a surface area <strong>of</strong> about 1800 km². There are now nooperat<strong>in</strong>g municipal wellfields <strong>in</strong> <strong>the</strong> project area: <strong>the</strong> 18 former <strong>Water</strong> & ElectricityDept wellfields were shut down dur<strong>in</strong>g 2001 because <strong>of</strong> levels <strong>of</strong> chromium <strong>in</strong>groundwater that were above permissible levels and deemed to be a significan<strong>the</strong>alth risk.Little or no active recharge, ei<strong>the</strong>r direct from ra<strong>in</strong>fall, or <strong>in</strong>direct from o<strong>the</strong>rmeans, is occurr<strong>in</strong>g <strong>in</strong> <strong>the</strong> project area. The groundwater sources are <strong>the</strong>reforefossil and non-renewable.despite major groundwater exploration efforts (<strong>in</strong> particular by <strong>the</strong> USGS andGTZ), it appears that no significant undeveloped fresh water aquifers have beendetected <strong>in</strong> <strong>the</strong> study area, o<strong>the</strong>r than <strong>the</strong> fresh water bas<strong>in</strong> immediately north <strong>of</strong>Liwa Oasis. This area is now subject to a pilot test Artificial Recharge scheme aspart <strong>of</strong> an overall Aquifer Storage & Recovery (ASR) project which commenced itstrail 12 month period <strong>in</strong> September, 2003 (see Figure 4).Exploration and assessment <strong>of</strong> deep aquifers has to date been very limited.There still rema<strong>in</strong>s substantial scope for deep (500m – 1500+m) drill<strong>in</strong>g projectsto <strong>in</strong>vestigate Dammam, Umm er Radhuma & Simsima Formations. All11
−Formations are present throughout <strong>the</strong> Project area and have considerablethickness; coupled with secondary permeability <strong>the</strong>y have significant potential fornew groundwater resources (most likely to be brackish or sal<strong>in</strong>e though). Acurrent deep drill<strong>in</strong>g project, undertaken by <strong>the</strong> Abu Dhabi Municipality AgricultureDept., is now on hold due to drill<strong>in</strong>g rig difficulties associated with <strong>the</strong> greaterdepths <strong>of</strong> penetration.Cont<strong>in</strong>ued development <strong>of</strong> new farms, agriculture projects and ForestryPlantations, utilis<strong>in</strong>g shallow groundwater resources <strong>in</strong> <strong>the</strong> Aeolian Sand andgravel aquifer, will place fur<strong>the</strong>r local stress on this resource.3.4 Strategic Aquifer Storage and RecoveryGroundwater is still <strong>the</strong> major source satisfy<strong>in</strong>g <strong>the</strong> most <strong>of</strong> <strong>the</strong> water demands <strong>in</strong> <strong>the</strong>project area; its conservation and rational use should be a high priority; at present, <strong>the</strong>potential for aquifer storage & recovery projects is be<strong>in</strong>g assessed with a pilot study to<strong>in</strong>ject desal<strong>in</strong>ated water <strong>in</strong>to <strong>the</strong> sand aquifer <strong>in</strong> <strong>the</strong> Liwa area via recharge wells and tobuild up a substantial strategic reserve <strong>of</strong> groundwater for emergency dr<strong>in</strong>k<strong>in</strong>g water forAbu Dhabi City and elsewhere <strong>in</strong> <strong>the</strong> <strong>Western</strong> <strong>Region</strong>. Such a scheme plays a veryimportant role <strong>in</strong> <strong>the</strong> overall management <strong>of</strong> groundwater <strong>in</strong> <strong>the</strong> Emirate.The Aquifer Storage and Recovery (ASR) project, undertaken by <strong>the</strong> PrivateDepartment <strong>of</strong> Sheihk Zayed b<strong>in</strong> Sultan Al Nahyan, with technical design andsupervision by Deutsche Gesellschaft für Technische Zusammenarbeit (GTZ), islocated about 20km South West <strong>of</strong> Mad<strong>in</strong>et Zayed <strong>in</strong> an area <strong>of</strong> remote, virg<strong>in</strong> desertat Tawi Um Az Ziba which is devoid <strong>of</strong> current groundwater extraction. Figure 4 shows<strong>the</strong> location <strong>of</strong> <strong>the</strong> ASR site which comprises 5 recharge/recovery wells and an<strong>in</strong>filtration bas<strong>in</strong> measur<strong>in</strong>g 50m x 25m with an <strong>in</strong>filtration capacity <strong>of</strong> about 250m³/hr.The comb<strong>in</strong>ed well and bas<strong>in</strong> recharge rate is 12,000 m³/day and a recharge / recoverycycle pilot test ASR scheme commenced <strong>in</strong> September 2003 and is planned for 12months. Recharged water is supplied from <strong>the</strong> Mirfa desal<strong>in</strong>ation plant and a 9km take<strong>of</strong>f pipel<strong>in</strong>e from <strong>the</strong> Mirfa – Liwa ma<strong>in</strong> transmission l<strong>in</strong>e. More than 20 monitor<strong>in</strong>gwells exist <strong>in</strong> <strong>the</strong> area to measure <strong>the</strong> effects <strong>of</strong> artificial recharge and to provide datawith which to carry out calibration <strong>of</strong> a digital groundwater model established to predict<strong>the</strong> effects <strong>of</strong> <strong>the</strong> ASR scheme.Supplementation <strong>of</strong> aquifer storage can be utilised <strong>in</strong> times <strong>of</strong> peak demands and alsoover cont<strong>in</strong>uous extended periods as a strategic emergency resource to satisfydomestic demands.12
Figure 4 Location <strong>of</strong> <strong>the</strong> ASR test pilot project <strong>in</strong> <strong>the</strong> Liwa area
3.5 Agricultural development45% <strong>of</strong> all water used <strong>in</strong> <strong>the</strong> western region is for agriculture purposes. The extent <strong>of</strong>Agricultural development <strong>in</strong> <strong>the</strong> <strong>Western</strong> <strong>Region</strong> <strong>of</strong> Abu Dhabi Emirate is shown <strong>in</strong>Figure 5 and Figure 6 shows <strong>the</strong> expansion <strong>of</strong> agriculture over <strong>the</strong> last 7 yearscompared to that <strong>in</strong> <strong>the</strong> Eastern <strong>Region</strong>. There are now 11,443 private citizens farmsoccupy<strong>in</strong>g 27,331 ha (57% field crops, 18% vegetables, 15% fruit trees, 10% pasture)and irrigated by 41,092 wells, <strong>of</strong> which only 58% are productive.Figure 5 Location <strong>of</strong> Agriculture Development <strong>in</strong> <strong>Western</strong> <strong>Region</strong>.Legend0 25 50 100KmFarmsThe majority <strong>of</strong> <strong>the</strong> 3 ha private citizens farms are located <strong>in</strong> Liwa and Ghayathi. Liwais <strong>the</strong> oldest development with significant farm<strong>in</strong>g be<strong>in</strong>g conducted over <strong>the</strong> last 15years. The area under cultivation has <strong>in</strong>creased from 1,000 ha <strong>in</strong> 1987 to 20,817 ha <strong>in</strong>2002, represent<strong>in</strong>g 76% <strong>of</strong> <strong>the</strong> total cultivated area <strong>in</strong> <strong>the</strong> <strong>Western</strong> <strong>Region</strong>. The historyand impact <strong>of</strong> agricultural development over <strong>the</strong> last decade has been studied by <strong>the</strong>USGS/NDC project (NDC/USGS,1997). As part <strong>of</strong> <strong>the</strong>ir <strong>in</strong>vestigation, 170 wells weresampled for Electrical Conductivity (EC) and Nitrate, amongst o<strong>the</strong>r parameters, <strong>in</strong>1991 and 1996. All wells sampled showed an <strong>in</strong>crease <strong>in</strong> EC and areas previouslyunderla<strong>in</strong> by fresh groundwater, had brackish water <strong>in</strong> 1996 with some <strong>in</strong>dividual wellsshow<strong>in</strong>g <strong>in</strong>creases <strong>in</strong> sal<strong>in</strong>ity <strong>of</strong> more than 2000 µS/cm.
Figure 6 Abu Dhabi Agriculture Expansion 1996-2002ABU DHABI AGRICULTURE EXPANSION10000080000Hectares600004000020000<strong>Western</strong> <strong>Region</strong>Eastern <strong>Region</strong>096 97 98 99 00 01 02<strong>Western</strong> <strong>Region</strong> 14874 18393 20036 22016 25935 26792 27331Eastern <strong>Region</strong> 21135 24532 27725 36986 39768 44103 44946YearIn mid 2003, a rapid well <strong>in</strong>ventory <strong>of</strong> <strong>the</strong> Liwa oasis showed a range <strong>in</strong> EC <strong>of</strong> 8,000 to14,000 µS/cm, prohibit<strong>in</strong>g farm<strong>in</strong>g <strong>of</strong> vegetables so that 90% <strong>of</strong> <strong>the</strong> cropped area seenwas under Rhodes grass and dates, <strong>the</strong> two crops which are currently favoured forprovision <strong>of</strong> high subsidy by <strong>the</strong> Abu Dhabi Government. The only fresh water nowavailable for agriculture (used <strong>in</strong> glass-house farm<strong>in</strong>g; <strong>in</strong> 2002, <strong>the</strong>re were 2146 suchprotected shelters <strong>in</strong> <strong>the</strong> western region, occupy<strong>in</strong>g 74 ha)<strong>in</strong> <strong>the</strong> Liwa area is tankereddesal<strong>in</strong>ated water from Mazirah, although a new distribution network throughout <strong>the</strong>Liwa Oasis will <strong>in</strong>crease <strong>the</strong> amount <strong>of</strong> desal<strong>in</strong>ated water presently used.Levels <strong>of</strong> Nitrate <strong>in</strong> wells were also sampled <strong>in</strong> 1996 and varied from 5-75 mg/l.Background levels <strong>of</strong> Nitrate are measured at between 5-10 mg/l; <strong>in</strong>creases are as aresult <strong>of</strong> pollution from fertiliser applications.The ma<strong>in</strong> issues perta<strong>in</strong><strong>in</strong>g to water use with<strong>in</strong> <strong>the</strong> Agriculture Sector are as follows:‣ General over-use <strong>of</strong> water brought about by prolonged periods <strong>of</strong> irrigation‣ Often unnecessary over-irrigation <strong>of</strong> crops‣ Irrigation us<strong>in</strong>g high sal<strong>in</strong>ity groundwater result<strong>in</strong>g <strong>in</strong> operational and crop growthproblems‣ Grow<strong>in</strong>g <strong>the</strong> right crops for <strong>the</strong> right water sal<strong>in</strong>ity conditions‣ Extensive use <strong>of</strong> fertilizers, sometimes applied <strong>in</strong> an improper manner, caus<strong>in</strong>gunnecessary pollution <strong>of</strong> groundwater‣ Extensive use <strong>of</strong> pesticides, sometimes applied <strong>in</strong> an improper manner, caus<strong>in</strong>gunnecessary pollution <strong>of</strong> groundwater‣ Often large water wastage on site caused by badly leak<strong>in</strong>g irrigation<strong>in</strong>frastructure, low quality plumb<strong>in</strong>g fitt<strong>in</strong>gs and fixtures, and poor ma<strong>in</strong>tenance <strong>of</strong><strong>the</strong> irrigation system‣ Irrigation dur<strong>in</strong>g appropriate times <strong>of</strong> <strong>the</strong> day, <strong>in</strong> order to reduce evaporationlosses.‣ Cont<strong>in</strong>ued sal<strong>in</strong>ization <strong>of</strong> soils through excessive use <strong>of</strong> sal<strong>in</strong>e / high brackishirrigation water15
‣ Corrosion <strong>of</strong> borehole and irrigation apparatus from sal<strong>in</strong>e and aggressivegroundwaters.‣ Potential pollution to groundwater from on-site ablutions and waste landfills‣ Lack <strong>of</strong> knowledge <strong>of</strong> water use – no means <strong>of</strong> measur<strong>in</strong>g water used.‣ Poor on site waste managementAs a consequence <strong>of</strong> <strong>the</strong> above, an awareness campaign to promote waterconservation and protection would be most successful if directed straight at farmowners, <strong>the</strong> farm labourers and also members <strong>of</strong> <strong>the</strong> various agriculture Depts. with<strong>in</strong><strong>the</strong> Emirates that are responsible for provid<strong>in</strong>g management advice to <strong>the</strong> citizensfarms e.g. agriculture extension eng<strong>in</strong>eers from <strong>the</strong> municipalities and <strong>the</strong> AgricultureDepartments.The messages required to be delivered <strong>in</strong> water conservation / protection awarenesscampaign should focus on <strong>the</strong> follow<strong>in</strong>g po<strong>in</strong>ts:‣ Avoid general waste <strong>of</strong> water. All groundwater has a price; it is not a freelyavailable commodity and is rapidly be<strong>in</strong>g depleted <strong>in</strong> both quantity and quality.This is <strong>the</strong> most important message to deliver to <strong>the</strong> farmers. It should bestressed to <strong>the</strong>m that <strong>the</strong>ir sector <strong>of</strong> activities uses twice as much water as allo<strong>the</strong>r users put toge<strong>the</strong>r. Incentives could be provided to encourage waterconservation e.g. spot cash awards provided to those farms which follow <strong>the</strong>guidel<strong>in</strong>es below.‣ All farmers should have a good knowledge <strong>of</strong> <strong>the</strong> sal<strong>in</strong>ity <strong>of</strong> <strong>the</strong> waters used forirrigation. <strong>Water</strong> quality should be checked at least twice a year.‣ Advice <strong>of</strong> extension eng<strong>in</strong>eers and o<strong>the</strong>r government advisory agencies shouldbe taken <strong>in</strong> order to ensure that <strong>the</strong> right crops are grown for <strong>the</strong> sal<strong>in</strong>ity <strong>of</strong>groundwater available. Should <strong>the</strong>re be a recorded change <strong>in</strong> sal<strong>in</strong>ity, fur<strong>the</strong>radvice should be sought‣ Irrigation should be affected dur<strong>in</strong>g <strong>the</strong> cooler times <strong>of</strong> day i.e. early morn<strong>in</strong>g,late even<strong>in</strong>g at all times if possible‣ In <strong>the</strong> case <strong>of</strong> brackish / sal<strong>in</strong>e groundwaters, which are commonly found, use <strong>of</strong>unprotected steel and o<strong>the</strong>r materials which are corrosive should be avoidedand replaced by plastics, fibre glass, sta<strong>in</strong>less steel and o<strong>the</strong>r non-corrosivematerials‣ Use <strong>of</strong> fertilizers and pesticides should be undertaken us<strong>in</strong>g <strong>the</strong> guidel<strong>in</strong>es <strong>in</strong>place.‣ Only approved Fertilizer should be used and must never be mixed <strong>in</strong> wells andboreholes. Mix<strong>in</strong>g should be undertaken at ground level and <strong>in</strong> a conta<strong>in</strong>edenvironment that prevents any contam<strong>in</strong>ation to groundwater‣ Only approved pesticides should be used and must be used accord<strong>in</strong>g to <strong>the</strong>guidel<strong>in</strong>es <strong>in</strong> place‣ All leaks <strong>of</strong> water from pipes, reservoirs etc must be fixed as soon as possibleafter <strong>the</strong>y have been discovered. Good quality plumb<strong>in</strong>g fitt<strong>in</strong>gs and fixturesshould be used and <strong>the</strong> irrigation systems need to be regularly <strong>in</strong>spected forleaks and a ma<strong>in</strong>tenance program put <strong>in</strong> place.‣ Ablutions should be l<strong>in</strong>ked to closed septic tanks and emptied <strong>in</strong> accordance tomunicipality requirements and standards‣ O<strong>the</strong>r waste generated on site should be properly stored and disposed <strong>of</strong>accord<strong>in</strong>g to municipality requirements and standards. Garbage should becollected <strong>in</strong> bags and regularly taken to municipal collection sites16
‣ Natural compost<strong>in</strong>g <strong>of</strong> waste organic material should be encouraged <strong>in</strong> order toproduce organic fertilizer which would help to reduce <strong>the</strong> amount <strong>of</strong> artificialfertilizer used.‣ Diesel and o<strong>the</strong>r hazardous material conta<strong>in</strong>ers should be kept away fromwellheads <strong>of</strong> boreholes and wells. Fuel systems should never leak and beallowed to pollute groundwaters.‣ All used fuels and oils should be disposed <strong>of</strong> <strong>in</strong> a proper manner and not buriedunderground where <strong>the</strong>y will ultimately cause groundwater pollution. Theyshould be collected <strong>in</strong> appropriate conta<strong>in</strong>ers and taken to municipality collectionpo<strong>in</strong>ts‣ Shallow aquifers with shallow water tables are very susceptible to groundwaterpollution. Pollutants can easily pollute groundwater if <strong>the</strong>re is direct access to it,for example, abandoned or dis-used wells and boreholes which are left open. Itis very important that <strong>the</strong>se be backfilled to ground level if <strong>the</strong>y are no longerused.‣ All fences around farms should be kept <strong>in</strong> good order and breakages repaired assoon as <strong>the</strong>y are found <strong>in</strong> order to prevent animals from trespass<strong>in</strong>g and caus<strong>in</strong>gon site pollution.‣ All animals should be kept away from wellheads <strong>in</strong> order to prevent pollution <strong>of</strong>boreholes.‣ Use <strong>of</strong> UREA, directly mixed with groundwater <strong>in</strong> <strong>the</strong> wells should be stopped.This causes direct nitrate pollution <strong>of</strong> aquifers. Use <strong>of</strong> alternative, organicfertilizers should be made.‣ Only modern, efficient irrigation application methods should be used. <strong>Water</strong>flood<strong>in</strong>g and unnecessary spray<strong>in</strong>g should be replaced with more efficientirrigation devices.The Municipality Agriculture Department manages 20 ma<strong>in</strong> projects with<strong>in</strong> both <strong>the</strong><strong>Western</strong> and Central <strong>Region</strong> <strong>of</strong> Abu Dhabi Emirate, irrigated by over 3,175 wells. Thetotal water consumption for groundwater is estimated at 219 Mm³/yr (table 4)17
Sl.No.<strong>Region</strong>AreaNumber<strong>of</strong> WellsAverageDepth(feet)Production/Well(G/h)OperationTime(h/day)TotalProduction(G/year)TotalProduction(Mm3/year)1 Bedaa Al aaried 134 300 5500 12 3228060000 14674760.762 Bedaa Radar 22 270 5500 12 529980000 2409289.083 Al Midour 113 240 5000 12 2474700000 11249986.24 Ghemisah 106 260 5000 12 2321400000 10553084.45 Bedaa Yamrah 183 300 5500 12 4408470000 20040904.626 Koroun Al Naam 87 250 5500 12 2095830000 9527643.187 Bedaa Rashed 18 200 4500 12 354780000 1612829.888 As Sila 8 200 4000 12 140160000 637167.369 Dams Al Faras and Arfaa 39 190 4500 12 768690000 3494464.7410 Bedaa Salab 9 200 4500 12 177390000 806414.9411 Wadi Al Rayoum 205 300 5500 12 4938450000 22450193.712 Bedaa Zaied 166 210 5000 12 3635400000 16526528.413 Liwa (East and west) 172 250 5000 12 3766800000 17123872.814 Ghyathi 82 220 5000 12 1795800000 8163706.815 Abu Hasa 210 220 4500 12 4139100000 18816348.616Bedaa Ghanem 207 140 2500 12 2266650000 10304190.9<strong>Western</strong> <strong>Region</strong>17 Al Khatem 106 130 2500 12 1160700000 5276542.218 Aghban 130 220 4000 12 2277600000 10353969.619 Al ashoush 339 500 5000 12 7424100000 33749958.620Eastern<strong>Region</strong>Al Namiraa 15 150 4000 12 262800000 1194688.8TOTAL 2351 48166860000 218966545.6Table 4 Abu Dhabi Municipality Agriculture Department Wellfield Developments
3.6 Forestry Development24% <strong>of</strong> all water used <strong>in</strong> <strong>the</strong> western region is for Forestry purposes. Figure 7 shows<strong>the</strong> current extent <strong>of</strong> Forestry <strong>in</strong> Abu Dhabi Emirate. At <strong>the</strong> end <strong>of</strong> 2002 <strong>the</strong> <strong>Western</strong>and Central <strong>Region</strong> <strong>in</strong>cluded 166 separate Forestry plantations cover<strong>in</strong>g a total area <strong>of</strong>204,400 ha. 2850 groundwater wells irrigate 40.8 million trees under <strong>the</strong> management<strong>of</strong> <strong>the</strong> Abu Dhabi Municipality Forestry Department.The objectives <strong>of</strong> <strong>the</strong> forests are to protect roads from sand <strong>in</strong>cursions, especially <strong>in</strong>areas <strong>of</strong> high dunes, provid<strong>in</strong>g protected areas for wildlife sanctuary and, morerecently, fix<strong>in</strong>g / demarcat<strong>in</strong>g UAE’s International Boundaries with its neighbours e.g.Saudi Arabia.The target <strong>of</strong> <strong>the</strong> Forestry Dept is to have a well distribution <strong>of</strong> one per 20-25 ha <strong>of</strong>irrigated Forestry; <strong>in</strong> reality, <strong>the</strong> density is much less at one per 70 ha. New wellconstructions are ongo<strong>in</strong>g; 221 new wells were drilled dur<strong>in</strong>g 2002 and a total <strong>of</strong> 1004completed over <strong>the</strong> last 5 years. Boreholes generally have uniform designs utilis<strong>in</strong>gmaximum screened portions <strong>of</strong> pvc cas<strong>in</strong>g. Wellfields are located <strong>in</strong> close proximity t<strong>of</strong>orests, with <strong>the</strong> exception <strong>of</strong> <strong>the</strong> coastal plantations which are established on sal<strong>in</strong>esabkha soils, <strong>in</strong>undated by sea-water, where brackish water is imported from distant,<strong>in</strong>land wellfields operated by Abu Dhabi Agriculture Department.Wells are equipped with ei<strong>the</strong>r electric submersible (typical yields 32-38 m³/hr) or dieselturb<strong>in</strong>e pumps (typical yield 12-20 m³/hr). All forestry plantations are irrigated us<strong>in</strong>gmostly brackish and sal<strong>in</strong>e groundwater; no desal<strong>in</strong>ated water is used and <strong>the</strong>re is noproposal to use it <strong>in</strong> <strong>the</strong> near future ei<strong>the</strong>r. Fresh groundwater is utilised for irrigat<strong>in</strong>g<strong>the</strong> plantations between Liwa and Beda Zayed.Details <strong>of</strong> all forestry plantations and <strong>the</strong>ir respective well depths and water qualitiesare <strong>in</strong>cluded <strong>in</strong> Appendix A and <strong>in</strong>formation is summarised <strong>in</strong> Table 5 below.Table 5 Summary <strong>of</strong> Forestry Areas and well <strong>in</strong>formation<strong>Region</strong> No. Wells Well Depth Range (m) Groundwater Sal<strong>in</strong>ity Range (mg/l)Mad<strong>in</strong>at Zayed 500 12-91 1500-18,000Liwa* 143 15-91 800-13,000Ghayahthi 392 13-46 4,000-15,000Al Wathbah 1817 9-61 3,500-51,000* Liwa falls <strong>in</strong> <strong>the</strong> Mad<strong>in</strong>at Zayed Forest Adm<strong>in</strong>istration <strong>Region</strong>
.Legend0 25 50 100KmAbuDhabi<strong>Region</strong>sForestsFigure 7 Location <strong>of</strong> Forestry Development <strong>in</strong> <strong>the</strong> <strong>Western</strong> <strong>Region</strong>The majority <strong>of</strong> <strong>the</strong> forests show evidence <strong>of</strong> under-irrigation. The water requirements<strong>of</strong> wholly irrigated forest trees <strong>in</strong> extreme arid zone conditions is very poorly researchedand will depend on <strong>the</strong> age <strong>of</strong> <strong>the</strong> tree and/or <strong>the</strong> extent <strong>of</strong> canopy it has grown (groundcover) or is required to grow. Under-irrigation will lead to <strong>the</strong> development <strong>of</strong> reducedcanopies: no forests have been observed which have a full canopy, which <strong>in</strong>dicatesthat <strong>the</strong>y are young stands or that <strong>the</strong>y have been under-irrigated and <strong>the</strong>ir growthrestricted.Estimates were made for <strong>in</strong>dividual tree consumption <strong>in</strong> 1988 (Sir M. MacDonald andPartners. Govt. <strong>of</strong> Abu Dhabi Inter Connection <strong>of</strong> <strong>Water</strong> Distribution Grid <strong>in</strong> RemoteAreas with Abu Dhabi <strong>Water</strong> Grid.) These are as shown <strong>in</strong> Table 6.20
Table 6: <strong>Water</strong> requirements for various vegetation typesVegetation type Allowance MeanrequirementGreen, amenity areas 2-4.2 gall/sqm/day = 9-18.9mm/ha/dayDate palms Young 10-15gall/day/treeMature 15-20gall/tree/dayForest trees 4-8gall/tree/dayFodder and vegetables2-4-2 gall/sqm/day= 9-18.9mm/ha/day13.95mm/day17.5gall/tree/dayassumedwith 156trees/ha =1.2mm/ha/dayAssume 200trees/ha at 6gall/dayaverage =0.54 mm/day13.95mm/dayAnnual Commentrequirementmm/yr5110 Probably highestimate4550 probably verylow estimate(NB Saudiresearchsuggestsmean4mm/day Et =14,600 cum/ha/year)197-210[assume a 400-800mm futurerequirementunder improvedirrigationregime ]5500 fodder1150-3850vegetablesIndicative <strong>of</strong>current underirrigation;maybeenough forvery slowgrowthIn 1989 Atk<strong>in</strong>s (Comprehensive <strong>Region</strong>al Development Plan <strong>of</strong> Abu Dhabi) estimatedthat drip irrigated forests should receive 4000 m 3 /ha/year (approx. 12 gall/tree/day).Irrigation is not monitored but <strong>the</strong>re is a rough target <strong>of</strong> 5-8 gall/tree/day. In practice<strong>the</strong> Abu Dhabi Forestry department <strong>in</strong>dicated that 4 gall/day was more likely due toacute shortages <strong>of</strong> water. [At 200 trees/ha this equates to 0.36 mm/ha/day while <strong>the</strong>desired 8 gall/day would equate to 0.72 mm/day.] However <strong>the</strong>y have no way <strong>of</strong>measur<strong>in</strong>g <strong>the</strong>se desired or presumed volumes. HRH Private Department <strong>in</strong> AbuDhabi <strong>in</strong>dicated that 2.5 gall/day were required per 1.5 sq m <strong>of</strong> canopy; for a forest with20% cover this would equate to 2.25 mm/day. In <strong>the</strong> water use estimates we haveused a uniform application rate <strong>of</strong> 5.45 m³/ha/day (0.54mm/day) for <strong>the</strong> total 204,000ha <strong>of</strong> plantations which gives an annual water use <strong>of</strong> 407 Mm³. This represents 13% <strong>of</strong><strong>the</strong> total water used <strong>in</strong> Abu Dhabi Emirate <strong>in</strong> 2002.3.7 Amenity <strong>Water</strong> Supply8.6% <strong>of</strong> all water used <strong>in</strong> <strong>the</strong> western region is for amenity purposes. Amenity plant<strong>in</strong>gs<strong>in</strong>clude parks, gardens, road side verges and recreation areas such as football pitchesand golf courses, appear to receive near optimum amounts <strong>of</strong> irrigation water which islargely treated sewage effluent (TSE) <strong>of</strong> a consistent quality. Data on actual water usefor amenity plant<strong>in</strong>g is not currently available and <strong>in</strong> <strong>the</strong> <strong>Western</strong> <strong>Region</strong>, it appears21
that <strong>the</strong> Abu Dhabi Municipality Parks & Gardens Dept does not measure <strong>in</strong> any way<strong>the</strong>ir water use for amenity plant<strong>in</strong>g.Accord<strong>in</strong>g to <strong>the</strong> Abu Dhabi Plann<strong>in</strong>g Department 2002 statistics bullet<strong>in</strong>, 586 donum(58.6 ha) <strong>of</strong> parks and gardens amenities exist <strong>in</strong> <strong>the</strong> <strong>Western</strong> <strong>Region</strong>, 90% public and<strong>the</strong> rema<strong>in</strong><strong>in</strong>g 10% restricted to children and ladies. Amenity plantation irrigation rateshave been calculated from <strong>the</strong> ERWDA study on <strong>the</strong> water situation <strong>in</strong> <strong>the</strong> Eastern andCentral <strong>Region</strong>s <strong>of</strong> Abu Dhabi (Mott Macdonald, 2004). <strong>Water</strong> used for irrigation hasbeen assumed to be applied at a rate <strong>of</strong> 0.03 Mm³/ha/yr.3.8 Industrial <strong>Water</strong> UseIndustrial demands <strong>in</strong> <strong>the</strong> <strong>Western</strong> <strong>Region</strong> are small and restricted mostly to <strong>the</strong> 18group companies that comprise <strong>the</strong> Abu Dhabi National Oil Company (ADNOC).ADNOC <strong>in</strong>dustrial practices are located both on and <strong>of</strong>f-shore. Off-shore facilities for<strong>the</strong> oil and gas sector are located on several small Islands and <strong>in</strong>stallation platformswith <strong>in</strong>dependent desal<strong>in</strong>ation water supplies. By far <strong>the</strong> largest demands are locatedon-shore, mostly at <strong>the</strong> self conta<strong>in</strong>ed Industrial Complex at Ruwais which was<strong>in</strong>augurated <strong>in</strong> 1982 with <strong>the</strong> commission<strong>in</strong>g <strong>of</strong> <strong>the</strong> ADNOC oil ref<strong>in</strong>ery.The Ruwais Industrial and hous<strong>in</strong>g zone was established to develop <strong>in</strong>dustries andprocess<strong>in</strong>g plants at <strong>the</strong> downstream side <strong>of</strong> <strong>the</strong> oil and gas <strong>in</strong>dustry. The complex,which is part <strong>of</strong> <strong>the</strong> Industrial Development plan <strong>of</strong> Abu Dhabi, overseen by <strong>the</strong>Industrial Areas Supervision Committee, comprises <strong>the</strong> follow<strong>in</strong>g facilities:• Oil Ref<strong>in</strong>ery (TAKREER)• Natural gas liquids fractionation plant (GASCO)• Fertilizer Plant (FERTIL)• Petro-chemical (polyethylene) plant• Mar<strong>in</strong>e term<strong>in</strong>al• Sulphur handl<strong>in</strong>g term<strong>in</strong>al• Un-leaded gasol<strong>in</strong>e plantA large hous<strong>in</strong>g complex at Al Ruwais comprises more than 1300 units and housesabout 20% <strong>of</strong> <strong>the</strong> total population which <strong>in</strong>habits <strong>the</strong> <strong>Western</strong> <strong>Region</strong>. The hous<strong>in</strong>gcomplex consumes 1.4 Million m³/yr <strong>of</strong> water (57% Treated Effluent, 43% potable).Table 7 provides a summary <strong>of</strong> <strong>the</strong> water consumption and water sources for <strong>the</strong>various ADNOC group companies. <strong>Water</strong> sources for <strong>the</strong> various <strong>in</strong>dustrial userscomprise desal<strong>in</strong>ated sea and groundwater, untreated groundwater, raw sea-water andtreated effluent. Produced water <strong>in</strong>cludes formation water brought to surface with oil &gas exploration activities and also br<strong>in</strong>e reject water from desal<strong>in</strong>ation processes. For<strong>the</strong> western region, ADNOC Group Industries consume a total <strong>of</strong> 1,3 billion m³/yr <strong>of</strong>water from <strong>the</strong> above sources; raw sea-water constitutes 92% <strong>of</strong> <strong>the</strong> total, producedwater 5.5%, desal<strong>in</strong>ated water 2.4% and <strong>the</strong> rema<strong>in</strong>der from shallow groundwater andtreated effluent.22
Most <strong>of</strong> <strong>the</strong> total water used is for cool<strong>in</strong>g and utilises sea-water. Potable wateramounts to 2% <strong>of</strong> <strong>the</strong> total. Oil produced water is generally treated <strong>in</strong> order to reduce<strong>the</strong> oil <strong>in</strong> water content before it is <strong>in</strong>jected <strong>in</strong>to deep wells which penetrate <strong>the</strong>carbonate Um Er Radhuma Aquifer. Table 8 below provides details <strong>of</strong> oil producedwater which is re-<strong>in</strong>jected back <strong>in</strong>to deep aquifers by <strong>the</strong> ADCO operations.Table 8 ADCO production water re-<strong>in</strong>jectionOil Field 2002 re-<strong>in</strong>jection 2003 re-<strong>in</strong>jectionAsab 5100 6370Bab 2400 2400Buhasa 7000 3185Sahil 160 320Shah 160 320TOTAL (Mm³/yr) 5.41 4.6Values <strong>in</strong> cubic meters per dayAt present, no down hole oil-water separation takes place <strong>in</strong> <strong>the</strong> oil recovery process.By leav<strong>in</strong>g <strong>the</strong> oil polluted waters <strong>in</strong> <strong>the</strong> host oil reservoirs, <strong>the</strong> potential for pollution <strong>of</strong>o<strong>the</strong>r aquifers is elim<strong>in</strong>ated and <strong>the</strong> need for re-<strong>in</strong>jection <strong>in</strong>to o<strong>the</strong>r useable aquifersdisappears. Technology for oil-water separation at source does exist and is be<strong>in</strong>gtested <strong>in</strong> o<strong>the</strong>r GCC states e.g. Oman, and ADNOC should be encouraged to follow <strong>the</strong>same path s<strong>in</strong>ce <strong>the</strong> amount <strong>of</strong> oil produced water, although small <strong>in</strong> relation to thatfound <strong>in</strong> Oman for example, is still significant <strong>in</strong> terms <strong>of</strong> its contribution to pollut<strong>in</strong>go<strong>the</strong>r aquifers e.g. Um Er Radhuma.23
Desal<strong>in</strong>ated Desal<strong>in</strong>ated Treated Seawater Shallow o<strong>the</strong>r TotalCOMPANY / ENTITYIndustry potable Effluent Groundwater (oil produced water etc)Ruwais Hous<strong>in</strong>g Complex 614,657 not specified 816,608 1,431,265Ruwais Fertilizer Industries (FERTIL) 7,650 929,950 223,273,000 224,210,600Abu Dhabi Mar<strong>in</strong>e Operat<strong>in</strong>g Co.(ADMA OPCO) 768,370 57,443,809 58,212,179Abu Dhabi Oil Ref<strong>in</strong><strong>in</strong>g Co. (TAKREER) 2 505,452,000 505,452,002ADNOC DISTRIBUTION 100 100Abu Dhabi Gas Industries Ltd (GASCO) 823,440 795,700 344,560 219,000,000 220,963,700ESNAAD 255,234 25,943 281,177TOTAL ABK 22,400,000 5,332,000 5,716,000 33,448,000ZAKUM Dvelopment Co. 237,300 3,000,000 3,237,300Abu Dhabi Polymers Co Ltd (Borouge) 875,490 461,658 267,296,858 353,300 268,987,306Abu Dhabi Co. for Onshore Oil Operations (ADCO) 4,440,522 3,204,262 3,605,382 11,250,166Bunduq Company Ltd 70,000 4,833,403 1,392,577 6,295,980TOTAL 3,582,241 29,123,775 1,161,168 1,225,187,261 3,204,262 71,511,068 1,333,769,775values <strong>in</strong> cubic metersTable 7 Summary <strong>of</strong> ADNOC group company annual water consumption (2002)
4. GIS DATABASE DEVELOPMENT & POPULATIONAs part <strong>of</strong> a consultancy study for ERWDA on <strong>the</strong> assessment <strong>of</strong> <strong>the</strong> water situation <strong>of</strong><strong>the</strong> eastern and central regions <strong>of</strong> Abu Dhabi (Mott Macdonald, 2004), a GISgroundwater database has been developed and partially populated with data from <strong>the</strong>respective regions. The database has an <strong>in</strong>tegral water supply-demand model whichwill allow <strong>the</strong> prediction <strong>of</strong> water supply – demand balances for any chosen area with<strong>in</strong>Abu Dhabi Emirate.The structure <strong>of</strong> <strong>the</strong> database is shown below <strong>in</strong> Figure 8 below.Figure 8Structure <strong>of</strong> <strong>the</strong> <strong>Water</strong> Resources GIS DatabaseThe database has been <strong>in</strong>stalled on <strong>the</strong> ERWDA server and is an <strong>in</strong>tegral part <strong>of</strong> <strong>the</strong>ERWDA Environmental Database.. Data entry and general population <strong>of</strong> data has notyet commenced for <strong>the</strong> <strong>Western</strong> <strong>Region</strong>. The first stage is to compile <strong>the</strong> data for <strong>the</strong>various agency sources and verify it. Data entry shall commence <strong>in</strong> <strong>the</strong> second quarter<strong>of</strong> 2004 and water supply and demand balances will be predicted up to <strong>the</strong> year 2020.Figure 9 shows <strong>the</strong> structure <strong>of</strong> <strong>the</strong> database supply and demand model <strong>in</strong>puts withl<strong>in</strong>kages.
Figure 9 Supply – Demand conceptStructure <strong>of</strong> Supply/Demand ModelDemandGroupDemandCentreScenarioL<strong>in</strong>ksSupply GroupSupplySourceSettlementDWSSWWells,WellfieldsIndustryAmenityForestryAgricultureDemand Data andDemand Constra<strong>in</strong>tsDISDSettlementDASTDFSIDAGDesal<strong>in</strong>ationTSEImportSupply Data andSupply Constra<strong>in</strong>ts<strong>Water</strong> <strong>Assessment</strong> Unit areas(WAUA) have already been fixed for <strong>the</strong> Eastern andCentral regions; WAUA need to be confirmed for <strong>the</strong> <strong>Western</strong> region and will probablycomprise <strong>of</strong> <strong>the</strong> follow<strong>in</strong>g :1) <strong>Western</strong> <strong>Region</strong> subarea 1 - Coastal belt and Islands2) <strong>Western</strong> <strong>Region</strong> subarea 2 - Mad<strong>in</strong>at Zayed3) <strong>Western</strong> <strong>Region</strong> subarea 3 - Liwa4) <strong>Western</strong> <strong>Region</strong> subarea 4 – GhayathiWAUA’s will be confimed after verification <strong>of</strong> all water source and water use data and<strong>in</strong>formation.Demand & Supply Sources:‣ The physical size <strong>of</strong> demand centres and supply sources specified <strong>in</strong> <strong>the</strong>supply/demand model are user def<strong>in</strong>ed. Individual demand centres and supplysources may be specified or <strong>the</strong> user may aggregate supply and demandelements as demand or supply groups.26
‣ In a supply group or demand group, two different types <strong>of</strong> supplies (e.g. TSEand desal<strong>in</strong>ated water) or demands cannot be mixed. In this way, waters aredistributed accord<strong>in</strong>g to standards <strong>of</strong> quality required for each specific useDemands:‣ <strong>Water</strong> supply demand is derived from population and per-capita daily grosswater demand. The 2001 Abu Dhabi population census is used as <strong>the</strong> basis for<strong>the</strong> population projections, and updates are taken from <strong>the</strong> Abu Dhabi Plann<strong>in</strong>gDepartment annual population statistics.‣ Amenity water supply demand is determ<strong>in</strong>ed from irrigated area and vegetationwater demand‣ Forest water demand is derived from net forest area and gross irrigation water.Landsat imagery is used to determ<strong>in</strong>e gross areas.‣ Farm water demand is derived from net farm area and gross irrigation waterrequirement. Landsat imagery is used to determ<strong>in</strong>e gross areas.‣ Each demand centre may be l<strong>in</strong>ked to a number <strong>of</strong> supply sources.‣ Demand from human settlements must be satisfied from potable sources.‣ Crop, forest and amenity demand is estimated <strong>in</strong> <strong>the</strong> SDM us<strong>in</strong>g Global Sett<strong>in</strong>gsfor crop water use, cropp<strong>in</strong>g-plant<strong>in</strong>g patterns and irrigation efficiency.Sources:‣ For sources, an output capacity is specified, while constra<strong>in</strong>t factors may limitthis capacity. Constra<strong>in</strong>ts may not directly relate to <strong>the</strong> source but may relate to<strong>the</strong> l<strong>in</strong>ks between sources and demand centres (such as conveyance pipel<strong>in</strong>ecapacity and <strong>in</strong>termediate storage capacity). The user can specify both real andvirtual (future unbuilt) l<strong>in</strong>ks.‣ Individual supply sources may be l<strong>in</strong>ked to more than one demand centre.‣ Sewage effluent source (TSE) use is restricted; TSE can only supply demand foramenity plant<strong>in</strong>g irrigation and no o<strong>the</strong>r use;‣ TSE output cannot exceed works treatment capacity; for <strong>in</strong>dividual sewageplants‣ Groundwater source output cannot exceed well pump capacity and is reducedl<strong>in</strong>early with falls <strong>in</strong> well water levels.‣ Except for TSE sources, no restriction applied to sources meet<strong>in</strong>g demand fromfarms and forests.‣ For desal<strong>in</strong>ation plants, output set at 90% <strong>of</strong> plant Design Capacity. Plant outputis varied accord<strong>in</strong>g to feed sal<strong>in</strong>ity.27
5. WORK PROPOSED FOR FINAL STAGE OF PREPARATION FORDEVELOPING A WATER RESOURCES MANAGEMENT STRATEGYOver <strong>the</strong> course <strong>of</strong> <strong>the</strong> next 6 months, <strong>the</strong> follow<strong>in</strong>g tasks are identified <strong>in</strong> order tocomplete <strong>the</strong> basel<strong>in</strong>e survey for <strong>Water</strong> Resources to enable preparations for a <strong>Water</strong>Resources Management Strategy to beg<strong>in</strong>:• Completion <strong>of</strong> population <strong>of</strong> <strong>the</strong> GIS <strong>Water</strong> Resources Database with supply andDemand data for all regions <strong>of</strong> Abu Dhabi: Eastern, Central and <strong>Western</strong>• Completion <strong>of</strong> water balances for supply and demands for <strong>the</strong> whole Emirate upto <strong>the</strong> year 2020• Mapp<strong>in</strong>g <strong>of</strong> all <strong>Water</strong> Resources sources and users <strong>in</strong> <strong>the</strong> Emirate <strong>of</strong> Abu Dhabi(def<strong>in</strong>itive set <strong>of</strong> GIS layers which will comb<strong>in</strong>e <strong>the</strong> results <strong>of</strong> surveys for allregions <strong>of</strong> <strong>the</strong> Emirate.• Preparation <strong>of</strong> a F<strong>in</strong>al Report def<strong>in</strong><strong>in</strong>g <strong>the</strong> <strong>Water</strong> <strong>Situation</strong> <strong>of</strong> <strong>the</strong> Emirate <strong>of</strong> AbuDhabi• A review <strong>of</strong> all <strong>the</strong> options available <strong>in</strong> water resources management and ananalysis <strong>of</strong> various scenarios for future implementation• Preparation <strong>of</strong> a draft <strong>Water</strong> Policy document which will discuss <strong>the</strong> ma<strong>in</strong> issuesand problems associated with <strong>the</strong> overall study <strong>of</strong> <strong>the</strong> water resources situation<strong>in</strong> <strong>the</strong> Emirate• Determ<strong>in</strong>ation <strong>of</strong> <strong>the</strong> Groundwater Resources <strong>of</strong> Abu Dhabi Emirate with respectto different water qualities• The hold<strong>in</strong>g <strong>of</strong> a workshop with all <strong>of</strong> ERWDA’s partners to discuss and f<strong>in</strong>alise<strong>the</strong> draft water policy document• Recommendations <strong>of</strong> new projects and o<strong>the</strong>r work related activities which arerequired to fur<strong>the</strong>r <strong>Water</strong> Resources Management <strong>in</strong> <strong>the</strong> Emirate <strong>of</strong> Abu Dhabie.g. Undertak<strong>in</strong>g a National well <strong>in</strong>ventory and well permitt<strong>in</strong>g and registrationprocedures, establish<strong>in</strong>g a national water resources monitor<strong>in</strong>g system etc.28
6. REFERENCESADNOC News bullet<strong>in</strong>, No. 10, Oct 2003ERWDA, 2003. <strong>Assessment</strong> <strong>of</strong> <strong>the</strong> <strong>Water</strong> <strong>Situation</strong> <strong>in</strong> <strong>the</strong> <strong>Western</strong> <strong>Region</strong> <strong>of</strong>Abu Dhabi Emirate. Inception Report, June 2003.ERWDA, 2004. <strong>Water</strong> Resources Statistics Bullet<strong>in</strong> for Abu Dhabi Emirate, 2002.Mott Macdonald, 2004Prelim<strong>in</strong>ary <strong>Assessment</strong> <strong>of</strong> <strong>the</strong> <strong>Water</strong> <strong>Situation</strong> <strong>in</strong> <strong>the</strong>Eastern and Central <strong>Region</strong>s <strong>of</strong> Abu Dhabi EmirateNDC/USGS, 1997 <strong>Water</strong> Quality Changes <strong>in</strong> <strong>the</strong> Liwa Crescent Area. 1991-1996USGS/NDC, 1996 Groundwater Resources <strong>of</strong> Abu Dhabi Emirate
APPENDIX AWESTERN REGIONFORESTRY DETAILS30