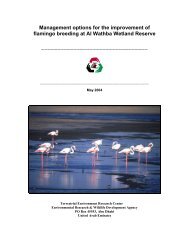
Assessment of the Water Situation in the Western Region
Assessment of the Water Situation in the Western Region
Assessment of the Water Situation in the Western Region

Create successful ePaper yourself
Turn your PDF publications into a flip-book with our unique Google optimized e-Paper software.
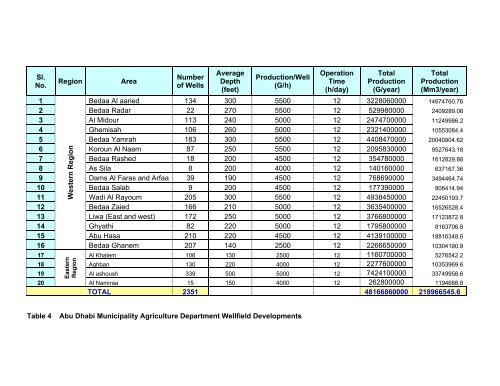
Sl.No.<strong>Region</strong>AreaNumber<strong>of</strong> WellsAverageDepth(feet)Production/Well(G/h)OperationTime(h/day)TotalProduction(G/year)TotalProduction(Mm3/year)1 Bedaa Al aaried 134 300 5500 12 3228060000 14674760.762 Bedaa Radar 22 270 5500 12 529980000 2409289.083 Al Midour 113 240 5000 12 2474700000 11249986.24 Ghemisah 106 260 5000 12 2321400000 10553084.45 Bedaa Yamrah 183 300 5500 12 4408470000 20040904.626 Koroun Al Naam 87 250 5500 12 2095830000 9527643.187 Bedaa Rashed 18 200 4500 12 354780000 1612829.888 As Sila 8 200 4000 12 140160000 637167.369 Dams Al Faras and Arfaa 39 190 4500 12 768690000 3494464.7410 Bedaa Salab 9 200 4500 12 177390000 806414.9411 Wadi Al Rayoum 205 300 5500 12 4938450000 22450193.712 Bedaa Zaied 166 210 5000 12 3635400000 16526528.413 Liwa (East and west) 172 250 5000 12 3766800000 17123872.814 Ghyathi 82 220 5000 12 1795800000 8163706.815 Abu Hasa 210 220 4500 12 4139100000 18816348.616Bedaa Ghanem 207 140 2500 12 2266650000 10304190.9<strong>Western</strong> <strong>Region</strong>17 Al Khatem 106 130 2500 12 1160700000 5276542.218 Aghban 130 220 4000 12 2277600000 10353969.619 Al ashoush 339 500 5000 12 7424100000 33749958.620Eastern<strong>Region</strong>Al Namiraa 15 150 4000 12 262800000 1194688.8TOTAL 2351 48166860000 218966545.6Table 4 Abu Dhabi Municipality Agriculture Department Wellfield Developments