Assessment of the Water Situation in the Western Region
Assessment of the Water Situation in the Western Region
Assessment of the Water Situation in the Western Region

You also want an ePaper? Increase the reach of your titles
YUMPU automatically turns print PDFs into web optimized ePapers that Google loves.
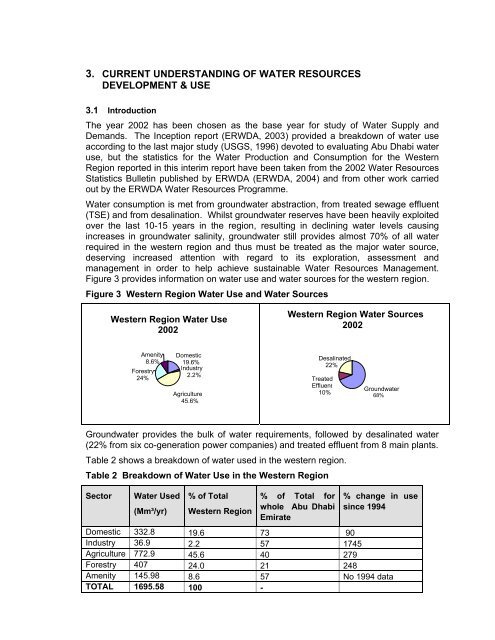
3. CURRENT UNDERSTANDING OF WATER RESOURCESDEVELOPMENT & USE3.1 IntroductionThe year 2002 has been chosen as <strong>the</strong> base year for study <strong>of</strong> <strong>Water</strong> Supply andDemands. The Inception report (ERWDA, 2003) provided a breakdown <strong>of</strong> water useaccord<strong>in</strong>g to <strong>the</strong> last major study (USGS, 1996) devoted to evaluat<strong>in</strong>g Abu Dhabi wateruse, but <strong>the</strong> statistics for <strong>the</strong> <strong>Water</strong> Production and Consumption for <strong>the</strong> <strong>Western</strong><strong>Region</strong> reported <strong>in</strong> this <strong>in</strong>terim report have been taken from <strong>the</strong> 2002 <strong>Water</strong> ResourcesStatistics Bullet<strong>in</strong> published by ERWDA (ERWDA, 2004) and from o<strong>the</strong>r work carriedout by <strong>the</strong> ERWDA <strong>Water</strong> Resources Programme.<strong>Water</strong> consumption is met from groundwater abstraction, from treated sewage effluent(TSE) and from desal<strong>in</strong>ation. Whilst groundwater reserves have been heavily exploitedover <strong>the</strong> last 10-15 years <strong>in</strong> <strong>the</strong> region, result<strong>in</strong>g <strong>in</strong> decl<strong>in</strong><strong>in</strong>g water levels caus<strong>in</strong>g<strong>in</strong>creases <strong>in</strong> groundwater sal<strong>in</strong>ity, groundwater still provides almost 70% <strong>of</strong> all waterrequired <strong>in</strong> <strong>the</strong> western region and thus must be treated as <strong>the</strong> major water source,deserv<strong>in</strong>g <strong>in</strong>creased attention with regard to its exploration, assessment andmanagement <strong>in</strong> order to help achieve susta<strong>in</strong>able <strong>Water</strong> Resources Management.Figure 3 provides <strong>in</strong>formation on water use and water sources for <strong>the</strong> western region.Figure 3 <strong>Western</strong> <strong>Region</strong> <strong>Water</strong> Use and <strong>Water</strong> Sources<strong>Western</strong> <strong>Region</strong> <strong>Water</strong> Use2002<strong>Western</strong> <strong>Region</strong> <strong>Water</strong> Sources2002Amenity8.6%Forestry24%Domestic19.6%Industry2.2%Agriculture45.6%Desal<strong>in</strong>ated22%TreatedEffluent10%Groundwater68%Groundwater provides <strong>the</strong> bulk <strong>of</strong> water requirements, followed by desal<strong>in</strong>ated water(22% from six co-generation power companies) and treated effluent from 8 ma<strong>in</strong> plants.Table 2 shows a breakdown <strong>of</strong> water used <strong>in</strong> <strong>the</strong> western region.Table 2 Breakdown <strong>of</strong> <strong>Water</strong> Use <strong>in</strong> <strong>the</strong> <strong>Western</strong> <strong>Region</strong>Sector<strong>Water</strong> Used(Mm³/yr)% <strong>of</strong> Total<strong>Western</strong> <strong>Region</strong>% <strong>of</strong> Total forwhole Abu DhabiEmirate% change <strong>in</strong> uses<strong>in</strong>ce 1994Domestic 332.8 19.6 73 90Industry 36.9 2.2 57 1745Agriculture 772.9 45.6 40 279Forestry 407 24.0 21 248Amenity 145.98 8.6 57 No 1994 dataTOTAL 1695.58 100 -