

The Ecology of Mugu Lagoon, California - USGS National Wetlands ...
The Ecology of Mugu Lagoon, California - USGS National Wetlands ...
The Ecology of Mugu Lagoon, California - USGS National Wetlands ...
- No tags were found...

You also want an ePaper? Increase the reach of your titles
YUMPU automatically turns print PDFs into web optimized ePapers that Google loves.
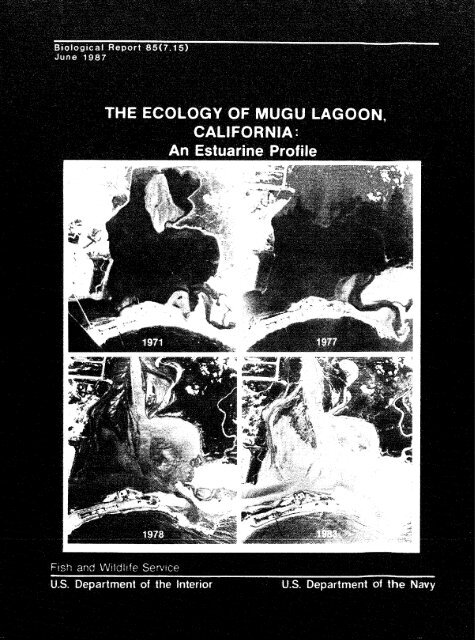
Cover photos:Changes due to sedimentation in the central basin <strong>of</strong> <strong>Mugu</strong> igoon frni.ri 1971to 1983.
Biological Report 85(7.15)June 1987THE ECOLOGY OF MUGU LAGOOM, CALIFORNIA:AN ESTUARINE PROFILEChristopher P. OnufMarine Science InstituteUniversity <strong>of</strong> <strong>California</strong>Santa Barbara, CA 93106Project OfficerEdward C. Pendleton<strong>National</strong> <strong>Wetlands</strong> Research CenterU.S. Fish and Wildlife Service1010 Gause BoulevardSl idell, LA 70458Performed forU.S. Department <strong>of</strong> the InteriorFi sh and Wi 1 dl i fe ServiceResearch and Development<strong>National</strong> <strong>Wetlands</strong> Research CenterWashington, DC 20240
<strong>The</strong> mention <strong>of</strong> commercial product tradenames in this report does not constituteendorsement or recmmndation for use by the Fish and Wildlife Service, U.S. Department<strong>of</strong> the Interior.Onuf, Christopher P.<strong>The</strong> ecology <strong>of</strong> <strong>Mugu</strong> <strong>Lagoon</strong>, <strong>California</strong>.(Biological report ; 85 (7.15) 1"June 1987. "Bibliography: p.Supt. <strong>of</strong> Docs. no.: I 49.89/2:85(7.15)1. Estuarine ecol ogy--Cal i fornia--<strong>Mugu</strong> <strong>Lagoon</strong>.2. <strong>Lagoon</strong> ecol ogy--Ca7 ifornia--<strong>Mugu</strong> <strong>Lagoon</strong>.I. Pendleton, Edward C. 11, <strong>National</strong> <strong>Wetlands</strong> ResearchCenter (U.S.) 111. Series: Biological report(Washington, D.C.) ; 85-7.15.This report may be cited as:Onuf, C,P, 1987, <strong>The</strong> ecology <strong>of</strong> lvlugu <strong>Lagoon</strong>, Cal ifornia: an estuarine pr<strong>of</strong>ile. U,S.fish Wildl, Serv. Biol. Rep. 85(7,15), 122 pp.
PREFACE<strong>Mugu</strong> <strong>Lagoon</strong> is a tiny estuary. Xn anyother coastal region <strong>of</strong> the UnitedStates, it would have attracted littleatten tion, However, among the protectedshallow-water embayments <strong>of</strong> the arid andsteep Pacific Southwest, <strong>Mugu</strong> <strong>Lagoon</strong> islarge, important, and relatively fi ttledisturbed (because <strong>of</strong> protection by theU.S. Navy for more than 40 years). Consequently,the lagoon has received considerableattention over the last 20years, including intensive research onaspects <strong>of</strong> its geology and biology.Over this satne period, an awarenessgrew <strong>of</strong> how meager and in what jeopardywere the remaining estuarine resources <strong>of</strong>the region. With this growing awareness<strong>of</strong> the need to protect, manage, and enhancethe remnants, the need to understandthe functioning <strong>of</strong> these ecosystemsbecame apparent. Accordingly, the endowment<strong>of</strong> scientific information on <strong>Mugu</strong><strong>Lagoon</strong> became valuable for management.This report is a synthesis <strong>of</strong> informationon <strong>Mugu</strong> <strong>Lagoon</strong>, supplemented byother sources as necessary to provide anintegrated treatment <strong>of</strong> ecosystem structureand function (Chapters 1-5).Although the analysis is most directlyrelevant to <strong>Mugu</strong> <strong>Lagoon</strong>, the rationalefor imch <strong>of</strong> the research and especiallyfor this synthesis was that the characterization<strong>of</strong> this relatively heal thysystem would serve as a model and yardstickfor application to other, usuallymore highly modified coastal wetland ecosystemsin the region. Comparisons betweenthe we1 1 -functioning standard andother systems <strong>of</strong> concern should revealma1 function and suggest remedies (Chapter6) =Unfortunately, events <strong>of</strong> the lastdecade have a1 tered the "health"and little-disturbed state <strong>of</strong> the <strong>Mugu</strong><strong>Lagoon</strong> ecosystem, Sedimentation caused bymajor storms virtual ly el iminated thelargest open-water area <strong>of</strong> the lagoon andcompletely a1 tered the bottom characteristics<strong>of</strong> another major section <strong>of</strong> thelagoon. Protection <strong>of</strong> the lagoon, itsfringing marshes, and adjacent uplandswere ineffectual in shielding the systemfrom inputs originating in the fartherreaches <strong>of</strong> the watershed.This report chronicles how the impacts<strong>of</strong> those a1 terations ramified through theestuarine ecosystem. In retrospect, thiscase history <strong>of</strong> startling and pr<strong>of</strong>oundalterations occurring so suddenly may bemore instructive for management <strong>of</strong> theregion's embayments and their associatedwetlands than the original objective <strong>of</strong>using <strong>Mugu</strong> <strong>Lagoon</strong> as the "pristine" standardfor guiding management. Chapter 7presents some <strong>of</strong> these management considerations.<strong>The</strong> infonnation base for this synthesisis weak in some topical areas where thatfor the companion report in this series,"<strong>The</strong> <strong>Ecology</strong> <strong>of</strong> Tijuana Estuary: AnEstuarine Pr<strong>of</strong>ile" by Joy Zedfer, isstrong. Reference to that source is encouraged,particularly regarding the anal -ysis <strong>of</strong> factors influencing primary productivity and salt marsh community structure.Comments concerning or requests for thispub1 ication should be addressed to:Information Transfer Specialist<strong>National</strong> <strong>Wetlands</strong> Research CenterU.S. Fish and Wildlife ServiceNASA-Sl idel 1 Computer Complex1010 Gause BoulevardS'l idel 1, U1 70458.
CONVEWSBQSIU TABLEMetric to U. S.CustomaryMultiplymillimeters (mm)centimeters (cm)meters (m)meters (m)ki lometers (km)kilometers (km)5 To Obtain0.03937 inches0.3937 i nches3.281 feet0.5468 fathoms0.6214 statute mi les0.5396 nautical mi lessquare meters (m2) 10.76square kilometers ( k1n2) 0.3861hectares (ha) 2.471square feetsquare milesacresliters (1)cubic meters (m3)cubic meters (m")mi 1 l i grams (mg)grams (g)ki 1 ograms (kg)metric tons (t)metric tons (t)kilocalories (kcal)Cel s i us degrees (OC)0.2642 gal lons35.31 cubic feet0.0008110 acre- feet0.00003521 ounces0.03527 ounces2.205 pounds2205.0 pounds1.102 short tons3.968 British thermal units1.8(0~) + 32 Fahrenheit degreesU. S. Customary to Metricinches 25.40 millimetersinches 2.54 centimetersfeet (f t) 0.3048 metersfathoms 1.829 metersstatute miles (mi) 1.609 kilometersnautical miles (nmi) 1.852 ki lometerssquare feet (ft2)square miles (mi2)acresgallons (gal)cubic feet (ft3)acre-f eetsquare meterssquare kilometershectares3.785 1 i ters0.02831 cubic meters1233.0 cubic metersounces (oz) 283.5 milligramsounces (oz) 28.35 gramspounds (lb) 0.4536 ki logramspounds (lb) .00045 metric tonsshort tons (ton) 0.9072 metric tonsBritish thermal units (Btu) 0.2520 ki localoriesFahrenheit degrees (OF) 0.5556 (OF - 32) Celsius degrees
PagePREFACE ......................................................................... iiiCONVERSIO!4 TABLE ..........................................................ivFIGURES ............................... ....................................... viiTABLES .......................................................................... xiACKNOWLEDGMENTS ................................................................. X i iCHAPTER 1 . INTRODUCTION: HISTORICAL PERSPECTIVE AND OVERVIEW .................. 11.1 Geologic History ............................................*....... 21.2 Recent History ...................................................... 4CHAPTER 2 . ENVIRONMENTAL SETTING ............................................ ... 82.1 Regional Geology and Characterization <strong>of</strong> the Watershed .............. 82.2 Clilnate ............................................................. 112.3 Hydrology ........................................................... 142.4 <strong>The</strong> Physicochemical Environment ..................................... 17CHAPTER 3 . PHYSIOGRAPHY ........................................................ 203.1 Structural Components . Before 1978 ................................. 203.2 Structural Coniponents . After 1978 .................................. 283.3 Major Stoms in 1978 and 1980 vs . 1962 and 1969: Differencesin <strong>The</strong>ir Effects on the Eastern Am1 ....*.......*......,... ..... .*.... 32and M.L . Quammen) ................................................. 384.1 <strong>The</strong> Plants .*............................... ........................ 384.2 <strong>The</strong> Invertebrates ...................................., .... 474 , 3 <strong>The</strong> Fishes .......................................................... 544.4 <strong>The</strong> Birds ..................................................... ... 594.5 <strong>The</strong> Herpet<strong>of</strong>auna arld Flaiqinal s ........................................ 674.6 Sumrnary ............................................................. 67.. Quamrnenand C.P. Onuf) .............Primary Productivity ................................................<strong>The</strong> Availability <strong>of</strong> Prilnary I'rodtrction to Consumers .................Primary Consurttption ........................ . ...............Predation .......................................e... ...............Higher Trophic Levels ...............................................Nutrients ...........................,..........,..a.*ee.eeee...a**................................................An Ecological OverviewCHAPTER 4 . THE BIOTA: DISTRIBllTION AND ABUNDANCE (by C.P. OnufCHAPTER 5 . THE BIOTA: DYNAMICS AN[) INT'FKACTIONS (by F1.1
CHAPTER 6 . COMPARISONS ......................................................... 936.1 Geographic Variation in Coastal Climate and Topography .............. 936.2 Comparison <strong>of</strong> <strong>Mugu</strong> <strong>Lagoon</strong> to the Other Southern<strong>California</strong> Estuaries ................................................ 96CHAPTER 7 . MANAGEMENT CONSIDERATIONS ........................................... 1037.1 Protection..* ........................................................ 1037.2 Sedimentation .................... .................................. 1047.3 Other Water-Borne Contaminants ...................................... 1077.4 Alteration <strong>of</strong> Tidal Flushing ........................................ 1077.5 Endangered Species .................. .* ...................... 1107.6 Information Gaps .................................................... 114REFERENCES ...................................................................... 117
1 Major structtrral features <strong>of</strong> southern <strong>California</strong> ........................ 32 Extent <strong>of</strong> %gu <strong>Lagoon</strong> sediments ,..,,.....,......r...................r. 53 Geological !nap <strong>of</strong> the watershed <strong>of</strong> Mugtr <strong>Lagoon</strong> .......................... 94 Characteristics <strong>of</strong> the <strong>Mugu</strong> <strong>Lagoon</strong> watershed: (a) sui tabil i ty<strong>of</strong> soils for agriculture, (b) natural vegetation, and(c) agricultural crops ...................... .......... . ......... 105 Characteristics <strong>of</strong> the climate <strong>of</strong> <strong>Mugu</strong> <strong>Lagoon</strong>: (a) air temperature,(b) precipitation, and (c) number <strong>of</strong> years with different amounts<strong>of</strong> precipitation ........................................................ 126 Wet and dry periods in southern <strong>California</strong> .................... ...... 14iStreanlflow in Calleguas Crcek: (a) mean flow in different inonths1969-77, 1978, and 1980, and (b) man flow by day in 1980 ............... 158 Tidal curves for several days in June and July 1981 ..................... 169 Meandailysolarradiationandskycover ............................... 1910 <strong>The</strong> main physiographic and land-use features <strong>of</strong> <strong>Mugu</strong> <strong>Lagoon</strong> ............. 22IIVariation in substrate texture with depth frorn a core takenin the eastern pond <strong>of</strong> the eastern am, <strong>Mugu</strong> Latjoon ..................... 2312 %ration <strong>of</strong> rnaximum tidal exposure and subtnersion forMission Bay Marsh ..................................................... 2513 Sediment triangle and map showing sa!rtples in which silts wererelatively enriched in surface sedirnent samples in theeastern arm <strong>of</strong> hgu <strong>Lagoon</strong> ,. . 26........................... .......14 Extent <strong>of</strong> intertidal f7ats in the central bdsin <strong>of</strong> Muyu <strong>Lagoon</strong>in different years ....................... .......................... 2815 Sedirnent texture before, during, and after the major series<strong>of</strong> storms in 1978 ....................................................... 3016 Sedirnent-sampling sit@.; and nrPas <strong>of</strong> t h lagoon ~ with ~iinilgrsediment changes in response to the ii~~ajorstom <strong>of</strong> Fehruary 1978 ........ 30
Number17 Changes in surface-sediment texture at sites in the tidalchannel and western pond <strong>of</strong> the eastern am, HU~U <strong>Lagoon</strong> . .*@.18 Changes in depth <strong>of</strong> the eastern arm <strong>of</strong> <strong>Mugu</strong> <strong>Lagoon</strong> caused primarilyby the storms <strong>of</strong> February 1978 and 1980 .... *.. . . O . . .*. ...*, .. .ee. . .. . . . . . . . 30.* I 3119 Relationship <strong>of</strong> the eastern arm <strong>of</strong> <strong>Mugu</strong> <strong>Lagoon</strong> to inputs fromCal feguas Creek under different tidal conditions . . . . . . . . . . . . . . , . . . , e.. 3320 Cumulative deviations from the long-term mean precipitation(34-year record) at Point <strong>Mugu</strong>, <strong>California</strong> ..., ........,,,,... .... . 3421 Hil 1 side development near Moorpark, <strong>California</strong>, 1979 . . . . . . . , , . , .. . . . . . .. 3422 Extent <strong>of</strong> hi1 lside development in one part <strong>of</strong> the watershed<strong>of</strong> <strong>Mugu</strong> <strong>Lagoon</strong> at different times .....,......,....,.........,~,e...I),.~t 3523 Areas with high rates <strong>of</strong> accelerated and geologic erosion ....,.,.....,.. 3624 Changes in pigment concentration and composition from June 1977to June 1978 ................................................. 4025 Dominant plant <strong>of</strong> the salt marsh, perennial pickleweed (Sal icorniavi rginica) ............,,. .,.,............... *.. .... . . . 4326 Biomass <strong>of</strong> Sal icornia vi rginica in the lower marsh at <strong>Mugu</strong> <strong>Lagoon</strong>in different months . . .. .... .. ...... *. . . ".. . ... . . . ..... 4327 Biomass <strong>of</strong> Saf icornia virginica vs. distance from the lower edge<strong>of</strong> the marsh ............................................... . . 4328 Illustration <strong>of</strong> the years x location interaction on the biomass <strong>of</strong>Sal icornia virginica in the lower marsh at <strong>Mugu</strong> <strong>Lagoon</strong> . . . .. , , , . ., . . . . . . . 4429 Biomass <strong>of</strong> common plants <strong>of</strong> the upper marsh at <strong>Mugu</strong> <strong>Lagoon</strong>in different months, 1977 . . . . . , . . . . . . . . . , . . . . , . . . . . . . . . . . . . . . . . . . . . . . . . 4530 Changes in the biomass <strong>of</strong> the common plants <strong>of</strong> the uppermarsh at <strong>Mugu</strong> <strong>Lagoon</strong>, 1977-81 ...........,............................... 4631 Changes in mean biomass <strong>of</strong> salt marsh plants in the uppermarsh compared to the lower marsh, 1977-81 . ... . . . .. . .. ..+. . * .. 4632 Locations sampled quarterly for invertebrates in the eastern am<strong>of</strong> Wgu <strong>Lagoon</strong> in 1977, sites grouped according to 50% similarityin densities <strong>of</strong> major categories, and mean densities <strong>of</strong> thosecategories in each group ............................ * ........ . ......... 4833 Changes in densities <strong>of</strong> invertebrates from 1977 to 1980 .......... ,..,... 5234 ~ish-sampling sites and their characteristics in 1977 . .... . . . . . , , . . . . .. . 5535 <strong>The</strong> S-year average monthly fish catch at M I J ~ <strong>Lagoon</strong>, ~ arrangedby month <strong>of</strong> peak abundance ... . . . . . ..,,. . . . . . *. . . . . . . . 58
Chartges in i?jean rnonti?ly fish catch and mean number <strong>of</strong> speciescaught, 1977-81 .........................................................Characteristics <strong>of</strong> satnpling sites and the locations where differentspecjes <strong>of</strong> fish were 120s t cariunonly caught in 1977 and 1981 ..............Five-year average abundances <strong>of</strong> water-related birds by month atcensus sites 1-20, <strong>Mugu</strong> <strong>Lagoon</strong> ....,.....................e.eIe(.e.e.*....*.i3ird census sites grouped according to > 60% similarity in theirdensities <strong>of</strong> the indi caeed categories <strong>of</strong> water-re1 ated hi rds andthe iriean densities (no./ha) <strong>of</strong> each category in the differentgroups <strong>of</strong> sites .........................................................Changes in bird abundance over time at <strong>Mugu</strong> <strong>Lagoon</strong> ......................-%-Density <strong>of</strong> shoots 07 Salicornia vir inica in the lower marsh <strong>of</strong><strong>Mugu</strong> <strong>Lagoon</strong> a1 ive addifferent tlmes urlng the growing seasonand accumulated deed since January ....................... ..........*Contributions <strong>of</strong> different sources to the total net primaryproductivity <strong>of</strong> the eastern arm <strong>of</strong> <strong>Mugu</strong> <strong>Lagoon</strong> ..............*..........neco~nposi tion in water <strong>of</strong> macrophytes in southern Cal i forniacoastal wetlands ..............,...............................e..*......Stratification in the depth <strong>of</strong> living position <strong>of</strong> the abundantshe1 led invertebrates in different habitats <strong>of</strong> <strong>Mugu</strong> <strong>Lagoon</strong> ..............Abundances <strong>of</strong> wonns, surface-feeding shorebi rds, and crabs andwil lets through the course <strong>of</strong> a year at two locations varyl'ngin the sand content <strong>of</strong> the substrate ....................................Plankton samples collected in the eastern ann <strong>of</strong> <strong>Mugu</strong> <strong>Lagoon</strong> atapproximately hourly intervals on 7-8 August 1978 .......................Monthly changes in fish abundances in the eastern ann <strong>of</strong> <strong>Mugu</strong> <strong>Lagoon</strong>after the inonth <strong>of</strong> peak abundance for five <strong>of</strong> the common specjes........Pacific coast <strong>of</strong> North herica from 30" to 50°N, Physical relief;normal rnonthly total precipitation, mean rnonthly river discharge and meanannual total precipitation; growing season; mean daily solar radi at1 on;dnd mean annual pan evaporation .........................................Large estuaries <strong>of</strong> southern <strong>California</strong>: <strong>Mugu</strong> <strong>Lagoon</strong>, Ti juanaEstuary, Upper Newport Bay, Anaheim Bay .................................Primary productivity as measured by August biomass <strong>of</strong> the lowermarshes at Tijuana Estuary and <strong>Mugu</strong> <strong>Lagoon</strong>,.......... ....................Smal ler estuaries <strong>of</strong> southern Cal ifornia: Agua Hedi onda,Up~er Bolsa Bay, Carpinteria Slough, Goleta Slough, LosPenasquitos <strong>Lagoon</strong> ......................................................Topographic maps <strong>of</strong> <strong>Mugu</strong> <strong>Lagoon</strong> in 1980 and as projected in 2030 ........Page
Number53 Two a1 ternatives for channel ization <strong>of</strong> Cal leguas Greek proposedby the U.S. Amy Corps <strong>of</strong> Engineers Los Angeles District in I972 ........ 10854 <strong>California</strong> least tern ............................ee.m*..C*.e ..me.......e ill55 Salt marsh bird's beak .................................................. 11256 Light-footed clapper rail .................... . ........................ 11257 Be1 di ng 's Savannah sparrow .................... ..................... 113
TABLES,ll ternation <strong>of</strong> marine and terrestrial fonilations in thestratigraphic sequence <strong>of</strong> the watershed <strong>of</strong> <strong>Mugu</strong> <strong>Lagoon</strong> .................. 4Structural components <strong>of</strong> the <strong>Mugu</strong> <strong>Lagoon</strong> estuarine ecosystem ............ 27Relative i~nportancc <strong>of</strong> different categories <strong>of</strong> plants in thedi ffererlt hdbi tats <strong>of</strong> tile <strong>Mugu</strong> <strong>Lagoon</strong> estuarine ecosystem ............... 39Mean density <strong>of</strong> inv~rtebrates in 1977 for a11 sites sampled in theeastern am1 <strong>of</strong> Mugti <strong>Lagoon</strong> ....................... .. . ................ 49Total catch <strong>of</strong> fishes by species and site in the 9 months <strong>of</strong> 1977whtln a1 l sites werc san~pl ed .........*............. .. . .. .,... ... 56tiabitat characteristics <strong>of</strong> the cornlnon species <strong>of</strong> fishes in <strong>Mugu</strong> <strong>Lagoon</strong>inferred from features <strong>of</strong> the sites at which they were caught mostfrequently .............................................................. 57Abundance ranking and mean nuiriber <strong>of</strong> birds seen per census averagedover all sedsons for 21 census sites in Nugu <strong>Lagoon</strong> ..................... 61Primary productivi ty in <strong>Mugu</strong> <strong>Lagoon</strong>: estimates <strong>of</strong> annual productivityfar different sources, conditions to which estimates apply, andconversions to siriiilar units ................... ........... ...... . 71Factors reducing the utilization <strong>of</strong> a source <strong>of</strong> primary productionby ~:~acroconsumers within the <strong>Mugu</strong> <strong>Lagoon</strong> estuarine ecosystem ............ 75Gut contents <strong>of</strong> fishes in <strong>Mugu</strong> <strong>Lagoon</strong>, February 1977-January 1978,a11 stations and rr~onths combined ................... . ................... 84Utilization <strong>of</strong> the eastern anri <strong>of</strong> <strong>Mugu</strong> <strong>Lagoon</strong> by the 10 mast cornmonlycaught fish species in 5 years <strong>of</strong> sal-ipl ing ., .eLe* 89Mean densities <strong>of</strong> the common she1 1 ed inacrainvertebrates and thei rpercent total density in subtidal sandy areas <strong>of</strong> <strong>Mugu</strong> <strong>Lagoon</strong> andTijuana Estuary ......................................................... 99Ranking <strong>of</strong> abundances <strong>of</strong> common fish species in four large southern<strong>California</strong> coastal wetlands .....,..................................I).... 100
ACKNOWLEDGMENTSI am grateful to the many people whosehelp made this monograph possible. Myfirst debt <strong>of</strong> gratitude is to my colleaguesBob Holmes and Pete Peterson forgetting me started in <strong>Mugu</strong> <strong>Lagoon</strong>. Nysecond debt <strong>of</strong> gratitude is to my twoprincipal coworkers, Mil 1 icent Quammenand Gary Shaffer, whose unstinti ngefforts and close cooperation helped melearn most <strong>of</strong> what I know about <strong>Mugu</strong><strong>Lagoon</strong>. Most <strong>of</strong> our studies were onlypossible because <strong>of</strong> the assistance <strong>of</strong>many students in the field and laboratory.I benefited fran c1 ose contact with JoyZedler, Wayne Ferren, and Eric Metz for abroader perspective on southern <strong>California</strong>coastal wetlands. Much <strong>of</strong> theresearch on which this synthesis re1 ieswas supported by the <strong>California</strong> Sea GrantCol lege Program. I thank the Commander,U.S. Naval Air Station, Point <strong>Mugu</strong>, forthe opportunity to conduct research in<strong>Mugu</strong> <strong>Lagoon</strong> and Base Biologist Ron Dowfor his cooperation. I a1 so benefitedfrom the outstanding human and materi a1resources <strong>of</strong> the Library, University <strong>of</strong><strong>California</strong>, Santa Barbara, especial lyGovernment Publications and the Map andImagery Laboratory. <strong>The</strong> comments <strong>of</strong> technicalreviewers, including KeithMacdonal d, Pete Peterson, and Joy Zedler,helped me improve the report and I thankthem. Reviews by the U.S. Fish and WildlifeService Field Office, Laguna Niguel,<strong>California</strong>, and the Natural Resources ManagementOffice at Naval Air Station, Point<strong>Mugu</strong>, he1 ped el iminate errors. JunePhinney typed and retyped the manuscriptspeedily, cheerfully, and we1 1 , for whichI thank her. Penny Herring, SueLauritzen, Kate Lyster,the <strong>National</strong> <strong>Wetlands</strong>and Rob Brown <strong>of</strong>Research Centerexpertly assisted with production. Withoutthe assistance <strong>of</strong> Ed Pendleton asreviewer, arbiter, and emissary <strong>of</strong> good-I under trying circumstances, therewould be no report.I dedicate the report to MillicentQuammen, where her indispensable contributionsare not acknowledged by authorship,and Nathaniel Onuf, for the timestolen from him to complete this largetask.
West tidal creeks, looking east, at <strong>Mugu</strong> Mudflats with foraging shorebirds (photo<strong>Lagoon</strong> (photo by R. Dow), by Mil 1 icent Quammen) .Central Basin <strong>of</strong> <strong>Mugu</strong> <strong>Lagoon</strong> (photo by Central and east anns <strong>of</strong> <strong>Mugu</strong> <strong>Lagoon</strong>8, Dow), (photo by R. Dow).East Am, law tide, burrows <strong>of</strong> Callianassa East arm <strong>of</strong> <strong>Mugu</strong> <strong>Lagoon</strong> at high tidecal iforniensjs (photo by R, Dow). (photo by R. Dow).xiv
CHAPTER I. iNTRODUCTiON:HlS'trORliCAh PERSPECTIVE AND OVERVIEWEstuaries are not estuaries most <strong>of</strong> thetime in the Pacific Southwest <strong>of</strong> theUnited States. <strong>The</strong> little rain thatfalls is confined to one-half <strong>of</strong> theyear, during which the average monthlyevaporation exceeds average monthlyprecipitation in all months at coastalpoints (U.S. Environmental Data andInformation Service 1980).When the effects <strong>of</strong> transpiration <strong>of</strong>water back into the atmosphere by thevegetation are included, the deficit innear-su rface water is magnified. Inaddition, the watersheds are small andsteep, but the mountains that delimitthem landward are not high enough toretain snow for long. Consequently,1 ittle water concentrates or is stored ator near the surface. <strong>The</strong>refore, coastalstreams and even rivers are intermittentor seasonal, as are the flows intocoastal embayments.Human activities have tended to furtherreduce the amount and duration <strong>of</strong> freshwaterinputs. Natural waterways arecircumvented by damming, distributing thewaters to human dwel lings, recol lectingthose waters, now laden with wastes, anddumping them directly into the ocean.Because the burgeoning human populationhas encroached into natural floodways,southern <strong>California</strong> has become "the land<strong>of</strong> the paved river" to insure thatsurface water does not tarry long whereit might damage nanmade structures. <strong>The</strong>net result is that little becomes lessand even more limited in duration.Hence, my assertion that these estuariesare not estuaries most <strong>of</strong> the time,follows Donald Pri tchard's introductorydefinition in the herican Assocjationfor the Advancement <strong>of</strong> Science (AAAS)symposium volume Estuaries, pub1 ished in1967: "An estuary is a semi-enclosedcoastal body <strong>of</strong> water which has a freeconnection with the open sea and withinwhich seawater is measurably dilutedwith freshwater derived from land drainage."In the land <strong>of</strong> estuaries that are notestuaries most <strong>of</strong> the time, perhaps it isa1 together fitting that the first subjectfor an estuarine pr<strong>of</strong>ile was not an estuaryin any sense until 1884, when itbecame so by the hand <strong>of</strong> man. (Steffen1982). Echoing Joy Zedler's <strong>of</strong>ten repeatedtheme in her community pr<strong>of</strong>ile on"<strong>The</strong> <strong>Ecology</strong> <strong>of</strong> Southern Cal iforniaCoastal Salt Marshes," no aspect <strong>of</strong> thefunctioning or present character <strong>of</strong> thisregion? estuaries can be pursued veryfar without reckoning with the effects <strong>of</strong>past, present and future human activities,both within and surround1 ng theembayments.One other characteristic <strong>of</strong> these intermittentestuaries <strong>of</strong> the PacificSouthwest interacts with the justmentionedfeatures <strong>of</strong> c1 imate and recenthi story to set these wet? and ecosystemsapart from their counterparts in othercoastal regions <strong>of</strong> the United States.Because the coast has been upliftedso recently, it is steep. As aresult, these areas <strong>of</strong> shallow coastalwater protected from the violent waveaction <strong>of</strong> the open coast are few, small,and separated from one another by Songstretches <strong>of</strong> very different shore environments--usual1y narrow sand or rockplatform beaches backed by cliffs.In net, estuaries, intermittent orotherwise, have heen, hjstorjcaTly rare inthe region, Rapid development by humanshas made these environments even rarer
and has degraded many surviving areas,Nevertheless, as el sewhere, the cmhination<strong>of</strong> protection from violent wsveaction, shall ow water, ample sun1 igRt(even to the bottom <strong>of</strong> subtidal areas),regular tidal exchange, and equable climateyield an abundant and varied bioticenvironment, Not surprisingly, someorganisms have come to depend an theseproductive coastal areas : as necessarystopping places and overwintering areasfor several migratory bird species thatuse the Pacific Flyway, possibly as theonly nursery ground for at least onecommercially important fish stock (seeChapter 51, and as the only habitat forthree species now classified as endangered.Thus, rarity is a major ingredient<strong>of</strong> the significance <strong>of</strong> coastalwetlands in southern <strong>California</strong> (Onuf eta1. 19791, and concern about continuinglosses and degradation is urgent.Urgent concern, coupled with the severaldistinctive characteristics sharedamong southwestern intermittent estuariesbut distinguishing them from the estuaries<strong>of</strong> the other regions, prompted thecompilation <strong>of</strong> an estuarine pr<strong>of</strong>ile forsouthern Cal i fornia. <strong>Mugu</strong> <strong>Lagoon</strong> waschosen for a variety <strong>of</strong> reasons, <strong>of</strong> whichI list three. hang the few, in somecases forlorn, remaining wetlands insouthern Cal ifornia, <strong>Mugu</strong> <strong>Lagoon</strong> is noteworthyfor its (I) relatively large sizeand (2) its freedom from many <strong>of</strong> thehuman incursions that afflict other areas(because the lagoon and its surroundingsalt marsh lie within the fenced andpatrol led boundary <strong>of</strong> a mi 1 i tary reservation).Consequently, there was somereason to be1 ieve that a wide range <strong>of</strong>coastal wetland habitats was representedat <strong>Mugu</strong> <strong>Lagoon</strong> in natural relations toone another; i.e., <strong>Mugu</strong> <strong>Lagoon</strong> provid~d aglimpse <strong>of</strong> &at these systems could belike when free <strong>of</strong> undue human intervention.Perhaps, then, <strong>Mugu</strong> <strong>Lagoon</strong> couldserve as a model for undoing damage toother wetlands. This was my reason forconducting research in <strong>Mugu</strong> <strong>Lagoon</strong>. <strong>The</strong>security provided by the Navy also was aninducement, to carry out long-term observationsand experiments that could nothave been contemplated where access wasnot strictly controlled, As a result,(3) more detailed scientific research hasbeen performed at <strong>Mugu</strong> <strong>Lagoon</strong> than anyother coastal wetland area in southernCaf i frsrnia, although coverage <strong>of</strong> differerlttopics is very uneve~,1.1 GEOLOGIC HISTORL'<strong>The</strong>re must be an element <strong>of</strong> arbitrarinessin the decision <strong>of</strong> when to begin thehistory <strong>of</strong> a place, particularly for onesuch as <strong>Mugu</strong> <strong>Lagoon</strong>, perched on the edge<strong>of</strong> an actively moving continental plate,Because <strong>of</strong> this precarious location, theregion is incredibly active tectonical I y,What is here now bears little relation toeven its recent antecedents.<strong>The</strong> region is very active. <strong>The</strong> streamthat empties into the lagoon originatesin the wild jumble <strong>of</strong> the TransverseRanges (oriented east-west or transverseto the north-south trend <strong>of</strong> the majorranges <strong>of</strong> <strong>California</strong>, the Sierra Nevadaand the Coast Range) only 50 km from theSan Andreas Fault (Figure 1). Along thefault, instantaneous rates <strong>of</strong> 1 ateraldisplacement <strong>of</strong> 6.4 m and 3.0 m wereidentified with the San Francisco earthquake<strong>of</strong> 1906 and the Imperial Valleyearthquake <strong>of</strong> 1940, respectively (Hill1954). Within the Transverse Ranges,only 25 km from the boundary <strong>of</strong> thelagoon's watershed, a 0.9-m vertical di s-placement occurred along a thrust faultduring the San Fernando earthquake <strong>of</strong>1971. <strong>The</strong> estimated average rate <strong>of</strong>uplift along the thrust faults <strong>of</strong> theregion is 8 m per 1,000 years (1 cm in1.25 year). In sme locations rates arebound to be much higher (Scott andWilliams 1978). In summary, quoting fromScott and Williams: "Deposits <strong>of</strong> latePleistocene age are in a steeply inclinedattitude at many localities in the area,and are actually overturned at several -to within 50" <strong>of</strong> complete overturn inOrcutt Canyon, a study watershed. Infact, the structural deformation <strong>of</strong> deposits<strong>of</strong> the youngest geological timeperiod in the Transverse Ranges is withoutknown parallel in North America."Even though very recent processes arealmost exclusively responsible for thepresent physiographic character <strong>of</strong> therecion, the kind <strong>of</strong> material exposed bytectonic processes and weathering also isimportant. It is the parent material <strong>of</strong>
Santa Barbara Channel IslandsFigure 1. Major structural features <strong>of</strong> southern <strong>California</strong>. Upper relief mapshows the relationship <strong>of</strong> the Transverse Ranges to the other major mountainranges <strong>of</strong> southern <strong>California</strong>. Lower map shows the watershed <strong>of</strong> Wugu <strong>Lagoon</strong>in relation to major fault systems (adapted from Hi1 1 1954).3
the soils and fnfluences their fertilityand erodibility, <strong>The</strong>refore, I begin thehistory <strong>of</strong> <strong>Mugu</strong> <strong>Lagoon</strong> in the Upper Cretaceous,approximately 100 mil lion yearsago, when the oldest rocks now exposed inthe watershed were laid down. <strong>The</strong> locationon an active continental margin isattested by the alternation <strong>of</strong> marine(deep, transgressive, and nearshore) andterrestrial deposits in the stratigraphicrecord (Table 1). A11 rocks are sedimentary,with the exception <strong>of</strong> one convulsion<strong>of</strong> volcanic activity in the Miocene.<strong>The</strong>se volcanic rocks are exposed in thesoutheastern part <strong>of</strong> the watershed butapparently underlie more recent depositseverywhere else in the region, judgingfrom samples extracted during welldrilling (She1 ton 1954). Parenthetically,it is the Miocene sedimentarydeposits that have excited the greatestinterest local ly. <strong>The</strong>y are consideredto be the source rocks for petroleum reservesin the Ventura area (Steffen1982).Accordi ng to Steffen's recent summary,the features that eventually defined thelagoon itself have been developing onlyTable 1. <strong>The</strong> a1 ternation <strong>of</strong> marine andterrestrial formations in the stratigraphicsequence <strong>of</strong> the watershed <strong>of</strong> <strong>Mugu</strong><strong>Lagoon</strong>. Adapted from Steffen (1982).in the last 300,000 years, since theMiddle Pleistocene, Flood deposits fromthe Santa Clara River built up the OxnardPlain at the rate <strong>of</strong> 2 rn per century,until uplift at the end <strong>of</strong> the MiddlePleistocene directed the river to thenorthwest. At around the same time, thesoutheast portion <strong>of</strong> the plain subsided.Sea level reached its lowest stand about18,000 years ago and then rose to 2 mabove present level s approximately 3,000years ago. This was when the lagoon firstformed. Where littoral drift from thenorthwest (Bascom 1980) encountered thePoint <strong>Mugu</strong> headland, sand accreted, and amuch broader beach or spit formed on theupcurrent side <strong>of</strong> the obstruction. As thesea level dropped, the spit migratedseaward with it, and the enclosed coastalembayment has become the <strong>Mugu</strong> <strong>Lagoon</strong>Estuary.Evidence for this process has cmefrm Warme (1971), who identified ridges<strong>of</strong> sand within the salt marsh that fringesthe eastern arm <strong>of</strong> <strong>Mugu</strong> <strong>Lagoon</strong>. He interpretedthe ridges as relict beach bermsthat had formed during a higher stand <strong>of</strong>the sea. Apparently, the drop in sealevel was stepwise rather than continuous.If it had been continuous, it would behard to account for the water-filledtrough (the lagoon) that lies between thecurrent and past berms, rather than dunesor a wall <strong>of</strong> sand such as climbs the flank<strong>of</strong> the headland 5 km to the southeast.Years before Geological Depositionalpresent age envi ronmen tCenozoic:600,000 Pleistocene Terrestrial10,000,000 Pl iocene Deep marine25,000,000 Miocene Transgressivemarine35,000,000 01 igocene Terrestri a155,000,000 EocenemarineNears hore65,000,000 Paleocene Nears horemarineMesozoic:100,000,OOQ Upper Creta- Terrestriala Coarse particf es deposited in shallowwater and fine particles in deep water.1.2 RECENT HISTORY<strong>Mugu</strong> <strong>Lagoon</strong> has a water area <strong>of</strong> approximately130 ha. Judging from the distribution<strong>of</strong> recent lagoonal depositsoverlying deltaic deposits, it was tentimes that size at its largest (Figure 2).Presumably, this was soon after the origin<strong>of</strong> the lagoon when the sea level was 2 mhigher. <strong>The</strong> lagoon is elongate, runningpara1 lel to the coast for 5.6 km but neverexceeding 1km transversely. It iscomposed <strong>of</strong> two long arms projecting outfrom a broader central basin. CalleguasCreek, the only inlet stream, dischargesinto the central basin. <strong>The</strong> mouth <strong>of</strong> thelagoon usually opens in the vicinity <strong>of</strong>the central basin, but it has been knownto migrate 0.75 km eastward. <strong>The</strong> eastern
Figure 2. Extent <strong>of</strong> Mugti <strong>Lagoon</strong> sediments (fran Steffen 1982, based on a geologic mapin <strong>California</strong> Division <strong>of</strong> Miires and Geology, Preliminary Report 14, 1973).ann is very narrow because the shore issteep along the flank <strong>of</strong> the Santa MonicaMountains. <strong>The</strong> western arm is broaderand has a wider expanse <strong>of</strong> fringing saltmarsh, because in this direction thelagoon extends into the Oxnard Plain.Human occupation <strong>of</strong> the area around<strong>Mugu</strong> <strong>Lagoon</strong> probably began around 7,000years ago (Macdonald 1976a). <strong>The</strong> coastalstrip along the Santa Barbara Channelsupported one <strong>of</strong> the densest aboriginalpopulations in what is now the UnitedStates--which is surprising, consideringthat the <strong>California</strong> Indians were huntergatherersand not agricul tu ral i sts(Hornbeck 1983). <strong>The</strong> Chucnash village on<strong>Mugu</strong> <strong>Lagoon</strong> at the time <strong>of</strong> Europeancontact (1760) was estimated to have 400inhabitants, but densities dropped <strong>of</strong>frapidly inland (Hornbeck 1983). <strong>The</strong> highlocal density <strong>of</strong> hunter-gatherers indicatesthat the Indians could have had alarge effect on populations <strong>of</strong> fishes andthe larger invertebrates in <strong>Mugu</strong> <strong>Lagoon</strong>and game in the surrounding uplands,while effects on the watershed would beminimal, During the period <strong>of</strong> theSpanish missions and Spanish dnd Mexicanranchos (1782 to 18451, agricu! ture wasintroduced. A1 though mission recordsshow that substantial amounts <strong>of</strong> wheatwere harvested in the Ventura area(Hornbeck 1983), the main agriculturalactivity in the watershed <strong>of</strong> <strong>Mugu</strong> <strong>Lagoon</strong>was grazing cattle (Murphy 1979). Presumably,some changes in the naturalvegetation resulted, but the character <strong>of</strong>the landscape probably did not change.Soon after Mexican control was supplantedin the region (1846), "Anglo"settlers began to intensively cultivatelarge areas <strong>of</strong> the watershed <strong>of</strong> <strong>Mugu</strong><strong>Lagoon</strong>. Between 1876 and 1881 railroadconnections with San Francisco and theeastern United States were established,and agriculture became a big exportbusiness (Steffen 1982). Shortly aftercrop agricul tu re became establ i shed onthe Oxnard Plain, Calleguas Creek waschannelized, and its flows were shuntedinto the lagoon. As already indicated,<strong>Mugu</strong> <strong>Lagoon</strong> has been a true lagoon ratherthan an estuary for most <strong>of</strong> its existence.In 1884 <strong>Mugu</strong> <strong>Lagoon</strong> became anestuary.Before the channelization <strong>of</strong> the creek,there were no significant terrigenousinputs to the lagoon. Conditions probablyapproximated those <strong>of</strong> a coastalmarine mbayment. Undoubtedly, largeareas <strong>of</strong> the Oxnard Plain contiguous to
the lagoon were freshwater marshes duringthe rainy season, but their flows intothe lagoctn would have been sinaf I ccmparedto that <strong>of</strong> a channelized Calleguas Creek.<strong>The</strong> original watershed <strong>of</strong> the SantaMonica Mountains draining into the lagoonwas little more than twice the water area<strong>of</strong> the lagoon itself and less than thearea <strong>of</strong> the lagoon plus its fringing saltmarsh. Consequently, interactions withthe ocean, sunlight, and temperaturewould have been the physical drivingforces rather than freshwater inflow.<strong>The</strong> tidal prism (volume <strong>of</strong> lagoon waterexchanged over a tidal cycle) would havebeen sufficient to keep the mouth open ata1 1 times, Regular tidal flushingcoup1 ed with shall ow depths would haveascured good exchange <strong>of</strong> materials withinthe lagoon; however, the mouth <strong>of</strong> thelagoon is at the head <strong>of</strong> a submarinecanyon, and the Continental Shelf isnarrow in any case, <strong>The</strong>refore, the waterentering the lagoon <strong>of</strong>ten is relativelynutrient-poor, oceanic-blue water. Inthe absence <strong>of</strong> terrestrial run<strong>of</strong>f, thismay have resulted in lower primary productionthan is characteristic <strong>of</strong> rnostshal low-wa ter marine systerns. Nevertheless,the combination <strong>of</strong> shallow waterprotected from violent wave action, amplesun1 ight, higher summer water temperaturesthan <strong>of</strong>fshore, and good tidalexchange must have made for an abundantand productive biota (as is attested bythe shell middens on the shore <strong>of</strong> the1 agoon).<strong>The</strong> rnajor human influence on <strong>Mugu</strong><strong>Lagoon</strong> has been the funneling <strong>of</strong> dischargesfrom a watershed <strong>of</strong> 843 km2 into areceiving body less than 13500th thatsize, which previously had been subjectonly to marine influences. <strong>The</strong> repercussions<strong>of</strong> that single alteration will betouched on throughout the rest <strong>of</strong> thisreport, Although the alteration was asingle discrete event, its effect cangrow, and a1 mos t certainly has grown.<strong>The</strong> channelized creek is a conduit. Itwill transmit whatever is put in alongits length to its lower end. As morepeople occupy the watershed or use itmore intensively, the inputs to the creekwill be a1 tered, In 1880, 4 years beforeNugu <strong>Lagoon</strong> became art estuary, the poplifation<strong>of</strong> Ventura County was 5,073. <strong>The</strong>population has more than doubled in every20-year period since then and in 198U was529,174, or more than iOO times greaterthan a century ago, Between 197@ and1980 the pspu2ation within the watershedincreased by 56% from 154,465 to 240,432,<strong>The</strong> cause and effect re? ationship betweenthe number <strong>of</strong> people and the amount<strong>of</strong> material that has potential impact ifit is carried into an estuary is notstraightforward. For instance, populationgrowth in this region could have thebeneficial effect <strong>of</strong> increased diversion<strong>of</strong> water to pathways that do not lead intothe estuary. Instead, the effect <strong>of</strong>greater significance is as follows: <strong>The</strong>bottomlands have been under cu1 ti vat ionfor a long time. <strong>The</strong> growth <strong>of</strong> the populationin this area takes the form <strong>of</strong>urbanization <strong>of</strong> these bottomlands. Ifthe process were strictly the substi tution<strong>of</strong> a different land use on the samespot, the net result might well be lessinput to the natural drainage system.However, displacement rather than substitutionhas occurred. Rather than beingel iminated, intensive agriculture hasmoved up the sides <strong>of</strong> steep hills, theresubstituting groves <strong>of</strong> fruit trees withbare soil between the trees for grazedchaparral. This type <strong>of</strong> cultivationincreases run<strong>of</strong>f, possibly with substantialloads <strong>of</strong> agricultural chemicals, andaggravates soil erosion.Another consequence <strong>of</strong> the preemption<strong>of</strong> prime agricultural bottomlands is thatthe large remaining acreage is farmedeven more intensively. <strong>The</strong> averagefrost-free period is 332 days. Customarily,three to four crops are grown eachyear in the Oxnard Plain area (Steffen1982), and some <strong>of</strong> thm are heavilydosed with chemicals. <strong>The</strong> strawberryfields, for instance, are covered withplastic so that the soil can be fumigatedfor nematodes, weed seed, and fungibefore each planting. An average <strong>of</strong>193.1 lb per acre (213-9 kg per ha) <strong>of</strong>restricted fumigant pesticides (almostexcl usivel y methyl bromide and chl orpicrin)is applied each year. In 1976,almost 800,000 Ib (360,000 kg) <strong>of</strong> pesticideswere applied in Ventura County(Gal i forni a Department sf Food and Agrictrftlire1378), the great majority wfthirrthe watershed sf <strong>Mugu</strong> <strong>Lagoon</strong>. A1 thoughfigures for fertilizers or, more
inportantly, levels <strong>of</strong> pestici;dtl resfduesor nutrients in agricultural drain watersare few, the potents'al for substantialinputs to Calleguas Greek and <strong>Mugu</strong> <strong>Lagoon</strong>obviously is high.Mot a1 l effects <strong>of</strong> development by humansare transmitted to the lagoon viaits inlet stream. <strong>The</strong> lagoon lies withinthe boundaries <strong>of</strong> the U.S. Naval AirStation at Point <strong>Mugu</strong>, Cal ifornia,(established in 1946), and the operationalpart <strong>of</strong> the base is built on filldredged from the central basin. Pastactivities within the lagoon itself,especially those associated with the construction<strong>of</strong> the base, have led tolarge losses <strong>of</strong> wetland habitat and othermodifications that have altered ecosystemfunction. However, natural resourcesincontestably benefit from the militarypresence in other regards. <strong>The</strong> relativelylarge part <strong>of</strong> <strong>Mugu</strong> <strong>Lagoon</strong> thatremains a wetland has been left asnatural as possible, given the modifications<strong>of</strong> its surroundings. <strong>The</strong> protectionbegan as a byproduct <strong>of</strong> naval securityand air clearance space requirementsbut now is an actively pursued policy <strong>of</strong>the Navy. As a result, the site has beensomething <strong>of</strong> a mecca for scientific studyfor many years.<strong>The</strong> current situation and probablenear-tern trends, then, are these: <strong>The</strong>watershed is dominated by agriculture;however, a burgeoning urban-suburbanpopulation has led to changes in agricul-tural practices that almost certainlyincrease the inputs <strong>of</strong> sediments andchemicals to the lagoon. <strong>The</strong> limitedavailability <strong>of</strong> freshwater locally andthe probable increase in water conservationand wastewater reclamation may we1 lreduce future inputs <strong>of</strong> stream water andwhat it carries during most <strong>of</strong> the year,but storm flows still will deliver sedimentsto the lagoon, sometimes in greatgluts. <strong>The</strong> consequences <strong>of</strong> this sedimentationwill be explored at length inother sections <strong>of</strong> this report.So far in this overview <strong>of</strong> <strong>Mugu</strong> <strong>Lagoon</strong>,the "estuary" has been treated as aunit--initially a very small one,essentially without a watershed, and nowa much bigger one, with concomitantlylarger terrigenous inputs. Every effortwill be made to encompass the wholesystem; however, there are major constraints.Inevitably, coverage isuneven. Some topics (most notablyassociated with the she1 led invertebrates)have been we11 studied, whileothers (most glaringly, nutrientchemistry) have not been investigated.Furthermore, almost all <strong>of</strong> the ecologicalresearch that has been carried out in<strong>Mugu</strong> <strong>Lagoon</strong> has been in the eastern am<strong>of</strong> the lagoon, which is maintained by theNavy as an ecological reserve. Thislimitation in spatial coverage should beborne in mind throughout. Wheneverappropriate, the discussion w i l l beextended to include the other parts <strong>of</strong>the lagoon.
General ly speaking, average condi tionsprovide the most informative and most<strong>of</strong>ten utilized summary <strong>of</strong> what a systemis like and how it is likely to behave.However, It w i l l become abundantly obviousthat extreme conditions play a rolein <strong>Mugu</strong> <strong>Lagoon</strong> that is vastly more importantthan their frequency would suggest.<strong>The</strong> main thrust <strong>of</strong> this section will be,then, to ill ustrate how important departuresfrom average conditions are indetermining the characteristics <strong>of</strong> thisestuary and probably most others in theregion, Later chapters will show how theterrestrial part <strong>of</strong> this estuarine ecosystemexerts its influence over theestuary through the supply <strong>of</strong> sediments.<strong>The</strong>refore, many <strong>of</strong> the topics <strong>of</strong> thischapter will be developed as they re1 atelater to the production or transport <strong>of</strong>sediments to the lagoon.2.1 REGIONAL GEOLOGY AND CHARACTERlZATlON OF THE WATERSHED<strong>The</strong> watershed around <strong>Mugu</strong> <strong>Lagoon</strong> isnotable for its high erosion potential,Erosion is a leveling process. It is thepredominating force in determining thesurface characteristics <strong>of</strong> most 1 andmasses. Slopes are determined primarilyby the rates <strong>of</strong> weathering <strong>of</strong> the parentsocks and the length <strong>of</strong> time that erosionhas been working an ti~~,n. As erusionproceeds, slopes become more gradual,thereby slowing the rate <strong>of</strong> subsequenterosion. t4awever, in parts <strong>of</strong> the TransverseRanges <strong>of</strong> <strong>California</strong>, includingmuch <strong>of</strong> the watershed <strong>of</strong> <strong>Mugu</strong> <strong>Lagoon</strong>,this is not the case, <strong>The</strong> rates <strong>of</strong>uplift substantially exceed the rates <strong>of</strong>denudation. <strong>The</strong> great tectonic activitythat now prevails, and has prevailed forat least the last ICO milfioc years, hasproduced a very yotrthful iarldscape.About 46% <strong>of</strong> the watershed tdis covered by1 ate Pleistocene or more recent a1 1 uvi a1deposits (Figure 3). <strong>The</strong>se dominate theflat valley bottoms. <strong>The</strong> older rockshave been thrust up along faults andfolded into ranges <strong>of</strong> hi1 1s and mountains,Elevations are moderate (under1,200 m), but slopes are considerablysteeper than they would be in the absence<strong>of</strong> ongoing uplift. Thus, past erosionhas not yielded a reduction in slope thatlessens present erosion, and the measuredrates <strong>of</strong> denudation "approach the maximumfor areas in which consolidated bedrockis being eroded directly" (Scott andWilliams 1978). Scott and Williams alsostated that the failure <strong>of</strong> standardmodels to include this factor <strong>of</strong> tectonicactivity accounts for their gross underestimates<strong>of</strong> sediment yield in thisregion.<strong>The</strong> mineral canposi tion and structure<strong>of</strong> the rocks in this region also contributeto very high sediment yields. <strong>The</strong>divisions <strong>of</strong> rock types in Figure 3 weremade to correspond to the categories usedby Andre and Anderson (1961) in theirtests <strong>of</strong> soil erodibility with respect toparent material. According to their preferredindex <strong>of</strong> erodibility (surfaceaggregationratio), soils from Quaternarya1 luvium and acid igneous rocks were themost erodible soils that they tested.<strong>The</strong>se soils cover 59% <strong>of</strong> the watershed.<strong>The</strong> Miocene vo1 cani cs and Quaternarya1 luviuin and terrace deposits <strong>of</strong> theTransverse Ranges were approxiinatelytwice as erodible as the consolidatedscdirnentary rocks (Scott and Hilliams1975) ; however, this factor was minorcompared to the effect <strong>of</strong> tectonicactivity on erosion.<strong>The</strong> juxtaposition <strong>of</strong> active mountainbuiiding next to a coastal plairl has produced:oils ranging from a thin veneer tomore than 1-5 m deep. Soils range from
Figure 3. Geological map <strong>of</strong> the watershed <strong>of</strong> <strong>Mugu</strong> <strong>Lagoon</strong>. Wi thin the watershed, rocksare grouped according to the categories <strong>of</strong> Andre and Anderson (1961): hard sedimentarydeposits (Cretaceous, Pal eocene, and Eocene marine shal e, sands tone, and conglomerate,and nonmarine 01 igocene); s<strong>of</strong>t sedimentary deposits (Miocene, Pliocene, and lowerPleistocene marine deposits) ; igneous rocks <strong>of</strong> Miocene age; and a1 luvium (Quaternarya1 luvial and terrace deposits, mainly nonmarine). (Adapted from Jahns 1954.)prime agricultural land to land completelyunsuitable for cultivation, withuse restricted to the maintenance <strong>of</strong>wildlife and watershed, according to theSoil Conservation Service's capabil i tyclassification. As one might expect fromthe discussion <strong>of</strong> geological factors, thethin soils that are unsuitable for agricu1ture invariably are associated wi thsteep slopes, and the prime soils are allin the valley bottoms (Figure 4a).Coastal sage and foothill woodland withislands <strong>of</strong> oak savanna are the dominantnatural communities (Figure 4b). <strong>The</strong>yare not closely linked to soil type orcapability class. Agricultural uses <strong>of</strong>the watershed (Figure 4c) are dominatedby vegetable crops on prime agriculturalland <strong>of</strong> the coastal plain; fruit/nutcrops in the lower reaches <strong>of</strong> the val-leys, both on prime bottcxnland and marginalvalley sides; field crops in theupper reaches <strong>of</strong> valleys, mostly on soilswith severe limitations for cultivation;and grazing in the rugged hi1 1s. Nurseryoperations are interspersed throughoutthe vegetable and frui t/nut growingareas. Soils <strong>of</strong> high fertility areinterspersed in most soil types andcapability classes (<strong>California</strong> Department<strong>of</strong> Food and Agriculture 1978). Apparently,in this region <strong>of</strong> obSigatoryirrigation, factors other than fertilitydetermine the suitability <strong>of</strong> a soil foragriculture.<strong>The</strong> effect <strong>of</strong> vegetative cover and landuse on erosion is we71 known in principlebut less we17 known in actual applicationto this region. Throughout the watershedthe natural vegetation can be sparse and
'(8~61 a ~ n 2 ~ n 3 pup ~ ~ pooj 6 ~ JO Jua~~edag elu-JOJ~LP~ UOJJ pa~depe) sdolc3 le~nq~napG~ (2) put? $uo[?e~afjan te.inqeu (q) %~n?~n3&~6edo$ silos 40 IC2!.1kqe?!ns (e) :paysula%eM uo<strong>of</strong>jq n6n~ aql jo s ~ ~ ~ s y a p'gt slnE!j ? ~ ~ ~ ~
siopes can be precipitous; tnerefore, thethousands-fold di fferences in ?OSSshown -in early S<strong>of</strong>l Conservation Servicetests between plots <strong>of</strong> siniilar area andslope with natural vegetation cmpared toplanted and hare crop land probably donot apply to these areas. idev~rtheless,the effect <strong>of</strong> land clearing on erosion isveq large. For instance, i:ieasurerner~ts<strong>of</strong> sediment yield in the western TransverseQanges <strong>of</strong> Ventura County were 11.9to 35 tirnes higher immediately after thetotal burn <strong>of</strong> watersheds than after 10years <strong>of</strong> regrowth (Scott and Williams1978). <strong>The</strong> effects <strong>of</strong> agriculture havenot been addressed explicitly in thecontext <strong>of</strong> local condi ti ons ; however,Steffen ( 1982) mapped areas <strong>of</strong> higherosion rates (greater than 10 tons peracre per year or 20 metric tons per haper year) and estimated th t acceleratederosion (caused by hurnan acLf vi ties) contributesabout 402 <strong>of</strong> the total sedimentgenerated in the watershed. Almost a11<strong>of</strong> the accelerated erosion is associatedwith agriculture,2.2 CLIMATE<strong>The</strong> climate <strong>of</strong> the area is Medi terranean:rnoderate temperatures, arid summers,and relatively moist winters, <strong>The</strong>reason for the region's rnoderate temperatureregime is the Pacific Ocean, a highlyconservative thermal mass over whichwesterly, onshore winds prevail exceptfrom November to January (de Violini1975),Monthly mean air temperatures <strong>of</strong> thewarrlrest and coldest months (Figure 5ajdiffer by only +3.5"G and -3.1°C from theannual mean <strong>of</strong> 14.7"C. <strong>The</strong> mean dailyrange in temperature is least in June,varying 7.3"C from a minirnum <strong>of</strong> l2.3"C toa maximuirl <strong>of</strong> 19.6"C, and greatest inNovember, varying 10.6OC from a minimum<strong>of</strong> 9,Z°C to a maximum <strong>of</strong> 19.B°C, only3.3"C inore than in June. Even the minimumtemperature recorded in 26 years is notparticularly extreme (-2.8"C or 9.4"Cbelow the average minimum <strong>of</strong> the coldestmonth; de Violini 1975). However, thehigh temperature discrepancies aregrea &err <strong>The</strong> record high was 40.0°C,17.9"C higher than the average maxiinurn <strong>of</strong>the warmest month. More importantly,frorn July 1976 through January 1981,temperatures were greater than 10°C abovethe average maximum <strong>of</strong> the wannest monthinore than 2 days per year, on theaverage, Curiously, these extremes werenot during the height <strong>of</strong> summer (Julyand August). Rather, they were bothbefore (May and June) and especiallyafter (Septanber, October, and evenNovember).During October and November, the hotspells are usually associated with verylow relative humidities and high winds,the so-called Santa Anas, when the prevailingwesterlies are supplanted for upto a few days at a time by northeasterlywinds swooping down the canyons from thehigh desert--the air is hot to beginwith and rises even more in tmperatureas the air mass descends and is compressed.<strong>The</strong> significance <strong>of</strong> the hot,dry winds at this time <strong>of</strong> year will beapparent following the discussion <strong>of</strong> precipitation.General ly, the daily and seasonal temperaturefluctuations tend to increasewith distance from the ocean, and temperaturedecreases with elevation. Locallythis pattern is strongly modified bytile winds, because <strong>of</strong> the orientation <strong>of</strong>the watershed. Thus, most <strong>of</strong> the timethe prevailing westerly winds transmitthe moderating inf 1 uence <strong>of</strong> the oceanthroughout the coastal plain and up intothe east-west trending va1 leys. Nevertheless,both higher maximum and lpwerminimum temperatures certainly occur inthe more landward parts <strong>of</strong> the watershedthan at <strong>Mugu</strong> <strong>Lagoon</strong>.<strong>The</strong> other important characteristic <strong>of</strong> aPlediterranean climate is that the relativelysmall annual precipitation isheavily concentrated in the cooler part<strong>of</strong> the year. Certainly this is the casefor <strong>Mugu</strong> <strong>Lagoon</strong> (Figure 5b). Ninety-sixpercent <strong>of</strong> the year1 y total precipitationfalls in the 6 months from November toApril. <strong>The</strong> contrasting records for theyears <strong>of</strong> lowest and highest precipitationare plotted along with the 34-year wanto give some idea <strong>of</strong> the extent <strong>of</strong> yearto-yearvariation (Figure 5b). Yearlytotals were more than twice the 34-yearaverage in 2 years, more than 1.5 timesthe average in 6 years, and less than
200 % OF344% MEANFigure 5. Characteristics <strong>of</strong> the climate <strong>of</strong> <strong>Mugu</strong> <strong>Lagoon</strong>: (a) air temperature,(b) ~ltonthly precipitation, and (c) the nurnber <strong>of</strong> years with differentamaunrs <strong>of</strong> precipitation, grouped in lil",;ncrment; <strong>of</strong> the 34-year mean (adaptedfran de Violini 1975 and unpublished records).
one-halfttne average in C years (Figure5c). Rainfa:? is concentraeed into shortperiods :di tilin the 6-iilontii nlu'lst period,In 2 years out 3f 34, the aveyage annualrajnfal1 was exceeded by peci pi talionfallinc: in s single inlonth in 3 yearsover one-ha1 f <strong>of</strong> the ann!ial average fel 1in a single month (and in each <strong>of</strong> 2months in 1976 and 1980 for- a total <strong>of</strong> 1:o;currcncus). After these figures, itwil 1 cane as no surprise that even asingle storm, or more precisely a stonnseries, can dump more than trje annualaverage [as, for example, in February1962 anil January 1969),Both oi these character; stics <strong>of</strong> the1 ocal rai nf al 1 regime ('occurrencelimited to tne cool half <strong>of</strong> the year andthen falling in a relati~ely FPW majorstonns) have ser.m'ous imp1 -ations in thewatershed <strong>of</strong> <strong>Mugu</strong> Lagc >r;. Potentialevapotranspiration is more than 70 cmduring the growing season; yet, becausewater is rapidly removed from the surfacelayers <strong>of</strong> the soil, the estimated actualevavotranspiration is 25 - 30 cm. Sincealmost no rain fails after April, rangegrasses are likely to dry out by earlyJune (Soil Conservation Service 1970),with the four hottest and four <strong>of</strong> thedriest months yet to come. When theSanta Anas blow near the end <strong>of</strong> thisperiod, the hot, dry, fast-moving airdesiccates even the most deeply rootedvegetatioo.Fires iyni ted under these condi tionstend to burn out <strong>of</strong> control until theSantd Ana conditions abate. In the meantime,thousands <strong>of</strong> acres <strong>of</strong> vegetationcan be consumed. Based on records fortheir study area in the western TransverseRanges, which included substantialparts <strong>of</strong> the watershed <strong>of</strong> <strong>Mugu</strong> <strong>Lagoon</strong>,Scott and Wi1 liams (1978) cited annualburn rates <strong>of</strong> 0.42% <strong>of</strong> the total area,although longer records from the nationalforests imnlediately to the north indicatethat a higher rate might be more appropriate.This suggests that an average <strong>of</strong>2 kn2 <strong>of</strong> the rugged part <strong>of</strong> the watershedis bared by fire each year, with theprevious! y described ten-fol d or moremagnification oF sediment yield. Even intile dbsenlce oP fire, the veyetdtion <strong>of</strong>the watershed is in very poor conditionby the next rainy season. Undoubtedlythis also contributes to the highsediixent yields characteristic <strong>of</strong> theregion.<strong>The</strong> siuni ficance <strong>of</strong> the concentration<strong>of</strong> rainfall in major, protracted stormsis given in Scott and Williams"l9788)description <strong>of</strong> the January 1369 event:"Major stonns, like those <strong>of</strong> March 1938and January and February 1969, havefollowed a generally similar patternthat can be expected to recur in futuremajor stornls. <strong>The</strong> stom <strong>of</strong> January18-27, 1969, was typical: <strong>The</strong> circulationpattern <strong>of</strong> a low pressure centerin the Pacific permitted intensestreaming <strong>of</strong> northeaskard moving,moisture-laden air as a succession <strong>of</strong>storm fronts. Precipitation was lightunti 1 January 19 when intensity increasedsharply. Heavy precipitationoccurred throughout most <strong>of</strong> January 19-26, was interrupted by a brief respiteon January 22, and then climaxed onJanuary 25."<strong>The</strong> January 1369 storm generally producedpeak discharges equal to orgreater than those <strong>of</strong> the 1938 stonn inVentura County and western Los AngelesCounty. <strong>The</strong> 1938 storm had been thegreatest storm <strong>of</strong> recent times, atleast since the legendary flood <strong>of</strong>1862, and its peak discharges andsediment yields have been widely usedas standards <strong>of</strong> flood magnitude and ascriteria for impoundment structures.. . ."In both the 1969 storm periods, surfacesaturation occurred we1 1 beforethe most intense precipitation, Similarantecedent conditions existed duringthe 1938 stom and can logicallybe assumed to recur during any futuremajor stom."Once soil is saturated, no matter whatthe soil type or cover is, a71 subsequentprecipitation will run <strong>of</strong>f, Consquently,the same intensity <strong>of</strong> rain will yieldmuch greater peak run<strong>of</strong>fs after saturationthan before. Although the reiationshipis anythinq but direct or precise,analyses made under local conditionssiiggzst that sediment yief d f; 2 F~";nctior:<strong>of</strong> peak run<strong>of</strong>f flow to the 1.67 power(Scott and Wil 'lfams 1978, citing Ferrel?
1959). If so, a doubling in peak flowwould be associated with inore than atripling in sediment yield. In extremecases, soil saturation on steep slopesmay result in slope failure and slumping,partly accounting for the extremesediment input to places like Mbgu<strong>Lagoon</strong>.Steffen (1982) pointed out one additionalfeature <strong>of</strong> the tirning <strong>of</strong> precipitationin this region that is inherentlyinteresting and bears on this matter <strong>of</strong>sediment yield. Bui 1 ding on Troxel l andH<strong>of</strong>mann's (1954) interpretation <strong>of</strong> variationsin tree-ring width as evidence <strong>of</strong> along succession <strong>of</strong> a1 ternating wet anddry periods from 1385 to the present inthe Los Angeles region (Figure 6),Steffen suggested the high li kel ihoodthat major storms at the beginning <strong>of</strong> awet sequence (median length 12 yearsduring 1385 - 1954) would cause much moreerosion. He based this conclusion on theobservation that the condition <strong>of</strong> thevegetation would be worst at the end <strong>of</strong> adry sequence (median length 15 years overthe same time span) but would improverapidly during a wet sequence, thereafterlessening the erosive impacts <strong>of</strong> storms,2.3 HYDROLOGYRun<strong>of</strong>f is rapid in the <strong>Mugu</strong> <strong>Lagoon</strong>watershed because so much <strong>of</strong> the watershedis steep, yet low enough in elevationthat precipitation is not stored assnowpack. <strong>The</strong> rapid run<strong>of</strong>f, coupled withthe concentration <strong>of</strong> rainfall into a fewmajor stonns usual ly separated by dryspells <strong>of</strong> a few to several weeks, meansthat there is little or no surface flowin the lower reaches <strong>of</strong> local streamsexcept during and immediately afterstorms. Almost all freshwater inflow to<strong>Mugu</strong> <strong>Lagoon</strong>, therefore, occurs fromNovember to April (Figures 5b and 7a);even within that winter period, mostfreshwater inflow is concentrated in afew pulses (Figure 7b). <strong>The</strong>se gluts <strong>of</strong>freshwater during storms can carry vastamounts <strong>of</strong> suspended material that, inturn, can be deposited in the stillwaters <strong>of</strong> the lagoon. <strong>The</strong> concentration<strong>of</strong> freshwater inputs in rare but extreme1 IPrec tprtat~nn at Los Angeles,IFigure 6. Wet and dry perjods in southern <strong>California</strong> (fromTroxell and Wufmann 1954),14
Figure 7. Streamflow in Calleguas Creek: (a) mean flow in different months 1969-77, 1978, and 1980; (b) mean flow by day in 1980 (from <strong>USGS</strong> records for the gaugeat Camaril lo State Hospital ).events is responsible for some strikingeffects which will be discussed after thebiota has been introduced. Here, itwill suffice to say that the freshwaterinput to <strong>Mugu</strong> <strong>Lagoon</strong> cornpl etely flushesthe lagoon for short periods <strong>of</strong> timerather than creating a longitudinal salinitygradient that moves up or down theestuary as the freshwater input changesseasonally. During the remainder <strong>of</strong> theyear, the lagoon is completely marine.<strong>The</strong> preceding general ization is notapplicable at the very mouth <strong>of</strong> Cal leguasCreek. Agricultural irrigation and sewageplant return waters make for a continuous,small input <strong>of</strong> freshwater.Because much <strong>of</strong> this water comes directlyfrom intensively cultivated lands, toxicsubstances and nutrients could affectwater quality. Little information onthis problem or this part <strong>of</strong> the lagoois available (see Section 7.3).<strong>Mugu</strong> <strong>Lagoon</strong> continues to be marinedominatedmost <strong>of</strong> the time, even since ithas become an estuary. <strong>The</strong> tides are responsiblefor the majority <strong>of</strong> day-to-dayinputs and removals <strong>of</strong> materials. <strong>The</strong>tidal prism (volume <strong>of</strong> water moved in andout <strong>of</strong> the lagoon by the tides) is largecompared to the volume retained at lowestwater, Persistent southeast longshorecurrents prevail along the coast in thisregion. This assures that very little <strong>of</strong>the water departing the lagoon on the ebb
tide is returned on the Sol lowing floodtide; i,e., the saw water nass is notunder the inf'luence <strong>of</strong> lagoonal conditionsfor long.<strong>The</strong> tides thmselves differ frcxn onetide to the next (mixed semi-diurnal patterncharacteristic <strong>of</strong> this coast), frmweek to week (spring-neap a1 ternation),and from season to season (higher highsand lower lows in summer and winter thanin spring and autumn). <strong>The</strong> rnaxirnunl tidalrange is 3 m. A sill at approximatelymean sea level at the mouth <strong>of</strong> the lagooneliminates changes in water l eve1 belowmean sea level within the lagoon andreduces the maximum tidal range <strong>of</strong> thelagoon to 1.7 m above mean sea level(Figure 8). Consequerttly, on some neaptides the volume <strong>of</strong> water exchanged isnegligible, whereas on spring tides it ismore than three times the volume retainedat low water, at least in the eastern ann(Onuf and Quammen 19831, Not on1 y areupper intertidal areas submerged less <strong>of</strong>the time than lower intertidal areas, butalso the interval between their subn~ergencesbecomes increasing 1y variable.<strong>The</strong> lowest intertidal areas are submergedat least once a day, whereas at+1.5 v lZLLW (Mean Lower tow Water, thelong-term average e?evation <strong>of</strong> the sea arthe lower low tide each daysthe standardtidal datum <strong>of</strong> the region), periods <strong>of</strong>consecutive daily submergence lasting 4to 25 days are separated by 1- to iidayperiods wi thout submergence, At+2.0 rn MLLW, 2- to 7-day periods <strong>of</strong> consecutivedaily submergence are separatedby as few as 7 to as many as 56 dayswithout submergence. <strong>The</strong>re js little orno la5 in the times <strong>of</strong> spring high tidesbetween ocean and lagoon; however, theremay be more than an hour's difference inthe timing <strong>of</strong> high tides during otherportions <strong>of</strong> the lunar cycle.Because <strong>of</strong> the relatively large tidalexchange <strong>of</strong> water within the lagoon most<strong>of</strong> the time and the narrow opening to thesea, currents are fast near the mouth.Currents were measured at 3.7 km/h on aneap tide, and were estimated to be morethan 10 km/h on spring tides (Wanne1971). <strong>The</strong> sill at the mouth has theeffect <strong>of</strong> ~rolonging the ebb portion <strong>of</strong>eFloodfng and drainage;rbove 1 5.11'1 (laturn \+1.5mMSL + 0.7mMLLW 0/ Fioodin(] ,and dra~rlancr ~n the irlooon,I -i 1July 6 / July 7 1 July 8 July 9MSL = mean sea levelMLLW = mean lower low waterFigure 8. Tidal curves for several days in June and July 1981. (A) Curves forspring tldes, showing times <strong>of</strong> flooding and drainage in the lagoon and times <strong>of</strong>fJoocifrag and drainage above the 1-5-m datum, the approximate lower boundary <strong>of</strong> thesalt marsh. (B) Times <strong>of</strong> flooding and drainage dcring neap tides (from <strong>National</strong>&@an Survey tidal curves for Outer Los Angeles Harbor),
tddai cycles and shortenin2 the floodoortion, ,vhlc!~ h turn is respons!bie forhigher velocity currents or^ +load thanebb tides (i,e,, the same volume <strong>of</strong> water!nust enter in less time), <strong>The</strong>se currentsare turbulent and ~rovide good mixing,:n the open expanses <strong>of</strong> water away fromthe mouth, tidal currents are slow andare probably jnsuffl'cient to cause muchmixing. However, these areas are snal-'ow. Yovements <strong>of</strong> water generated byeven light breezes apparently are sufficientto cause mixing. In hundreds <strong>of</strong>dissol ved oxygen determinations <strong>of</strong> watercoliected near the bottom a'n conjunctronwith primary productivity studies,anaerobic conditions (signifying noinixi ng) were never encountered (ShafferP982),2.4 THE PHYSlCQCHEMlCAk ENVIRONMENTWater Temperature<strong>The</strong> physicochemical environment isstrongly under the influence <strong>of</strong> thenydrol ogical regime. <strong>The</strong> inoderate temperatures<strong>of</strong> the ocean at the mouthgovern the temperatures wi thin the7 agoon. Surface water temperaturesmeasured at Zuma Beach, approximately25 km to the southeast, range from 13°Cto 18°C (monthly means), 12°C to 21°C(mean monthly maxima and minima), and g0Cto 22°C (absolute maximum and minimum)(Cal ifornia Water Resources Control Board1979). Secause <strong>of</strong> the rapid tidal flushing<strong>of</strong> the lagoon, factors operatingwithin the lagoon are <strong>of</strong> secondary importance.However, in the shallower andmore landward subtidal areas, air temperatureand insolation become increasinglyimportant. Of course, at thesurface in the intertidal zone thesefactors have to predominate when the tideis out. For the emergent vascular plants<strong>of</strong> the salt marsh, this will be the greatmjority <strong>of</strong> the time.'tlo systematic measurements <strong>of</strong> watertemperature within the lagoon nave beenqade to evaluate the extent that airtemperature, insolation, and depth influencetemperature; however, two data setszuggest thst the modify in^ effect <strong>of</strong>shal low depths can be substantial.di l son (1980) made hourly measurementsir; the middle <strong>of</strong> the sand channel ieadkgfrom the mouth <strong>of</strong> the lagoon intothe eastern arm and 45 m away in themiddle <strong>of</strong> a subtidai flat. At low tidethe former was covered by 50 cm <strong>of</strong> waterand the latter by 15 cm. For the 6 mea-surement days (a1 l during summer), midnatertemperatures at the deeper stationalways exceeded those at the shallowerstation at night (12 a.m. - 5 a.m.);during the day (10 a.m. - 3 D.m.1 theshall ow station was considerao7y warmerthan the deeper station. Such temperaturedifferences are striking and surprising,given the rapidly flowing waters<strong>of</strong> the sand channel.DuBois (1981) re1 ated temperaturesmeasured in the inner, broad, open waterpart <strong>of</strong> the eastern arm <strong>of</strong> the lagoon(termed subtidal pond by Harrne [1971])with ocean temperatures near the mouth <strong>of</strong>the lagoon. Even in the early summermornins when lasoon waters would havecooled- to their greatest extent, temperatureswere higher in the lagoon. In thewinter, when aay length is short andinsolation is reduced, water temperaturein the lagoon at night would be expectedto be lower than <strong>of</strong>fshore.Sal i ni tyNo systematic measurements <strong>of</strong> salinityhave been made in <strong>Mugu</strong> <strong>Lagoon</strong>. Giventhe virtual absence <strong>of</strong> surface flows <strong>of</strong>freshwater except during storms, there isevery reason to expect dilution by freshwaterto be brief. <strong>The</strong> abundance <strong>of</strong>long-1 ived stenohal ine marine organismssuggests that even brief dilutions substantiallybelow 34% are rare (Wame1971) ; however, dilution by freshwaterwas almost certainly involved in the die<strong>of</strong>fs<strong>of</strong> the sand do1 lar Dendraster+-excentricusand the bubble shell 3ul la ouf dir- ana In 1969, 1978, and 19Clln ortunatelv.salinity has not been measured atthe (eights <strong>of</strong> khe storms when the reductionswere greatest, <strong>The</strong> only relevantmeasurements were 19 and 28 ppt, I and 2'days respectively, after a 2-crn rainfall,culminating a 16-day rainy spell in whicha total <strong>of</strong> 15cm <strong>of</strong> precipitation hadfa1 leg (pers, observ. 1, Apparently,there is a rapid return to marine con&-tions.
Although <strong>Mugu</strong> <strong>Lagoon</strong> has close tomarine salinities (34 ppt) most <strong>of</strong> thetime, the three major divisions <strong>of</strong> thelagoon must differ somewhat. <strong>The</strong> easternarm is the most nearly marine. it isvirtually without a watershed, beingflanked by a narrow sandspi t on one sideand a steep mountain on the other (a440-m peak within 1.5 km <strong>of</strong> the edge <strong>of</strong>the lagoon). Furthermore, the opening tothe ocean is closer than any long-lastingfreshwater source (Figure 2). <strong>The</strong> centralbasin receives the major inletstream, but this stream is channelizedall the way to its point <strong>of</strong> dischargeinto an artificially deepened area, witha direct path from there out the mouth <strong>of</strong>the lagoon, Only in the western extremity<strong>of</strong> the western arm is a longer-lastinggradational salinity regime likely. Thispart <strong>of</strong> the lagoon is partly under theinfluence <strong>of</strong> the coastal plain. Because<strong>of</strong> the low re1 ief, water runs <strong>of</strong>f slowlyeven through the network <strong>of</strong> agriculturaldrainage di tches in the area (Figure 2).Also, the western part <strong>of</strong> the lagoon consistsmainly <strong>of</strong> emergent marsh and longshallow channels, for the most part notconfined by artificial levees. tlere,freshwater inputs might be triore persistent.Dissolved Oxygen-Dissolved oxygen generally is high inthe waters <strong>of</strong> the lagoon because <strong>of</strong> hightidal exchange rates and shallow depthseasily [nixed by winds, <strong>The</strong> only glaringexception is that reducing conditions<strong>of</strong>ten develop beneath senescent mats <strong>of</strong>the green algae Enterwnor ha and Ulva,both in the d e e p e d the lagoonand in a wrack line at the edge <strong>of</strong> themarsh in late summer. This affects theunderlying sediments btr'i anpa rent1 y doprlittle to the overlying water.- Bottom SedimentsWarme (1971) and Biddle (1976) describedthe sedii~lent characteristics <strong>of</strong>the eastern arm <strong>of</strong> <strong>Mugu</strong> <strong>Lagoon</strong>. <strong>The</strong>re isno systematic appraisal <strong>of</strong> the rest <strong>of</strong>the lagoon, Within the edstern an twosediment gradients exist. Generally,sediments become firrzr grained frwu, westto east (increaslng distances front themouth) and south to north (frm tile sand-spit, across the subtidaf "ponds," andacross the salt marsh), <strong>The</strong> west-eastgradient is a function <strong>of</strong> the reducedvelocities <strong>of</strong> tidal iy generated watercurrents at greater distances fron~ themouth. <strong>The</strong> south-north gradient is theresult <strong>of</strong> a composite <strong>of</strong> factors.<strong>The</strong> south shore <strong>of</strong> the lagoon is enrichedin sand over what it would otherwjsebe by occasional overwash <strong>of</strong> materialfrom the ocean beach. This happenswhen exceptionally high surf coincideswith spring tides. Initially, the input<strong>of</strong> new sand is restricted to a smalldelta projecting into the lagoon, Subsequently,that sand is distributed bythe longshore tidal currents along thewhole south side. Even in the deepestparts <strong>of</strong> the subtidal ponds, sand (particles>63 urn in diameter) predominateover mud (Wanne 1971). This suggeststhat water movements are strong enougheven here to keep fine particles in suspensionor remobilize them. <strong>The</strong> otherpossible explanation is that the source<strong>of</strong> fine particles is small compared tothe source <strong>of</strong> sand. Aeolian deposition<strong>of</strong> sand by wind may explain further theprevalence <strong>of</strong> sand in the middle <strong>of</strong> thesubtidal ponds.Silts and clays predoininate only in thesalt marsh or in bare areas and depressionswithin the salt marsh (Warme 1971).Here, tidal currents are weak, becauserelatively smaf 1 volumes <strong>of</strong> water arepassing over any given point in a tidalcycle. Furthermore, the vegetation bafflescurrents and reduces the turbulenceassociated with waves that otherwisemight cause the suspension and removal <strong>of</strong>fine particles. (This analysis isfounded on the low input <strong>of</strong> fine sediments,in the aftermath <strong>of</strong> major stormcauseddeposition <strong>of</strong> fine sediments in1978, it is no longer applicable, as willbe described later.)Solar RadiationIn addition to its considerable influenceon the temperature regime <strong>of</strong> ashaf low aquatic ecosystem, solar radi a-tian is even more important as a majorSetcnninant <strong>of</strong> prfnary prodtrctivi ty,Average daily incident solar radiation inthe ph<strong>of</strong>osynthetical 1 y artive region
(PA?., a~arox~matei: RaIF c" ehr totalinciaen: enercjy ir the vislble saeccruvgrange-: fie; 15 Er~steins Qf ' per P-' ~e\-< - 7-1.aa:tm2 P " L ~n Decembe- 12 52E P 2 - I** hay (Shaffer and 0nr:f 19L;:,:,F'agilr~ 9 , difference ir daj 7anntsfron 1'' xs 4,- h accounts foh- 27% :lf tbcIncrease, ani th6 higher i~te?slrv 3;sola- raslatso. caused bj the big?@-an9.e or IQCIQ~~CE dur-ing th; susnmcaccounx>top mas: <strong>of</strong> the re"U, C3ai#!covnr snc ~ t atte~dant seffe~t- s31aaradSat:or. snowec rmaskabiy i-itsvl2 wX9jatlor.over the year, eve? tha,iafis a!precipitat~o-r 7s s q-the wknter ;F?cj~:r~Y,, 1 ~ J s~z' Sr varjatiori is bectiusc fog;are ~rnrn0~ :I* tile summer, Fo' owqanfsmsiv tho_ water :c,~);w? and an E~F- ~~ttot t ,tcarbiai ty at-tenuat.es the I-FIJ~ c '~rthel-,rn prcrnort~or, i-3 ehe c~n:entr?~ctort o-SGsDended mattes ana depW effec'7 5 greates L nveVs unconso Yiadtel mudaybottoms ana leasr, ove~x~ancl [Shafrer at-$-1Onus 1982 I *Nutrient;No dat3 are avaigable on nutrient copcentrationi~ tne water column or irtsediments, Inferences a~out the nutrientregime are deferred ts Section 5.6, afterotber infonnat13r about the ecosystem hasbc@n presentee ,Figure 9. Meah daiSy solar radiatios; i~E~nste~ns (from Shaffer and Qnuf 19851 andsky cover (10-year average, January 1965tnrougb Decein~er 1959; from de Vio'lini1975) In different months,
CHAPTER 3. PHYSiOGRAPHYAt <strong>Mugu</strong> <strong>Lagoon</strong>, the steep gradients inphysical factors where land, sea andfreshwater meet create a wide spectrum<strong>of</strong> different living environments in asmall geographic area. <strong>The</strong> gradientsthat interact to create a mosaic <strong>of</strong> differenthabitat types were described inthe preceding chapter: current velocities,substrate texture, light, elevation,time <strong>of</strong> submergence, salinity(occasional ly) , and temperature. Because<strong>of</strong> large changes in some <strong>of</strong> the factorsafter a major storm in 1978, the physiography<strong>of</strong> <strong>Mugu</strong> <strong>Lagoon</strong> is described inthis chapter in two parts: before 1978and after.3.1 STRUCTURAL COMPOMENTS-BEFORE 1978<strong>The</strong> major structural features <strong>of</strong> the<strong>Mugu</strong> <strong>Lagoon</strong> ecosystem are the: (1) tidalinlet and delta, (2) subtidal channels,(3) subtidal ponds (Warnie 1971) or pemanentopen water, (4) tidal flats, (5)tidal marsh, (6) tidal creeks, (7) saltpans, (8) natural adjacent upland (barrierspit), (9) adjacent upland that isdisturbed open space, (10) developedadjacent upland, and (11) the nearshorePacific Ocean. Features 1-7 are exclusivelypart <strong>of</strong> the estuarine ecosystem,whereas Features 8-11 are only marginal lypart <strong>of</strong> the estuarine ecosystem. Adjacentuplands are divided into three categories(Features 8-10], because they havedistinctly different re1 ationships withthe aquatic part <strong>of</strong> the system. <strong>The</strong>serelationships will be discussed only inthe most general terms, Feature 11 isimmense] y more iniportant than adjacentuplands as an influence on the lagoon, asis the influence <strong>of</strong> remote parts <strong>of</strong> thewatershed transmitted by Call eguas Creek.Tidal Inlet and DeltaThis physiographic camponent is characterizedby shal low depths (predominantlyintertidal) , the highest current ve1 ocitiesexperienced inside the lagoon, andconsequent1 y, an unstable bottom <strong>of</strong> sandand shell fragments. Although small inarea at any one time, the inlet and deltaexert an influence over a much largerarea in three ways. First, the inletmigrates along the spit. Second, theelevation <strong>of</strong> the inlet sediment bottomchanges, and with it the depth, duration,and periodicity <strong>of</strong> inundation <strong>of</strong> areasinside the lagoon. Third, the inlet is amajor source <strong>of</strong> sand for the lagoon.All <strong>of</strong> these effects arise from thesame set <strong>of</strong> processes, for the most partoperating outside the lagoon. <strong>The</strong> movement<strong>of</strong> sand along the coast is mostlyfrom northwest to southeast. Littoraldrift <strong>of</strong> sand along a beach occurs whenwaves approach at an angle rather thanperpendicular to the coast. Westerlywinds strongly prevail in this regionmost <strong>of</strong> the time, as do the waves thatthey generate. Furthermore, the southwardcurve <strong>of</strong> the coast farther east(Figure I) and the islands <strong>of</strong>fshore blockor moderate the impact <strong>of</strong> waves arrivingfrom other directions. In consequence,sand originally supplied by the Venturaand Santa Clara Rivers is deliveredalmost continuous1 y (but in varyingamounts depending on wave conditions) tothe northwest bank <strong>of</strong> the tidal inlet.This bank builds out into the channel,and accordingly, the southeast bank musterode if the same channel size is to bemaintained. Hence, the inlet migrates tothe southeast,Of course, the same size inlet channelis not always maintained. For instance,
when periods <strong>of</strong> high sand supply bylittoral drift coincide with neap tides,the tidal inlet can fi'f 1 partly or cmpletely. Under those cundi tions, thesmall volumes <strong>of</strong> water moving through themouth provide insufficient force to clearthe added sand. Subsequent higher tidesfill the lagoon, but less water willdrain out than previously. Greatervoiuines will be retained at low tide;less mixing and exchange will occur,This condition will persist until extremehigh spring tides move enough water fastenough to re-excavate the inlet channel.Littoral drift and inlet migrationassure that there is a considerable movement<strong>of</strong> sand and water into and out <strong>of</strong>the tidal inlet. However, because thespeeds <strong>of</strong> tidal currents are higher during flood than ebb phasc T <strong>of</strong> the samecycle (see Chapter 2), mLre sand entersthe lagoon than departs. This provides asupply <strong>of</strong> new sand to the lagoon andaccounts for the flood-tide delta and theinstabil i ty <strong>of</strong> the sand bottom.Inlet migration at <strong>Mugu</strong> <strong>Lagoon</strong> is part<strong>of</strong> a repeating cycle <strong>of</strong> opening, migration,and closure. <strong>The</strong> fol lowing descriptiondraws heavily on John Warme'sdetailed analysis (1971). As the tidalinlet migrates toward the southeast end<strong>of</strong> the lagoon, the flood-tide supply <strong>of</strong>water for the entire lagoon must passthrough a long and meandering channel.This retards delivery so that relativelylittle water can enter the lagoon beforethe high tide has passed. <strong>The</strong> resultingflows are insufficient to keep the mouthopen, even on spring tides. Consequently,the mouth closes and remains closeduntil winter storms supply enough freshwaterto overflow the barrier spit at its1 owest point. Normal ly, the overflowwill be near the head <strong>of</strong> the <strong>Mugu</strong> SubmarineCanyon because its deep watercauses the refraction <strong>of</strong> waves. Thisreduces their energy when they break onshore nearby, so that the berm <strong>of</strong> thebeach is not built as high there. <strong>The</strong>breach erodes the spit and develops intoa new tidal inlet. Inlet migration proceedssoutheastward until the cycle iscmpleted by another closure,Apparently there were several cyclesduring the 1960is, when the Navy inter-vened to shorten the periods <strong>of</strong> closureby bulldozing a new channel shortly afterthe inlet closed (Warme 1971). Recently,the cycles have been somewhat different:a new tidal inlet formed opposite themouth <strong>of</strong> Caileguas Creek before or justas the old inlet closed, some hundreds <strong>of</strong>meters southeast along the barrier spit.<strong>The</strong> northwest limit for the location <strong>of</strong>the inlet is fixed by the placement <strong>of</strong>riprap along part <strong>of</strong> the spit. <strong>The</strong> presence<strong>of</strong> we1 1 -established dune vegetationbeginning approximately 1 km to thesoutheast indicates that this had beenthe down-current limit <strong>of</strong> inlet migrationfor a long time. Inspection <strong>of</strong> sevenaerial photographs from 1959 to 1979suggests that this was also the mostcommon location <strong>of</strong> the inlet.<strong>The</strong> most recently completed cycle <strong>of</strong>inlet migration did not follow the abovementionedpattern. This time the inletmigrated its usual 800 - 1,000 m betweenFebruary and September 1980, remainedthere through June 1981, and then, instead<strong>of</strong> reinitiating the cycle oppositethe mouth <strong>of</strong> Cal leguas Creek, continuedits movement to the southeast. By August1981, the tidal inlet had moved another150 m, and finally, in February 1982 theinlet closed after moving another 150 m.<strong>The</strong> inlet then reopened 1,300 m to thenorthwest. Before migration ceased, a300-111 strip <strong>of</strong> deeply rooted dune vegetationwas destroyed. Presumably, thisextreme cycle <strong>of</strong> inlet migration resultedfrom a major change in 1980 or 1981 inthe coastal processes that move materialson, <strong>of</strong>f, and along the shore.Subtidal Channel<strong>The</strong> only channel in the eastern arm <strong>of</strong><strong>Mugu</strong> <strong>Lagoon</strong> that always has substantialflow links the tidal inlet and tidaldelta with the subtidal ponds <strong>of</strong> the arm(Figure 10). <strong>The</strong> subtidal channel isquite uniform in width (approximately50 m) but varies in length from 700 to1,400 m according to the location <strong>of</strong> thetidal inlet and de1 ta, <strong>The</strong> subtidalchannel is 10-30 cm deep at low water forthe most part, but occasional depressionsapproach 1 m deep. <strong>The</strong> bottom is morethan 95% sand throughout (particlesgreater than 0.063 mm diameter). Maximalcurrent speeds have not been measured
:ie ?is$:';aa! cnanne?: ;hey are 3r.g-1 y "ess :nan those mat can affect:idal delta wt much yeater thands :$at 3ffect other 3arts ~f *hen :except tie adjacent anzertzda'irhtts), 2iarrents are neve* Powerenoughin any ~ldal cyc;e to $njfte ",an the top *ew layers <strong>of</strong> ";a5ns In the subtidal channel, whereasqore yxtensive a1 tevations areble in a snort time Sn z3e delta,reater stability <strong>of</strong> the srl@strate 117ubtidal channel is very im~rtanto-iota, ds will become apparent In thesbtldal Ponds and Other Areas- f Permanent Open WaterAreas <strong>of</strong> permanent open water make upaout one-fifth <strong>of</strong> the <strong>Mugu</strong> Eaqoon estuarineecosystem; however, only 4heiubtidal ponds <strong>of</strong> the eastern arm havesen described in detail {Warme 1971;'igure lo), <strong>The</strong> greatest depth recorded31 ong Warme \ to~ographic transects was;pproximately -0.3 ft MLLW, which would:orrespond to a water depth <strong>of</strong> approxilately1.2 m at low water in the lagoon,Tidal currents are barely perceptible,except where the subtidal channel emptieslnto the western pond and in the constrictedareas between marsh islands andthe adjacent mainland mrsh. Oftensurface currents generated by the windare more apparent than the tidal currents.Because <strong>of</strong> the slow movements <strong>of</strong>the water, much finer particles can anddo settle out than in the inlet, delta,and channel envi roments,<strong>The</strong> hydrodynamic environment allows forthe accumulation <strong>of</strong> fine particles in thesediments in the subtidal ponds; nonetheless,sand continues to dominate evenhere. Sand content ranged from 50% to90% by weight in "dame's (1971) samplesfrom the subtidal ponds. In addition,the finer particles were confined to thesurface layer (Figure 11). Finally, therewas a dearth <strong>of</strong> intermediate sizes (evidentin the abrupt change in slope <strong>of</strong> thecurnula tive percentage plots <strong>of</strong> grain-s izedistribution; Figure 11),<strong>The</strong>se characteristics suggest severalthings, First, two different sources <strong>of</strong>sediments and mdes <strong>of</strong> their introductio?1 I->, 5 2 3 4 5 0 7 8 9 1 0+- - Sand --I -- Silt -------I - Clay -Figurre 11. Variation in substrate texture~ith depth from a core taken in the middle<strong>of</strong> the eastern pond <strong>of</strong> the eastern arm,Nugu <strong>Lagoon</strong> (modified from Warme 1971).Snto the ponds are Implicated. Otherwise,fractions <strong>of</strong> ~ntermediate sizewould be more evident. <strong>The</strong> sand fractionhas its origin in the barrier spit andmay be delivered by the wind. Certainly4t is not carried suspended in the water.<strong>The</strong> predominantly clay fraction is terrigenousin origin, delivered to thecentral basin by Calleguas Creek and bytidal currents into the subtidal ponds <strong>of</strong>the eastern am. Although coarser materialundoubtedly is delivered to the centralbasin, the tidal currents are sufficientto transport only the fine fractioninto the ponds <strong>of</strong> the eastern arm.<strong>The</strong> second conclusion to be drawn fromthese observations ds that the supply <strong>of</strong>fine particles 3s small, at least relativeto the supply <strong>of</strong> sand. Otherwise,fine particles should predominate, atleast in the surface layers. (<strong>The</strong> predominance<strong>of</strong> sand at greater depths mightonly reflect a different depositionalenvironment in prlor times, such asancient beach or dunes In existence beforethe formation <strong>of</strong> the lagoon.) <strong>The</strong>only other possibility is that the depositionalenvironment is not what it seems;i.e., the "normal" situation <strong>of</strong> slow, weakwater movements is violated <strong>of</strong>ten enoughQ by great water t;u rbul ence generated by
high winds?) or is sufficiently modified(by activities <strong>of</strong> organisms?) to yield asediment in some ways more characteristic<strong>of</strong> a higher energy environment, ThisTatter a1 ternative 1 be consideredlater.Expanses <strong>of</strong> permanent open water in thecentral basin and the western arm <strong>of</strong> <strong>Mugu</strong><strong>Lagoon</strong> differ from the subtidal ponds <strong>of</strong>the eastern arm in shape and other characteristics.<strong>The</strong> dredging <strong>of</strong> the centralbasin, the central basin's role asreceptacle for the discharges <strong>of</strong> the onlymajor inlet stream, and the separation <strong>of</strong>most <strong>of</strong> the central basin frm the barrierspit (the source <strong>of</strong> sand) all shouldmake for dl fferent environments thanthose just described for the eastern arm.<strong>The</strong> western arm has an almost uniformwidth frcnn end to end except where acauseway constricts water to a narrowculvert system, and no direct communicationwith the barrier spit. Thissuggests that the western arm will bemuch mddier than the eastern arm becausethe culverts restrict tidal exchange andbecause no supply <strong>of</strong> sand is availablefrom the barrier spit.Tidal FlatsIn the eastern arm, the tidal flatsadjacent to the subtidal channel aresubject to fast currents and are sandy,while those adjacent the subtidal pondsare subject to slow currents and havelarger fine fractions, In both cases,the sediments are coarser on the barriersplt side than on the mainland side. Inthese ways the different kinds <strong>of</strong> tidalflats have much more in common withadjacent subtidal areas than with eachother, In the western arm, tidal flatsare predominantly silts and clays.<strong>The</strong> botta <strong>of</strong> the inlet to <strong>Mugu</strong> <strong>Lagoon</strong>is at approximately mean sea level.Immediately outside the inlet the time <strong>of</strong>tidal exposure increases continuouslywith increasing elevation, starting atzelno at lowest low water (approximately-0.6 m MLLW), <strong>The</strong> distinction betweensubtidal and intertidal is blurred by thesurf. In contrast, everywhere inside thelagoon the time <strong>of</strong> subaerial exposurejumps dlrectly from zero to several hoursat the subtidal-intertidal boundary,because the water level jns'ide the lagoonremains at niean sea level the whole timethat the tjde is Delo~ mean sea level inthe adjacent ocean, <strong>The</strong> boundary is notblurred much by waves washing up theshore, Above this boundary the tine <strong>of</strong>subaeri a1 exposure increases continuouslywith increasing elevation. Thus, thereis no rarely exposed low intertidal zonein the lagoon. Being anywhere in theintertidal will mean at least severalhours <strong>of</strong> exposure for each tidal cycle.A1 though the differences between exposedand submerged conditions virtually di s-appear only a few millimeters into thesubstrate, they constitute rigorousphysiological chal lenges to the biotaconfined to the surface.Tidal Marsh<strong>The</strong> dominant feature <strong>of</strong> the tidal marshis its vascular plants. <strong>The</strong> plants areterrestrial in origin; hence, it is notsurprising that the marsh is confined tothe upper part <strong>of</strong> the intertidal, wheretime exposed to the air exceeds timecovered by water. Macdonald (1977) definedthe lower limit <strong>of</strong> the tidal marshas the elevation where time <strong>of</strong> maximumcontinuous submergence rises sharply froma level <strong>of</strong> about 7 h (Figure 12). Currentsare slow in the marsh and are lessat high elevations than low. Also, thevegetation retards flow and virtuallyeliminates wave action at the sedimentsurface. Consequently, some <strong>of</strong> thefinest sediments in the lagoon are foundhere. Nothing is known about the conditionsin the marsh surrounding thewestern arm; however, the gradient towardfiner sediments at higher elevations maybe reversed on the south side. Since themarsh is adjacent to the barrier beach,overwash and wind will supply largequantities <strong>of</strong> sand to the higher elevationshere, except where development hasel iminated the zone <strong>of</strong> contact (Figure10).Tidal CreeksTidal creeks de1 iver water to and frainterior parts <strong>of</strong> the marsh, <strong>The</strong>re arefew at <strong>Mugu</strong> <strong>Lagoon</strong>, presumably becausethe marsh is narrow, being either confinedby a mountainside as in the easternarm or by artificial fill as in the
MHHW = mean hiahet high waterMLMVd -; mean iower high waterM~LW = meair Eovverlow waterSa! t Pans<strong>The</strong>se features are in the highest part<strong>of</strong> the intertidal zone in the one area <strong>of</strong>low slope that has not been altered byhuman activities (Figure 10, northeastfrom the central basin). Pans are locatedat an elevation approximately 2 mabove MLLW and are very rarely inundatedby tides. <strong>The</strong> highest are only reachedby storm tides. Uater stands in the pansfor long periods. <strong>The</strong>refore, there isconsiderable evaporation, leaving thesalt behind and at the surface. Even ifprecipitation were more important thanthe tides in supplying water, the saltswould still be left at the surface, thusaccounting for the name "salt pan" andthe absence <strong>of</strong> persistent vegetation.Elevation above MLLWFigure 12. Duration <strong>of</strong> maximum tidalexposure (E) and submersion (Sl=Nov.1964; Sz=Jan. 1965) for Mission Bay Marsh(adapted from Macdonal d 1977).western arm. Creeks are best developedin the marsh surrounding the western arm(see frontispiece). <strong>The</strong> bottoms <strong>of</strong> thetidal creeks can be as much as 1 m deeperthan the adjacent marsh in their lowerreaches and are subtidal (Warme 1971).Smaller creeks and the heads <strong>of</strong> thelarger creeks differ less in elevationfrom the marsh and are intertidal. Currentsin the creeks, especially currentsin downstream portions, are faster thanin the adjacent marsh. Consequently, thesediments should be coarser. Samplesfrom a creek and from the marsh 75 maway were 33% and 6% sand, respectively(Warme 1966). Most <strong>of</strong> the tidal creeksare short (~0.5 km) because the saltmarsh is narrow. <strong>The</strong> only long tidalchannel extends a~proximately 4 km westfrom the western arm <strong>of</strong> the lagoon (Figure10).S i l t predominates in the salt pans andareas <strong>of</strong> high marsh immediately adjacent,unlike all other locations sampled in theeastern arm, suggesting the nearby SantaMonica Mountains as the localized source<strong>of</strong> the different sediments (Figure 13).In contrast, the tidal influence is sduncmmon and, when it does occur, soslight, that tidal waters could not carrymuch suspended material (even clays) intothe pans. Other samples relatively richin silts, collected from the heads <strong>of</strong>tidal creeks near the Santa MonicaMountains (Warme 1971), are consistentwith this interpretation.Summary <strong>of</strong> Wet1 and Components<strong>The</strong> tidal marsh has the greatest arealextent <strong>of</strong> a1 1 components <strong>of</strong> the <strong>Mugu</strong><strong>Lagoon</strong> estuarine ecosystem, fol 1 owed bypermanent open water (accounting for lessthan one-third as much) and tidal flats(accounting for less than one-half that<strong>of</strong> open water; Table 2). <strong>The</strong> western armis relatively rich in tidal flats, marsh,and creeks, whereas the central basin isdecidedly poor. In contrast, the centralbasin has much more permanent open water,and the eastern am has almost all thesalt pans.<strong>The</strong>se differences in proportions arehardly surprising in view <strong>of</strong> the topographicfeatures <strong>of</strong> the different parts<strong>of</strong> the lagoon coupled with their ctll turalhistory. Thus, notwi thstands'ng majorlosses <strong>of</strong> tidal marsh to the development
SANDFigurn 13. (a) Sediment triangle and (b: mp snowing simples in which silts wererelatively enriched In surface sediment samples in the eastern am <strong>of</strong> <strong>Mugu</strong> <strong>Lagoon</strong>(adapted from Wame 1965. 1971).
-"Tabde 2. <strong>The</strong> strilcturdl ca7pa~ents 01 tbap P~l?agii <strong>Lagoon</strong> estuarine ecosystm: theirar.p,rl fir16 Jistp? biit-ioi: wi th-in the ecosys ta7 j subtidal and intertidal cmpormencs 1~n,! tLte irnjtit <strong>of</strong> ~ d GK q ;?tljaccnt ~ upland, (8dsed priialarily on Figure 10,)-_- _. ll_l_.p--l-. -"! <strong>of</strong> the total for the wholelagoon Iyinq within:4r2a I : <strong>of</strong> Eastern Central WesternCanaonen t (ha) k t ) total arm basin a rin----we-*Ti : sub tidal and intertidd; 597 100 2 2 16 6 2: ILi,+l inlet and d ~ td l'1 1 100Su'atiJfll cblanncl 1 100Sub3 dsl ponds or prirwr-i~n+apcn wdta- 111 19 19 54 32Tidal flats 51 Y 17 15 68T ti a 1 iF:d YS 11 38 T 64 18 5 77Tidal creeks 11 2 18 52Sal "uns 3 2 5 97 3Upland: call 22.2 100 2 4 P 1 6 5Natirral (barrier spit) 5,9 2 7 34 8 58ilis turbed operz space 7,11 35 10 21 63Devcl oped 5.9 27 Oa 298?io irtteraction with wctl~ndr 2,G I? 100 i) 0dMort <strong>of</strong> the upland edge on the Idntfwar;! side <strong>of</strong> the eastern a:?n is excludedbecause it was always so steep a\ t3 haw little role in the estuarine ecasystetn.<strong>of</strong> the Ndvai Air Statjon, the Iloodplai~isetting <strong>of</strong> the western ant1 still feadsco CI prevdlence <strong>of</strong> intertidal ccmnpon~ritsccanpiircd to the undeveloped eastern anti,v h is pressed against a mcrntainiank, Prcsurnably, sa 1 t pans were $:rev--aierlt atthe upper fringe <strong>of</strong> tnc mrsh-q thc western ann, but Mere filled vrhentw base was constructed. In the centralnasTn, dredging eliminated the lowerparts 9F the intertidal, while fil 1 clirnrnatedtne upper parts. <strong>The</strong> conseqdcnccwas the overwhelming predominance <strong>of</strong>oennanent open water there,<strong>The</strong> three categories <strong>of</strong> adjacent ualannshave distinctly different relationswith the aauatic components <strong>of</strong> ths cccrsyst;an.Adjacent itpaand irr a nearlyrlat~~nra? condition is limited to the bar-rier spit and beach, It is a majorsource <strong>of</strong> sand for the lagoon. <strong>The</strong>coastal rtranrl and dune canmunities onthc spit are important because <strong>of</strong> theirrarity in the region; in addition, theyprovide habitat fov a relatively smalldariety <strong>of</strong> oorganisms that also use thelaqsan. nist.larbed open space, modifiedRy past lliirnao activity such as filling ordi kinrg, may be mowed or disked accasion-?liy, bmt far the mst pa?t is leftlone, 4s ~ith the barrier spit, it providesdl ternative habitat for a ma1 1v3riety <strong>of</strong> organisms that use the lagoon,<strong>The</strong> nrqanisms that use these two kinds <strong>of</strong>up1 and-wetland transitions probably aredl" ffereqt, <strong>The</strong> deveS aped upland, <strong>of</strong>? theother hand, can be a source <strong>of</strong> inpots(pol iutc;r!ts, noise, and rapid novemenl <strong>of</strong>planes, vehicles, and oeople) that myreduce the ut il i ty<strong>of</strong> adjacent wet? andf2r the> biota normally associated withupland-wetland f-i~ges,
<strong>The</strong> amount <strong>of</strong> edge between each kind <strong>of</strong>upland and its adjacent wetland wouldseem to be <strong>of</strong> greater significance thanthe area <strong>of</strong> upland in determining uplandcontribution to the estuarine ecosystem,Obviously, the width <strong>of</strong> the borderingupland also matters, but the use <strong>of</strong> adjacentupland by estuarine organisms probablyis a rapidly decreasing function <strong>of</strong>distance from the edge. Until we knowmuch more about what goes on landward <strong>of</strong>the upland-wetland edge, the length <strong>of</strong>the edge will have to serve as the bestfirst approximation <strong>of</strong> the contribution<strong>of</strong> each kind <strong>of</strong> upland.<strong>The</strong> three major lobes <strong>of</strong> the lagoondiffer radically in amounts <strong>of</strong> the threekinds <strong>of</strong> edge. Virtually a11 <strong>of</strong> thedeveloped edge is in the western arm, andthe eastern arm is proportionately richin natural edge. Despite the concentration<strong>of</strong> development in the western arm,natural and disturbed open space accountfor 60% <strong>of</strong> the upland-wetland edge, <strong>The</strong>role <strong>of</strong> roads is variable. <strong>The</strong> PacificCoast Highway, skirting the northern side<strong>of</strong> the eastern arm (Figure 10), isfringed by a jumble <strong>of</strong> rocks and ana1 ms t-continuous wall <strong>of</strong> vegetali on thatdiffer little frm~ the original border <strong>of</strong>rock rubble and vegetation at the foot sfthe Santa Monica Mountains, <strong>The</strong> heavilyused causeway crossing the western amshould perhaps be regarded as the extremeexarnpl e <strong>of</strong> a developed edge.3.2 STRUCTURAL COMPONENTS-AFTER 1978Sediment deposition caused a drastictransformation in the central basin <strong>of</strong><strong>Mugu</strong> <strong>Lagoon</strong> sometime between 10 March1977 and 16 May 1978. This transf~rmationis illustrated in the series <strong>of</strong>aeri a1 photographs appearing as Figure14. On the former date the central basinwas almost exclusively permanent openwater. Tidal flats were limited to asmall delta at the mouth <strong>of</strong> CalleguasCreek and the delta associated with thetidal inlet. Together they were lessthan one-third <strong>of</strong> the area <strong>of</strong> permanent1977Figure 14.<strong>The</strong> extent <strong>of</strong> intertidal flats in the
open water, By 16 May 1978, the proportio~swere almost reversed, <strong>The</strong>re wastwice as aluch area af tidal flats as <strong>of</strong>open water, Between those two dates wasthe wettest season in the 36 years <strong>of</strong> thePoirt <strong>Mugu</strong> meteorological station, includingone protracted series <strong>of</strong> stormsthat diriy~ed 20.7 cm <strong>of</strong> preejplt8tion fn 9d2js (5-13 February 19781, Effects <strong>of</strong>the stonr? series were not limited to thecentrjl basin. Sediment samples anddeptil 11i7asurements <strong>of</strong> the lagoon ( t h ~easterr, arm in particular) frm theIQtiO's (Wam~e 19661, frm? the !978 stunnperiod (Jill Cermak, Univer5ity <strong>of</strong> <strong>California</strong>,Sdnta Barbara; unpubl, ,c?.), andfrm recent ~ork (Onuf and Qtiar~:~en 1983;Shaffer and Ondf 1983) have a1 locviid us toreconstruct a fairly cmp:e.le description<strong>of</strong> the effects <strong>of</strong> the storri,<strong>The</strong> nlos t obvious cons^ ,uence <strong>of</strong> theston11 was that the bottorri imm=Jiatelychanqed over most <strong>of</strong> the eastern arm frombeing predominantly sandy to being muchfiner grained (Figure 15). Although some<strong>of</strong> the fine material at the surface wassel ective? y removed shortly thereafter,only the sandy-bottomed subtidal channelhad reverted to its former condition bythree li~onths after the storm (Figures 15and 16), Samples collected over a longerperiod on tidal flats bordering the subtidalchannel (Sites 5 and 6, Figure 16)and on inner lagoon subtidal and intertidalareas (Sites 8 through 11, figure16) indicate that the much finer surfacesediments deposited during the stormstill persist in the inner lagoon pondarea but no longer in the channel area(Figure 17).In addition to the sediment changesthat have lasted at least 2 years in thesubtidal pond, the sedimentation a1 so resultedin a substantial decrease in thedepth <strong>of</strong> the lagoon. If it is assumedthat all the change in elevation betweenWanne's (1971) original topographicaltransects in the mid-1960's and the resurveying<strong>of</strong> the same general areas in1979 resulted from the February 1978storm, then Figure 18a shows the extentand distribution <strong>of</strong> filling caused by1978central basin <strong>of</strong> Mu9u <strong>Lagoon</strong> in different years,29
coarse to rnt~rmediaternterrrteniate to flnel~tEle rnsnj,ecoarse to faneFigure 16. Sediment-sampl in9 sites andareas <strong>of</strong> the lagoan with similar sedl":m?i'ttchanges in response to the mjo~ stom <strong>of</strong>February 11478, See F-igure 15 for examp1es <strong>of</strong> the sediment-size distributions<strong>of</strong> the different areas over time,Figure 45, Sediment texture before,during, and after the major series <strong>of</strong>stows in 1978; sites grouped accordinto similar histories <strong>of</strong> change. (a?coarse to fine; (b) coarse to internedlateto coarse; (c) intermediate to fine;(d) little change. Sample sites areshorn in Figure 16.Figure 17. Changes in surface-sediment texture at sites in tbe tidal channeland western pond (near sites 5 and 6, and sites '9, 10, and 11 <strong>of</strong> Figure 16,respective1 yf <strong>of</strong> the eastern an, &gu <strong>Lagoon</strong>,
Figure 78. Changes in depth <strong>of</strong> the eastern arm <strong>of</strong> <strong>Mugu</strong> <strong>Lagoon</strong>, caused primarily by thestorms af (a) February 1978 and (b) 1980.that storm, According to this analysis,the average depth <strong>of</strong> the lagoon (at lowwater) has decreased approximately 13 crn(252), and the deepest areas were fill edthe mst,Any cmpari sons between surveys ,mde soman3 years apart contain uncertainties,Confidence in the interpretation that theone stom accounted for mst <strong>of</strong> thecharge tier ires irmi the close agreementbetween the bathymtric changes inferredfrm surveys made many years apart andthe few direct naeasurments <strong>of</strong> the newtrwd layes made in the same locations, Inthese cases, we know from sampf es co9-7ected as few as 17 days before the stormand collected again at the same sites asfew as 3 aad 43 days after the stom,that approximately 10 cm <strong>of</strong> loose1 y cansolidatedpure mud (over 90% by weight4l.063 m in diametter) had been depositedon top <strong>of</strong> a compacted mddy sand (
Figure 19. <strong>The</strong> relationship <strong>of</strong> the eastern arm <strong>of</strong> <strong>Mugu</strong> <strong>Lagoon</strong> to inputs fromCal leguas Creek under different tidal conditions.appear that this is a necessary but notsufficient condition for storm-causedsedimentation in the eastern ann.(2) <strong>The</strong> earlier storms occurred duringtimes when the erosion potential <strong>of</strong> thewatershed was low. Erosion, and consequentlythe sediment load <strong>of</strong> streams,will be highest when the watershed isalready near saturation before the rnajorstorm and when the vegetation <strong>of</strong> thewatershed is in poor condition after asuccession <strong>of</strong> dry seasons. Both the 1978and 1980 storms were preceded by unusuallywet months, while both the 1962 and1969 storms were preceded by months <strong>of</strong>normal or subnormal precipitation. <strong>The</strong>condition <strong>of</strong> the vegetation in responseto prolonged drought is harder to assess.Steffen (1982) proposed the ciimulativedeviation from the long-term average precipitationas a meaningful measure <strong>of</strong>vegetation condition. Here the criticalfeature is the length <strong>of</strong> time into along-term period <strong>of</strong> drl'er or wetter thannormal condi tions (downward and upwardtrends, respectively, in the plots <strong>of</strong>cumulative deviation from the long-tenaverage precipitation). <strong>The</strong> first 31.years <strong>of</strong> rainfall records for Point <strong>Mugu</strong>show a major drying trend (Figure 20) inwhich wetter than nonnal years are fewand not in succession. Judging from therecords <strong>of</strong> the nearby Oxnard weather station,the beginning <strong>of</strong> the Point <strong>Mugu</strong>record was the beginning <strong>of</strong> this dry period;thus, the major storms <strong>of</strong> February1962 and January 1969 were one-half andthree-quarters <strong>of</strong> the way through the dryperiod, ldhile they were major storms,they certainly did not end the dry spell,That was left for a succession <strong>of</strong> wetterthan normal years beginning 9 yearslater, <strong>of</strong> which the February 1978 and1980 storms were a major and early part.<strong>The</strong>se results suggest that droughtcauseddeterioration <strong>of</strong> the vegetationin the watershed could have contributedto the greater sedi:nentatjo.r resiiltin~from the later storms, This conclusionrequires that vegetation is appreciably
1950 1960 1970 1980Water year beginning July <strong>of</strong>.Figure 20. <strong>The</strong> cumulative deviationsfrm the long-tern mean precipitation(34-year record) at Point <strong>Mugu</strong>, <strong>California</strong>(based on de Violini 4975 and unpublishedrecords), See Figure 6 for longertime series in the region, A downwardtrend <strong>of</strong> points indicates precipitationbe1 cpcs the long-term average ( 1945-63,1968-76); a horizontal series indicatesprecipitation equal to the long-ternaverage (1963-1967); and an upward trendindicates precipi tahion above the longtermaverage ($976-1979).?es% caoable af retardi~tz er~s~o~at~ei adry per;od has been in proares5- -fa. 32years (as in K978), ctarro8re.t cf~ .!J yen?-(35 in 19691, and that ;nore tharl :1 wars<strong>of</strong> above-nomal preci oi tacf3r: r~ts",e.is~nbefore the vegetation improves eco.JgY toretsrd erosion effectively, 2th~rwi 52,major sedimenta"lon should nrz: haw gl:-curred in 1980, Bath r u m q c'wplausible but lack irldepeod.ant vura f ica-i *cl Or1 *.(3) De?ve~opment <strong>of</strong> the waters her1 sincc19G9 resulted in more eriashan that! dupinqthe 4960k.,, Baring soil or} steep r,:o~r?swill certainly accelerate erosion; tnisis happening in the watershed <strong>of</strong> Mugif<strong>Lagoon</strong> on a massive scale (Figure 21) forreasons Stated in Chapter I, This activityhas became much rnore widespread since2969 than before and could account f ~ rthe difference in effects between theearlier and later storms,mrri 21. Aerial ptyotoyr~rpph <strong>of</strong> hiTlsidc devel~pmenl mar Moorpark, Catifcrnia, 1979,34
Chariges T"n land case before znd after196g have been deterinined from maps andphotqrdphs for the part <strong>of</strong> the Ca4 leguasCreek watershed lying within the Moorpark,Cal ifornia, U.S. Geol o~ical Surveytopographic quadrangle (Figure 22). Accordingto this analysis, <strong>of</strong> 211 hi1 lsideareas developed by 1979, 25% had beendeveloped by 1947; another 15% was devef -oped in the 22 years to 1969; and theremaining 60% was developed in only 10years frorn 1969 to 19713, This correspondsclosely to the 'largest area <strong>of</strong>'%hi yh rates <strong>of</strong> accelerated erosion"(caused by human activi ties) identifiedby Steffen (1982) and probably is representative<strong>of</strong> all areas so designated(Figure 23). He estimated that acceleratederosion might account for 40% <strong>of</strong>sediment generated in the Calleguas Creekwatershed and even more in the remaining18% <strong>of</strong> the whole <strong>Mugu</strong> <strong>Lagoon</strong> watershed;therefore, these changes in land useundoubtedly were responsible for largeincreases in the amount <strong>of</strong> sediments thatwere transported to <strong>Mugu</strong> <strong>Lagoon</strong> by majorstonns in 1978 and 1980, compared to 1969and earlier.Flat valley bottoFlat valley bottomFigure 22. <strong>The</strong> extent <strong>of</strong> hi1 lsjde development in one part <strong>of</strong> the watershed <strong>of</strong> <strong>Mugu</strong><strong>Lagoon</strong> at different times (see dashed area in Figure 23).35
High rates <strong>of</strong> accelerated erosion (accelerated by humanactivity)Figure 23. Areas with high rates <strong>of</strong> accelerated and geologic erosion (frm Steffen1982). Dashed lines indicate the area represented in Figure 22.Accmpanyi ng the impacts <strong>of</strong> sedimentationhas been a catastrophic reduction incertain groups <strong>of</strong> the lagoon benthos dueto the reduction <strong>of</strong> salinities. Withincreased development and stonn run<strong>of</strong>f,these catastrophic reductions may becaused by smaller storms than in thepast.(4) <strong>The</strong> central basin had a greatercapacity to receive storm sediments duringthe 1960's. Until 1977 the centralbasin was a large expanse <strong>of</strong> open water(Figure 14) having been dredged approximately10 m deep in the early 1960's.<strong>The</strong> storm flows leaving the narrow confines<strong>of</strong> the levees on Ca1 leguas Creekwould have spread out and slowed at thispoint, perhaps enough so that sedimentscould have settled within the centralbasin rather than within the eastern arm.A ma1 1 delta was present at the mouth <strong>of</strong>Calleguas Creek at this time, and locrsc!mud was observed in the central basin butnot in the eastern arm after the 1962stom (MacGinj tie and MacGini tie 1969).<strong>The</strong> central basin ceased to be a body <strong>of</strong>open water during the 1978 storm (Figure14), after which it ceased to be a sinkfor suspended particulates before theycould reach the eastern arm.This then can explain the differentimpacts <strong>of</strong> the 1962 and 1969 stormsversus those in 1978 and 1980: until thecentral basin ceased to serve as a sedimenttrap, no storm could cause majordeposition <strong>of</strong> fine sediments in the easternarm. This explanation also resolvesthe dilemma <strong>of</strong> why a stonn-dumped layer<strong>of</strong> mud could persist where the bottomcreated by "natural " processes (movements<strong>of</strong> water and air) had been predominantlysandy. <strong>The</strong> subtidal ponds always were aplace where fine material could settleand stay. <strong>The</strong> reason that fine materialconstituted so little <strong>of</strong> the bottm wasthat the source <strong>of</strong> supply was small relativeto the srapply <strong>of</strong> sand from the barrierspit. With the filling <strong>of</strong> the centralbasin, the supply <strong>of</strong> fine materialcarried as far as the eastern arm by
stor~ floi,is has ";creaSc?S and tne zrinouslt<strong>of</strong> fine inaterial deposited on the bottm<strong>of</strong> the eastern ann has increased as w ~ l i ,<strong>The</strong> f;l!jng <strong>of</strong> the central bzsin is theproxin;ate explanation for ti]? aSrupi andlarge chanc;e irr the sedii:le:?t ~"ynairiics <strong>of</strong>r4ugi; i.sg00n in 1978, Howi.ver, the otherthree factors cannot be ig9ot-ed: (I) thei;!?asing <strong>of</strong> stoms with the Yides will&ten-:ine to what extent sedii~ients aretransported into the eastern and wes.ternanns from now on; (2) the condition <strong>of</strong>the watershed in response to the c1 imaticcycle ~i17 determine hw much soil iseroded; and (3) continued development <strong>of</strong>steep hillsides has been and will continueto be a major determinant <strong>of</strong> thesediment supply, <strong>The</strong> supply <strong>of</strong> sedimentswi li probab:y increase as Inore hi? lsidesarc! developed; this will be compensatedfr: part by the vegetative cover duringthe wetter-than-normal period, but thiscondition wil'l be temporary. Filling <strong>of</strong>the lagoon will continue, especially ifstoms coincide with spring high tides.
CHAPTER 4. THE BBOTA:DISVRBBUBION ARID ABUNDANCEChristopher P. OnufandMi1 licent L. Quammen<strong>The</strong> biota <strong>of</strong> <strong>Mugu</strong> <strong>Lagoon</strong> is rich inspecies. Forty-six vascular plantspecies, over 190 species <strong>of</strong> benthic invertebrates,39 fish species, 198 birdspecies, 11 species <strong>of</strong> reptiles and amphibians,and 41 mammal species have beenrecorded in the lagoon and surroundingwetlands (this report; Macdonald 1976b;Natural Resources Management Office, U. S.Naval Air Station, Point <strong>Mugu</strong>, unpubl.list). This a1 lows for a multitude <strong>of</strong>associations and interactions betweenspecies as we1 1 as with the physical environment.In this chapter we provide adescription <strong>of</strong> the spatial and temporaldistribution and abundances <strong>of</strong> the organisms,including the effects <strong>of</strong> the stormalteredphysiography. We leave to Chapter5 the discussion <strong>of</strong> what those organismsdo (especially to each other) and howtheir functioning provides much <strong>of</strong> theorganization that justifies the concepts<strong>of</strong> "biotic community" and "ecosystem."4.1 THE PLANTS<strong>The</strong> plants <strong>of</strong> <strong>Mugu</strong> <strong>Lagoon</strong> range fromsingle cells drifting in the water tosrnall shrubs rooted 1 rn deep or more intothe ground. Some are strictly limitedspltially, while others appear to have no1 i ~ni ts \.~i thin the tidally influenced area.Same achieve such dense cover that theyprovide most <strong>of</strong> the physical structure <strong>of</strong>the envl ronment for other organisms.Others, such as the microbial plants <strong>of</strong>the so-called "barren zone" <strong>of</strong> the tidalflats (Wame 1971), don" even appear tooccupy a site; yet these plants may bealmost as productive <strong>of</strong> new organic matteras the visual dominants and perhaps aremuch more productive <strong>of</strong> organic materialavailable for assimilation by consumers(Peterson and Peterson 1979). Final ly,all vary considerably in abundance or biomassseasonally and over longer periods.In some cases, the overwhelming dominant<strong>of</strong> one time may be hard to find the nextand may be unimportant 1 year later.Table 3 represents one attempt to depictthis variety in a way that displays theobvious patterns. In the body <strong>of</strong> thetable the symbols are an indication <strong>of</strong> therelative importance <strong>of</strong> each plant group ina habitat incorporating trophic (productivity,availability to consumers, nutritivevalue) and structural (influences onthe physical environment, provision <strong>of</strong>habitat for other organisms) considerations.<strong>The</strong> criteria are most objectivefor comparisons <strong>of</strong> the same plant speciesin different habitats and correspondclosely to biomass. Comparisons betweendifferent plant species, especial 1y betweendifferent general categories <strong>of</strong>plants, are necessarily more subjective.Phytoplankton, Benthic Micro- and Macroalgae,and Submerged Vascular PlantsDespite the large extent <strong>of</strong> continuallysubmerged habitats within the lagoon, thecontribution <strong>of</strong> phytoplankton in numbersand bioinass is tiny. This is true evenwithin the water column, the one placephytoplankton might be expected to dominate.This conclusion is based on threelines <strong>of</strong> evidence: (1) Benthic diatoms
Table 3. <strong>The</strong> relative iniportance (see text) <strong>of</strong> different categories <strong>of</strong> plants in thedifferent: hab
UWQI Q).rm L Cr w+J& xr -5a,+-' LIlc -0s a,"LaLaz0yC'eraE m.r '+-
ch!orophy'll 2 per gram dr.y wcfght <strong>of</strong> sediment)at the beginning <strong>of</strong> the study inJune and July 1977, intemedlate and closeto constant (10-15 vgi'g) August throughDecember, very 'low (17 ug/g) in Januaryand February 1978, intermediate again inMarch, and high April - June. This periodwas almost evenly split by the Februarystorm that so radically transformed thebottom <strong>of</strong> the lagoon, so it is not knownwhether the spring increase is representative<strong>of</strong> a "nonna'l" year, <strong>The</strong> winter 1 owis, however, since it was evident inJanuary.<strong>The</strong> short sampling period hampers theidentification <strong>of</strong> stom-related effects onthe benthic micr<strong>of</strong>lora. For June, theonly month sampled before and after theFebruary 1978 storm, chlorophyll a was 60%less in 1978 than 1977, suggesting a substantialdecline in biomass caused by thestorm. However, data for productivity inJuly, to be discussed in the next chapter,lead to the opposite conclusion. Apparently,the drastic transformation <strong>of</strong> thebottom <strong>of</strong> the lagoon from mostly sand tomostly mud did not cause a major change inmicr<strong>of</strong>'loral biomass. In contrast, anabrupt and persistent change in the spectralcharacteristics <strong>of</strong> pigment extracts,interpreted as a change in the ratio <strong>of</strong>chlorophyll a to chlorophylls b and c,between JanuFry and February 1g8 in6-cates a major change in the species composition<strong>of</strong> the micr<strong>of</strong>loral canmuni ty(Figure 24). <strong>The</strong> observed pattern <strong>of</strong> agreat increase in chlorophyll a relativeto chlorophylls b and c is consrstent witha larger propo~tiona~e contribution <strong>of</strong>Chrysophytes, the blue-green component <strong>of</strong>the micr<strong>of</strong>lora (containing chlorophyll aonly) compared to diatoms (containin:chlorophy11s a and c) and green a1 gae(containing c~loroph~ls a, - b, and c)(Parsons and Takahashi 1973). In tur?;,this fits well the observations <strong>of</strong> manyothers that blue-green algae are mostabundant in association with fine sediments(e.g., Rheinheimer 1976).Prior to 1978 the subtidal parts <strong>of</strong> theeastern arm were about evenly split betweendense meadows <strong>of</strong> eelgrass and apparentiybare bottom covered by a micr<strong>of</strong>7araIfilm very heavily dominated by diatoms.For relatively brief periods in the latespring and autumn, mats <strong>of</strong> the rnacroscopi:green alga Entermarpha would grow luxuriantlyalong much <strong>of</strong> the shoreline <strong>of</strong> thesubtida? ponds, both on the t-idal flatsand in the subtidal areas immediatelyadjace~t. Even when drained <strong>of</strong> water,these mats were several centimeters thick,<strong>The</strong> reason for ranking the macrophyteseven higher than the benthic diatoms inTable 3 is that the macrophytes comprisethe entire habitat in the specific situationsnoted. By virtue <strong>of</strong> their huge massand ability to occupy the whole volume <strong>of</strong>the aquatic habitat, not just its solidsurface, their impact probably is considerablygreater than that <strong>of</strong> the micr<strong>of</strong>loralfilm. Trophically, this may not bethe case, although it is difficult to canparethe direct grazing pathways originatingin the micr<strong>of</strong>lora with the indirectgrazingdetrital pathways that are so muchmore important where macrophytes predominate.After the storm <strong>of</strong> 1978, cover by macroalgaeincreased greatly in subtidal areasand remained abundant for much 'longer per-iods in intertidal and subtidal zones. Inthe first year after the storm, Enteromorphaaccounted for the great majority <strong>of</strong>coverage. Since then, has becomeincreasingly abundant and now predominatesoverwhelmingly. It is impossible to discountthe effects <strong>of</strong> the major depositions<strong>of</strong> mud in 1978 and 1980 in bringing aboutthese changes, a1 though the mechanism involved remains unknown.Through 1977, eel grass (Zostera marina)occurred in dense beds coverina aiGi%Zd,,mately half <strong>of</strong> the subtidal area in theeastern arm <strong>of</strong> the lagoon and extendinginto the lowermost part <strong>of</strong> the intertidalzone. Although no determinations <strong>of</strong>biomass and productivity have been made,both must have been large, as attested bythe predominance <strong>of</strong> dead eelgrass in thewrack at the high-tide line and strandedin the marsh (pers. observ.). Eelgrasswas a rwre important determinant <strong>of</strong>habitat characteristics than the macroa1gae, because it was abundant thrslighoiitthe year and widespread in the lagoon,Changes in eelgrass resulting fran theFebruary 1978 stom are relatively easy tointerpret, <strong>The</strong> :ength <strong>of</strong> eelcjrass variesaccording to the depth <strong>of</strong> the water ir;which the plants grow, On intertidalflats and in the shallowest subtidal
dreas, blades general 1 y are less than0.5 m long, whereas in the deepest part <strong>of</strong>the lagoon, their length usually exceedsI m long. <strong>The</strong> shallow-water plants werecompletely buried and apparently suffocated.In deeper areas most plantssurvived the initial inundation, becausetheir greater length insured that most <strong>of</strong>each plant was well above the bottm dl1<strong>of</strong> the time. However, the deep bedsthinned gradually over the next severalmonths until they too were extinct by fall1978. Probably this was the consequence<strong>of</strong> the normal aging and sloughing <strong>of</strong>f <strong>of</strong>the blades already in existence when thesediments were deposited, except in thiscase there was abnormal absence <strong>of</strong> replacement.New shoots develop frm the thickenedbasal portion <strong>of</strong> the plant, ordinarilylocated at the surface <strong>of</strong> the sediments.In ten sets <strong>of</strong> tagged plants that survivedthe initial burial, shoots continued todevelop, only now 10 - 15 an below thesurface (determined by removing the overburden<strong>of</strong> new sediment fran the plants).However, none <strong>of</strong> the shoots reached thesurface, or if they reached the surface,they did not survive the 2 weeks untilthe next observation (Onuf, unpubl .sbserv.) . Apparent1 y, new shoots cannotpenetrate an overburden <strong>of</strong> I0 an <strong>of</strong> anaerabfc sediments.<strong>The</strong> eel grass beds have not recoveredsince. Only a few patches were seen in anaerial survey conducted as recently asSeptember 1986 (R. Dow, U.S. Naval AirStation, Point <strong>Mugu</strong>, Ca1 ifornia; pers.corn*),<strong>The</strong> Lower Marsh VegetationIn cgeneral , Jov Zedler's r~ionoaranh <strong>The</strong>~cology sf ~oufhern Gal i forni a doaswSalt Marshes: A Community Pr<strong>of</strong> lle, a canpanionvolume. resents a mch fulleraccount <strong>of</strong> the emergent marsh than it ispossible to assemble from research conductedat <strong>Mugu</strong> <strong>Lagoon</strong>. Please consul tthis valuable source for topics such aszonatf on and plant-soil relationships,including responses to soil salinity andm<strong>of</strong> sture, Here we confine ourselves toaspects <strong>of</strong> the distribution <strong>of</strong> marshplantbiomass In the eastern arm <strong>of</strong> <strong>Mugu</strong><strong>Lagoon</strong> that have been studied in detail-(Onuf uripubl,). <strong>The</strong>se data nay be noteworthybecause they are unssual corfiyaredto data Fran other locations.<strong>The</strong> riiost obvious feature <strong>of</strong> the lowermarsh is the virtual rnot~ocufture <strong>of</strong> nprr-ennial pickleweed Sal jcornia virginica(Table 3). This trait is cmmon to a71coastal salt narshes from Long Beach tothe Golden Gate, apparently wi th d shgleexception el sewhere in <strong>Mugu</strong> <strong>Lagoon</strong>(Macdonal d and Barbour 1974). Cordgrass(Spartina foliosa) was virtually eliminatedby dredging in the 1950's and 1960's(Macdonald and Rarbour 1974). It ispresent today in four areas <strong>of</strong> the lagoonand is expanding in the western arm (R.Dow, pers. comm.). Zedler (1982) notedthe association <strong>of</strong> Spartina with "wetlandswith a history <strong>of</strong> good tidal flushing";however, this alone is not an adequateexplanation for its near absence from theeastern ann,<strong>The</strong> biomass <strong>of</strong> perennial pickleweed isdifferentiated into succulent green shootsand brown woody supporting stems (Figure25), the brown stems being the largerfraction throughout the year (Figure 26).Even though the succulent green shootscontinuously increased in biomass persquare meter between January and June andmaintained near maximum bi mass throughAugust, there were no detectable changes(by analysis <strong>of</strong> variance) in total biomass(green + 1 ive brown parts) over the course<strong>of</strong> a year, While this partly reflects thegreat spatial heterogeneity af the marsh(see next paragraph), it is more an indication<strong>of</strong> the protracted growing season <strong>of</strong>southern <strong>California</strong> and the large allocation<strong>of</strong> biomass in perennial pickleweed towoody supporting stems. Apparently, theperiods <strong>of</strong> accumulation and death <strong>of</strong> woodyparts overlap so much that net changescannot be detected during the year,despite the strong seasonality in thebiomass <strong>of</strong> the succulent green growingtips.Onuf analyzed aspects <strong>of</strong> the spatialheterogeneity in marsh plant biomass inthe marshes fringing the eastern arm <strong>of</strong>the lagoon. Three features were identified:(1) Marsh plant biomass ms asvariable on a small scale (decimeters) ason a larger scale (meters), (2) Bianasstended ta decrease with distance frm the
lower ?dge <strong>of</strong> the inilrsh (Figure 27), and(3) Biomass patterns as a Function <strong>of</strong> distancefro3 the nrouth <strong>of</strong> the iagoon changedfrm year 'to year from 1978 to 1981,Figure 26. <strong>The</strong> biomass <strong>of</strong> Salicorniavirginica in the lower marsh at <strong>Mugu</strong><strong>Lagoon</strong> in different months.Biomass tended to be high near the mouth<strong>of</strong> the lagoon and much lower far from themouth in 1978. <strong>The</strong> strength <strong>of</strong> this trendprogressively weakened in 1979 and 1980and reversed in 1981, when biomass waslowest near the mouth (Figure 28a). Thisshift in distributional pattern over timewas expressed as a highly significant yearx location interaction in analysis <strong>of</strong> variance,most easily visualized by plottingthe location means for each year as linearregressions <strong>of</strong> biomass vs. distance fromthe mouth <strong>of</strong> the lagoon (Figure 286).<strong>The</strong>se last results provide informationabout the effects <strong>of</strong> major storms on thesalt marsh. Onuf et al. (1981a) interpretedthe higher biomass <strong>of</strong> all locationsFigure 25. <strong>The</strong> dominant plant <strong>of</strong> the salt Meters landward from lower edge <strong>of</strong> marshmarsh, perenni a1 pick1 eweed (Sal icorni avirginica), has succulent green shoots Figure 27. <strong>The</strong> biomass <strong>of</strong> Salicorniayear-round, but the woody brown supporting virgin-ica vs, distance frorii the lower edgestems always constitute a larger fraction <strong>of</strong> the marsh. Means and 95% confidence<strong>of</strong> total biomass,interval s are plotted.
plant growth, whereas deposition on previouslywaterlogged fine sediments awayfrm the mouth actually made an improvementby raislng the marsh surfaceslightly, thus reducing water1 ogging andallowing better aeration <strong>of</strong> roots (Onuf etal. 1981b), <strong>The</strong>se changes may indicate aNEmechanism for succession due to stonn-c sediment deposition, an interpretation.- cnsupported by one other observation: Jaumeag carnosa, a high-marsh plant, invaded thePlow marsh in one location during thisv- mstudy, suggesting an increase in elevationInat that site,Inm5.-m<strong>The</strong> Upper Marsh Vegetation0 1000Distance from mouth (m)Figure 28. An il lustration <strong>of</strong> the years xlocation interaction on the biomass <strong>of</strong>Salicornia vir inica in the lower marsh at<strong>Mugu</strong> <strong>Lagoon</strong> h a n s for the six locationsprogressively farther from the mouth<strong>of</strong> the lagoon for 1978 through 1981; (b)expressed in the form <strong>of</strong> linear regressions.in 1978 over 1979 as a stimulation <strong>of</strong>growth by the major storm <strong>of</strong> February1978, followed by a return to "normal"conditions in 1979. Presumably, the stormstimulated growth either by reducing thesalinity <strong>of</strong> the soil or by addingnutrients via the thin layer <strong>of</strong> sedimentsit deposited. This interpretationremained ger~erally tenable in 1980 withits major storm, However, short-termstimulation was not the explanation forthe biomass increases seen in 1981, whichhad no major storm.Some evidence suggests that the deposition<strong>of</strong> sediments by storms in the easternam may have had opposite effects, dependingon the site and its prestorm characteristics,Deposition <strong>of</strong> new finesediments on what had been a well-drained,re1 atively sandy substrate near the mouthapparently made it less suitable for marshAll information on the upper marsh isfrom one area located approximately halfwaybetween the mouth .and the easternterminus <strong>of</strong> the lagoon. Extensive preliminarysampling indicated that this part <strong>of</strong>the marsh was representative <strong>of</strong> a1 1 <strong>of</strong> themarsh surrounding the eastern arm <strong>of</strong> thelagoon in percentage cover <strong>of</strong> the cmmonspecies,Perennial pickleweed is the major contributorto biomass <strong>of</strong> the upper marsh(Figure 29), but the upper marsh is not amonoculture in the way that the lowermarsh is. Based on the overall annualaverage for ten samples collected eachmonth, perennial pickleweed (Sal icorniavirginica) accounted for 44% <strong>of</strong> total biomass;sea lavender (Limonium cal iforni-- cum), 21%; a1 kali heathiinia jrandifolia), 15%; Jaumea carnosa, 14%; sal twort7ZZi-s marit- r a n d arrowgrass(Tri lochin concinnum), 2%. <strong>The</strong> Go othersjEZkF7hat were collected togetheraccounted for less than 1%: sea-blite(Suaeda cal ifornica) and annual picklewm a l icornia bigelovi i), <strong>The</strong> flora ismore diverse than that <strong>of</strong> the lower marshbut still is relatively simple.It might be expected that a more variedflora would result in a more even distribution<strong>of</strong> biomass over the year, sincedifferent species would reach peak biomassat different times. This is notevident from Figure 29. <strong>The</strong> maxima in Mayand July are twice the minima in Januaryand December, partial ly because specieswithout overwintering woody parts, Jaumeaand Triglochin, are present. <strong>The</strong> erratic
100Jaumea carnosaTriglochin concin~umFigure 29. <strong>The</strong> bicmass <strong>of</strong> canmon plants <strong>of</strong> the upper marsh at <strong>Mugu</strong> <strong>Lagoon</strong> indifferent months, 1977, mean <strong>of</strong> ten 0.06-m2 samples each month,
fluctuations in rrozt species car! be ?;ap?ained by patchiness, <strong>The</strong> fiior-* cdri omoutcane is that Sat i~orrtia v-i ryj rljca -- kiomassimre strorlgfy=a%nal dt ehizelevation than in the low~r i-~ai"c,ti, prlrllar~~~because <strong>of</strong> the sl ightly di fferpnt 31 10~dtion<strong>of</strong> biornass betwe~ri woody r)arfc, andgreen growing tips. Over the year a? awhole, the bimass <strong>of</strong> woody parts is 4,9tirrtec, that <strong>of</strong> green partr in the lowermarsh, as ccxnpdred to 3.6 in the uppr%rluarsh. Thus, the highly seasonal cmlponent<strong>of</strong> perennial picklewced (the qrernshoots) is proportionately greater in theupper riktrsll, but wc have nn idcla why.In the previous sec ti an, ycar-to-yearchanges in the bicrn;a
Fran understanding the rrxchani sms thatbring about these changes, Also, we doriot know how applicable this descriptionfor the eastern ann is to the larger expanse<strong>of</strong> salt marsh in the western ann.Casual observations indicate that the twoareas <strong>of</strong> marsh are similar floristical ly,but that the vegetation is denser andtailer in the western am. On a largerscale, the <strong>Mugu</strong> <strong>Lagoon</strong> salt marsh differsgreatly fran the better-known sal t marshes<strong>of</strong> the east and gulf coasts. Instead <strong>of</strong>dominance by grasses such as Spartina- a1 terniflora, 2. patens, and Juncus roemerianusas in the eastern United States,succulent halophytes such as the - Salicornias,Jaumea carnosa, Batis martima,and ~uaedamfornica, andothermorphologically canplex plants such as Limoniumcal i fornicum and Frankenia grandiflorareva ail. Local and interreqional canpari-kens will be pursued further in Chapter 6.4.2 THE INVERTEBRATES<strong>The</strong>re has been no survey <strong>of</strong> zooplankton,a1 though, 1 i ke the phytoplankton, they areprobably primarily marine species: copepods,cl adocerans, os tracods, arrow worms,and planktonic larvae <strong>of</strong> the benthicinvertebrates (Macdonal d 1976b). Study <strong>of</strong>the invertebrates <strong>of</strong> <strong>Mugu</strong> <strong>Lagoon</strong> has beenintensive but selective. With the exception<strong>of</strong> the MacGinities' (1969) brief summary<strong>of</strong> the biota <strong>of</strong> the whole lagoon,Wolfe et al.'s (1979) analysis <strong>of</strong> 12samples for the western arm, and specieslists compiled from 5 areas in and aroundthe central basin in 1980 and 1981 (SoilConservation Service 1983), reports arelimited to the eastern arm. <strong>The</strong> taxa,preponderance <strong>of</strong> small species, and highdensities (30,000 per inn) reported byWolfe et al. (1979) are characteristic <strong>of</strong>the mudflat environments studied ingreater detail by Quammen (1984) in otherlocations and are consistent with thefine-sediment, 1 ow-energy environmentattributed to the western arm in Chapter3, based on suwerficial observations. Inaddition, high 'densities <strong>of</strong> Tryonia imi ta-- tor, a small brackish-water gastropod, inthe far western end <strong>of</strong> the western arm areconsistent with the prediction in Chapter2 that freshwater inputs would have theirgreatest influence there. <strong>The</strong> sampling <strong>of</strong>the central basin was sampled after mst<strong>of</strong> the subtidal area had been filled bythe major storms <strong>of</strong> 1978 and 1980 (Figure14). <strong>The</strong> large number <strong>of</strong> insect taxareported (Soil Conservation Service 1983)indicates a large influence <strong>of</strong> Cal leguasCreek under the present conditions.Mi thin the eastern arm, macroinvertebrateswith hard parts - crustaceans,echinoderms (sand do1 lars) and especial lymollusks - have received a great deal <strong>of</strong>attention. However, even here, coveragehas been uneven. Only Macdonald (1969)sampled wi thin the sal t marsh, whereasWarme (1971) sampled most types <strong>of</strong> tidalflats and to a lesser extent subtidafareas, and Peterson (1975) only sampledthe subtidal sand channel. Warme (1971)recognized two major assemblages: "thesand-channel fauna" and "the mud-tolerantfauna" <strong>of</strong> the inner lagoon. Smith (1981)studied the distribution <strong>of</strong> ciliated protozoansalong the sandspit shore <strong>of</strong> theeastern arm. Smith (1981) found littleevidence <strong>of</strong> habitat differentiation byprotozoans with respect to the environmentalgradients that he distinguishedalong the sandspit, probably because thedifferences in sediment characteristics,temperature, and salinity between samplesites were small compared to other studieswhere habitat differentiation was reported.Abundances were comparable tothose reported by other workers and werehighest in the finest sediments before themajor storm <strong>of</strong> February 1978. After thedeposition <strong>of</strong> large amounts <strong>of</strong> mudthroughout the lagoon, abundances werehighest in the coarser sediments near themouth, presumably because the organic contentincreased whi 1e pore space remainedhigh. Away from the msuth, the organiccontent increased, but pore space diminished(Smith 1981).<strong>The</strong>se data are too restricted to serveas the foundation for this chapter, Instead,we base most <strong>of</strong> the following onour previously unpubl ished invertebratedata. <strong>The</strong> advantages are that we sampleda1 1 physiographic units except tidalcreeks and salt pans (Figure 32a); includedthe "s<strong>of</strong>t" invertebrates, mainlypolychaete and oligochaete worms, phoronids,si~unculids (peanut worms), andholothurians (sea cucumbers), as we1 1 asthose with hard parts; and spanned themajor stonns <strong>of</strong> February 1978 and 1980 for
Figure 32. (a) Locations saatpled qrrarterly for invertebrates in the easternam <strong>of</strong> <strong>Mugu</strong> <strong>Lagoon</strong> in 1977. (b) rites grouped according to 50% similar1 ty indensities <strong>of</strong> mjor catqories. and (c) m an densities <strong>of</strong> those categories in
two areas (Yransects 2 and 3, Figure 32a).In subtidal areas and fntertidal flats,the samples consisted <strong>of</strong> all material retainedby a 3-m screen (Transects 1 and2, the sandy areas) or a l-mm screen(Transects 3 through 6, the muddier areas)excavated from within a steel cylinder1/16 m2 in cross-sectional area to a depth<strong>of</strong> '~50 cm. Within the marsh only theepifauna were recorded from the 1/16-m2samples collected as part <strong>of</strong> the plantproductivity studies. Invertebrate samplingdid not address zooplankton andmicr<strong>of</strong>auna. Despite these omissions, thesimilar methodology for all tidal flat andsubtidal areas a1 1 ows comparisons betweenlocations and years for similar kinds <strong>of</strong>organi sms.Dupl icate quarterly samples were canbindfor each site (Figure 32a), and theaverage annual density <strong>of</strong> each taxon wasdetermined. <strong>The</strong> taxa were grouped intoeight morphotype categories : large andsmall worm-1 i ke organisms, 1 arge and smallgastropods, large and small crustaceans,bivalves (large), and sand do1 lars(1 arge). Large and small correspondroughly to scales <strong>of</strong> centimeters and millimeters,respectively, for the largestdimension <strong>of</strong> the most common size classes<strong>of</strong> each taxon. Table 4 indicates theTable 4. Mean density <strong>of</strong> invertebrates (number/m2) in 1977 for all sites sampledin the eastern arm <strong>of</strong> <strong>Mugu</strong> <strong>Lagoon</strong>. For Transects 2 & 3 combined, mean densitiesare reported for 1977 and 1978-80. Indications <strong>of</strong> responses to storm-causedalterations <strong>of</strong> the study area are also given. See the text for a description <strong>of</strong>the sampling procedure and Figure 32 for locations sampled. p = present at 5 per m* on at least 1 transect in at least 1year to be listed individually.Transects 2 & 3A1 1Down alltransects 3 years N oInvertebrates 1977 1977 1978-80 after storm Gone change UpMean density (no./m2) Population response to stormsLarge Wonn-1 i keNotomastus tenui s 307 775 330 x~ap1 oscol op-onga tus 58 7 3 xPhoronid 47 108 23 xPareurythoe cal i fornicaNemerteanHemi podus boreal isGoniada sp,WSD.Axiothel ia rubracinctaSi puncul idophel iaTotalSmall Wonn-1 i keLep tosynap ta a1 bi cansSabellid sp.spi ophanes. mi ssionens is01 igochaete sp.Minus pi o ci rri feraCapi tel la capi tataPolydora sp.Streb'iospio benedfcti(continued)XXX(Large numbers 1 year) ?(Never present)X(Never present)(Large number storm years)x
Table 4. (Concl uded) ,. .. .transects 3 years NoInvertebrates 1977 1977 1978-80 aft& stom Gone change UpMean dens? ty (no./m2)Population response to stomsSmall Worm-1 i ke (continued)Armandi a brevi s 7 9 PPseudopol-sp. 302Total 516 479 709Large Gastropods~eri thidea cal i forni caWlma taCrepPdu'laTotalSmall GastropodsActeocina spp. 185 371 668Assiminea calf fornlca 128Total 18 5 371 796Bi val vesLarge crustaceansCal lianassa cal iforniensis 98 123 45Hernlgrapsui ore onensf s 13 11 12+I 112 136 60Small crustaceansGammaridean arnphi pod 28 5 15 (Large numbers 1 year)Caprell id arnphi pad 19 5 240Cumacean 2 4 P 21Total 7 4 11 276Sand do1 JarsDendraster excentricus 2 4Total 2 4
taxonomic composition <strong>of</strong> the differentcategories by listing the dominants <strong>of</strong>each category,Sites were grouped based on the criterion<strong>of</strong> > 50% similarity in densities <strong>of</strong>the different categories <strong>of</strong> invertebrates(Figure 32b). Three patterns are evidentimmediately: (1) <strong>The</strong> groups were separatedprimarily according to distance fromthe mouth <strong>of</strong> the lagoon; intertidal versussubtidal distinctions tended to be lessimportant. (2) Densities were lowest atthe ends <strong>of</strong> the lagoon (Groups 1 and 6)and around an order <strong>of</strong> magnitude higher inthe middle (Groups 3 and 4). (3) <strong>The</strong>re1 a tive importance <strong>of</strong> large taxa decreasedwith distance from the mouth.Another pattern cannot be extracted fromthis analysis but is important, nonetheless:filter feeders dominated the sandchannel and deposit feedel-s dominated theponds.Generally, sediment characteristics areconsidered the best diagnostic characteristic <strong>of</strong> the associated invertebrate assemblage.According to the 1977 (prestomi)data, the invertebrate fauna ishighly differentiated according to locationwithin the eastern arm, yet sedimentsdid not appear to be differentiated to acorresponding degree. Thus, the bottom <strong>of</strong>the lagoon was sandy in almost everysample collected from subtidal areas andintertidal flats before 1978 (Warme 1966;Shaffer and Onuf 1983; Shaffer and Cermak,unpubl. observ.). Silts and clays approachedan equal share with sand in themiddle <strong>of</strong> the ponds, while sand predominatednear the invertebrate-sampl i ng sitesat either end <strong>of</strong> the lagoon. Despite thesimilarity in sediments and the simil aritiesin total density <strong>of</strong> invertebratesbetween east and west ends <strong>of</strong> the easternarm, these locations diverged more in there1 ative abundances <strong>of</strong> different morphotypecategories (as indicated by the largeinvertebrate to small invertebrate abundanceratio, for instance: 65:l at thewest end as compared to 1:14 at the eastend; Figure 32c). Obviously, some otherfactor besides sediment texture is involved.<strong>The</strong> changes after the storm <strong>of</strong>1978 will explain some <strong>of</strong> this fine discriminationamong apparently very similarhabitats and the difference between ends<strong>of</strong> the lagoon.Figure 33 presents the same kind <strong>of</strong>treatment <strong>of</strong> the data by category <strong>of</strong>invertebrates as Figure 32 but for differentyears in the same location (sandybottomchannel and subtidal pond), ratherthan different locations in the same year.<strong>The</strong> response <strong>of</strong> the invertebrates in thesand channel to major but brief episodes<strong>of</strong> reduced sa1 inity and burial by finesediments has been a continuing reduction<strong>of</strong> abundance experienced almost equally byall qroups (Fiqure 33, channel). <strong>The</strong> sanddo1 lar dendras-ter excentricus was an exceotion.It was eliminated from <strong>Mugu</strong>~a~oon by the storm in 1978. ~lthoughsmall individuals were seen occasional lyafterwards through 1980, they were notfound in any samples. By the end <strong>of</strong> 1982,large-sized Dendraster again were abundantin the sand channel, only to be eliminatedonce again during a period <strong>of</strong> heavy rainsin January 1983.<strong>The</strong> responses <strong>of</strong> the invertebrates tothe long-lasting alteration to fine sedimentsin the westernmost pond <strong>of</strong> the easternarm were similar to changes in thesand channel only in the persistent reduction<strong>of</strong> the 1 arge worm-1 i ke organi sms(Figure 33, pond). Otherwise, the responseswere large changes in the relativeabundances <strong>of</strong> di fferent categories <strong>of</strong> invertebratesbefore and after the February1978 stonn (in which smal ler invertebratesgenerally were favored) and great annualvariability after the storm.<strong>The</strong> responses <strong>of</strong> individual speciesprovide more insight into these largescalepatterns and fluctuations (Table 4).<strong>The</strong> small worm-1 i ke invertebrates respondedmost strongly to the transformation<strong>of</strong> the bottom. Three species thataccounted for 97% <strong>of</strong> all individualscollected on Transects 2 and 3 in 1977were eliminated and have not been collectedsince: Leptosynapta a1 bicans (ahol othurian) , Spi ophanes mission ens^ s, andan unidentified sabel lid polychaete. Intheir place appeared three other specieswhich were not co1 lected in 1977. <strong>The</strong>sethree species accounted for 77% <strong>of</strong> allindividuals collected from 1978 to 1980:paucibranchiata and Capibothpolychaetes, and anunidentified species <strong>of</strong> oligochaete.Pseudopol ydora was not col lected anywherein the lagoon in 1977; however, the others
CHANNELGASTRQPODSCRUSTACEANSWORM-LIE- XXX>-m-NUM E3ERM2Figure 33. Changes in densities <strong>of</strong> invertebrates from 1977 to 1980. Sites havebeen grouped by the crlterfon <strong>of</strong> 50% similarity in the densities <strong>of</strong> the indicatedcategarf es.had been cannon at one or two sltes near the stonns, especially in the stom yearsthe eastern end <strong>of</strong> the big pond (Transect <strong>of</strong> 1978 and 1980.4). Strebyspio benedicti, a plychaetr,was the on y species present in the area In the other categories <strong>of</strong> mall inverin1977 that was much more abundant after tebrates, taxa already present or abundant
in the area became more abundant, <strong>The</strong>small gastropods f Acteocina spp.) a1 mostdoubled in numbers. Numbers <strong>of</strong> varioussmall crustacean species have been largebut highly variable among different sitesand in different years.<strong>The</strong> most abundant large invertebratesexhibited yet another response. <strong>The</strong>ydecreased in absolute abundance, but theychanged 1 ittle in relative abundance.Dominant species remained dominant afterthe storm,Among some species <strong>of</strong> low or intermediateabundance, differences before andafter February 1978 were consistent withdifferences in preference <strong>of</strong> muddy conditionsinferred from distributions in 1977.Thus, the bamboo worm (Axiothella rubra-Ycincta) was col lected almost exclusivelyin the sand channel in 1977 and was notcol lected afterwards. <strong>The</strong> clam Nuttall i anuttallii, only seen in the sand channelin 1977, was not collected at all from1978 to 1980. <strong>The</strong> clams Macoma nasuta andProtothaca staminea were re1 ativel yabundant in muddy areas in 1977 and didnot decline. However, there were counterexamples: the "mud intolerant" clamDiplodonta orbel lus <strong>of</strong> Warme's (1971)analysis did not decline (refuting mudintolerance), nor did the polychaetePareu rythoe ca1 i fornica previously foundexclusively in the sandy-bottom channel.Other species associated primarilywi th mddi er areas did decline or di sappear:the clam Chione (two species) andthe polychaetes m a sp. and NereisTwo factors seem to be most importantfor interpreting these responses. First,the infaunal elements that inhabited thelagoon in 1977 were affected adversely toa greater extent than epi4 aunal elements.Second, small invertebrates responded morestrongly, whether positively or negatively,than large invertebrates. <strong>The</strong>seinfaunal -epifaunal and large-smal 1 di s-tinctions appear to be much more informa- SPtivethan faunal -si te associations ininterpreting the responses <strong>of</strong> the invertebratesto the storm-caused a1 terations <strong>The</strong>re is a simple explanation for at<strong>of</strong> the lagoon. Our genera1 expectationleast part <strong>of</strong> this counterintuitivewas that those taxa most closely allied result. As illustrated in the previouswith the muddiest habitats in 1977 wouldchapter, no place in the lagoon was trulybecane more widespread and abundant aftera mud bottom in 1977; i.e., sand predomithetransformation <strong>of</strong> most <strong>of</strong> the lagoonnated at all stations sampled. Sinceto muddier condi tions. Conversely, we1978, the mud fraction has becme asexpected the taxa most closely a1 lied with predominant as the sand fraction wasthe sandiest habitats in 1977 to suffer before 1978. Apparently, the new finemost, perhaps then recovering rapidly onlysubstrate was as novel and foreign for thein the sand channel. Instead, the mostpreexisting fauna <strong>of</strong> the ponds as it wasprominent <strong>of</strong> the muddy associates disapforthe fauna <strong>of</strong> the sand channel. <strong>The</strong>peared and were replaced, and the mostsedimentation probably affected the pondprominent <strong>of</strong> the sandy associates havefauna more because it lasted longer ordoggedly persisted, even in the area thataffected those organisms more di rectf y.is verv muddy now. For examwle, . - the pol v-For instance, the anaerobic layer probablychaete" ~a~liscol oplos el ongatus and thelay much closer to the surface after theholothurian Leptosynapta albicans stronglyfine sediments were deposited. This woulddominated the lame and small worm-likebe much more stressful for a very smallcategories, respeGively, at the muddiestorganism that relied on gas exchange withsite in the lagoon in 1977 (Site 2, Traninterstitialwater than for a largesect 4, Figure 32). Both were present onorganism like the ghost shrimp Calli-Transect 3 then. Neither was col lected inanassa, which pumps large amounts <strong>of</strong> water1979 or 1980. On the other hand, Notomafromabovethe sediment surface throughstus tenuis, the dominant large polychaeteits burrows.both-ndy areas and on Transect 3 in1977, survived in both wlaces, as did the <strong>The</strong> effects <strong>of</strong> the storm also provide aghost shrimp (~allianaska californiensis) partial answer to the question posed earandits commensal clam in sandy areas, lier sf why such a narrow gradient <strong>of</strong>Cryptomya californica.sediment types could yield such a highly
differentiated assemblage <strong>of</strong> invertebrates.<strong>The</strong> relatively uniform sedimenttypes in I977 were a reflection <strong>of</strong> a uniformsediment source, not a rnonotonousdepositional or hydrodynamic regime. %ensediments that could be differentiatedfinally were supplied in 1978, they Heredifferentially distributed (Figure 15).Obviously, the invertebrate biota had beenresponding to the varied hydrodynamicregime, rather than to differences inseditnents. Now, there is a broad spectrum<strong>of</strong> sediments as we1 1 as depositionalregimes.<strong>The</strong> salt marsh 1s an unimportant habitatfor invertebrates relative to the adjacenttidal flats and subtidal areas; however, afiw species can t>e abundant in someplaces. <strong>The</strong>y are the gastropod Cerithideacallfornica and the crab Pachycrassipesin the lower marsh, and the gastropodolivaceus in the uppermarsh.is rmch smaller and probablyundant than Cerithidea.Nacdonal d (1969'1 reaorted another qastro-pod,~ssidnea . cali fornica, to & muchmore 3- t w i d e a . We sawlarge numbers <strong>of</strong> ~sslminea In the lagoonin 1980 but few in the sart marsh at anvoccupies burrows ins very active on the tidalflats east <strong>of</strong> Transect 3 (Figure 32) atlow tides frm Aprll to Septetnber, Cerithideahas been abundant in the marfitG c t 3 throughout our study. Since1978 it has expanded onto the mudflats onTransect 3, became proy ressively moreabundant 1978 through 1980 at the marshplant sarnpl ing site ha1 fway between Transects3 and 4, and appeared in the marshat Transect 4 in 1979 and 1980.4.3 THE FISHESThirty-nine species <strong>of</strong> fish have beenidentlfi ed frmn Nugu <strong>Lagoon</strong>; ha1 f the speciesare common (MacGinf tie and MacGini tie1969; Baker 1976; On<strong>of</strong> et al. 1979; Onufand Quammn 1983). Only MacGinitie andMacEini tie (1969) and Baker (1976) sampledthe three major divisions <strong>of</strong> the lagoon.Bath sources reported fish as least abundantin the western a n and attributedthis rarity to the severe restriction <strong>of</strong>tidal exchange in this part <strong>of</strong> the lagoon."Rare or accidental marine species" (Baker1976) were mostly in the central basin, asmight be expected for strays From ooencoasthabitats, because <strong>of</strong> the location <strong>of</strong>the mouth and the prevalence <strong>of</strong> deep, openwater in the central basin when theseobservations were made e , before19 78)-<strong>The</strong> four mst canmn species in thelagoon are all small : arrow yobies(Clevelandia ios) inhabit the burrows <strong>of</strong>crabs and ghors hrimp; topsmel t (Atherifiopsaffjnis), occur in dense schools inthe water column; staghorn scul pin(Leptocottus amatus) rest on the bottcmmost <strong>of</strong> the time; and shiner surfperch) are in dense<strong>The</strong> arrow goby,topsmel t, and staghorn sculpin are widespreadin the laqoon and can be found allyear, *ereas fhe shiner surfperch islocalfzed in its occurrence and highlyseasonal . Sharks, rays, and the shovel -nose gui tarfi sh (Rhinobatos productus),a1 1 elasrrtobranchs, are the only fish cmrnon-in the lagoon as large individual%.More detailed infomiation Is availableon fish using the eastern ann <strong>of</strong> <strong>Mugu</strong><strong>Lagoon</strong> (Onuf and Quanmen 1983). Wesampled the fishes <strong>of</strong> the eastern arm <strong>of</strong><strong>Mugu</strong> <strong>Lagoon</strong> by beach seine monthly at foursites from February 1977 to February 1982.We selected the sites to represent therange <strong>of</strong> rnajor habitats avhilable to fishand to contrast physiographic and vegetatfondlfeatures (Figure 34) : shal low(Sites 1 and 2) vs. deep (Sites 3 and 4),and vegetated (Sites 2 and 3) vs. bare(Sites 1 and 41, <strong>The</strong>re also was a gradientin sediment texture: fine fractionincreased frm Site 1 to Site 4, <strong>The</strong>sesites encoinpassed most <strong>of</strong> the range <strong>of</strong>envi ranmental conditions that might infl u-ence the kinds and abundances <strong>of</strong> fishespresent. Habitat types not sampled includedmarsh channels, the rfiarsh itself,and the shallow subtidal area at theextreme eastern end <strong>of</strong> the lagoon whichdiffers from the shallow sltes that wesampled by having almost no tidal current.Thirty-five species were caught in thefirst year <strong>of</strong> samplinq. Two species, topaFfinis)and shineraqqregata) accountedfor over three-guarters <strong>of</strong> allindivfduals caught, <strong>The</strong> eight most common
Figure 34. Fi sh-sampl ing sites and their characteristics in 1977.species accounted for 96% <strong>of</strong> all individualscaught, Data from the 9 months whenall stations were sampled indicate thatdepth and cover by eelgrass were equallyimportant as determinants <strong>of</strong> fish abundance.Catches were least in the shallowbare site; more than twice as great at theshallow, eelgrass, and deep bare sites,and more than twice as great again in thedeep, eelgrass site (Table 5). Apparently,depth and cover by eelgrass interactsynergistically for a number <strong>of</strong> species,since the difference in total speciesbetween eel grass and bare sediment wasmuch greater at the deeper sites thanthe shallow ones: 23 vs. 15 as compared to12 vs. 11, respectively. It cannot bedetermined from these data whether thedi fferences in substrates between sites(Figure 34) contribute to the observedpattern.All the common species were found at allthe sites; however, seven <strong>of</strong> the eightspecies making up 98% <strong>of</strong> the total catchwere caught at least 75% <strong>of</strong> the time ateither one or two sites (Table 6). <strong>The</strong>species were relatively evenly distributedamong categories <strong>of</strong> habitats: threesingle site associations, each with a differentsite, and four associations with apair <strong>of</strong> sites, each with a different pair.<strong>The</strong> most common spec1 es - topsinef t andshiner surfperch - were found at the deepstations, the surfperch at the vegetatedstation and the topsmelt at both the bareand vegetated deep stations. Fish caughtmore <strong>of</strong>ten in the shallows included thelongjaw mudsucker, the <strong>California</strong> kill i-fish, and the bay pipefish.A strong seasonality is evident in the5-year averages <strong>of</strong> total monthly catchesand for catches <strong>of</strong> individual species(Figure 35). Most have been caught inevery month <strong>of</strong> the year, but many werevery rare at least for a couple <strong>of</strong> thewinter months. <strong>The</strong> June peak in totalcatch was not the result <strong>of</strong> the abundantspecies behaving similarly, but ratherrepresents large numbers <strong>of</strong> the two dominantspecies, topsmelt and shiner surfperch,being present at the same time.For the species in general, the overridingimpression is that the peaks in abundance<strong>of</strong> individual species were remarkablyspread out over the year: essentiallytwo peaks per month from April toOctober (Figure 35). Perhaps this is anindication that the resources <strong>of</strong> thelagoon are being partitioned temporally aswell as spatially. Alternatively, it mayreflect only differences in the temperaturepreferences <strong>of</strong> the different species.A1 though nearshore fisheries are variablewith respect to time (hours, bays,months, and years) and place, three factorsallowed us to rigorously analyze the
fable 5. Total catch <strong>of</strong> fishes by species and site in the 9 months af 1977 when allsites were sampled. <strong>The</strong> percentage contribution <strong>of</strong> each species to the total at allsites is alsn shown at the far right. Cmmon names fol low Miller and Lea (1972).Site character4 sticsShall owDeepSpecies Bare Eel grass Bare Eel grassCanmon name Scientific name (Site 1) (Site 2) (Site 4) (Site 3) %Topsmel tShiner surf perchStaghorn scul pin<strong>California</strong> kil lifishDi amond turbotBay pipefishCal i fornia ha1 i butLongjaw mudsuckerBay bl enny<strong>California</strong> tonguefishGiant kel pfi shKelp bassBrown rockfishOpa l eyeShovelnose gui tarf i shGrey smoothhoundBlack surfperchKelp rockfishBarred surf perchPacific herringKelpfish 2Kelpfish 3Round stingraySpeckled sanddabBarred sand bassStriped mu1 letStarry flounderSpotted turbotLeopard sharkTotal individuals (all%Urol ophus ha1 l eriMu 11 cephalusFhrhis stel latusP euronlc th s ritterib s c i a t astations = 5,460)Total species (all sta tions = 29)effects <strong>of</strong> the major stonns <strong>of</strong> 1978 and1980 (Onuf and Quammen 1983). First,sampling at the same site monthly for 5years was frequent enough to identifysystmatf c di fferences betwen years bynon-parametric statistical procedures,even when the high seasonality and aggregateddistributions <strong>of</strong> the fishes madestandard parametric statistics inappropriate.Second, the storms affected thefour sites differentially, some rrarch moreseverely than others. This allowed tests<strong>of</strong> the fa1 lowing sort: if differencesbetween years were the result <strong>of</strong> thestonns, then bigger changes should beassociated with the more severely affected
Table 6. Habitat characteristics <strong>of</strong> the common species <strong>of</strong> fishes in<strong>Mugu</strong> <strong>Lagoon</strong> tnferred frm features <strong>of</strong> the sites at which they werecaught most frequently.Shal lowDeepBare Eel urass Bare Eel urass(Site 1) (siee 2) (Site 4) (site 3)>75% caught at one siteShiner surf perch<strong>California</strong> ha1 ibutLong jaw mudsucker>75% caught at two sitesTopsmel t x xStaghorn scul pin x x<strong>California</strong> killifish x xBay pi pefish x xsites. Third, the symmetrical sequence <strong>of</strong>minor and major storm years for the 5years <strong>of</strong> sampling (minor-major-minormajor-minor)from February 1977 to February1982 permitted the strongest possibleinferences about the effects <strong>of</strong> storms.Not only was there replication <strong>of</strong> thebasic comparison between the years immediatelyfollowing major storms and years atleast 1 year removed frm major storms,but a1 so there was the opportunity to di s-criminate between short-term effects (comparisonsbetween adjacent years) andpersistent effects (comparisons betweensequenti a1 stonn years or nons tom years ).<strong>The</strong> analysis is beyond the scope <strong>of</strong> thepr<strong>of</strong>ile and is reported in Onuf andQuamen (1983), but the concl usi ons werestraightforward.A1 1 significant differences betweenyears indicated storm-caused declines inthe total catch for the whole lagoon andin the total number <strong>of</strong> species caught inthe eastern arm as a whole. Part <strong>of</strong> thereductions were short term, since increasesinvariably ensued after each majorstorm year (Figure 36); however, part <strong>of</strong>the reductions were persistent, and overallthere were almost 50% fewer fish in1981 than 1977.<strong>The</strong> decrease in depth and virtual elimination<strong>of</strong> eelgrass at all sites withinthe pond had a cascading effect on thesuitability <strong>of</strong> different sites for differentspecies, <strong>The</strong> originally shallow,half-eelgrass, ha1 f-bare Site 2 becamealmost entirely intertidal and bare, <strong>The</strong>originally deep, bare Site 4 became mostlyshallow. <strong>The</strong> originally deep eel grassSite 3 became bare and shal lower, butstill was deep in relation to other sites.<strong>The</strong> originally shal low, almost entirelybare Site 1 did not change in depth butsubstantially increased in eel grass cover.Species swi tched locations accordingly,and those for which no analog <strong>of</strong> theirfavored habitat existed at the end <strong>of</strong> thestudy declined in abundance (Figure 37),<strong>The</strong> deep-waterhabitats <strong>of</strong> the originaldominant species - topsmelt and shinersurf perch - were el imi nated. Topsmel t(79% caught at the two deep sites in thefirst year) were down 57% in the fifthyear compared to the first, and shinersurfperch (80% caught at the deep eel grasssite in the first year) were down 97% frmthe first year to the fifth. Our initialexpectation was that species that spentmost <strong>of</strong> their time on the bottm wouldrespond very strongly to the new, finetexturedbottom. We expected thosespecies (<strong>California</strong> halibut, didmond turbot,staghorn scul pin) associated withSite 4, the muddiest area during the firstyear, to prosper, and those associatedwith a much sandier area (<strong>California</strong>
Total catchlo00SPLCKUD IANDDADlAMOND TUffOOTITAOHQIN SCULPlNSHINtl SURrPERCHCtWIPOUMtATQWOYllrtSnarr PlrtFtrnFigure 35. <strong>The</strong> 5-year average rtrcrnthly fish catch at <strong>Mugu</strong> <strong>Lagoon</strong>, arranged by month <strong>of</strong>peak abundance, from earliest at Lop to latest at bttam.
ddving ducks (mainly mol lusk eaters, 15%) ;large, long-bi1 led shorebirds (probingfeeders, 13%); gulls (11%); wading, diving,and aerial fishing birds (6%); anddabbling ducks and geese, (mainly planteaters5%). <strong>The</strong> category "other" containedmostly strays plus the Americanbittern (seen mainly in the marsh, feedingon insects), ki 1 ldeer (seen mainly supratidallyon the sandspit shore <strong>of</strong> thelagoon, feeding on insects), and Northernphalarope, a shorebird relative that feedson plankton.Figure 36. Changes in mean monthly fishcatch and mean number <strong>of</strong> species caughtfrom 1977 to 1981.kil li fish, longjaw mudsu~ker) to suffer.If sediment type had any role in determiningnumbers and distribution, it was overwhelmedby the effects <strong>of</strong> depth and coverby eelgrass.4.4 THE BIRDSNo quantitative bird census data havebeen published for <strong>Mugu</strong> <strong>Lagoon</strong>. <strong>The</strong> NaturalResources Management Office, Pt.<strong>Mugu</strong> Naval Air Station, CAY has compiled a1 ist <strong>of</strong> 198 species found on the Air Stationin both wetland and upland habitats(unpubl.). <strong>The</strong> following analysis <strong>of</strong> thedistribution and abundance <strong>of</strong> waterrelatedbirds in space and time is basedon censuses <strong>of</strong> 21 areas conducted at 20-day intervals near the predicted time <strong>of</strong>the daylight low tide from October 1977 toSeptember 1982 (Quammen and Onuf, unpubl.data). Census areas were limited topermanent open water and intertidal flatsand were located in the western arm andcentral basin, as we7 1 as in the easternarm.An average <strong>of</strong> 2,700 birds was countedper census (Table 7). In a1 1 , 73 specieswere seen during the study; 8 species wereobserved at more than 100 per census andaccounted for more than 70% <strong>of</strong> the total;and 16 were observed less than once in 10censuses. <strong>The</strong> general ly small, surfacefeedingshorebirds were the most abundantcategory (33%); followed by coots (16%);<strong>The</strong>re is a strong seasonality in thetotal abundance <strong>of</strong> birds in <strong>Mugu</strong> <strong>Lagoon</strong>,as indicated by the monthly averages forSites 1 through 20 (Figure 38). In Mayand June, 100 to just over 200 birds werecounted per census. From July through'ieptember, numbers were close to 1,000 andfrom October through April were between2,000 and 4,000. December, January, andFebruary were the months <strong>of</strong> highest abundances,yet only coots and diving ducksreached their maxima in this period. Apparently,<strong>Mugu</strong> <strong>Lagoon</strong> is a southern tenninusand overwintering area for thesemigrants. <strong>The</strong> fish-eating birds showedspring or fall peaks, and in the extremecase <strong>of</strong> the aerial fishers, had theirlowest numbers in the winter. This isconsistent with the much higher abundances<strong>of</strong> fish in the spring and fall (Figure35). <strong>The</strong> wading and diving fishers, however,go elsewhere in the summer when fishare most abundant.<strong>The</strong> remaining groups had varied seasonalpatterns. <strong>The</strong> probing shorebirds weremost abundant in winter and least abundantin May and June, but varied less over thewhole year than any other category. <strong>The</strong>relatively high numbers <strong>of</strong> surface-feedi ngshorebirds and dabblers present in midwi n-ter suggest that some overwinter in <strong>Mugu</strong><strong>Lagoon</strong>; on the other hand, the appearance<strong>of</strong> some in early autumn and greatest abundancein March or April indicate thatothers migrate through to overwinterfarther south. <strong>The</strong> fa1 l-spring asymmetry<strong>of</strong> abundance suggests that the southwardmigration is much less synchronous thanthe return north as has been noted forsome <strong>of</strong> these species by Recher (1966) andPage et a1 . (1979),
Babie 7. Abundance ranking and mean number <strong>of</strong> birds seen per censusaveraged over all seasons, 1977-82, for 21 census sites (see Figure 39)in <strong>Mugu</strong> <strong>Lagoon</strong>. abundances are given by species and functional category;species are listed in decreasing order <strong>of</strong> abundance within a category.Rank and site where most commonly observed are a7 so listed.Rank in abundanceCategorySpecies1 SURFACE- FEEDING SHOREBIRDS2 Dowitchers spp.3 Western sa9dpi per7 Sandpipers8 American avocet13 Dunlin21 Least sandpiper22 Sander1 i ng28 Black-bellied plover36 Stilt39 Semi pal mated plover47 Snowy plover52.5 Red knot57.5 Wilson's ploverBlack turnstoneRuddy turnstoneSurf bi rdWandering tattlerNumber seenper censusSitewhere most<strong>of</strong>ten seenPROBING SHOREBIRDS 354.45 Marbled godwi t 200.89 Willet 140.533 Long-bil led curlew 9.342.5 Greater ye1 1 owl egs 2.254 Whimbrel 0.61 COOTS 428.0DABBLING DUCKS & GEESE10 Northern shoveler18 Northern pintail19 American wigeon31 Cinnamon teal37 Green-winged teal50 Mallard52.5 Canada goose55 BrantGadwallDIVING DUCKS4 Ruddy duck11 Susf scoter(continued)
Table 7.(Continued),Rank in abundance'CategorySpec1 esDIVf NG DUCKS (continued)15 Canvasback16 Greater scaup27 Whi te-wi nged scoter35 Buff leheadRed headGo1 deneye9 WADING FISHERS34 Snowy egret41 Great blue heron48 Great egret8 DIVING FISHERS24 Western grebe25 Double-crested cormorant30 Red-brested merganser40 Eared grebe46 Pied-bil led grebe49 Horned grebe56 Common loon57.5 WhJ te pelicanArctic loanRed-throated loonAERIAL FISHERSBrwn pelicanForster's ternCaspian ternRoyal ternElegant ternLeast ternBe1 ted ki ngflsher5 GULLS6 Ring-hi1 led gull12 Calffornia gull17 Western gull26 Heemann's gull32 Bonap$rt@ gull38 GullsGI aucous-wd nged gu? 1Nu~iber seenper censusSitewhere :nost<strong>of</strong>ten seen10 OTHER 3,042.5 Northern phalarope 2,251 Ki1 ldeer O.abAmerican hi ttern
Table 7. (Concl uded) ,Rank in abundanceCategorySpeciesNumber seenper censusSitewhere most<strong>of</strong>ten seenOTHER (continued)bWhite-faced ibis ~0.1Black oystercatcherFlamingo (sp. ?)Roseate spoonbill:seen from too far away to identify the species.Species seen ~0.1 per census not ranked.Bird abundance varied among sites de- <strong>The</strong>n characteristics <strong>of</strong> sites were soughtpending on functional category, yet we that were shared in common within thehave been largely unsuccessful in explain- group but differed from other groups.ing the abundance patterns based on sitecharacteristics. Instead, we turned theprocess around here, as with the inverte- <strong>The</strong> census sites formed six distinctbrates. Groups <strong>of</strong> sites were defined by groups according to the criterion <strong>of</strong> >60%>60% similarity in their densities <strong>of</strong> the similarity in the densities <strong>of</strong> ten catecategories<strong>of</strong> birds designated in Table 7. gories <strong>of</strong> birds (Figure 39; Table 7).4000200Probing shorebirds"Aerial fishers100n500J A S O N D J F M A M JFigure 38. Five-year average abundances <strong>of</strong> water-related birds by month at censussites 1 through 20, <strong>Mugu</strong> <strong>Lagoon</strong> (Figure 39), arranged according to month <strong>of</strong> peakabundance from earliest at top left, to latest at bottom right.
Group #: 1 2 3 4 5 6Coots 18.2 10.1 0. 1 0,1 (1.8 1.1Surface-feeding shorebirds 29.2 10.9 1. 3 3. tj 5 1Dabbling ducks and geese 4.3 1. 2 1.9 2 0.8Prabi ng shorebirds 6.0 3.8 5.0 10.8 7 4 4.1Wading fishers 0.2 0.1 0.1 0 2 0 ? 0 2aivi ng ducks 5.5 1.3 Y 0.2 0 4 3 9 u. 6Diving fishers 0 5 1.3 0.1 0.3 0 9 0.2Aerial fishers 1.6 0 5 1.3 0 6 0 1 0.1Gui Is 2.2 Q. 9 6.4 1. H 0 6 0.1Others 0.1Total birdslhaFigure 39. Bird census sites grouped according to >60% similarjty in their densities<strong>of</strong> the indicated categories <strong>of</strong> water-related birds and the rnean densities (no./haj <strong>of</strong>each category in the different groups <strong>of</strong> sites.
According to these site associations,the salient features <strong>of</strong> habitats are asfo1 lows for the different categorSes <strong>of</strong>bi rds. Coots and surface-feeding shorebirdstend to correspond in their selection<strong>of</strong> habitats and favor sites withlarge expanses <strong>of</strong> mudflats and shallowopen water, Presumably, the coots aresomewhat more closely tied to the water inthe mudflat-open water habitat and feedprimarily on the sometimes thick mats <strong>of</strong>Enteromorpha; the surface-feeding shorebirdsare [nore strictly confined to thetidally exposed portions and feed exclusivelyon small invertebrates on and justbelow the surface <strong>of</strong> the mud, <strong>The</strong> lowdensities <strong>of</strong> invertebrates that we documentedfor the extreme eastern end <strong>of</strong> thelagoon may explain the relatively low density <strong>of</strong> surface-feedi ng shorebirds inGroup 1; however, this is speculation onlysince a l-mm screen is too coarse tosample the prey <strong>of</strong> the birds satisfactori1 y.<strong>The</strong> dabblers were most abundant at sitescontaining islands covered by marsh vegetation.<strong>The</strong>ir distribution deviatesstrongly from that <strong>of</strong> the coots, whichalso dabble most <strong>of</strong> the time.<strong>The</strong> large, deep-probi ng shorebirds andthe wading fishers (egrets and herons)were similar in their relatively evendistribution throughout the lagoon (Figure39). Both categories are birds <strong>of</strong> thewater1 ine. Apparently, whether a shore issteep or flat is <strong>of</strong> little consequence tothese birds since they spend most <strong>of</strong> theirforaging time close to the water's edge.<strong>The</strong> probing shorebi rds are therefore di s-tinct frm the surface-feeding shorebirdsin terms <strong>of</strong> a more linear vs. more arealdispersion. In addition, they are preeminentlythe birds <strong>of</strong> sand flats andsandy shores. While most other feedingtypes are rare here, the probing shorebirdsare at their most abundant, as arelarge, deep-living infauna, their preferredprey.<strong>The</strong> largest expanses <strong>of</strong> open water attractedthe greatest numbers <strong>of</strong> divingducks and diving fishers (Figure 39). <strong>The</strong>diving ducks feed mostly on invertebrateson the bottom. Ducks such as meryansersthat dive for fish in the water colurnn oron the bottom are classified with theother diving fishers (the grebes, loons,and cormorants). Gulls and the aerialfishers (mostly pelicans) were most commonroosting on sandy islands near the tidalinlet. <strong>The</strong>se they shared with hauled-outharbor seals. <strong>The</strong> aerial divers, in thiscase mostly terns, a1 so roosted on anothersmall island in Site 17 and a sand bar inSite 7 (Figure 39). Although terns, pelicans,and gulls feed inside the lagoon, wedo not know how much foraging is doneel sewhere.<strong>The</strong>re is little indication <strong>of</strong> long-termchange in the total number <strong>of</strong> birds uti-1 izi ng <strong>Mugu</strong> <strong>Lagoon</strong> based on our 5 years <strong>of</strong>records, a1 though numbers were somewhathigher in the last 2 years than in previousyears (Figure 40). Within categories,much larger changes are evident.For example, in the lagoon as a whole thenumber <strong>of</strong> coots has declined every yearsince 1977-78 (59% in 5 years). In contrast,the surface-feedi ng shorebirds haveincreased in every year since 1977-78 (96%in 5 years). Changes for other categorieshave been much less or, in the case <strong>of</strong>dabblers and gulls, erratic enough that itis impossible to determine whether the lownumbers <strong>of</strong> the fifth year are part trendor merely fluctuation. <strong>The</strong> major sections<strong>of</strong> the lagoon contri buted di fferentl y tothese overall changes in number. Surfacefeedingshorebirds, for example, were ha1 fas abundant in the last 2 years as earlierin the eastern am, increased tw<strong>of</strong>old inthe western arm, and increased fourfoldin the central basin (Figure 40). Cootsdecreased by almost a factor <strong>of</strong> three inthe western am, but changed little elsewhere.<strong>The</strong> abundance <strong>of</strong> gulls has increasedsubstantially in the eastern armand fluctuated in the central basin.A1 though few censuses were conductedbefore the major storm <strong>of</strong> February 1978,there is no doubt that the filling <strong>of</strong> most<strong>of</strong> the central basin at that time wasresponsible for the increase in surfacefeedingshorebirds there. Since probers,diving and wading fishers, diving ducks,dabblers, and coots were less abundant i~1977-78 than in any <strong>of</strong> the succeeding 4years, it is possible that a shallowercentral basin has provided more satisfactoryhabitat for them as well, However,this is a suggestion, based on the limitedsampling <strong>of</strong> the very large Site 21 before
Whole lagoonEast-.JV)GgullsCalF2al DD dlvlnq ducksPall catogor~i*s <strong>of</strong>l:sh eat~ng b:rd:,PSCDCentral-;~SObirl~ shoreb~rdssur?act?.feedintj shorcb~rcj.;COO!Sdabbl:ric,! ducks and qeesoFigure 40. Changes In bfrd abundance over time at kgu <strong>Lagoon</strong>.June 1978, and not a conclusion. <strong>The</strong>partial shift in gulls probably had rnareto do with the extreme eastward migration<strong>of</strong> the tldal inlet In 1980 and 1981 thanwlth the filling <strong>of</strong> much <strong>of</strong> the centralbasin, since gulls were rnost abundant onthe shifting sand bars or islands associatedwith the inlet. In the western arm,the cmpenratory changes between coots andsurface-feedl ng sharebfrds are cons1 s tentwlth the passfbility that sedimentationmjght favor the tidal flats element, i .e.,surface-feeding shorebirds <strong>of</strong> the tidalflats-shallw open water couplet,<strong>The</strong> addftional year <strong>of</strong> censuses (1976-77) in the eastern ann before February1978 allows more rigorous tests there forstom-ref ated effects, Numbers <strong>of</strong> probingshorebirds were down In all 13 <strong>of</strong> thepossible pair-wise compari sans betweenfa1 1 abundances before and after the stam<strong>of</strong> February 1978 (October - December 1976and 1977 vs. 1938, 1979, 1983, 1981) andwinter through sumrner abundances beforeand after (January - Septmber 1977 vs.1978, 1979, 1980, 1981, 1982). <strong>The</strong> divingFishers were down in 12 <strong>of</strong> 13 possiblecmparisons, whereas the dlving ducks increasedin a1 1 13 comparisons. It is un-1 i kely that these outcomes are chanceevents. <strong>The</strong> former two are consistentwith the known decreases <strong>of</strong> large invertebratesand fish after the storm.This analysis af Eugu Lasoon birds hasbeen 1 i mi ted to ccdnmon wa ter-relatedspe~ies classified into functionally
elated categories or g~ailds: the birdsthat play important roles in the estuarineecosys tern. Other species are unimportantin the ecosystem because <strong>of</strong> their extremerarity, but the ecosystem is critical fortheir survival, most notably the liqhtfootedclapper rail (Ra7 lus- longirostris1 evi es) , Be1 ding 3 Savannah sparrowf- Passercul us sandwichensi s be1 di ngi ), andto a lesser extent the brown ~elican(Pel ecanus occidental is) and the' leastf-na a1 bi frons). <strong>The</strong>se endangeredspecies are nmre appropriately discussedin Chapter 7.In addition to the water-related birds,at least 100 species <strong>of</strong> more terrestrialbirds have been sighted around the lagoon(Macdonal d 1976b; Natural Resources ManagementOffice, U.S. Naval Air Station,Point <strong>Mugu</strong>, <strong>California</strong>; unpubl. list).Some commonly use aquatic habitats; forinstance, swal lows <strong>of</strong>ten are conspicuouseither pursuing flying insects over waterand marsh or gathering mud from creekbanks for nests. Other species have anaffect on the estuarine ecosystem. Forexample, large birds <strong>of</strong> prey could beimportant predators on the water-relatedbirds. Nevertheless, the interactionsbetween the more terrestrial birds and theestuarine ecosystem are assumed to be weakand have been ignored.4.5 THE HERPETOFAUNA AND MAMMALSAmphibians and reptiles appear to haveeven less <strong>of</strong> a role in the <strong>Mugu</strong> <strong>Lagoon</strong>estuarine ecosystem than the land birds.Eleven species have been reported (NaturalResources Management Office, U.S. NavalAir Station, Point <strong>Mugu</strong>, <strong>California</strong>;unpubl. 1 ist). Observations <strong>of</strong> westernfence l izards (Scelo orus occidental i s)and side-blotche*~ (U& stansburiana)are limited to adjacent uplands-Conservation Service 1983). SouthernPaci fic rattlesnakes (Crotal us vi ridi she1 leri ) have been encountered in themarsh,1978.particularly after the flooding <strong>of</strong>Probably these animals were raftedinto the lagoon on debris washed out <strong>of</strong>the watershed during the February 1978storm.Forty-one species <strong>of</strong> mammals are recordedfor the Naval Air Station adjacentto <strong>Mugu</strong> <strong>Lagoon</strong> (Natural Resources ManagementOffice, U.S. Naval Air Station, Point<strong>Mugu</strong>, <strong>California</strong>; unpubl. list). Ofthese, four species, the western harvestmouse (Rhei throdontmvs meaalotis -. -.-1 imicola) , kal i fornia s ( ~ i c r o t u ; cal i-fornicus stephens i) , orna te-YXEiT(Sorexornatus sal icornicus) . and black-tmjack rabait (Lepus californicus), areresident in the hiah marsh (Coulombe1970). Ho<strong>of</strong> prints -bf mule deb (Odocoileushemionus) have been seen along-esandspi t shore <strong>of</strong> the lagoon (Onuf, pers.observ.), and a variety <strong>of</strong> terrestrialcarnivores including the coyote (Canis(Vulpes vul es), grayci nereoargenteus 97 , andti s mephitis hol zneri)freauentlv make forays into aauatic habitats.~rbbabl~ the activities'<strong>of</strong> the terrestrialmammals have minor effects on the<strong>Mugu</strong> <strong>Lagoon</strong> estuarine ecosystem. Coyotesand red fox den in the high marsh andbeach ridge areas <strong>of</strong> the marsh. <strong>The</strong>y areactive resident predators and may havesignificant impacts on ground-nesti ngendangered bi rds.<strong>The</strong> harbor seal (Phoca vi tulina) is conspicuouswithin t h e o o n proper. Over100 seals can be seen hauled out on sandbars near the mouth <strong>of</strong> the lagoon. <strong>The</strong>number <strong>of</strong> harbor seals fluctuates withtides and time <strong>of</strong> year and averages around40 (R. Dow, pers. comm.). This populationis the only resident seal colony along themainland shore <strong>of</strong> the Southern <strong>California</strong>Bight. Presumably, the isolation <strong>of</strong> thelocation from human disturbance is cri t-ical for residence by seals. Elsewherealong the mainland, shore sites may beused seasonally as rookeries or for haulingout, but not for year-round residence.4.6 SUMMARY<strong>The</strong> spatial and temporal patterns <strong>of</strong> thebiota <strong>of</strong> <strong>Mugu</strong> <strong>Lagoon</strong> are anything butsimple. <strong>The</strong> 10 to 20 species dominatingeach major division <strong>of</strong> the aquatic biota--plants, invertebrates, fishes, and birds--were distributed among several functionalcategories. Most taxa were found in atleast a few physiographic units, butachieved maximal densities in a smallsubset <strong>of</strong> one unit. <strong>The</strong> exceptions werethe marsh plants, which were confined to
one physisgraphic unit, but were quitegenerally distributed therein, <strong>The</strong> micr<strong>of</strong>loralfilms or mats, however, werepresent and important in a1 1 physiographicunits.Elevation appeared to be a minor determinant<strong>of</strong> distribution for most invertebrates(except that the salt marsh isdistinct frm the rest <strong>of</strong> the lagoon),since nearby intertidal and subtidal sitesusually resembled each other closely bothin kinds and densities present. Distancefrom the muth <strong>of</strong> the lagoon had a greatereffect on determining the distributian <strong>of</strong>different Functional categories <strong>of</strong> invertebratesand was perhaps related to hydrodynamiccharacteristics. Only the Cal I-fornia ki1 lifish exploited intertidalflats at high tide; the other fishes weremore canmonly associated wi th the subtidalareas. Canversely, the activities <strong>of</strong> thebi rds tended to concentrate in intertidalareas: the surface-feeding shorebirdsfeed on exposed flats almost obligately;gulls and most <strong>of</strong> the aerlal dlverr rooston intertidal sand bars; the problngshorebirds and wading fishers feed nearthe tidal ly migrating waterl ine; and cootsand dabble= feed in the very shallowwater just beyond the tfdal ly migratingwaterl ine. Only the birds that dlve forfish or invertebrates fran the water surfaceand the aerial flshers (when feeding)concentrated their actfvities in deeperopen water areas.Only a few categori es <strong>of</strong> organisms appearedta be sensillve to sedlment textureand stonn-caused changes in sedf~nent texture.Probf ng shorebirds, large infaunaljnvertebra tes, and eel grass had obvious,strong aff i nlties with predominantly sandyareas, whi5e the opposite was true forsurface-feeding shorebirds, New or previouslyrare tdxa <strong>of</strong> small infaunat invertebratesbecam very abundant when truemuds first appeared In the eastern arm; atthe saw tfme, the previously daninanttaxa were el imi nated. <strong>The</strong> blue-greencomponent <strong>of</strong> the benthic mi cr<strong>of</strong>loraJncreased in response to the same change,A1 though major changer in response tothe storms were evident in many other taxaand categsrJes, changes in elevation ordepth general ty seemed rnore Important thantextura changes. Examples include thelarge decline in the total catch <strong>of</strong> fishesin the eastern arm, mast evident in speciesassociated with deep areas; the shiftin the distribution <strong>of</strong> salt marsh plantbiomass; the increase in su rface-feedi ngshorebirds (intertidal) and complementarydecrease <strong>of</strong> coots (subtidal ). Indirectchanges a1 so were important; for instance,the changes in shiner surfperch partlywere in response to changes frt eelgrass.<strong>The</strong> decline in the probing shorebirds inthe eastern am almost certainly resultedfran the reductions in the densities <strong>of</strong>their large infaunal prey.<strong>The</strong> final feature <strong>of</strong> note is the apparentlyintricate orchestration <strong>of</strong> the cmingsand goings <strong>of</strong> migrating blrds andfish, <strong>Mugu</strong> <strong>Lagoon</strong> is dominated bybirds in the cold half <strong>of</strong> the year andfish in the warn half. Domlnant fish speciesor categories <strong>of</strong> birds with similarfeeding habits vary month by month. It isnot known whether this time-sharing isonly a secondary consequence <strong>of</strong> some moreimportant aspect <strong>of</strong> life hfstory or whetherIt Is a consequence <strong>of</strong> selection forexploiting a Ifmlted resource by a widespectrum <strong>of</strong> short-term users.<strong>The</strong> range <strong>of</strong> environments in <strong>Mugu</strong> <strong>Lagoon</strong>is such that only a few species or categoriesout <strong>of</strong> the small total pool areabundant In any one habftat, but those feware dl fferent between habitats and perhapsbetween times. Even though specles overlapbroadly, they mst overlap in differentportions <strong>of</strong> their respective toleranceor resource spectra to account for thelarge variety <strong>of</strong> dfstlngulshable assemblages<strong>of</strong> organisms, each cmposed <strong>of</strong> sucha small number <strong>of</strong> species,Most <strong>of</strong> thls descriptjon <strong>of</strong> the distrlbutionand abundance <strong>of</strong> the biota <strong>of</strong> <strong>Mugu</strong><strong>Lagoon</strong> is based on data cot lected in theeastern am, <strong>The</strong> description <strong>of</strong> innerlagoon organ1 sm-habi tat re1 at fans probablyapplfes to large areas <strong>of</strong> the western armand central basin. Except for the portion<strong>of</strong> the tidal delta In the central basin,there are no counterparts elsewhere in thelagoon <strong>of</strong> the sandy environments that areso prominent a part <strong>of</strong> the eastern arm,<strong>The</strong> consequences for birds have been described,Fish do not appear ta be stronglyinfluenced by this habitat parameter;however, many <strong>of</strong> the large invertebrates,
espectal ly the bivalves, are intimately brackish water in the eastern arm. Conassociatedwith the sandy-bottom, subtidal sequently, possibly extensive areas alongchannel, Consequent1 y, large inverte- the Cal leguas Creek channel in the centralbrates probably are much less important in basin and at the western extremity <strong>of</strong> thethe rest <strong>of</strong> the lagoon than in the eastern western arm may not be represented in thisarm. <strong>The</strong>re is no persistent fresh or pr<strong>of</strong>ile.
CHAPTER 5. THE BIOTA:DYNAMICS AMD 1NPERACTlONSMillicent L. QuammnandChristopher P. OnufMany relations <strong>of</strong> organisms with theirphysical environment inevitably were considzredin Chapter 4 in the discussion <strong>of</strong>distributions. While some <strong>of</strong> those relationswill be developed in more detailhere, the emphasis will be on haw groups<strong>of</strong> oyani sms Interact. <strong>The</strong> di scusrionwill generally follow the trophic structure<strong>of</strong> the lagoon.<strong>The</strong> abundance and rate <strong>of</strong> chdnge <strong>of</strong>abundance <strong>of</strong> any unlt in the food webrespond to factors at three levels: (1)food availability, (2) intra- and interspec1fic campet1 tion, and (3) predation.Of course, all these reldtjons are modifiedby extrinsic variables such as tmperature,substrate, habitat availabi 1 i ty,dnd storms. A1 though identification <strong>of</strong>the lfnkayes among the jmportant organisrns<strong>of</strong> any particular habitat is relativelyeasy, the determination <strong>of</strong> importance <strong>of</strong>the linkages, and measurement <strong>of</strong> the rates<strong>of</strong> change associated with those linkagesare considerably more difficult.Various researchers have taken threeapproaches to distinguish the effects <strong>of</strong>individual lfnkages or other factors onthe dyrrarnfcs <strong>of</strong> the <strong>Mugu</strong> <strong>Lagoon</strong> estt~arineatcosysten, One rnight be called the blanketapproach: tneasurment <strong>of</strong> a wide array<strong>of</strong> factors that could conceivably influencethe rate at which a key process proceeds(the independent and dependent vari-ables, respctivelyf . Statistical proceduresare applied to determine how mucheach irrdeperidertt vdrTabf e "'explains" thevardation in the dependent variable. <strong>The</strong>second method is opportunistic and nmredirect. It capitalizes on extrinsical lycaused major alterations, such as by thestoms <strong>of</strong> 1978 and 1980, that affect oneor a few factors hut not others, or someareas but not others. This isolates theeffects <strong>of</strong> one factor or at least narrowsthe consideration to a Pew. <strong>The</strong> thirdapproach is direct and planned. Manipulationsare speclfical ly designed to a1 teronly one factor while not affecting othersor to a1 tes two or even three Factorsfactorially. <strong>The</strong> latter allows not onlythe direct assessment <strong>of</strong> the effects <strong>of</strong>the df fferent factors, but also deternineswhether they interact In any way,5.1 PRIMARY PRODUCTIVITYShaffer and Onuf (1985) and Onuf et al.(1973) compiled preliminary estimates forthe annual productivity <strong>of</strong> the differentcategories <strong>of</strong> plants in <strong>Mugu</strong> <strong>Lagoon</strong> (Table8). <strong>The</strong> primary praductivi ty <strong>of</strong> phytoplankton,benthic m~cr<strong>of</strong>lora, and submergedrmcrophytes was de termi ned by di s-solved oxygen techniques (Shaffer 1982).In simul taneous incubations <strong>of</strong> watersamples and sediments submerged with filteredseawater at the same location, thebenthic micr<strong>of</strong>lora were more than twice asproductive as the phytoplankton in thewater colurnn over a similar area <strong>of</strong> bottm,Submerged i~crophytes were ten timesas productive as benthic micr<strong>of</strong>lora.<strong>The</strong> distributtons and life histories <strong>of</strong>the salt marsh vascular plants at <strong>Mugu</strong><strong>Lagoon</strong> were such that net changes over agrowing season simply could not express
Table 8. Primary productivity in <strong>Mugu</strong> <strong>Lagoon</strong>: estimates <strong>of</strong> annual productivity fordifferent sources, the conditions to which the estimates apply, and conversions tosimilar units. GPP = gross primary productivity, NPP = net primary productivity, NAPP= net aerial primary productivity.SourceEstimate <strong>of</strong>primaryproductivityas measuredNP!(g C m- y-'1Factor tounderconvert-io conditionsAppl ies to g C m-' y NPP measuredPhytoplankton%70 g C m-2 y-' GPPa Subtidal NPP = 0.77 GPP~areasBenthicmicr<strong>of</strong>lora 170 g C m-' y-' GpPa Intertidal NPP = 0.77 GPP~ 130flats whenflooded +subtidalareasSubmergedmacrophytes $1,700 g C m-* GPP~ 2.10% <strong>of</strong> NPP = 0.77 GPPa 1,300intertidalflats whenflooded +2.10% <strong>of</strong>subtidala reasSalt marsh290 g dry wt m-* y-l NAPP~ Low marsh g C = 0.25 g dry wtC 70macrophytes 730 g dry wt m-' y-l NAPP~ High marsh g C = 0.25 g dry wtC 180much <strong>of</strong> the production. <strong>The</strong>refore,monthly measurements were made on 50 - 300tagged shoots <strong>of</strong> each <strong>of</strong> four species asthe most direct measure <strong>of</strong> growth, turnover,and production (Onuf et al. 1979;Onuf, unpubl. MS!. To give an idea howimportant the turnover component <strong>of</strong> productionis, more shoots <strong>of</strong> Salicorniavirginica died during the period <strong>of</strong> increasein the green parts <strong>of</strong> plants fromJanuary to August than the maximum number<strong>of</strong> shoots that were alive at any one time(Figure 41). Over the whole year thistranslated into a production <strong>of</strong> 2.3 timesas much biomass as could be identified bynet increase. <strong>The</strong> result was similar forthe three other species to which themethod applied. Production estimated fromtagging was 3.7, 1.8, and 2.9 times thenet change over the growing season forJaumea carnosa, Limonium cal ifornicum, andBatis maritima, respectively (Onuf et ale1979).Only the most general comparisons arewarranted among the productivity estimatesfor the different kinds <strong>of</strong> plants (Table8) because <strong>of</strong> the difficulties involved inconverting the various estimates into the
5000accumulated deadfI5 hours. High in the intertidal zone (theupper parts <strong>of</strong> the salt marsh), where exposurecan last for days, productivity <strong>of</strong>exposed microalgae is bound to be muchsmaller than productivity <strong>of</strong> submergedmi croal gae .oJL ' M ~ RCI_LL-__L-".I-__LL-.J' MAY JuL sEP Nov JANFigure 41. Density <strong>of</strong> shoots <strong>of</strong> x-cornia vir inica in the lower marsh <strong>of</strong>~ L a h v at e different timesduring the growing season and accumulateddead since January.same units and applying estimates to conditionsother than those under which themeasurements were made. For instance, themeasurements <strong>of</strong> submerged macrophytes andbenthic micr<strong>of</strong>loral productlvi ty were madeunder submerged conditions, yet bothgroups <strong>of</strong> plants occur intertidally aswell as subtidally and are exposed to theair at least some <strong>of</strong> the time. Productivity probably is d'ifferent in air than inwater, especially at higher elevationswhere the sediment surface can dry completely,but we don't know how different.Using high marsh sediment collected at<strong>Mugu</strong> <strong>Lagoon</strong>, Holmes and Mahall (1982)measured gaseous GO2 exchange from initfally flooded sediments as the sedimentsdrfed fn an airstream. Photosyntheticrates <strong>of</strong> the benthic micr<strong>of</strong>lora increased,coinciding with the disappearance <strong>of</strong> avisible water film on the sediment surface,and remained higher than the submergedrate for 1 and 4 hours in twotrials, Respi ration exceeded photosynthesisafter 3 and 6 hours <strong>of</strong> desiccation,at which times the water contents <strong>of</strong> thesediments were 85% and 75% <strong>of</strong> saturation,respectively, <strong>The</strong>se results qua1 i tativelysuggest that exposed and submerged productivitymay not differ greatly low in theintertidal zone (the sand and mud flats)whew daytime exposure seldom exceeds<strong>The</strong> main caveat about the productivityestimates for the salt marsh vascularplants is the uncertainty arising frommeasurement techniques and calculations.<strong>The</strong> monthly estimates are imprecisebecause <strong>of</strong> the high spatial heterogeneity<strong>of</strong> the marsh. <strong>The</strong>se errors arepropagated in the mathematical manipulationsused to generate the annual estimates.Bearing in mind tbese essential qualificationsabout comparisons between kinds<strong>of</strong> plants, extrapol ations to conditionsnot sampled, and shortcomings inherentin the techniques themselves, the contributions<strong>of</strong> various sources to theannual production <strong>of</strong> the eastern arm<strong>of</strong> <strong>Mugu</strong> <strong>Lagoon</strong> are indicated in Figure42. A1 though the submerged macrophytes(mainly the green algae Enteromorpha andUlva) are the most productive plants-where present (Table 8), they cover arelatively small area in the lagoon onaverage over the year and make a relativelysmall contribution to the primaryproduction <strong>of</strong> the entire system. <strong>The</strong>emergent vascular plants <strong>of</strong> the saltmarsh and the benthic micr<strong>of</strong>lora <strong>of</strong> theflats and subtidal areas are, in comparison,only moderately productive; but byvirtue <strong>of</strong> the large areas that they occupy,they heavily dominate total production.Shaffer and Onuf (1983) sought to explainvariation in benthic micr<strong>of</strong>l oralproductivity by relating every determination<strong>of</strong> productivity to correspondingmeasurements <strong>of</strong> chlorophyll 2, solarradiation, water temperature, communityrespiration, sediment composition, andinitial dissolved oxygen for each sample.<strong>The</strong> multiple regression performed on theentire data set accounted for only 38% <strong>of</strong>the observed variation. When the multipleregression analysis was redone monthby mnth and for sites grouped accordingto similar substrate history (similarresponses to the major storm that occurredhalf way through the study; see
.-0)Subtidai 21% <strong>of</strong> areaIntertidal flats 11% <strong>of</strong> areaLow marsh 25% <strong>of</strong> areaHigh marsh 44% <strong>of</strong> areaEntire eastern arm5.2 THE AVAlLABlLfPY OF PRIMARYPRODUCTION TO CONSUMERSMost <strong>of</strong> the plant material produced in<strong>Mugu</strong> <strong>Lagoon</strong> is separated spatially andtenporal ly from most <strong>of</strong> the potential consumers,since most production is in thesalt marsh and most consumers occur subtidallyor in the intertidal flats, <strong>The</strong>biomass <strong>of</strong> some <strong>of</strong> the sources is tootough for most primary consumers <strong>of</strong> theecosystem,+increasingly so fran the macroalgaeEnteromor ha anh through thesubmerge vascu ar plants Zostera andRuppia to the emergent v a s c u l ~ t <strong>of</strong> sthe salt marsh. esoeciallv those withwoody parts such- as ~ aicorhia l virginica,<strong>The</strong> nutritional quality <strong>of</strong> some <strong>of</strong> thesources is low for most consumers. Inmany cases this is strongly correlatedwith toughness. <strong>The</strong> high proportions <strong>of</strong>structural carbohydrates (e.g., lignin,cellulose) that make for toughness inplants require that too much bianass mustbe processed to obtain other necessarymaterial s for maintenance, growth, andreproduction. For many aquatic consumers,amino acids are in critically short supplyin these sources <strong>of</strong> primary production(Russel 1-Hunter 1970). A1 so, animal s maylack the necessary enzymes for digestion,or palatability may be low." Phyto- Benthic Sub- Emergentplankton micro- merged rnacr<strong>of</strong>loramacro- phytesphytes0Estimates based on few measurements orextrapolated from other conditionsEstimates based on many measurements underindicated conditionsFigure 42. Contributions <strong>of</strong> differentsources to the total net primary productivity<strong>of</strong> the eastern arm <strong>of</strong> <strong>Mugu</strong> <strong>Lagoon</strong>.Figures 15, 16), the variance explainedwas much higher (60% <strong>of</strong> the average)than for the whole data set. In themonthly categorization, each <strong>of</strong> the sixindependent variables was most importantduring at least lmonth. Thus, theintuitively important factors were moreimportant than the pooled analysis indicated,but not in the same way at alllocations or at all times.<strong>The</strong>re is almost no direct consumption(eating <strong>of</strong> live or recently dead plants)<strong>of</strong> the vascular plants <strong>of</strong> the salt marsh.<strong>The</strong> exceptions are (1) rare infestationsby an unidentified scale insect and anunidentified moth larva on Salicorniavir inica (Onuf, unpubl. o b s e mdb- ee inq - bv - Be1 dins's Savannah s~arrows onthe succulent tips <strong>of</strong> ~alicornia andSuaeda plants when insects are rare-Y 19791, and (3) uarasitization bydodder (cuscuta sal'ina), presumably asmuch an h m e as S~D-suckins scaleinsect. Thus, the primary ' consumption <strong>of</strong>most <strong>of</strong> this material is only after ttsdeath along a detrital pathway. Althoughmacroinvertebrates <strong>of</strong>ten play a major rolein the breakdown <strong>of</strong> this material, thereis little or no indication that they directlyassimilate the organic material o#the plant. Rather, they assimilate theorganic matter <strong>of</strong> the microbial decmposerson the surfaces <strong>of</strong> the detritus(Adams and Angelovic 1970). Perhaps thestrongest evidence that the activities <strong>of</strong>
the micrabi a1 decomposers de teni ne thenutritional value <strong>of</strong> detritus for detsitivorescmes from Tenore's (1980) grswthexperiments on the deposi t-feedfng polychaeteCap1 tel la capi tata, provided diets<strong>of</strong> detr~ tus <strong>of</strong> different ages and fromdifferent sources, Growth was much morestrongly correlated with microbial respirationthan age or source,<strong>The</strong> consequence <strong>of</strong> this intermediatestep in plant utilization by macroinvertebratesis a decreased efficiency <strong>of</strong>transfer <strong>of</strong> carbon or energy from primaryproducers to the upper levels <strong>of</strong> thelagoon's trophic web. It also increasesthe time required to complete the transferfrm prlmary producer to macr<strong>of</strong>auna. Thisincreases the chance that something elsemight happen to that organic material producedwithin the system before utilizationoccurs within the system. <strong>The</strong> most likelyalternative fates are export From theestuarine ecosystem to coastal waters byebb tides or export in the opposite directionto the upland transftion zone bysprjng high tides, especially when accornpartiedby strong winds, surf, or stormflows that can raise the stand <strong>of</strong> thewater In the lagoon far above the normaltidal extreme. In this case, the productivity<strong>of</strong> the niarsh is utillred mostly byterrestrial consumers, <strong>The</strong> physfcalseparatfon <strong>of</strong> the potential subtidal estuarfneconsumers from the salt marsh sourcei ncreaser the li kel i hood that an@ <strong>of</strong> thesealternatfve paths may be followed, apeciallywhen it is considered that rmst <strong>of</strong>the consunrers are in or on the bottan,while mrch <strong>of</strong> the material in transit cnaybF3 floatlng on the water surface.<strong>The</strong> characteristics <strong>of</strong> phytoplankton andthe benthic micr<strong>of</strong>lora that define theirtrophic relations are alimst di&netrlcal lyapposed to those just described for thevascular plants <strong>of</strong> the salt marsh (Table91, <strong>The</strong>se microbial plants are jntlmatelyassocf at& wi tR numerous consumers and arereadf ly ingested and presumably assimilatedl.However, they probably leak theircontents faster in life and after deaththan the salt marsh mcrophytes, and thisdecreases their availability to macroconsumers.Also, they decrease in nutritfonatquality very rapidly after death,while the salt marsh macrophytes slowlyincrease, kspi te these restrictions,the net result is that the trophic efficiency(proportion <strong>of</strong> the h-iornass OF theplant converted into mitcr<strong>of</strong>auna! bj0iniissjwithin the estuarine ecosysterti;l is ruchhigher for phytoplankton and benthicmicr<strong>of</strong>lora, and mrlch less is exported tosome other systm than for salt 1~3ar;hmacrophytes.<strong>The</strong> differences in the availability <strong>of</strong>benthic micr<strong>of</strong>lora and phytoplankton toconsumers are a consequence <strong>of</strong> mode <strong>of</strong>presentation (adhering to a surfacc vs,suspended in water). <strong>The</strong>se tli fferencesprobably affect the kind <strong>of</strong> conrumer (depositfeeder vc,. suspension feeder) inorethan the amount that is available for consumption,a1 though the gelatinous sheathon some f i ldrnentous cnlonial epiphyticfornis <strong>of</strong> benthic micr<strong>of</strong>lora light be anobstacle to herbivores as it can be inmany freshwater systermrs (Porter 1977).Also, the difference in surface to volumeratios between planktonic and benthicoccurrence shou'i d affect leaching rates.Plnally, when benthic mats lift <strong>of</strong>f thebottotn en masse and float on the surfacc<strong>of</strong> the water, hayed up by oxygen bubblesduring perfods aF active photarynthesis(see Chapter 41, they are more lfkely tobe stranded in the high-tide wrack thanrnateridl suspended in the water col urnn,Nevertheless, phytoplankton and the henthicrnicr<strong>of</strong>lora are trophical ly very simllarin thfs system.<strong>The</strong> submerged rnacrophytes are intennediatein their trophic characteristicsbetween the extremes posed by salt marshvascular plants and the rrlicr<strong>of</strong>lora. Submergedtnacrophytes and the bulk <strong>of</strong> themacr<strong>of</strong>aunal primary consumers <strong>of</strong> theestuarine ecosy%tm are in close proxiniity. <strong>The</strong> subrrrerged macrophytes are notimtwdiately accessible to the infauna, butare only centimeters away and actuallyserve as the substrate for sane surfacedwellingfarms. <strong>The</strong>y [nay be out <strong>of</strong> reachor too refractory for sane or most consumerswhen alive but rapidly becorw nioreavailable after death (at least judging bytheir rapid rates <strong>of</strong> loss compared tomarsh plants [Figure 431). As a result <strong>of</strong>these characteri stics, submerged rtlacrophytes;re likely to De tis& wit9 ;wderatetraphic efficiency wl thin the estuarineecosystetn, and trmderate quantities wi 11 be
Tabie 9. Factors reducing the util ization <strong>of</strong> d source <strong>of</strong> primary production by macroconsumerswithin the <strong>Mugu</strong> <strong>Lagoon</strong> estuarine ecosystem,FactorBenthicmicr<strong>of</strong> loraP hy to- (including Submerged Salt marshpiankton epiphytes) macrophytes macrophytesPhysical or temporal None None Small Largeseparation betweensource & consumerLive ti ssue unmanageabl emechanicallyNoSt ightly Moderately Ve ryLive tissue low in nutri- N o No Moderately Verytional qua1 i tyAging requi red before N o No Brief Longconsumpti on as detritusExport to coastal waters Moderate Moderate High HighExport to upland edge No Slight Slight ModerateLeaching <strong>of</strong> di ssol ved or- High Moderate Moderate Lowganic matter from 1 ivingto lowplantsLeaching <strong>of</strong> di ssol ved or- Very high Very high Moderate Moderateganic matter from deadplant materialexported to adjacent terrestrial andmarine systems.<strong>The</strong>re is one possible qualification inthis analysis <strong>of</strong> the trophic status <strong>of</strong> thesubmerged macrophytes. <strong>The</strong> very highlevels <strong>of</strong> production that are possiblelocally and rapid decomposition can be toomuch <strong>of</strong> a good thing. <strong>The</strong> mats <strong>of</strong> decomposingseagrass or macro1 agae can becomeso thick that the lower layers go completelydnaerobic, turning the surfacelayers <strong>of</strong> the sediment into a black,hydrogen-sul fide-produci ng flocculentlayer. A1 though some benthic invertebratescrawl into the overlying a1 gae, theinore sedentary organisms are probablykil led (Onuf and Shaffer, pers. observ.) .Clearly this will decrease trophic efficiency.In summary, the characteristics and distribution<strong>of</strong> the phytoplankton and benthicmicr<strong>of</strong>lora make them immediately availableto a wide variety <strong>of</strong> macroconsumers. Mostconsumption <strong>of</strong> these plants probablyoccurs while they are still alive. Relativelylittle <strong>of</strong> the organic matter producedis exported beyond the productionsite. <strong>The</strong>refore, phytoplankton and benthicmicr<strong>of</strong>lora are probably used withhigh trophic efficiency within the estuarineecosystem.Submerged macrophytes are immediatelyavailable to some consumers but localproductivity can be too great to be entirelyconsumed. Some, perhaps most,submerged macrophytes are consumed asdetritus, soon after death. Some
the lagoonal fauna, Consklering the re1 a-tively high availability <strong>of</strong> benthic micr<strong>of</strong>loraand very low availability <strong>of</strong> saltmarsh vascular plants, it is likely thatthe benthic micr<strong>of</strong>lora is the most importantfood for primary consumers in thelagoon, fol lowed by submerged macrophytes,salt marsh vascular plants, and phytoplankton.In contrast, salt marsh vascularplants contributed most <strong>of</strong> the totalestuarine primary production, fol lowed bybenthic micr<strong>of</strong>lora, submerged macrophytes ,and phytoplankton (Figure 42).5.3 PRIMARY CONSUMPTION00 100 200DaysFigure 43. Decomposition in water <strong>of</strong>macrophytes that occur in southern <strong>California</strong>coastal wetlands (adapted fromNixon 1982 with values for ?partinafol i osa and Sal i cornia bigel ovi i fromWJnfl'eld 1980).submerged macrophyte biomass is exportedout <strong>of</strong> the estuarine ecosystem.<strong>The</strong> salt marsh macrophytes are unavailableto most consumers until considerableaging as detritus has occurred. Much <strong>of</strong>their biomass probably is exported tocoastal waters and to the terrestrial edge<strong>of</strong> the estuary. Consequently, salt marshmacrophyte biomass is used with lowtrophic efficiency within the estuary,<strong>The</strong> preceding is a conceptual analysis,supported only by qua1 i tative observationsin <strong>Mugu</strong> <strong>Lagoon</strong>. Nevertheless,differences in the availability <strong>of</strong> themajor primary producers to macr<strong>of</strong>aunalcowimers will have major consequences forthe trophodynamics <strong>of</strong> the <strong>Mugu</strong> <strong>Lagoon</strong> estuarineecosystem, No quantitative estimate<strong>of</strong> the effect <strong>of</strong> differential plantavailability on trophodyna~nics is possible;however, the di fferences in avail -ability seem so large that primary prodnctionby itself is a poor indicator <strong>of</strong> theimportance <strong>of</strong> a plant type in support <strong>of</strong>Typically, a food web is composed <strong>of</strong>several distinct groups <strong>of</strong> organisms atany trophic level. A major determinant <strong>of</strong>the structure <strong>of</strong> the next higher level isthe separation among consumer groups accordingto which <strong>of</strong> the available foodresources they exploit. <strong>The</strong> primary consumers<strong>of</strong> the <strong>Mugu</strong> <strong>Lagoon</strong> estuarine ecosystemare differentiated according t<strong>of</strong>ood source only to a limited extent. Forinstance, in the salt marsh, the snailMelam us 01 ivaceus usually is associatediiETi%kense accumulations <strong>of</strong> Limoniumcalifornicum leaf litter, and judging-bythe feeding preferences <strong>of</strong> its similarlylocated congener M. bidentatus in Atlanticcoast salt mars-jies, it feeds on thatlitter (Rietsma et al. 2982). On theother hand, Ceri thidea cal ifornica, theother common snail in the marsh, grazesthe sediment surfaces and the stems <strong>of</strong> themarsh plants. Although it also consumesfragments <strong>of</strong> the marsh plants, benthicmicr<strong>of</strong>lora is its main nutritional source(Whi tl ach and Obrebski 1980). Final ly,the crab Pach ra sus crassipes scrapesthe sediment -=-!5h surface en it feeds in themarsh (Onuf and Quammen, pers. observ.).Certainly it ingests the benthic micr<strong>of</strong>loraon the surface, but the detritus andorganisms in the sediment immediatelybelow the surface are likely to be muchmore heavily exploited than by Ceri thidea.In other parts <strong>of</strong> the ecosystem, nicheseparation according to source <strong>of</strong> primaryproduction is less evident. <strong>The</strong> onlyobligate grazers on the submerged macrophytesare the <strong>California</strong> brown sea hare(Aplysia cal i fornica) and brant, and theyare found only occasionally within the
lagoon. Coots and dabbling ducks feedupon submerged macrophytes, brat also takesmall invertebrates in the sediment. <strong>The</strong>crab Hemigrapsus oregonensi s certainly iscapable <strong>of</strong> shredding 1 ive macrophytes andwill grow well in the laborator~y providedsolely with Enteromorpha (Kvris and Mager1975); however, in nature it feeds on diatm~sas we1 l (Morris et a7. 1980) and is ascavenger and a predator (Chapman et al,1982). As for the rest <strong>of</strong> the primaryconsumers, they depend mostly on the samefood: small organic particles, probablywith little discrimination as to origin,whether they are true phytoplankton,benthic micr<strong>of</strong>l ora, fragments <strong>of</strong> submergedmacrophytes, or detritus derived form sal tmarsh vascular plants, Also, a widevariety <strong>of</strong> organisms are, to a limitedextent, capable <strong>of</strong> upta1.e <strong>of</strong> dissolvedorganic carbon (Stephens 1.982). Bacteriaand other microbial decotnposers are importantnutritional sources and are consumedmainly in association with detritalparticles.Apparently, loca tional factors and thephysical characteristics <strong>of</strong> habitats aremuch more important than plant type inexplaining the relatively great variety <strong>of</strong>primary consumers in the <strong>Mugu</strong> <strong>Lagoon</strong> estuarineecosystem. Thus, very differentorgani srns will use the same fine-particledorganic material, and they will do so invery different ways depending on whether:(1) it is suspended in the water column,adhering tu surfaces, or mixed in sediments;(2) the sediment is sandy or muddy;(3) the location is never exposed to airor seldan flooded; (4) water movements arefast or slow; or other factors.<strong>The</strong> bivalve mollusks and ghost shrimpprovide the best illustration <strong>of</strong> how theprimary consumers <strong>of</strong> <strong>Mugu</strong> <strong>Lagoon</strong> arepartitioned in the apparent absence <strong>of</strong>different food sources. Peterson (19771,following Warme's (1971) analysis, describedthree distinct assemblages in theeastern arm according to the substratetype with which they were associated, <strong>The</strong>sand community (95%-98% sand, i.e., particles50.06 mm) occurred in the subtidalchannel, which connects the subtidal ponds<strong>of</strong> the eastern arm to the mouth <strong>of</strong> thelagoon (Figure 13). <strong>The</strong> "mud" cmmuni ty(actually 50%-90% sand) occurred in thewestern subtidal pond, and the muddy-sandcmmuni ty occupied a narrow trans1 tionafzone between the other two communities,extending especial ly a1 ang the south shore<strong>of</strong> the subtidal pond beyond the entry <strong>of</strong>the subtidal channel (Figure 13).<strong>The</strong> three communities were characterizedby very high volumes <strong>of</strong> rnacroinvertebrates,dominance by five or six species,dominance <strong>of</strong> suspens ion-feedi ng, andstrong stratification among species accordingto their depth in the sediments(Figure 44). Ordinarily, several speciesexploiting the environment in the same waywould not be expected to coexist in thesame place (Gause' s cmpeti tive exclusionprinciple). <strong>The</strong>re are three general explanationsfor how similar organisms cancoexist. <strong>The</strong>ir densities can be heldbelow the level at which competitive exclusionsoccur by: (If physical disturbance(temporary extreme condi tions thatcause mortality), or (2) losses to naturalenemies (predators, parasites, or pathogens),or (3) resource partitioning (nichedifferentiation).<strong>The</strong> very high volumes <strong>of</strong> organisms(6,000 to 8,200 cm3 <strong>of</strong> organisms/m2 <strong>of</strong>bottom) that are continually present suggestthat populations are at or nearcarrying capacity , thus el iminating explanations(1) and (2). However, tests s<strong>of</strong>ar have failed to demonstrate the necessaryselective feeding among fi 1 terfeedingbivalves (Vahl 1973) to make partitioning <strong>of</strong> the food resource a possibility. <strong>The</strong>se considerations, together withthe clear evidence <strong>of</strong> depth stratification,led Peterson (1977) to infer thatcompetition was the main factor responsiblefor the organization <strong>of</strong> all three canmunities, but that space, rather thanfood, was the resource in short supply.According to this interpretation, organismsshould be much mare sensitive tochanges in the densities <strong>of</strong> organisms inthe same depth than to changes in thedensities <strong>of</strong> organisms in other strata.Several independent 1 i nes <strong>of</strong> evidencebear on this hypothesis. <strong>The</strong> ghost shrimp,Call ianassa cal i forniensis, over1 apsbroadly in depth in the sand communitywith the clam' Nuttallia (San uinolaria)nuttall i i ( F i g u r m o w e b -vidual samples, where one is abundant, theother tends to be rare, Thus, whereas
a SAND MUDDY SAND e "- Protothaca Protothaca-MUD'IFigure 44. Stratification in the depth <strong>of</strong> living position <strong>of</strong> the abundant shelledinvertebrates in sand, muddy-sand, and "mud" habitats <strong>of</strong> <strong>Mugu</strong> <strong>Lagoon</strong>, based on hand-dugsamples (adapted from Peterson 1977).niche overlap is broad in the horizontalplane for many inhabitants <strong>of</strong> the community and narrow in the vertical dimension,the opposite is true for Call ianassa andNuttallia. After Peterson (1977) eliminatedmCallianassa from part <strong>of</strong> an areawhere they had been abundant, juvenileNuttallia were 60 times more abundant thanwhere Callianassa had not been removed.Apparently, Call ianassa 's intense reworking<strong>of</strong> the sediment (all the sand to adepth <strong>of</strong> 50 cm in a few months, accordingto MacGini tie's [I9341 calculation) ki 1 lednewly settled Nuttallfa by burial or perhapsingestion. Alternatively, Nuttallialarvae may have selectively settled in theremoval area, respondi rig to physicochecnicalchanges in the sediments, such as increasedanoxi a.<strong>The</strong> mechanism that seems to determineNuttallia's abundance and size in themuddy-sand community is almost the exactantithesis <strong>of</strong> that just described for thesand community. Here, its depth range isoccupied by two very large clams, Tresusnuttal li i and Saxidomus nuttall i i , threeto four times as large as Nuttallia, withlarge siphons extending to the surface.When Nuttallia were introduced to themuddy-sand community in the presence <strong>of</strong>different species <strong>of</strong> the natural communityand in isolation, their growth was unaffectedby the surface dwellers (the clamProtothaca staminea and the sand dollarDendraster excentricus). But growth wasdepressed -80% by the presence <strong>of</strong> theoccupants <strong>of</strong> their preferred depth stratum(Tresur and Saxidomus) (Peterson and Andre
1980). Also, there was an increased tendencyfor Nuttallia to emigrate in thepresence <strong>of</strong> Tresus and Saxidomus.In an additional experimental treatment,in which live Tresus and Saxidomus werereplaced by she1 1s filled with sand andfitted out with surrogate siphons madeout <strong>of</strong> wood, the growth <strong>of</strong> Nuttalliaalso was reduced significantly. In contrast,surface-dwell ing Protothaca werenot affected by the Presence <strong>of</strong> eitherNuttallia or ~resus and Saxidomus, eventhouah all four s~ecies are sus~ensionfeed
sand where they occurred* 3udging fratthe low sediment carbon values in Warme's(1966, 1971) analyses for the sand channel,filter feeding may be necessary at<strong>Mugu</strong> <strong>Lagoon</strong> as we7 1.<strong>The</strong> blol ogy <strong>of</strong> other primary consumersin <strong>Mugu</strong> <strong>Lagoon</strong> is not well studied, <strong>The</strong>four small crustaceans that have beenabundant at least sporadically in theeastern arm between 1977 and 1982 areassociated with compacted sediments andhard surfaces (the gamma ridean anphi podGorophium acherus icum), the surfaces <strong>of</strong>macrophytes (another gammaridean amphi pod,and unconsol idatedcaprel lid amphSpodand the cumacean. <strong>The</strong>y eitherss loose particleson a surface or suspension feed (J.W.Chapman, EPA, Newport, Oregon; pers.cmm.). Only Pontogeneia is likely toexploit other f~snurces in add1 tion tothe small particf e mix <strong>of</strong> benthic micr<strong>of</strong>loraand detritus, Encrusting animals aswell as macroalgae are prminent Anhabitantson the surfaces <strong>of</strong> rnacraphytes andmay be eaten by . Thus, locatlonnlfactors amore importantthan diet in niche differentdatlon for thesmall crustaceans as well as for thebl val ves and yhos t shrimp.No one has studded the feeding habits <strong>of</strong>the s<strong>of</strong>t-bodied invertebrates at <strong>Mugu</strong><strong>Lagoon</strong> in detail ; however, general iza tionsmay be made based on studies elsewhere onthe same or related species.<strong>The</strong>re are three modes <strong>of</strong> primary consumptfon among the saf t-bodied ?nvertebrakesaF <strong>Mugu</strong> Laqoon: suspensionfeebfng, surface-deposi t feeding, andsubsurface-deposl t feeding dl1 e hrrowing,A17 are based on fine particulateorganic matter. As with the clams andCall Sanasza, the distinctions among feedingmdes are blurred, For Instance, in astudy <strong>of</strong> feeding in three species <strong>of</strong>spionid warns nomally classified assurface-deposit feeders, Taghon et al.(1388) denrons t~ated changes between deposft feeding and suspension feeding, dependingon the flux <strong>of</strong> particles grassingby in the water column, Alternatively,Jumarr, et a1. ((182) reported an abruptswitch to "a decidedly macrophagous, predatorymode" when small crustaceans warminto the tentacles <strong>of</strong> two os thesespecies, <strong>The</strong>se Findings almost certainlyare <strong>of</strong> significance in <strong>Mugu</strong> <strong>Lagoon</strong>, Half<strong>of</strong> the '"mall worm-like" taxa listed inTable 4 are spionids. Furthenore, theanimals used in the studies citrd above,collected on San Juan Island, Masklington,were in the sarile shallow-watev, s<strong>of</strong>tbottomenvi romnent as in <strong>Mugu</strong> <strong>Lagoon</strong>.As with the other major grouos <strong>of</strong> primaryconsumers, spatial separation <strong>of</strong>s<strong>of</strong> t-bodied invertebrates ir co~spicuaus,Depth stratification is iinplici t in thenarnes <strong>of</strong> trophic groups that exhibit suspensionfeeding, surf ace-deposi t feeding,or subsurface-deposi t feeding (above, on,and atnder the sediment surface). In aifdltion,Whi tlach (1980) documented verticalstratifjcdtion within the sediments in hisstudy <strong>of</strong> the deposit feedlng conrirluni ties<strong>of</strong> Barnstable Harbor, Massachusetts, aswell as horizontal differentiation, Inparticular, he observed that many morespecies co-occurred in samples rich inorganic matter than in sarnples that werepoor in organic matter. Furthernore,those that were abundant across the wholerange <strong>of</strong> sediments sampled overlappedless with other species in depth distributionand particle size utilization t.hanthose that occurred only where organicmatter was abundant. Whi tlach (1980)inferred frm these patterns that cmpctitive interactions were important determinants<strong>of</strong> the organization <strong>of</strong> the depositfeedingguild. When food was meager, onlythose few species that were distinctlydl fferent in their feeding characteristics,especial Iy feeding location, couldco-occur. When the organic content <strong>of</strong> thesediments was high and presumably food wasabundant, these species were joined byothers that over1 apped broadly wi th eachother and with those already present inboth the1 r vertical distributions andparticle-size utilizations. Densitydependentpredation, interference amongconspecifics at high densities, or sotneother factor may have to limit the specialistswhen food is abundant, Otherwise, why don' t the speci a1 i sts increaseta the point that food again is too irreagerfor generalists, regardless <strong>of</strong> the rate <strong>of</strong>supply?
Despite uncertainties about the precisemechanism <strong>of</strong> interaction amng the s<strong>of</strong>tbodiedinvertebrates, bi<strong>of</strong> ogical interactionsare major determinants <strong>of</strong> the organization<strong>of</strong> this group. Spatial differentiationis one manifestation <strong>of</strong> thoseinteractions. Although the analysis <strong>of</strong>factors inv<strong>of</strong> ving the relations among thes<strong>of</strong> t-bodi ed invertebrate primary consumersrelies on information collected in othergeographic regions, concl usions aresimilar to those from the detailed studies<strong>of</strong> the shelled invertebrates at <strong>Mugu</strong><strong>Lagoon</strong>, Namely, a high level <strong>of</strong> spatialsegregation al1ow.s a varied assemblage <strong>of</strong>consumers to subsist on essentially thesame food resource,5.4 PREDATIONIn <strong>Mugu</strong> <strong>Lagoon</strong>, secondary consumers areconfronted with a wider choice <strong>of</strong> possiblefoods than the primary consumers. Ofcourse, the secondary consumers are confrontedwith the same challenges posed bythe physical environment as are the primaryconsumers. Secondary consumers canexploit their food resource selectively bykeying in on a specific prey (for instance,ambush predation by halibut oncrustaceans or other fish) as well as bykeying in on a specific physical environment(for example, shallow-feeding shorebirdsfeeding on a mudflat).Birds and fish, the two most obviouscategories <strong>of</strong> secondary consumers and probablythe most important, are constrainedfirst by characteristics <strong>of</strong> the physicalenvi ronment. Shorebi rds are 1 imi ted tointertidal areas and can use them onlywhen they are exposed at low tide. It isequally obvious that fish and diving ducksare limited to areas covered by water.Although this does not preclude their use<strong>of</strong> intertidal areas, it reduces the availability<strong>of</strong> those areas compared to areasthat are always submerged. As describedin the previous chapter, there was nodiscernible difference in the speciescmposi tion or abundances <strong>of</strong> invertebratesbetween intertidal and subtidal benthicsamples in the same general area <strong>of</strong> thelagoon. This suggests that, at least atthe grossest level, differentiation <strong>of</strong> thephysical envi ronment is more importantthan differentiation <strong>of</strong> the food supplyIn determining the organization <strong>of</strong> thesecondary-consumr trophic I eve1 . (Thisanalysis may not apply to the small crustaceans,because they were not adequatelysampled by the techniques used.)<strong>The</strong> most conspicuous predatory activityin the <strong>Mugu</strong> <strong>Lagoon</strong> estuarine ecosystem isthe scurrying about <strong>of</strong> shorebirds on themudflats, sticking their bills into themud every few seconds and presumablypulling out something to eat much <strong>of</strong> thetime. Since small worm-1 i ke invertebratesare usually the abundant organisms nearthe surface <strong>of</strong> the mud, it is reasonableto infer that they are the principal prey<strong>of</strong> the shorebirds. Given the abundance <strong>of</strong>the shorebirds, it is likely that theyconsume many worms; however, that is asfar as reasonable inferences can go. Itcannot be said whether predation substan-tially reduces the densities <strong>of</strong> worms,a1 ters the relative abundances <strong>of</strong> differentspecies or, if either <strong>of</strong> these occurs,whether the shorebirds are responsible forthe effect (rather than fish that can forageon the mudflats at high tide).A number <strong>of</strong> field experiments at <strong>Mugu</strong><strong>Lagoon</strong> and Upper Newport Bay, Cali fornia,have elucidated the predator-prey re1 a-tionships between shorebirds and s<strong>of</strong>tbodiedbenthic invertebrates (Quammen1981, 1982, 1984). At a muddy (8% sand)site studied by Quammen, benthic invertebrateswere much more abundant in summerthan in winter (Figure 45a), when surfacefeedingshorebirds were abundant (Figure45b), and their feeding activity wasintense. At a muddy-sand (80% sand) site,densities <strong>of</strong> the same invertebrate specieswere higher in summer than in winter (Ffgure45a). <strong>The</strong> differences in seasonalabundance were explained by both predationand site characteristics. When shorebirdswere experimentally excluded at the muddysite, infaunal densities remained highthroughout the year, clearly pointing topredation as a major factor in controllinginfaunal abundances. Quammen found, however,that the addition <strong>of</strong> a thin layer <strong>of</strong>sand to muddy sediments reduced shorebirdfeeding activities by more than ha1 f, <strong>The</strong>added sand did not after the mud surfacevisually, nor the density <strong>of</strong> the worms inthe top 2 cm <strong>of</strong> sediment, suggesting thatcoarse particles at densities higher than8% in surface layers <strong>of</strong> mudflats deter
the crabs were not present, densitiesinside and outside the exclosures weresimilar. Thus, crabs, not shorebirds,were the major predators on the invertebratesin the muddy-sand sediments, However,even here, shorebirds (in this case,the large probing shorebirds rather thanthe small surface-feeding shorebirds) maybe ultimately responsible for the seasonalpattern <strong>of</strong> abundance in infaunal invertebrates.Large shorebirds, especial lywillets, preyed heavily on the crabs whenboth were present on these flats for abrief overlapping period in the latesummer (Figure 45c). Thus, the absence <strong>of</strong>crabs, perhaps in response to the relativelyhigh densities <strong>of</strong> willets, togetherwith the low abundance <strong>of</strong> surface-feedingshorebirds, accounted for the high winterpopulations <strong>of</strong> the s<strong>of</strong>t-bodied invertebratesin "sandy" mudfl ats.MonthFigure 45. <strong>The</strong> abundances <strong>of</strong> worms,surface-feeding shorebi rds, and crabs andwillets through the course <strong>of</strong> a year attwo locations varying in sand content <strong>of</strong>the substrate. Crabs were not present atthe muddier site.shorebird feeding, probably by interfering~4th prey capture.Predation control led the infaunal abundanceat the muddy-sand site, but in adifferent manner. Use <strong>of</strong> the site bysurface-feeding shorebirds was much lowerthan at the muddy site (Figure 45b), perhapsin part due to the interference <strong>of</strong>coarse-grained sediments described above.Another predator, the lined shore crab( crassi es) was abundant duriiT-#k- e site (Figure 45c),but was absent at the mddy locations.When the crab was abundant, infaunaldensities were low. When crabs wereexcluded, densities <strong>of</strong> the benthic inver-tebrates increased re1 a Live to those outsidethe exclosures, In the winter, whenIn sumrnary, predation, especially byshorebirds, is a major influence on thesmall s<strong>of</strong> t-bodied primary consumersinhabiting mudflats. <strong>The</strong> influence is astrong seasonal effect on abundance because<strong>of</strong> the migratory habit <strong>of</strong> shorebirds.Predation may produce oppositepatterns <strong>of</strong> seasonal abundance on intertidalflats, depending on the amount <strong>of</strong>sand in the substrate and whether theshorebirds prey directly on the worms <strong>of</strong>the mudfl a ts (su rface-feedi ng shorebirdswhere little sand is present) or on thecrabs that prey directly on the worms.A1 though not explicitly stated above,another important characteristic <strong>of</strong> theseinteractions is that there is no obviouseffect on the relative abundances <strong>of</strong> preytaxa; i.e., apparently there is littleselection among prey or differentialresponse such as might be expected forprey with different life histories subjectedto the same intensity <strong>of</strong> predation.Changes in the relative abundances <strong>of</strong> differenttaxa are more common in other systems.Physical factors seem to be muchmore important in defining the characteristics<strong>of</strong> the trophic interaction thanwhat prey are eaten.Peterson's (1982) exhaustive study <strong>of</strong>the population biology <strong>of</strong> the similar andre1 ated bivalves Protothaca staminea andChione undatella provides a strong contrastto the preeminence <strong>of</strong> physical factorsover characteristics <strong>of</strong> the prey in
determining the features <strong>of</strong> the 1 i nkagebetween primary and secondary consumerlevels, Here, despite similar position inthe substrate, shape, and to a lesserextent size, Protothaca suffered re1 a-tively high mortality, mostly attributableto a variety <strong>of</strong> predators, In contrast,mortality in Chione generally was low, and1 iitle or no mortality was caused by predation.Apparently, Chione's sf ightiybigger size and heavier she71 at all sizesmade it essentially immune to predation.In complement to these survivorship patterns,recruitment by Protothaca was overan order <strong>of</strong> rnagni tude higher and less variablefroin year to year than recruitmentby Chione.For the most part, fishes in <strong>Mugu</strong> <strong>Lagoon</strong>are not major consumers <strong>of</strong> infauna. Apartial exception is sipt ~n-nipping (partialin the sense that the victim survives,unlike the victim in most predatorpreyinteractions). For Protothaca, theeffect <strong>of</strong> siphon-nipping can be considerable,depending on location.Peterson and Quammen (1982) observedthat the growth <strong>of</strong> Protothaca in the cleansand environment at <strong>Mugu</strong> <strong>Lagoon</strong> was overtwice as great inside cages that excludedlarge predators (6-mm openings) as in cagecontrols or open areas, but that there wasno difference in the muddy sand environment.This suggested that the presence <strong>of</strong>predators affected growth in one area butnot the other. Observations <strong>of</strong> Protothacafn aquaria eliminated the possibility thatreduced growth was the consequence <strong>of</strong>closing up for protection in the presence<strong>of</strong> potential predators. Protothaca fedjust as actively in the presence <strong>of</strong> a variety<strong>of</strong> predators as in their absence.Clam siphons were common in the guts <strong>of</strong>two fishes, the staghorn sculpin (Leptocottusarmatus) and the diamond turbot(Hypsopsettaguttul ata). Reducedqrowth would be an expected cost <strong>of</strong> reqen-Grating the siphon. Also, feeding effjciencyis likely to be lower until the feedingorgan is fully replaced. <strong>The</strong>refore,the cropping <strong>of</strong> siphons by fishes probablyaccounts for the enhanced growth <strong>of</strong> Protothacawithin exclosures in the clean sandenvi ronrnent.<strong>The</strong> interesting thing is that there isno such reduction in growth in the muddy-sand envi ronment, despite higher densities(2,3x) <strong>of</strong> the two important croppers andsiphons occurring more frequently (1.8~)in their diets. <strong>The</strong> explanation issimple. Not only was Protothaca muchdenser in the muddy sand site than in thecl ean-sand site (2,7x), but a1 so anotherbivalve, Macoma nasuta, was even denserthan ~rotothaca 'm-. <strong>The</strong> net resultwas that Macoma bore the brunt <strong>of</strong> thecroppins [ T i n this environment asdeternined'by identification <strong>of</strong> siphons inguts to species, <strong>The</strong> remainder was distributedover a bigger population <strong>of</strong> Protothaca,such that the cropping rate perm u a l was at least 40% lower than inthe clean sand. Thus, in this case, thepresence <strong>of</strong> an alternate prey accounts fora difference between locations in the outcome<strong>of</strong> a trophic interaction.We know the other feeding activities <strong>of</strong>fishes froin analyses <strong>of</strong> their gut contents(Table lo), but the effects on lower trophiclevels have not been worked out insuch detail as the cases described above.Some species concentrate on a narrow range<strong>of</strong> food. Large <strong>California</strong> halibut, forinstance, feed mainly on other fishes,while large topsmel t contain (feed on?)plant material and mud (or the diatom filmassociated with it?), and large shinersurfperch eat mainly small crustaceans(gammarid and capre11 id amphipods, andcumaceans). However, the diets <strong>of</strong> theselatter two species change ontogenetically.<strong>The</strong> smaller sizes <strong>of</strong> both species eat zooplanktonalmost excl usively. <strong>The</strong> otherspecies listed in Table 10 have more varieddiets, For instance, small crustaceansand gastropods were most importantfor <strong>California</strong> kil lifish, whereas polychaetes, moll usk siphons and large crustaceanswere most important for diamondturbot.Despite the variety <strong>of</strong> foods consumed bythe fishes <strong>of</strong> <strong>Mugu</strong> <strong>Lagoon</strong>, two commontrends are evident. First, the feedingactivities <strong>of</strong> the fish tend to be focusedat sediment or submerged plant surfaces orin the water column rather than in thesediment. Only the sixth most abundantfish, the diamond turbot, commonly con-sumed buried prey (po'lychaetes), and eventhen other items were at least as important.In this characteristic, the ffshare almost rfian~etricaliy the opposite <strong>of</strong>
Table 10. <strong>The</strong> gut contents <strong>of</strong> fishes in <strong>Mugu</strong> <strong>Lagoon</strong>, February 1977-January 1478,all stations (see f'igure 34) and rllonths comblnd. See fable 4 for the taxonortriccmpas'llion af mst prey categories. 0 = overwhelming predo~inance, k( = veryimportant, I = Important, G -. cwfilrrron, P = present.Food typesI-.E t a ,-3 m u arV) ck i w 5 2 C,D 6 u m u ICrRT w Co w 4.- UL 0.r- .,-Shiner ourf~~rch4 100 mn 133Cal Ifornf d ha1 ibutclQO mnr 3 1. P CdPan togeneia1-1 ":kGta~~ shrimpm GobyoFish mbryosFish fry, ernbryos, and pipefish,
the shorebirds, the other irnportantsecondary consumers <strong>of</strong> <strong>Mugu</strong> <strong>Lagoon</strong>, sincethe shorebirds consume polychaetes andother invertebrates living Sn the sedimentsto a greater extent than speciesthat 1 ive on the surface or in the watercolumn. Thus, the two groups <strong>of</strong> secondaryconsumers are complementary in what theyfeed on as we1 1 as where and when (seasonallyand during a tidal cycle) theyfeed,<strong>The</strong> other trend is the prevalence <strong>of</strong>crustaceans in the diets <strong>of</strong> the fishes.This is especially true <strong>of</strong> the small crustaceans,important at some stage <strong>of</strong> lifeto a1 1 fish species except the topsmel t.<strong>The</strong> converse does riot appear to be true,however: important as ssral 1 crustaceansmay be to fish, fish do nct appear to havemuch effect on the popuiations <strong>of</strong> smallcrustaceans, This is the tentative interpretation <strong>of</strong> the fol I owi ng observations.Chapman et a], (1982) generated relativemeasures <strong>of</strong> the intensity <strong>of</strong> predation byfish on small crustaceans from analyses <strong>of</strong>the gut contents <strong>of</strong> a1 1 the common fishes<strong>of</strong> <strong>Mugu</strong> <strong>Lagoon</strong> combined with monthlydeterminations <strong>of</strong> fish abundances. <strong>The</strong>rewas no indication <strong>of</strong> responses by the preypopulation even under the particular conditionswhen an effect <strong>of</strong> the fish wouldseem most likely. Amphipod and cumaceanpopulations did not decline when the rate<strong>of</strong> their consumption by fish was highestrelative to the density <strong>of</strong> small crustaceansany more <strong>of</strong>ten than when the consumptionrate was low relative to preydensity,Of course, the importance <strong>of</strong> predationcan be expressed in another way. A behavior<strong>of</strong> a prey that can be demonstratedto reduce its losses to a predator islikely to be an evolutionary adaptation topredation. Predation still might be amajor factor in the biology <strong>of</strong> an animal ,even in the absence <strong>of</strong> losses to predatorsat present, if the present immunity hasresulted from behavioral adaptations thatreduced predation. Vertical migration(nocturnal forays from the bottom or fromthe surfaces <strong>of</strong> plants into the watercolumn) by the small crustaceans <strong>of</strong> <strong>Mugu</strong><strong>Lagoon</strong> (Figure 46) could be a case inpoint. Because the time spent in thewater column is always during the night,investigators el sewhere have proposed thatvertical migration could be adaptive foravoiding diurnal visual predators such asfish, Experiments conducted in <strong>Mugu</strong><strong>Lagoon</strong> do not support this hypothesis,<strong>The</strong>re is no clear evidence <strong>of</strong> a major rolefor predation in the biology <strong>of</strong> the smallcrustaceans in <strong>Mugu</strong> <strong>Lagoon</strong>.5.5 HIGHER TROPHlC LEVELSWe have almost no information on thetrophic interactions beyond the secondaryconsumers. Higher-1 eve1 predators areprimarily piscivorous birds and fish.Spatial segregation is obvious among themajor groups <strong>of</strong> high-level predators. <strong>The</strong>wading fishers (Table 7), mainly heronsand egrets, confine their activitiesalmost exclusively to shallow water nearthe waterline. <strong>The</strong> aerial fishers, mainlypelicans and terns, prey on fish in thesurface layers and visible frm the air.<strong>The</strong> diving fishers, mainly grebes, mayexploit bottom-dwell ing fish in the deeperparts <strong>of</strong> the lagoon. <strong>The</strong> most importantoiscivorous fish is the Ca1 ifornia ha1 ibut(Para1 ichthys cali fornicus) (Table lo),which spends most <strong>of</strong> its time on thebottom.Observations about the feeding <strong>of</strong> thetop level predators in <strong>Mugu</strong> <strong>Lagoon</strong> aredifficult to obtain. In most cases theprey are consumed too fast to identifywhat is being eaten. We know that earedgrebes eat diarnond turbot because thebirds have such a hard time eating them;however, we know nothing about the meals(if any) that went down easier. Also,gulls and terns obviously eat topsmeltbecause they stick so far out <strong>of</strong> thebills, but we know nothing about thebi rds' predation on other fishes.One possible indication <strong>of</strong> an overalleffect <strong>of</strong> top predators on populations <strong>of</strong>the most common species <strong>of</strong> fish is thenumerical decline <strong>of</strong> fish in our catchesin the few months after their peakabundances (Figure 351, Assuming thatmortality is the major source <strong>of</strong> numericalchange (an untested assumption) and thatpredation is the major cause <strong>of</strong> mortal i tyin this period, fishes big enough to becaught with our seine decline %20% permonth (Figure 47). With the exception <strong>of</strong>
Figure 46. Plankton samples col Iected in the eastern arm <strong>of</strong> <strong>Mugu</strong><strong>Lagoon</strong> at: approximately hourly intervals on 7-8 August 1978. Tideheight was rneast~rcd frorn low water in the eartern ann. Reduced abundancesbetween 10 p.m. and 2 a.m. correspond to increased tide currentvelocl ties (from Chapman et a1 . 1982).staghorn sculpfn, the rates af mortalj tiesappedr to be constant frm rnonth to monthand simflar between species.<strong>The</strong> two major categories <strong>of</strong> predators -bf rds and Fish - have a cornlrBn high nlobilitythroughaut life and relatively long1 ives, <strong>The</strong>se character1 stics free thepredators frmn controls that the es tuarineenviromnent vtould impose if they wereconstrained to be full -ti~tte residents.k4uwcvcr, here the resefnbl ance ceases. <strong>The</strong>1dgout-i is at oppasite teni~ini for bird andFish r~iSgrations. <strong>The</strong> Arctic imposesstrcict searonali ty on the birds. It yrovfdesincredibly rich Food far the rearing<strong>of</strong> young but prohlblts the presence <strong>of</strong>birds in the winter, A1 though prey tendto be more abundant and airnost certainlyinore productive during the surnrwr in lvlugu<strong>Lagoon</strong>, the even greater rfchness <strong>of</strong> theArctSc during this season is a sufficientinducement for bird.; Lo rps~ that env'nrorimentwhen it can tr@ used, As a result,larger popul atlons are rnaintained, and thebirds are a rnajor influence on the structure<strong>of</strong> the <strong>Mugu</strong> <strong>Lagoon</strong> estuarine scosysternwithout befng obviously subject to itscanstraints.In contrast, <strong>Mugu</strong> <strong>Lagoon</strong> rmy be for thefishes what the Arctic is for the birds:~wch better than the adjacent ocean forsurv'lval and growth <strong>of</strong> young during thesurnnEr ht worse in the winter. Probablythe lagoon is at its most Inhospitable Forfishes during major winter stonns because<strong>of</strong> temporarily low salinity, high turbid-I ty and occasional ly wf despread ~nortal i ty<strong>of</strong> invertebrates ; however, the prevalence<strong>of</strong> Ffsh-eating birds could be a majorfactor as well, If predatian by birds isresponsfble For much <strong>of</strong> the 20% per monthlosses suggested by populatian changes inthe sumr (Figure 47), fish might haveample cause to vacate the lagoon in win-ter, hen the fish-eatSnbirds are evenngre aburidartt {FSgure 38 4 . Whatever thecause, ~atches were an order <strong>of</strong> mgnitudeless in Decmkr, January, and February
<strong>California</strong> killifish<strong>California</strong> halibutrBgbz - 20°/0 \A M J J A S O N 5 JFigure 47. Monthly changes in fish abundances in the eastern arm <strong>of</strong><strong>Mugu</strong> <strong>Lagoon</strong> after the month <strong>of</strong> peak abundance for five <strong>of</strong> the commonspecies. Based on the 5-year means for all stations combined.than they were in June, the month <strong>of</strong> peak Predators are relatively scarce, (3) Temabundance(Figure 35). peratures are high (see Chapter 2).Except for temperature, comparable datafor adjacent coastal waters are not avail-In the summer, three factors probably able; however, invertebrate abundances aremake the lagoon superior to the adjacent unlikely to be as dense outside as inslde,ocean as an environment for fish (at least and large piscivorous fish certainly aresmall fish): (1) Food is abundant, (2) present outside the lagoon but almost
nwer inside, lower predatjon on earlystages will dllow a higher proportion <strong>of</strong> apopulation to survive these vulnerablelife stages. Higher food densities wj13increase growth rates. Higher tcmperatureswill further increase the rate <strong>of</strong>growth and developinent, Individuals maybe larger than they would be wdthout theirstay in the lagoon, Presunrabfy they willk less vulnerable to many kinds <strong>of</strong> yredatorsin coastal waters kcause <strong>of</strong> their'larger size. <strong>The</strong>y rnay also siarvlvcl a period<strong>of</strong> low food better,In Pktgu lagoon less than 1% <strong>of</strong> tilc fishcaught are greater than 20 crn long (Qnufand Quamm~n, unpubl. data). <strong>The</strong> onlyrelatively catnon species caught as large5ndividuals is the shovelnose gui tarfish(Rhinoba tos ) a fascinatings-cdreat the end <strong>of</strong> thissection, <strong>The</strong> ten most cmrtun speciesaccount for over 481 <strong>of</strong> the total catchand use the laaoon to varvfrin deurees.<strong>The</strong> Cali fornfa
Table 13. <strong>The</strong> utilization <strong>of</strong> the eastern am <strong>of</strong> Hugu <strong>Lagoon</strong> by the 10 most cmmnlycaught fish species in 5 years <strong>of</strong> sampling (Onuf and Quammen 1983; see also Figure 35).Rank order byUse <strong>of</strong> <strong>Mugu</strong> <strong>Lagoon</strong>abundance in PermanentSpecies total catch residence Use consistent with a nursery functionTopsmel t 1Shiner surf perch 2Staghorn scul pin 3Large adults spawn in early spring, smalladults spawn in summer, young <strong>of</strong> yearreach catchable size in autumn.Adults give birth in the lagoon and leave,young stay only briefly.Only young <strong>of</strong> the year present in thelagoon,<strong>California</strong> killifish 4Gal iforna ha1 ibut 5Diamond turbot 6Long jaw mudsuc ker 7Bay pipefish 8<strong>California</strong> tonguef ish 9Speckled sanddab 10xYoung <strong>of</strong> year predominant in the lagoon(,80%).Apparently, adults only leave the lagoonbriefly to spawn and die.Only young <strong>of</strong> year present in the lagoon,Only young <strong>of</strong> year present in the lagoon.are found in the lagoon only as very largeadults (Onuf et ale 1979; DuBois 1981).Several hundred individuals enter theeastern arm <strong>of</strong> <strong>Mugu</strong> <strong>Lagoon</strong> in April eachyear, where they congregate in densegroups for several months and then depar~in September. Of 370 different individualscaught in 1979, 335 were females(90%) and were much larger than individuals typically encountered <strong>of</strong>fshore (Baxter1974). Of 335 females tagged in 1979,136 were recaptured in less intensive samplingover the next 2 years. Almost allfemales were carrying developing embryos ;however, the embryos were fewer and muchlarger than reported for pregnant femalescaught <strong>of</strong>fshore. Finally, the guts <strong>of</strong> a1 1females examined were virtually empty, regardless<strong>of</strong> time <strong>of</strong> capture, nor were anyeffects <strong>of</strong> predation detectable in anexcl osure experiment run where the guitarfishwere observed most frequently.<strong>The</strong> guitarfish, then, does not use theestuary either as a haven for its youngor as a feeding ground. <strong>The</strong> explanationfor its puzzling behavior may be thatthe higher suinmer temperatures in thelagoon than in the ocean are beneficialor even necessary for the development <strong>of</strong>embryos (Onuf et al. 1979). Observations<strong>of</strong> distribution and movement <strong>of</strong> shovel -nose guitarfish were consistent withthe hypothesis that they were in thelagoon during the summer to take advantage<strong>of</strong> higher water temperatures there( DuBois 1981). Temperatures were higherinside the lagoon than immediately outside,dnd within the lagoon the guitarfishshifted from shallow areas in the
day to deeper areas at night in accordancewith higher water temperatures(Section 2.41. However, no informationis available on whether the rates <strong>of</strong>development <strong>of</strong> embryos are tmperatureorsi re-dependent.5.6 NUTRIENTSSince no research on nutrient supply,availability, utilization, or cycling hasbeen conducted in <strong>Mugu</strong> <strong>Lagoon</strong>, features <strong>of</strong>the nutrient regime must be inferred fromother character-i stics <strong>of</strong> the ecosystem.Consequently, consideration <strong>of</strong> nutrientshas been deferred until most <strong>of</strong> the otherinformation about the ecosystem has beenpresented, and the di scussion is necessarilyspeculative.<strong>The</strong> major sources <strong>of</strong> nutrients to theprimary producers <strong>of</strong> the estuarine ecosystemare inputs from the watershedcarried primarily by freshwater, inputsfrom the ocean carried by tidal movements<strong>of</strong> coastal waters, and regeneration <strong>of</strong>nutrients from the organic matter producedwithin the system or by organisms movinginto the estuary. Much <strong>of</strong> the high biologicalproductivity <strong>of</strong> other estuaries isattributed to the nutrient subsidy fromfreshwater input. <strong>The</strong> climate <strong>of</strong> theregion and the geometry <strong>of</strong> <strong>Mugu</strong> <strong>Lagoon</strong> actto reduce any nutrient subsidy from thewatershed. Precipitation (Figure 5b),streamflow (Figure 7), and consequentlythe potential for freshwater inputs to theestuary are concentrated in the coldest(Figure 5a), darkest (Figure 9) monthswhen the smal lest amount <strong>of</strong> photosyntheticbiomass is present (Figures 24, 26, 29).Thus, the timing <strong>of</strong> freshwater inputs iswhen the ability for uptake by plants islowest, In addition, slnce the long axis<strong>of</strong> the lagoon is perpendicular to theinlet stream, and the mouth <strong>of</strong> the lagoonis immediately opposite the mouth <strong>of</strong> thestream (Figure lo), the freshwater and itsload <strong>of</strong> nutrients bypass most <strong>of</strong> the ecosystema1 together.Nutrient inputs to <strong>Mugu</strong> <strong>Lagoon</strong> fran theocean may be low too. Characteristically,the waters <strong>of</strong> the continental she1 fsustain much higher levels <strong>of</strong> primaryproduction than oceanic water. In thevicinity <strong>of</strong> <strong>Mugu</strong> <strong>Lagoon</strong>, the shelf isnarrow (5 - 15 km), and a submarinecanyon cuts across most <strong>of</strong> it, so thatthe water is 180 m deep only 2.5 kc) fromthe mouth. <strong>The</strong> clarity <strong>of</strong> water thatenters <strong>Mugu</strong> <strong>Lagoon</strong> on rising tides indicatesthat the water comes from thiscanyon much <strong>of</strong> the time.<strong>The</strong> remaining major nutrient inputs forprimary producers in <strong>Mugu</strong> <strong>Lagoon</strong> resultfrom the activities <strong>of</strong> consumers. <strong>The</strong>same physical and microbial processes thatbreak down macrophytes into detritus ininteractions with primary consumers areresponsible for most <strong>of</strong> the regenerationor fixation <strong>of</strong> nutrients as well. <strong>The</strong>large number <strong>of</strong> seals and birds that usethe lagoon as a resting place but feed inother shore or aquatic environments (Chapter4) could import substantial quantities<strong>of</strong> nutrients into the lagoon. Both <strong>of</strong>these sources are concentrated in subtidalareas and intertidal flats.In many coastal wetlands, high biomassand production <strong>of</strong> salt-marsh plants areassociated with ample tidal flushing. In<strong>Mugu</strong> <strong>Lagoon</strong>, low biomass and production <strong>of</strong>sal t-marsh plants are characteristic <strong>of</strong>the well-fl ushed eastern arm, while saltmarshvegetation is denser, taller, andmore luxuriant in the we1 1-fl ushed westernarm (pers. observ.). This may be due to acombination <strong>of</strong> both less flooding by saltwaterand higher freshwater input andnutrient enrichment from sources in thewatershed. An additional explanation <strong>of</strong>the difference may be that nutrient-pooroceanic waters are sapping the salt marsh<strong>of</strong> its nutrients in <strong>Mugu</strong> <strong>Lagoon</strong>, whilericher coastal waters provide a nutrientsubsidy to salt marshes in many otherareas. No measurements <strong>of</strong> dissolvedmaterials have been made to determinenutrient fluxes; however, the virtualabsence <strong>of</strong> a litter layer in the marshes<strong>of</strong> the eastern arm suggests that particulatematter is rapidly removed. Consequently,the nutrients regenerated bydecomposition <strong>of</strong> marsh litter are firstmade available and probably used in otherenvironments, such as the intertidal flatsand subtidal areas <strong>of</strong> the lagoon. Presumably,more <strong>of</strong> the litter decomposes inplace in the western arm. Where a1 lochthonausnutrient inputs are low, proximi tyto regenerated nutrients would then resultin higher biomass and production.
According to this conceptual model <strong>of</strong>t$e nutrient regime <strong>of</strong> Muyu <strong>Lagoon</strong>, allinputs to the saf t it~r-sh are si~lall inthe eastern ann, whereas at least nutrier>tregeneration, and perzrh~ps importsby animiis that feed outside the lagoon,cons iderahi y augment the avail abil i ty <strong>of</strong>nutrients to primary producers in subtidaldv-eas and on intertidal flats. Thus,riutrient availability could account fortile ginding <strong>of</strong> Dnuf et al, (1979) thatsal t-.ilarsh productivity in vie eastern an?<strong>of</strong> Rugu <strong>Lagoon</strong> Mas low cornpared to othersites at similar latitudes, whrle benthicrnicrot 17v'dl productjvi ty was similar.41 thoucjn the few ava it able ot\serva tionsare cons 1 stcnt with our corlterltion thata1 lochthonous nutrient 1 nputs 'ire low andthe importance <strong>of</strong> reg en^^-ated nutrientsfor plant growth is corrrsporld~ngly high,a1 1 interpretdtions dbo the nutrientceyinle <strong>of</strong> <strong>Mugu</strong> 1-aqoan a untested hypotheses.5.7 AN ECOLOGICAL OVERVIEW<strong>The</strong> diversity <strong>of</strong> biotic interactions inthe f9ugu <strong>Lagoon</strong> estuarine ecosystm istruly irrirnense. Earlier we alluded to thevariety, steepness, and variability <strong>of</strong> thephysicdl gradients that intersect withinestuaries to account for their bioticrichness. In this chapter we have examinedin detail how organisms in the sameand different trophic levels interact withsometin~es subtle di fferences in the physicalenvi ronrnent to produce di f ferent outcanes.<strong>The</strong>se specific case histories andthe Inare general patterns extracted fromthan provide the fullest appreciation <strong>of</strong>how the ecosystem actually functions; however,the detail is overwhelming. It precludesobtaining a sense <strong>of</strong> the structure<strong>of</strong> the whole. Were we su;nmarize only themost proininent features <strong>of</strong> each trophiclevel.Total primary product ion is relativelysimilar across the major physiographicunits <strong>of</strong> the estuarine ecosystm, fransubtidal areas and intertidal flatsthrough a1 1 but the highest part <strong>of</strong> thesalt marsh. However, primary producersdiffer enormously in structural characteristic
diversity results. In any small area,different primary consumers will be in thewater column, on the surfaces <strong>of</strong> plants,on hard surfaces, on loose sediments, orat different depths in the sediments.Those species studied that coexist withinthe same narrowly defined spatial environmentinteract strongly, and thus, tend tobe separated horizontal ly, Physicalinterference commonly is the mechanism bywhich one species excludes another withinthe same stratum. Species in differentstrata have little demonstrable effect oneach other, even though they consume thesame kind <strong>of</strong> food.A greater variety <strong>of</strong> food is availableto the predators than to the primary consumers,and this is reflected in greaterdifferentiation <strong>of</strong> diets. Nevertheless,spatial relations continue to be veryimportant, <strong>of</strong>ten not correlated with thedistribution <strong>of</strong> prey. Thus, neither substratetexture (over broad 1 imits) nor thedistinction between intertidal flats andadjacent subtidal areas appear to influencethe polychaete prey <strong>of</strong> shorebirds(directly), but both are critical factorsin determining the effect <strong>of</strong> the shorebirds,<strong>The</strong> outstanding characteristic <strong>of</strong> thetop predators is their timing. Whereasconsiderable feedback between trophiclevels was evident lower in the food web(primary consumers eat plants, consumersregenerate nutrients for plants), thepredators operate outside the control <strong>of</strong>other trophic levels within the ecosystemby migrating. This allows much heavierexploitation <strong>of</strong> food while predators arepresent than would be possible if theywere dependent on the lagoon all <strong>of</strong> thetime. <strong>The</strong> periodic relaxation <strong>of</strong> predationand recovery <strong>of</strong> prey populations hasthe effect <strong>of</strong> increasing the like1 i hood <strong>of</strong>an abundant food supply at the beginning<strong>of</strong> the next period <strong>of</strong> residence.
CHAPTER 6. COMPARISONS6.1 GEOGRAPHIC VARlATlON IN COASTALCLIMATE AND TOPOGRAPHY<strong>The</strong> principal natural characteristics<strong>of</strong> the coastal regions <strong>of</strong> the UnitedStates that most influence estuarineecosystems are coastal topography, theamount and timing <strong>of</strong> precipitation, temperature,and sunlight. For its entirelength, the Pacific coast is very steep,with small coastal watersheds (except fornorthern San Francisco Bay and the ColumbiaRiver, into which are funneled watersfrom extensive areas <strong>of</strong> high elevationinland <strong>of</strong> the Coast Range) (Figures 1,48a). <strong>The</strong> continental shelf is narrow.Precipitation is heavily concentrated inthe coldest months <strong>of</strong> the year and increasesnorthward from 26 cm per year atSan Diego, <strong>California</strong>, to greater than250 un in three coastal locations betweenthe Oregon-Cal i forni a border and thenorthern tip <strong>of</strong> the Olympic Peninsula(Figure 48b). <strong>The</strong> timing <strong>of</strong> river run<strong>of</strong>fis closely correlated with precipitation,except in the drainages <strong>of</strong> the ColumbiaRiver and northern San Francisco Bay,where much <strong>of</strong> the precipitation is storedas snowpack and released much later (Figure48b). <strong>The</strong> growing season is longalong the whole coast (Figure 48c), butthe Pacific Northwest receives one-thi rdless solar radiation than southern <strong>California</strong>(Figure 48d), and evaporation isless than one-ha1 f (Figure 48e).With the exception <strong>of</strong> similar southnorthgradients in solar radiation andevaporation (Bal dwin 1974) and therugged topography <strong>of</strong> New England, thenatural characteristics <strong>of</strong> the othercoastal regions <strong>of</strong> the United States thatinfluence estuarine ecosystems di fferdrastical ly from those just described.Most importantly, precipitation isgreater than 100 cm per year frm easternTexas to the Canadian border and evensouthern Texas received at least twice asmuch precipitation as southern Cal i fornia(Bal dwi n 1974). Furthermore, the preci p-itation is either concentrated in thewarm months or evenly distributedthroughout the year. River run<strong>of</strong>f ismaximal in the spring and remains substantialthrough midsummer (van derLeeden 1975). A long series <strong>of</strong> barrierislands buffer the effects <strong>of</strong> the openocean on inner coastal waters. Here thewhole coastal region behind the barrierislands is an estuarine ecosystem. <strong>The</strong>continental shelf is broad fran Mexico toCanada, and the coastal plain is broadfran Mexico to New York. By opening ontobroad expanses <strong>of</strong> shall ow coastal waters,eastern estuaries are linked to a greaterextent than is possible on the Pacificcoast.<strong>The</strong> net effect <strong>of</strong> these factors insouthern <strong>California</strong> is as described indetail for <strong>Mugu</strong> <strong>Lagoon</strong>. Estuaries hereare small and discrete, separated fromothers by sometimes 'long distances <strong>of</strong>open coastal waters with a strong oceanicinfluence, rather than shal low waterlying above a broad continental shelf.Precipitation and river run<strong>of</strong>f, includingthe river's supply <strong>of</strong> nutrients, virtuallycease before the period <strong>of</strong> highplant growth in May through August; atthe same time, evaporation rates arehigh. <strong>The</strong> combination <strong>of</strong> low nutrientsupply and high and increasing soilsalinities when maximal growth should beoccurring probably reduce the productivity<strong>of</strong> the fringing marshes considerablycanpared to what otherwise might be possible.<strong>The</strong>se constraints on plant growthdo not exist on tidal flats and in subtidalareas. However, the virtualabsence <strong>of</strong> a sal i ni ty gradient duringmost <strong>of</strong> the year restricts some uses <strong>of</strong>
id RELIEF MAPcm10Mr104Columbia River0 0mpqua River0Sacramento andSan Joaquin RiversSan Joaquin RiverLos Angeles Rivernormal monthlyprecipitation (cm)mean monthly7. river dischargeFigure 48. <strong>The</strong> Pacific coast <strong>of</strong> North America from 30" to 50°N. (a) Physical relief,showing the rugged topography <strong>of</strong> the coastal region and the narrow continental shelf.(b) Normal rnonthly total precipitation (cm), mean monthly river discharge (m3/s) forthe estuary and the presence <strong>of</strong> somekinds <strong>of</strong> organisms. Most importantly, norefuge from natural enemies is availablethrough differential tolerance to lowsalinitywaters, one imputed source <strong>of</strong>the high value <strong>of</strong> estuaries as nurseryartas for some species (Douglas andStroud 1971).Despite a somewhat similar topography,the climatic differences <strong>of</strong> the PacificNorthwest lead to differences in estuarinefunctioning. Since evaporation ismuch less than in the south (Figure 48e),stressful soil salinities are less1 i kely, but less light (Figure 48d),lower temperatures, and maximal plantgrowth out <strong>of</strong> phase with nutrients suppliedby river run<strong>of</strong>f, as in the PacificSouthwest, suggest that the productivity<strong>of</strong> the salt marshes may not differ appreciablyin the north. Since river run<strong>of</strong>fdoes not cease a1 together in the summer(Figure 48b), an enhanced nursery functionis possible canpared to the south,but the rugged topography stif 1 assuresthat the estuaries are small and discrete.
C GROWING SEASONd SOLAR AADlATiON\ 1Frost-free oeriods Idavs) Solar radiation (Langleys) Pan evaporation (cm)different drainages, and mean annual total precipitation (cm). (c) Growing season(frost-free period in days). (d) Mean daily solar radiation (Langleys). (e) Meanannual pan evaporation (cm). (a-adapted fral U.S. Geological Survey 1974; b toe-Baldwin 1974; b-Kahrl 1978 and van der Leeden 1975.)As noted previously, the biologicalcharacteristics <strong>of</strong> northern San FranciscoBay and the Columbia River estuary arenot constrained by the timing <strong>of</strong> freshwaterinput, which occurs in spring andsummer when reduced salinity would contributemost to plant growth and use <strong>of</strong>the estuaries by juvenile stages <strong>of</strong> fishand invertebrates.On the east coast, topographic factorsgreatly expand the influence <strong>of</strong> estuarineconditions. In add! tion, the timing <strong>of</strong>precipitation and river run<strong>of</strong>f coincidewith the period <strong>of</strong> maximal plant growth.<strong>The</strong>refore, stressful conditions <strong>of</strong> soilsal ini ty are minimized, and nutrientsfrom terrestrial sources are made availableto marsh plants at the most appropriatetime.This suggests that the increases in thelength <strong>of</strong> the growing season and theamount <strong>of</strong> solar radiation from north tosouth will result in relatively high productivity<strong>of</strong> sallt marsh plants in thenorth and very high productivity in thesouth, compared to other regions. <strong>The</strong>
shorter growing season (frost-free period)<strong>of</strong> New England, as compared to thePacific Northwest (Bal dwin 1974), mayresult in somewhat lower productivity <strong>of</strong>Mew England sa1 t marshes, but the differencein the length <strong>of</strong> the growing seasonis partly canpensated by very low lightearly in the growing season and low temperatureat the peak <strong>of</strong> the growingseason in the Pacific Northwest. <strong>The</strong>nursery function is great by all criteria,including some not discussed inthe rest <strong>of</strong> this inter-regional canparison:abundant food supplies, high temperature,and protection from naturalenemies ,Despi te simi 1 ar long growi ng seasonsand solar radiation, the productivity <strong>of</strong>salt marsh macrophytes is much lower inthe arid Southwest than in the moistSoutheast (Zedler et a1 . 1978; Onuf et a1 .1979; however, a1 so see Ei 1 ers 1981).South to north gradients in salt marshproductivity on the two coasts also pointto an important effect <strong>of</strong> the lack <strong>of</strong>freshwater input to account for the conditions observed in southern Gal ifornia.On the Atlantic coast, where freshwaterinput varies little fran the southernmosttip <strong>of</strong> Florida to the Canadian border(Baldwin 1974; van der Leeden 1975),a strong decreasing gradient in productivitywith increasing latitude has longbeen recognized (Turner 1976). In contrast,on the Pacific coast, where precipitationincreases from less than onefourth<strong>of</strong> that <strong>of</strong> the Atlantic coast nearthe Mexi can border to substantially morethan anywhere on the Atlantic coast fromnorthern <strong>California</strong> to the Canadian border,sal t-marsh productlvi ty decreaseslittle, if at all, at least from southerrmost;<strong>California</strong> to central Oregon(Macdonald and Barbour 1974; Onuf et al.1979; Ellers 1981; Josselyn 1983;Seliskar and Gallagher 1983). This suggeststhat greater freshwater input mightk cwensating for lower light and temperaturegoing northward on the Pacificcoas t ,Zedler (1982) stated we1 1 the reasons tobelieve that the high soil salinities <strong>of</strong>the long summer drought period are responsiblefor limiting growth and productivityin southern Cal i forni a sal t marshes;however, the observa t.i ons presented abovedo not dl'stingui sh ðer another consequence<strong>of</strong> 1 ittle freshwater Snput duringthe growing season 4s nutrient limitation<strong>of</strong> growth. Nor do those observations testthe imputed importance <strong>of</strong> timing. As itstands, we can be quite certain thatfreshwater input is an important determinant<strong>of</strong> how salt marshes functionin southern <strong>California</strong> and the mstimportant determinant <strong>of</strong> differencesbetween salt marshes in southern <strong>California</strong>and other regions <strong>of</strong> the UnitedStates. <strong>The</strong> mechanism- behind this, however,is unknown.6.2 COMPARISON OF MUGU LAGOON TOTHE OTHER SOUTHERN CALIFORNIAESTUARIES<strong>The</strong> great variety <strong>of</strong> coastal wetlandsin similar natural environmental settingsin southern <strong>California</strong> has three obviouscauses: size, connection with the ocean,and man-caused a1 terations . Perhaps mostimportant is that the setting is nolonger natural (Zedler 1982). Probablyevery estuarine ecosystem in southernCal i fornia has undergone major a1 terationsas a result <strong>of</strong> human activities.Portions <strong>of</strong> many have been dredged toprovide ports and marinas, while otherportions have been filled to provide airportsand space for real-estate development.Marshes have been diked for amu1 ti tude <strong>of</strong> reasons, ranging from exploitation<strong>of</strong> petroleum reserves to manage-ment <strong>of</strong> waterfowl populations. Channel shave been deepened and realigned, primarilyfor flood control and navigation.Highways and railroads have been builtacross most coastal wetlands, perhapspre-empting little area, but always alteringcirculation and <strong>of</strong>ten restrictingthe location <strong>of</strong> the mouth. Dams havebeen built on many <strong>of</strong> the inlet streams,intercepting sediments, diverting water,and altering the timing <strong>of</strong> water deliveryto the estuary. Land-use practices,particularly agriculture, have acceleratederosion and, through drainage <strong>of</strong> waterused in irrigation, altered the timing <strong>of</strong>the delivery <strong>of</strong> water to estuaries.<strong>The</strong> other two factors, size and communicationwith the ocean, undoubtedly ledto great differences among estuariesunder natural conditions, but also are
affected by human modifications. <strong>The</strong>physical environment (Carpel an 1969), thefloras and primary productivity (Zedler1982), and the faunas (Mudie et al. 1974)are very different depending on thefrequency, timing, and duration <strong>of</strong> asurface-water connection between theestuary and the ocean, <strong>The</strong> reason thatestuaries differ in their water connectionsto the ocean is that the longshoredrift <strong>of</strong> sand (described in Chapter 3 inthe context <strong>of</strong> inlet migration) happensalmost a1 1 <strong>of</strong> the time and tends to fillin any opening to an estuary. Unlesssufficient flow into or out <strong>of</strong> the estuarycounteracts this filling, the mouthwill close. <strong>The</strong> two sources <strong>of</strong> flow aretidal currents and river or creek discharge.Estuaries with a large areasubject to tidal change in depth willa1 ways remain open, hence the importance<strong>of</strong> the size <strong>of</strong> the estuary. Somewhatsmaller estuaries may be open most <strong>of</strong> thetime, but, once closed, probably requirethe winter high flow <strong>of</strong> inlet streams toreopen them. Smaller estuaries willdiffer among themselves and within andbetween years, depending on their relationsto freshwater sources. <strong>The</strong>y canrange fran being fresh almost all <strong>of</strong> thetime to being brackish at the time <strong>of</strong>closure and then becoming hypersaline asevaporation proceeds.Detailed canparisons are possible forsome important features <strong>of</strong> structure andfunction between <strong>Mugu</strong> <strong>Lagoon</strong> and threeother small southern <strong>California</strong> estuarinesystems: Anaheim Bay, Upper Newport Bay,and Tijuana Estuary (Figure 49). Althoughall have been modified by humanactivities, they have in common continuous,or close to continuous, connectionswith the ocean, relatively large size byregional standards, a variety <strong>of</strong> littledisturbedsubtidal and intertidal habitats,and natural associations betwctenmost habitats (for instance, broad flatsbetween mergent marsh and shallow openwater). Comparisons among these es tuariestest the validity <strong>of</strong> the analysis<strong>of</strong> estuarine ecosystem function developedin this pr<strong>of</strong>ile, based on <strong>Mugu</strong> <strong>Lagoon</strong>alone, and extend the analysis to situationsnot specifically studied in <strong>Mugu</strong><strong>Lagoon</strong>.Tijuana Estuary (Figure 49h) is theonly site in southern <strong>California</strong> besides<strong>Mugu</strong> <strong>Lagoon</strong> where an integrated efforthas been made to assess the contributions<strong>of</strong> di fferent sources <strong>of</strong> primary production(Zedler et al. 1978; Zedler 1982).<strong>The</strong> two systems are similar in therelatively 1 ow productivity <strong>of</strong> the vascu-lar plants <strong>of</strong> their salt marshes (comparedto other regions) and the proportionatelygreat contribution <strong>of</strong> thebenthic micr<strong>of</strong>lora to total production.<strong>The</strong> two systems differ in the virtualabsence <strong>of</strong> :partina from <strong>Mugu</strong> 1-agoon andits domination <strong>of</strong> the lower marsh atTijuana Estuary, the very low productivity<strong>of</strong> vascular plants in the l~wer marshat <strong>Mugu</strong> <strong>Lagoon</strong>, and in the relativelybroad continental shel f contiguous toTijuana Estuary, rather than the narrowshelf cut by a submarine canyon as at<strong>Mugu</strong> <strong>Lagoon</strong>. A1 though dredging el iminatedmost <strong>of</strong> the cordgrass that once waspresent in <strong>Mugu</strong> <strong>Lagoon</strong> (Macdonald andBarbour 19741, this activity did notaffect the areas studied in the easternarm. <strong>The</strong>re, the absence <strong>of</strong> major freshwaterinputs until recent times, and theshort duration <strong>of</strong> these inputs even now,probably preclude the establishment <strong>of</strong>cordgrass, because germination and earlygrowth appear to require reduced salinities(Zedler 1982, pers. cuinm.).In Chapter 5, the submarine canyon cuttingacross the already narrow continentalshelf at <strong>Mugu</strong> <strong>Lagoon</strong> (Figure 13b) washypothesized to del iver nutrient-poor oceanicwater into the lagoon during tidalexchange to account for the low productivity<strong>of</strong> the marsh in the well-flushedeastern arm. Instead, Ti juana Estuary(Figure 49b) is flushed by water fran amuch broader segment <strong>of</strong> continental shelfand consequently may be richer in nutrients.<strong>The</strong> tw<strong>of</strong>old difference in lowmarsh productivity between the two estuaries(Figure 50) is consistent with thispresumed difference in their nutrientregimes.Six species accounted for 94% <strong>of</strong> allshel 1 ed macroinvertebrates col lectd byPeterson (1975) during 3 years <strong>of</strong> samplingin the sandy subtidal areas <strong>of</strong> <strong>Mugu</strong><strong>Lagoon</strong> (Table 121, <strong>The</strong> same six speciesaccounted for 83% <strong>of</strong> all individualscollected in similar habitats at Tijuana
Figure 5Q. Priindry product ivi ty as~nc?ac;urcd by August hiornass <strong>of</strong> the lowerrqnrshes at fijuana Fstuary (from Zedler1982) and <strong>Mugu</strong> <strong>Lagoon</strong>.Estudr-y dirring the same period, H~wever,the two llrtost common species at PfuguLdsoon (the cmmensal s Cal lianassa cal i------ forniensis and-califor*)were very rare at Estuary. Dwringthe study <strong>of</strong> the invertebrates, andctive bait fishery For the ghost shrimp-- Call ianassa was in progress, using pumpspowered tsy gasal ine engines to flush Calljaridssaout <strong>of</strong> its burrows (~ete';.sonP1537gr-<strong>of</strong> course, the rernoval <strong>of</strong> Cal lijinassaalso doomed its canrnensal~egnrYptanla. <strong>The</strong>re were greater densities<strong>of</strong>-deep-dwelling Nuttallia andTagelus (in the same stratum <strong>of</strong> the sedirlentsas Cal lianassa and Cr tm a),cotijiled withi-rightly l o e l -ties <strong>of</strong> shallow-dwelling Protathaca andDendraster at Tijuana Estuary cmpared toMunu taooon. This aattern is consfstentwi ih ~kcrson's (1477) hypothesis thatconlpetitjan For .;pace is instrumental indeternilning the structure <strong>of</strong> this benthlccanmunity, and that bioloylcal interactlonsare stronyct.;t wlthin the same depthstratum (see Chapter 5).Table 12. <strong>The</strong> mean densities (numbcr/m2) <strong>of</strong> the canmonshelled ~nacroinvertebratcs and their percent <strong>of</strong> totaldensity in subtidal sandy areas.<strong>of</strong> <strong>Mugu</strong> <strong>Lagoon</strong> and TijuanaEstuary sampled at 4-month intervals between July 1969 and,July 1972 (adapted frtm Peterson 1975). C = crustacean, E =echr"nodemr, no notation = bivalve.------- --."MacroinvertcbratcTi juana<strong>Mugu</strong> <strong>Lagoon</strong> Estuarynensi ty X Density %Cr tom a cdlifornica&'iT?n~ftnsir *- (c)TFZZGaC-stam1nea-Nuttallid (Sanguinolaria) --nuttal li S--- ifendraster excentricus -( ~ jTagel us cai i fornianusA1 1 othersTotal
Although the methods <strong>of</strong> collection differedbetween locations, sufficient dataexist to compare the fish faunas amongthe four large, permanently open, notcomplete1 y artificial estuarine systems<strong>of</strong> southern <strong>California</strong> (Table 13). Nugu<strong>Lagoon</strong>, Tijuana Estuary and Anaheim Bayresemble each other closely. Topsmelt isthe numerical dominant in a1 l three wetlands,and staghorn sculpin, <strong>California</strong>killifish, <strong>California</strong> halibut, and diamondturbot are all abundant in each wetland.Probably the lack <strong>of</strong> wide expanses<strong>of</strong> permanent open water in Tijuana Estuary(Figure 49b) accounts for the rarity<strong>of</strong> shiner surfperch there. <strong>The</strong> diamondTable 13. Ranking <strong>of</strong> abundances <strong>of</strong> common fish species in four large southern <strong>California</strong>coastal wetlands.Speci esUpper Newport Bay<strong>Mugu</strong> a Tijuanab Anaheim Li ttoral<strong>Lagoon</strong> Estuary Bay 1974-75d 1978-7ge q1974-75Topsmel t(Atherinops affinis)Shiner s u r f o e r r2(Le tocottus armatus)3Ca , ~ I w(Fundulus parvipinnis) 4<strong>California</strong> ha1 ibut(Hypsopsetta gut tula ta ) 6Arrow goby(Clevelandia -) *Striped mu1 let(Mu il ce halus)Deep -$s+ o y anc ovy(Anchoa canpressa)Slough anchovy{Anchoa delicatissima) 3~os-i: h(Gambusia affinis)81 a m e r(Efirbiotoca jacksoni ) 2Round-+stingray(Urolo hus halleri)White sur perch5(Phanerodon furcdtus f-- 6abOnuf and Quamrnen (1983).White et al. (unpubl. rep.).CLane and Hill (1975).d~i len ( 1976).e41 len (1980),*Probably much mre abundant than any other species, but inadequately sampled by gearused,
turbot is relatively more common atAnaheim Bay than at the other locations,but the reasons for this are not known.Two features distinguish Upper NewportBay from the other locations. <strong>The</strong> bay islarge enough that the fish fauna <strong>of</strong> itsopen-water areas is distinctly dl fferentfrom that <strong>of</strong> its littoral areas (Figure49c). Surfperch and flatfish characterizethe former, while topsmelt, killifish,and sculpin typify the latter. Anchoviesoccur in both areas. Although some <strong>of</strong>this differentiation can be detectedat <strong>Mugu</strong> <strong>Lagoon</strong> (Tables 5, 6) and in AnaheimBay (Lane and Hi1 l 1975), the spatialseparation between open water and littoralareas is rather small, and topsmel t is nota 1 i ttoral species. <strong>The</strong> cther distinctivefeature <strong>of</strong> Newport Bay is the abundance <strong>of</strong>mosquit<strong>of</strong>ish (a primarill freshwater species)in the littoral zone in 1978, one <strong>of</strong>the major storm years that figured soimportantly in the analysis <strong>of</strong> ecosystemfunction for <strong>Mugu</strong> <strong>Lagoon</strong>. At UpperNewport Bay, shiner surfperch and staghornsculpin were more abundant in the dryperiod sampled (1974-75) than the wetperiod (1978-79). Shiner surfperch a1 sodeclined at Muqu Laqoon in the 1978-79wet period; however, -staghorn scul pin didnot decline, and no freshwater fisheswere caught there in the wet period,Whether both differences arise frm agreater freshwater influence in UpperNewport Bay is uncertain. Eggs andlarvae <strong>of</strong> staghorn sculpin in TomalesBay, <strong>California</strong> cannot survive salinities
more extravagant extrapol a tions requi red ences should a1 1 ow the extension <strong>of</strong> theto synthesize a complete analysis for basic analysis to a broader array <strong>of</strong> con-<strong>Mugu</strong> <strong>Lagoon</strong>. Furthermore, those differ- di tions, as out1 ined above.Figure 51. Smaller estuaries <strong>of</strong> southern <strong>California</strong>, always open butonly indirectly connected to ocean or with altered relations betweenhabitats ~sithin the estuary: (a) Agrra Hebionda, (b) Upper Botsa Bay(the State Ecological Reserve), (cf Carpinferia Slough, and (d) GoletaSlough; or unpredictably open to the ocean: (e) Los PeWasquitos <strong>Lagoon</strong>.
CHAPTER 7. MANAGEMENT CORII$IDERABIOMSIn southern <strong>California</strong>, encroachrnentson estuarine systems have been so severethat we cannot really know what thesesystems were like and how they functionedbefore the appearance <strong>of</strong> rnan in theregion. In that sense, the remnants <strong>of</strong>estuaries are not "natural" (i.e.,intactexamples <strong>of</strong> a whole ecosystem). On theother hand, the estuarine realm wherefreshwater, marine, and terrestrialinfluences cmmingl e a1 ways has beensubject to a wider range <strong>of</strong> fluctuatinginputs and conditions than almost anyother ecosystem. Consequently, many <strong>of</strong>the alterations caused by human activitieslie within the range <strong>of</strong> conditionsexperienced by the natural system. Thus,many <strong>of</strong> the remaining parts <strong>of</strong> estuariesin southern Cal i fornia today probably hadcounterparts in estuaries before hunaninfluence.Unfortunately , the proportionate contributions<strong>of</strong> different parts <strong>of</strong> estuarineecosystems in southern <strong>California</strong>have been altered so drastically that wecan not even guess what the naturdl proportionsrnight have been. Some parts ortheir connections to the rest <strong>of</strong> theestuarine ecosystem have been a1 mos tentirely el iminated. Functions thatdepended on those parts or connectionsinevitably have been elimindted or drasticallycurtailed. <strong>The</strong> most obvious <strong>of</strong>these are the elimination <strong>of</strong> most freshl~atermarshes, the separation <strong>of</strong> most <strong>of</strong>the remaining freshwater marshes fromtidal wetlands by levees or roads andrail road embankments, and the consequentelimination <strong>of</strong> brackish water habitat$.For waterfowl, part <strong>of</strong> this loss has Szenrllade good by purposeful manageinent <strong>of</strong>impounded areas <strong>of</strong> freshwater for theenttance~:eat <strong>of</strong> yam bi rD popul ation5 .However, if a nursery function everexisted based on a gradual transitionfran freshwater to seawater, it has beenlost in its entirety. Clearly, the wholeis not what it once was. Nevertheless,the remainder continues to be a densemosaic <strong>of</strong> natural habitats, all the rnoredeserving <strong>of</strong> protection and carefulmanagement for educational , scientific,and aesthetic purposes because <strong>of</strong> theirproxirni ty to densely populated areas (Onufet al. 1979), in addition to their incalculableprimary value in support <strong>of</strong> endangeredspecies and as habitat islands forother sensitive wi1 dl ife.<strong>The</strong> main concerns in managing the survivingsmall rennants <strong>of</strong> estuarine ecosystemsin southern <strong>California</strong> are protectingthose remnants from the impactsthey can not tolerate (for instance, highlevels <strong>of</strong> sedimentation), restoringdegraded areas, and responding to theneeds <strong>of</strong> endangered species. <strong>The</strong> Navy'srole in protecting the natural resources<strong>of</strong> the <strong>Mugu</strong> <strong>Lagoon</strong> estuarine ecosystem issummarized in the next section. Somespecific concerns about management thathave arisen in this report are then addressed:(1) sedimentation, (2) otherwater-borne contar~inants, (3) a1 tera tion<strong>of</strong> tidal flushing, (4) endangered species,and (5) infornation gaps.7.1 PROTECTIONBecause it is enclosed by a militarybase, <strong>Mugu</strong> <strong>Lagoon</strong> is well protected fromfurther development pressure. Pub1 icaccess to sensitive natural areas isquite restricted for mil i tary securityreasons, and even scientific researchrequests are carefully screened by a reviewboard to avoid potential impacts tothe ecosysten. in 1963, the Havy enteredinto an agreei~ent with the Fish and Wildii fe Service and the Cal i fornia Department
<strong>of</strong> F2sh and Game to fonnulatc n fish sr!dwildlife ndnaqement pt&n to allow dndprmote pres2rvation <strong>of</strong> the ecn(3y~trn andIts speclcs arzzwblatje. Thl% Cooperdti~c.Plan w updated in 1976 wftk tkaa,csdoption <strong>of</strong> a Fdrh and Hildlife ManaqcmcntPlant for the Navy bnse and nearby5an Nictllas Island. With the recentestabljskment ag the Siantd t"donlca %untadns Natlona l Recr~ntlon Area, the Ihvyand the Park ServCbc entered into dninternyency dgreetnent for ndndqeinent <strong>of</strong>the edstern am1 and ctrrrtral 1.~5511. <strong>The</strong>cs~parti af the lagoon are IncIudwf 4n theNatlonal Recreatfon Ar~a t ~ l l renaln Navyproperty dnd under Navy control,MJlilfLary rriandyemrv~~t hds czansir;t~d <strong>of</strong>act%vc* corrservatf on <strong>of</strong> the naturdl resources<strong>of</strong> the 1 aycrun and t t~ ntat t dnds ,wf th pronjatfon <strong>of</strong> rc.c;e.nrch fnPn the ccslogfcal strbcctt~re and functioning <strong>of</strong> thelag~sn and fts PrOncj"lnc) wctlandr, by N~vybfslagist~, and other %cfenCfstc;. tdowever,much <strong>of</strong> the tnanaqeinent af the estuarymjyht be better tr?nn& ar; pawfve,that Jx, maintafnmf in Its odttirdl ~tati~.<strong>The</strong> Navy successt.ully prevented openlrtcj <strong>of</strong>the barriara beaches Ea, develeptwnt frr theI$&B's, snd cant i nucs to prmio ta rty fsrraldevelop~nt: corrsIg,te:nL wlth rninlinizfngSrtlpects to the laq~an, Cont tnued development<strong>of</strong> the wdtershlrcl otrtrftjct thp &tea <strong>of</strong>tnjl i tary or Hall<strong>of</strong>la1 Paark Scwrce cuntrtslposes the tttost pt.obdk?la tpnd %ub% trxntf $1'rmpaxctt to the e"ltfary tllrotigh thi~ threat<strong>of</strong> Incredsecl sedintr?rotdt5on, df%cuscPci f ~ nthe la1 Inwirirj wct for?.7.2 SEDIMENTATEOMck~annels drt? Plaliked by levcer, andlildjor stcrnas ln 1978 and 1gRO cdused coarse reditnents are removed in rfebrirlargeand lang-lra~tinq ct~dr~yte% Jn th~ retcntiocr basins Before enter-iny themorpt-rol oyy <strong>of</strong> the i.ctrLt-a1 i ~ t rr s dtrd east- clouyh ~harrtiet s. Thus, $nost serliirl~ntf;ttrrt dnn <strong>of</strong> Muqu Ldqoon. <strong>The</strong> t:~fltrdl bypas*% Ihr slouqhs,barlo wirs trdrtsfonned Crtnr ;r wldr rxpnn5Psf prrrfnanent open wd ter Into a pr~tdas~l- At iituqu Lnqaon, blarrlnij failure <strong>of</strong>nentiy fnta?t.tidal arpa Sn 291R, drils ttle levees ups trcaa!, aln~ost the enti re par-tnezta Cieptt.~ dP low water 111 the easterr1am dfmfi,"thed by 159, %he decycll aareaqdec~easd irrcasl '!rt depth. Ira i980, thedeyorr i tlon sf nkw ssc3dic!rt?ntr decreasrddeptl~ <strong>of</strong> low water r\notEl~~* 17% {Figure181, 16: not for the breach'ing <strong>of</strong> d leveeon Calf eguas C~eck and thc deglcr5 f t ;I>~I oithousands uf eubfc yards <strong>of</strong> 5rdirnent.i onsad fields, the deposi tlon tbf ~edilnerrtsin the edstern ama would have kr.n cgnridernbly greater.Thr relations <strong>of</strong> tkiesr physical Smpactcon the lagoon rith chdracteristics <strong>of</strong> bRelagotw and watesshed, land use wS thin the~atershed, and the c: iir~atic cycle havebeen described earlier, <strong>The</strong>? kiolaqicalconsequences <strong>of</strong> thegc physical cbanqcshav~ k8crn a key them tiqrouqh rrwt nf C , ~ Ppreceding analysis <strong>of</strong> eco.;ystclr function,<strong>The</strong> inp1IcatJcafls for manarjw~ent are"itdrk.In fact, the cnajor ston% that fdus~dthe al terntian? desrr-ib& In thir reportarc not rare events, Four such stomsuccurr& cfithirr 20 ycarr hetwcen 1941and 1980, Judginy hy the evidence for101ig-tern: hydrrsloajiedl cycles in thcPacific Soutlwest (Figure 6) crnd thetndicatlonr that a filoi~t period has justb~cyxin (Figure 2U), It, sems very likelythdt r,tnrtrts wlitXr effects at least asscvcrc ds those <strong>of</strong> 1'1958 and IWRQ wil locmr in the near future.lhcic nk%s,rv~! tirsns ~jucjqe~i t thdt MUQUlacloon wr'll not perr,ist rwch luriger as wenow know it. As the central basin and~d.r,trm dm ffll further, I suspect thatthpy wwll l take on the fonn <strong>of</strong> a floodpfdinrdttter thdn a slough cystern, suchdxi at Cat-pinterfa and Goleta. At thoselacat ions the natural alluvial fans areat tk'rr41dndward extr~lrfiities sf the netfand5 whrra s trcatrrs orxe di sctrsarcjed, hutnow those streaiw pas5 throtrgh the wtlanrfsin rtlannels that have heen artificr'al ly wider~ed and deepened for floodcuntrol f,urpos~~,. /n most cases, theticulate load <strong>of</strong> the inlet strearns dischnrrjer;into the heart af the wetland.R~cda~%r? flood flows with their sorretimeshcilvy hux-denr <strong>of</strong> sur,pr"nded yarticulatc?merterfal and b~iedload are not canfindwfthin a'lairroiv thdnne?, they ~$11 spreadnu-r;, slow
and interactions with seawater thatcause flocculation and hasten deposition<strong>of</strong> fine particles. <strong>The</strong>refore, ratherthan passing through a relatively longlivedintermediate stage resernbl ingCarpinteria and Goleta Sloughs, where atleast the salt marsh part <strong>of</strong> the coastalwetland ecosystem persists, I foresee therapid development <strong>of</strong> an a1 luvial fan thatengulfs the rnarsh as well as the lowerelevations <strong>of</strong> the lagoon. Because <strong>of</strong> theartificially restricted contact betweenthe western arm and the central basin,filling will be much slower in the westernam. According to projections <strong>of</strong> theSoil Conservation Servl'ce (19831, theonly wetlands that will exist by the year2030 will be a thin finger extendinginto the eastern arm and narrow corridorspassing through what now is the centralbasin to the western arm and the termination<strong>of</strong> the channelized portion <strong>of</strong> CalleguasCreek (Figure 52).A consequence <strong>of</strong> the central and easternparts <strong>of</strong> lvlugu <strong>Lagoon</strong> prograding intoa floodplain is that the threat <strong>of</strong>flooding to the developed parts <strong>of</strong> theNaval Air Station will increase. Bydefinition, a stream overtops itsFigure 52. Topographic maps <strong>of</strong> (a) Muyu <strong>Lagoon</strong> in 1980 and (b) ds projected s'n 2030assuming present rates <strong>of</strong> filling continue for the next 50 years (from Soil ConservationService 1983).105
previous channel in its Floodplain zii,~~?riclmajar storms, When the floodplairi 4. a",elevations that exceed 5 ft *I) 145:as projected in Figure 52, ddjstcrnt developedareas at elevations 810 ft (3 iq)MSL will be in jeopardy. Thts incltrrl~smost <strong>of</strong> the facilities at Point FPi~giiNaval Air Station,I fnfer on the bdsis <strong>of</strong> these consjdsrationsthat channelfaatSon <strong>of</strong> CallegiidsCreek nil 1 be required before the conditionsdescrfbed above have been real 'r'z~d.If future containment is fnevitable, at Ihave just postulated, the wooer it isundertaken the better. Now re1 a tivcl ylarge and diverse areas <strong>of</strong> wetland habitatstill exfst fn the central bdtin dndeastern arm <strong>of</strong> <strong>Mugu</strong> <strong>Lagoon</strong>. <strong>The</strong> soonerthey can k separated frm the atonnClaws <strong>of</strong> Cal leguas Creek, the hfqger andthe more varied the area <strong>of</strong> aquatic hdbitatswill k that can k sustained (salvagedmight he rrlore apt) in the MIJ~JI~Lagoan estuarine ecosyr tern. Thcrcfore,evillua tian uf aptions to fntercept rctfimentsupstrean <strong>of</strong> Filugu <strong>Lagoon</strong> dnd %adivert floodwaters around the laqocrn(Figure 53a) should btz the highest griorfty<strong>of</strong> rwnagment OF the <strong>Mugu</strong> I,ratjoonestuarlnlz ecosystm. Even chanrrel irdtlonstrtlfght through the rntddle <strong>of</strong> MugtiCagson (P3gure 53b), If done soon enough,4s preferable Lo takfng no action untilflooding <strong>of</strong> the Navy base con~pels action.tbr? "'nzltirrdl!' "131 low wa trr enui rowlent;<strong>of</strong> t"P? lagoon, the dnvialtinc~ <strong>of</strong> thernarirle c,annectil)n #as. re-e:taljl i $bed inthe rcrk <strong>of</strong> the lagoon f~lapnrirtily. Unfortunaloty, the amount and character <strong>of</strong>sljkbsequpnt devcl opr~ent in tho upf~eswa terr !ial probah? y akrbrcvia ted tire if fp-?pan <strong>of</strong> the Rr~1e t:onsiderahly and~5myrnrtisrrd the utfl i ty <strong>of</strong> dredqedbasins here a5 managemrnt tools in thefuture.Ttie problem <strong>of</strong> seriinlentatinn is themost: rer-lour coclccrn <strong>of</strong> nanaqprgent 1nrwst <strong>of</strong> the coastal w~tlands <strong>of</strong> soutlzern<strong>California</strong>. Unfortunatrrly, thr sources~f the prol)len lie far away frm theaffect& wetfanifs and far beyond theauthori 6-y <strong>of</strong> the dqerlcy or agencf~src~panstble for thc ritanagenent <strong>of</strong> thewetlands. Certrtinl y, nruch <strong>of</strong> the erosfanin coastal wdterrhcds that suppi 4es t h ~redirnentc; that flll coastdl wtlands $5avoidable by proper znnfnrj and institutinqland-use practices appropriate to a particularqcologfcdl srttlnq. Also cpr-Ialnly, 13n)e hrieflts would Iro realfzedIn the wntershmd as well aa Cn the wetlandif tire best practices <strong>of</strong> watershed wnaqe-!-lent were carrld out, Fertile topsoilwould tltp conserved, property n~ in tennnce(incf urffnq roads) woultl k less expensfvt?,and retentfan OF groundwater could beenhanced,<strong>The</strong> recaf~wndation to preserve wet1 dnr3resources by making naasslve structurdl <strong>The</strong> ituin nbrtdclcs to dc31itrving thesea1 Ceratlons wi thin the estuary runs sa mutually beneficial outcotrEr; are that thecounter to any perccptlon sf natural ins ti tu tiontml mchanisiqs, do not ex$ st tohabf tat ref 4 t f uns t1.m t I reyu 1 res imp1 emcnt stich nanarjertPelnr Ijragrams, andfurther explanattan. <strong>The</strong> point fs that cnfurcment wufd be dl fficul t in asqypast alteration <strong>of</strong> the inlet ~tredm SF case, Djckert et dl. (19881) developed athe fundamntal viol atiarr <strong>of</strong> na turaJ pflot pracjrm for El khorn Slough Inrelatfurrs. Cal leguas Creck wnul d not Mnolercy County. Evalui9t Son <strong>of</strong> that prodischargethe t~icajori ty <strong>of</strong> its burden OF qrm ljnd development <strong>of</strong> wafershd rmnagepart"rcui&tcttlatter irlto Fhrgt~ <strong>Lagoon</strong> if it ment programs far oth~r wetlands shauldwere not constrafniaf to do so by he undertaken as coon as possfble, fnart 1 f icf a1 levees, as the brcactle
7.3 OTHER WATER-BORNE COMTAMBsdlNANTSInformation on the water quality <strong>of</strong> theinlet streams and within <strong>Mugu</strong> <strong>Lagoon</strong> l's1 imited. In a study <strong>of</strong> Revolon Slough(Figure 53a) from October 1980 to July1981, Incan concentrations <strong>of</strong> four pol lutantswere at or above hazardous levelsfor a marine environment according to EPAcriteria: lead (approximately equal tothe EPA standard) , mercury (%?Ox), sil ver($10~)~ and methoxychlor (%20x) (SoilConservation Service 1983). RevolonSlough is the tributary <strong>of</strong> Calleguas Creekthat drains most <strong>of</strong> the intensively cultivatedpart <strong>of</strong> the Oxnard Plain, <strong>The</strong> flow<strong>of</strong> Cal leguas Creek is -3x that <strong>of</strong> RevolonSlough. Si_nce the former drains lessintensivelycultivated land, the pollutantsmay be diluted befor,? they enter thelagoon. <strong>The</strong> only determir~ations <strong>of</strong> waterqua! ity within the lagoon were confined toone location in the western arm (eightdates sampled, autumn 1974) and one in theeastern (two dates sampled, autumn 1974).Scans for 50 organic pesticides were negative,and elevated levels <strong>of</strong> heavy metalswere not detected (Baker 1976).Effluents from five sewage treatmentplants discharging into Cal leguas Creekprovide significant sources <strong>of</strong> freshwaterduring non-rainfall periods. Apparently,the only times in recent years that sewagehas been a problem followed breaks insewer mains upstream. Ordinarily, effluentsare treated to acceptable levelsbefore discharge into the Calleguas Creeksystem. Nutrients from these sources arecontrolled by the State, whereas agriculturalimpacts are not control led.<strong>The</strong>se data suggest that poll utants area minor problem compared to inputs <strong>of</strong>sediments. However, the part <strong>of</strong> thelagoon [nost susceptible to the inputs(the central basin near the mouth <strong>of</strong>Call egua s Creek) has not been sampl ed.Also, spills upstream, such as breaks insewer mains, could affect the lagoon.<strong>The</strong> absence <strong>of</strong> sport or commercial exploitation<strong>of</strong> the lagoon's 1 iving resourceseliminates most <strong>of</strong> the human healthhazards associated with pollutants;nevertheless, the potential for waterqua1i ty problems exists and has Seen insufficientlyinvestigated.7.4 AhTERATlQN OF TIDAL FLUSHING<strong>The</strong> estuarine ecosystems <strong>of</strong> southernCal ifornia are differentiated first andforemost according to their extent <strong>of</strong> contactwith the ocean. <strong>The</strong> permanentlyopen, least modified wetlands are varied,usual ly densely populated ecosystems.Without doubt, tidal flushing is the mostimportant property in determining therichness <strong>of</strong> the associated ecosystem.Tidal flushing is essential to the establishment<strong>of</strong> a broad spectrum <strong>of</strong> substratetypes. Tidal flushing produces a widevariety <strong>of</strong> exposure-inundation regimes.Tidal flushing assures that some <strong>of</strong> thephysicochernical stability <strong>of</strong> the marin,environment is imparted to this protected,shallow water environment, thusbringing the wide variety <strong>of</strong> physicalenvironrnents within the thermal, osmotic,and respiratory tolerances <strong>of</strong> many organismsexcluded from enclosed wetlands inthe southern Cal ifornia coastal region.Tidal flushing moves materials around,enabl i ng organi srns to exploit resourcesfrom areas from which the organisms areexcluded, and removes wastes that mightaccumulate to harmful 1 eve1 s.Because <strong>of</strong> the obvious benefits <strong>of</strong>tidal flushing and because <strong>of</strong> the starkcontrasts between open and closed wetlands(or the same wetland when it isopen as opposed to when it is closed),any alteration that reduces tidal flushingusually is assumed to degrade theaffected wetland. Conversely, any a1 terationthat augments tidal flushingusually is assumed to enhance the naturalresources <strong>of</strong> the affected wetland, andsuch alterations commonly are proposed torestore degraded wetlands.This was the logical basis for electingto open up the western arm <strong>of</strong> <strong>Mugu</strong> <strong>Lagoon</strong>to increased tidal flushing in compensationfor the loss <strong>of</strong> wetland habitat to amil i tary construction project. Indeed,the much earlier construction <strong>of</strong> a roadhad reduced the connection between thewestern arm and the central basin from150 m wide to five 1.5 m x 1.5 m culverts.After the augmentation <strong>of</strong> theculverts by a 32-ft single-span bridge asspecified in the restoration plan, the"normal diurnal tidal fluctuation"increased from 0.2 m to 0.7 rn, and an
additional 100 ha <strong>of</strong> sal t in;ltmih wereflooded "during man high tidal slate"(Woi f e et a1 . 1979).Little was known about the natrirai resources<strong>of</strong> the western ann prior to theaugmentation <strong>of</strong> tidal flushing beyi rlningin January 1979, and doubt remains as towhat was enhanced and ether anythingsuffered. One federal ly 1 isted andangeretfspecies, the salt mrsh bird'sbeak (Cord lanthus rnarititnus), occurredto tida ateration only in thewestern arm on the upper periphery <strong>of</strong> thebefore and after implmentation, so thatprior --+l critical aspects <strong>of</strong> the performance <strong>of</strong> theproject can be evaluated. Ideally, tilemarsh, and one species listed as endan- pre-project inventory should be initiatedgered by the State <strong>of</strong> <strong>California</strong>, Beld- soon enough to provide Input for the finalin9 's Savannah sparrow (Passerculus design <strong>of</strong> the project, Realizing that the+sandwichensi s beldin i ), was heavily concantratedZn t e upper part <strong>of</strong> the saltmarsh surrounding the western arm. Bothendangered species are stil l present andperhaps in greater numbers (R. Dow, pers.canm. ).<strong>The</strong> light-footed clapper rail (Rallus) historical 1-in the eastern dndcentral parts <strong>of</strong> the lagoon and farseveral years had not been observedanywhere In the lagoon. <strong>The</strong> rail wasagairi observed at hgu <strong>Lagoon</strong> starting in1983 and in increasjng numbers since then,All recent sightings have hen Sn thewestern am f R. Dow, pers. comi.).Management consideral-fons for endangeredspeclcas are discussed further in Section7,5. Unfortunately, observations on thcnlore colntrwn organi sins before tidal f 1 us h-ing in the western arm was augcnented wereinadequate to draw any concl usions aboutcf fectr <strong>of</strong> the mod4 flcation.It is clear that wc do not yet knowenough about the function <strong>of</strong> the coastalwetland ecosysteins <strong>of</strong> southern Cal i fornlato accurately predict the consequences <strong>of</strong>dl tera tionr, <strong>The</strong>refore, we should approachrestoration and enhancement activ i-ties wf ti) great circumspection andhuiri l i ty. Each project mrs t be treated asan experinlent at thr's early stage in thepractice <strong>of</strong> coastal wetland restoration insouthern <strong>California</strong>, with the most valuableproduct being better understanding toapply in future rnanagment rather thannecessarll y and unequi voql ly the enhancement<strong>of</strong> natural resources (Josselyn 1'482;Zedfer 1982, 1484), At the very least,the planning s$creild include a systewtirevaluation (Ijst <strong>of</strong> @ducat& CJLICSSPS) <strong>of</strong>the re5p;crnses <strong>of</strong> edch catqor-y rrf nahiralresources (t~ajur Functional gz-oups <strong>of</strong>wetland oyanisms and endangered rpeei ec,' ,as we77 as the explicit identification <strong>of</strong>the expected prime knef iciaries <strong>of</strong> tvlea1 teratian.All future restoration projects rwst includeinventories <strong>of</strong> natural wsourcescanmiwent to project evaluation has to hecon~mwnsurate with the sire <strong>of</strong> the projectitself, the option <strong>of</strong> performing adetailed evaluation <strong>of</strong> one or a few issuesshould tx, considered and wrhaps encouragedIn small projects, when a generalassessment could only be prfunctory.Finally, tests <strong>of</strong> speclfic ideas aboutwetland function that are Rfghly relevantto restoration but are Snadequa tely documentedshould k incorporated into restorattonproject designs. For example, thelmpted Ilrn4 tatfon <strong>of</strong> salt rmrsh probuctivityby hypersalinity could be tested bypurpose1 y confining freshwater drainage tospecific parts <strong>of</strong> an othewSrre sirnflarlyconfigured restoration. Mere possibleoutcornes are controversial, bet-hedgingrnay be warranted. For instance, In arestoration plan for Cos Gerri tos wetland,bracki st) water impoundnlents were includedfor their presunted benefits to waterfowl ,but because the concmi tant increases inroosqui tos might k unacceptable inadjacent residentlal areas, a fail safe wasbuilt in. <strong>The</strong> impoundiwnt could beconverted to a rnarine intertidal area byremoving a single barrier (<strong>California</strong>State Coastal Conservancy 1982).7.5 ENDANGERED SPECIESFive endangered species occur in <strong>Mugu</strong><strong>Lagoon</strong>, One species is a plant, the saltmarsh bird's beak (S-lantRus mri timusssp. riwritinrus), and four specfes arebirds: the light-footed clapper ra?l[Ral lus fongirostris levipes), Be1 ding's
Savannah sparrow f Passerculus sandwichensisbeldinqi), <strong>California</strong> least tern-(37%6na3m marurn brwni), and Califs brown pel i
Fiaure 55. Salt marsh bird'r beakmaritirnus spp. maritimus),sy3 rJ. S, Navy.)colonies arc separated from any tidalinfluence. Tests at <strong>Mugu</strong> <strong>Lagoon</strong> indicatedthat gemination is canpletelysuppressed at salinities exceeding 12ppt, but increases after pro1 onged exposure<strong>of</strong> se@ds to cold and is greaterafter 2years <strong>of</strong> storage than whenfreshly cot lected (Murphey et al. 1981).Thus, the plant appears to be adapted toa highly variable soil salinlty regdrnethat excludes. most other plants. Presumably,the suppression <strong>of</strong> geminationexcept at taw soil salinity and enhancement<strong>of</strong> geminatton after prolonged coldbath increase the probabf 1 f ty <strong>of</strong> conr(11crtivlgdevelopment before sal fni tfes becoinetw high for even the mature plants. Qiabflityfar at least 2 years provides foravoiding a1 together growjng sedsons Inwhfch Insufficient freshening occurs.<strong>The</strong> capab31ity to parasitize other speciesmy fnsure survival under condl tionswhen salt rnarsh bf rd's beak would be competltively el iminated otherwise (abnormalpersistence <strong>of</strong> 1w soif sd'linf ties, F Q ~1 ns tance) .status is hwan disturbance <strong>of</strong> it-, highmarshhabitat, either For r~al +state~ ~ T s ~pi?erlt; ~ P J or by tramp1 i ng. <strong>The</strong> highmarsh seems to be a favors! habitat <strong>of</strong>the dune higgy and the dump truck, aarfthe brittle salt marsh blrd's beak isill-sui tcd to survive these invasions,even &en transient. Its vast st"ri01.1~nablraf enanies dillring observations at<strong>Mugu</strong> <strong>Lagoon</strong> were leaf roller larvae(Murphey eet al. 1981), <strong>The</strong> depredations<strong>of</strong> this herbivore might be coacenlratedon salt marsh bird's beak, abecause otherannuals <strong>of</strong> the hl'gh cnar5h habitat havevery short life cycles, whfch IMY riota1 low the lepidopteran larvae to completetheir life cycler.Sirice 1978, the kntwn mpulations <strong>of</strong>salt rnarsh bird's beak have been mannedeach year, and since I980 total co&r,densi ty, vigor, growth, and fnortality havebeen nloni tored himorrthly an pemanenttransects, along with wdter depth andsalinity and sail ts~pcrature, moisture,texture, and sallinity (R. now, per%.canm, ). Togc ther with ongoing laboratoryr tudies <strong>of</strong> propagation, these activitiesshould provide dn excel lent and essentf altechri-ical foundation For attenptjng torehabi 1 i ta te an endangered species, andthis augurs wet 1 For the salt marshbird's beak.<strong>The</strong> primary hahi tat sf the Ifqht-footedclapper rdil (Figure 56) is the low marshAdaptatf an to a phyys ical errv i ronr~ientthat eliminates most competitors and thehmiparasitic habit are not er~nugh toinsure a secure exi stenue, hcrwver, TIlcmain reason for the plant? sendangereiiFig~rg Ijg, tight-footed clapper- rail(ms Ionyiratitris - levi~). (USFWSphatn,r
:paytjna fo-iiota :one in four <strong>of</strong> the five,ocat~o~s &ere nlore than ten ,-ails werecounted during censuses in 1980 and 1981:Tijuana Estuary and Mission Bay Marsh inSan Diego County, and Upper Newport Bayand Anaheim Bay in Orange County (Zembaland Massey lY81a, b), Zedler (1982) providesa recent summary <strong>of</strong> the status <strong>of</strong>the clapper rail in these areas, whichjustifiably emphasizes the crucial role<strong>of</strong> cordgrass for nesting and cover.Sightings <strong>of</strong> rails in <strong>Mugu</strong> <strong>Lagoon</strong> havebeen few and far between. <strong>The</strong> virtualabsence <strong>of</strong> cordgrass undoubtedly is part<strong>of</strong> the explanation, but another part issimply that systematic efforts to lucatethe birds were concentrated in the easternarm where historically they had beenrnost abundant (R. Dow, pers. cmm.). Instead,the only sightings in recent yearshave been in the western arm. In spring1983 a single rail was seen in the vicinity<strong>of</strong> a patch <strong>of</strong> freshwater marsh at theupper edge <strong>of</strong> the salt marsh, approximately400 m from the tidal flats <strong>of</strong> thelagoon, In spring 1984, at least threepairs <strong>of</strong> rails were located (R. Zembal,U.S. Fish and Wildlife Service, LagunaNiguel , Cal i fornia; pers. cmm.) . A1 1were seen near the western end <strong>of</strong> thewestern arm - on an isolated section <strong>of</strong>old berm in the middle <strong>of</strong> Salicorniamarsh and along a tidal creek.This information is meager; however,the association with freshwater marsh maybe germane for future manageiiient. Astatewide census <strong>of</strong> light-footed clapperrail populations in 1982 showed 22% <strong>of</strong>the State's souulation nestinq in fresh-upland edge, since the rail's preferredhabitat <strong>of</strong> tall, dense Spartina is sorare,<strong>The</strong> other direction to look forguidance in promoting the rail population<strong>of</strong> <strong>Mugu</strong> <strong>Lagoon</strong> is toward CarpinteriaSlough in Santa Barbara County, the fifth<strong>of</strong> the sites that supported more than tenpairs <strong>of</strong> rails in 1980 and 1981. S artinadoes not grow in Carpinteria S l o band urobabf v did not historicallv(W. ~eiren, -~niversi ty <strong>of</strong> ~al i fornia",Santa Barbara; pers. comm.). <strong>The</strong> attributes<strong>of</strong> this marsh that provide such goodhabitat for rails in the absence <strong>of</strong> Spar-- tina have not been analyzed but should be.This most northerly site in the currentdistribution <strong>of</strong> the rails probably wouldserve as a more valuable model for managementat <strong>Mugu</strong> <strong>Lagoon</strong> than the more southerlysites where Spartina is so important.Patches <strong>of</strong> freshwater marsh interdigitatewith the upland edge <strong>of</strong> the salt marsh atCarpinteria Slough, and rails are in thepatches or on their edges (pers. observ.).Also Carpinteria Slough has a welldevelopedsystem <strong>of</strong> tidal creeks, incommon with other sites where rails arerelatively abundant (Zembal and iilassey1983). More detailed comparisons shouldbe made.<strong>The</strong> Be1 ding's Savannah sparrow (Figure57) appears not to be in so perilous astate as the clapper rail, presumablybecause its preferred habitat is muchmore widespread than the rail 's. <strong>The</strong>sparrow is found mainly in the middle andupper parts <strong>of</strong> the salt marshes, especially &ere pickleweed (Sal icorniaLaqoon should include the "Pansion aid Figure 57. aelding's Savannah sparrwprotection <strong>of</strong> patches <strong>of</strong> freshwater narsh (Passerculus sandwichensis be1 ding? j.within the salt inarsh and "ringing its (Photo court2sy <strong>of</strong> U,S. ~av~,)113
) predominates, It eats insects,seeds, and Scal icorrltg tips,19791. C a l i f o r n n snake5have been observed to be a significantpredator on sparrow eggs in the easternarm <strong>of</strong> the lagoon (S. Davls, PeppertjincUniversity, blibu, Cali fornia; pers.cm.). Massey (15179) provided an excellentaccount on most aspects <strong>of</strong> its bio-1 ogy*<strong>Mugu</strong> <strong>Lagoon</strong> supports one <strong>of</strong> the twobiggest surviving populations <strong>of</strong> theBelding 's Savannah sparrow, cons istentwith the large expanses <strong>of</strong> Sal icorni,a-marsh surrounding the lagoon. <strong>The</strong> cantrastbetween the high densfty <strong>of</strong> sparrowsIn the western arm and the low densityIn the eastern ann 4s the feature <strong>of</strong>greatest interest for nanagement, T~Pvalue <strong>of</strong> tYI1 s contrast for manaqer:#lntlies in the contradiction bekeen thecomtnonly perceived "degradedt' status <strong>of</strong>the western am (for instance, 4j.S. Fisiland WJldlife Service 1979) and the ab-vlous nuch higher carrying capacity <strong>of</strong>the western ann than the eastern ant1 furthis endangered species. It ranains tot>e determine$ why occurrence <strong>of</strong> theBe1 ding's Savannah sparraw violates perceptions<strong>of</strong> degraded wetland at <strong>Mugu</strong><strong>Lagoon</strong> and el sewhere (Massey 1979).7 6 IPJFORMATIBN GAPSblugu <strong>Lagoon</strong> probably has been ctudiedrrlore intensfvely than any other estuaryin southern Cal i fornla. However, irtforrnationgaps raqain, as not& throughoutthis pr<strong>of</strong>ile, <strong>The</strong> mast imwrtant gapsare the lack <strong>of</strong> infornation ahout nutrientsand the paucity <strong>of</strong> infomation aboutthe w~rtern am, except for birds. <strong>The</strong>lack <strong>of</strong> infomation ahout nutrientsnecessi tatd a speculative analysis <strong>of</strong>the influence <strong>of</strong> nutrients on the structurednd function <strong>of</strong> the rest <strong>of</strong> the eco-ryst@~?rrl, which re1 ied on inferences drawnfran the physical characteristicr <strong>of</strong> thesystm and the characteristics <strong>of</strong> primaryproducers fn different parts <strong>of</strong> the rystern.<strong>The</strong> analysis led to a series <strong>of</strong>hypotheses ~itggestdng that ample tidalflushing might be responsible for lowsalt rrrarsh productivity in the rtdsternan11 <strong>of</strong> <strong>Mugu</strong> <strong>Lagoon</strong>. This interpretationis consistent with available tnfomationas far as that Infonnatjon goes, but isat odds with the findings in most othersystm~, <strong>The</strong>refore, the whale topic <strong>of</strong>nutrient supply, availability, and usemust be studled 1~Fore we can understandfunction4ng dt the base <strong>of</strong> the ecosystem.Phc andlysir Zn this pr<strong>of</strong>ile should ktreated as a set <strong>of</strong> hypotheses, provocative[rut ds yet untested.<strong>The</strong> paucity <strong>of</strong> knowledge about theEndangered s peci es pose sorm ser 1 otls western dnn <strong>of</strong>' the lagoon 1s a criticalifil@~ms, <strong>The</strong> serfou~ strdits that they concern for the future ~nnnayetnent <strong>of</strong> theare in seem to demand that we take in- estuary for a rrurnbvr <strong>of</strong> reasons: (1) <strong>The</strong>ntczdfate actlon, yet we lrkly understand western ann and the central hasin are thetheir needs so itrrperfectly that our parts <strong>of</strong> the lagoon thdt have ken itmstactions could we1 1 prove to be detri-- impacted by past human a1 terations.tnental. Our ignorance argues for <strong>The</strong>refore, remedial actions should beintensfvt? study, yet intensive study rr~y focused Sn these parts, (2) <strong>The</strong> ongoingnctcess 9 tate disturbance that causes Lcndc- operations <strong>of</strong> the naval base around theceptable hann to an atready btcdguered westerrz am will necesf i take other a1 terspecies,Even when an alteration is ations fn thfs part <strong>of</strong> the lagoon in theclearly knef fcial for one endangered Future, (3) If the Soil Conservationspecies, it may he detritrrenlal for Servir:e's (1983) predi ctions about sedianotherendanger& spec? es, Sf nce so aentatfon in the rest sf the estuary holdmany endangered species are concentrated true, the we~;tern arm wilt be the onlyinto the fragwnts <strong>of</strong> coastal wet1 ands part <strong>of</strong> the lagoon where estuarine habirm.r"n4ngIn southern <strong>California</strong>, these tat% will persist. (4) <strong>The</strong> activities <strong>of</strong>conflicts are lIkely ta be frequent: and four <strong>of</strong> the five endangered species resiserious.<strong>The</strong>refore, when a1 tera tf ons are dent l"n or using <strong>Mugu</strong> <strong>Lagoon</strong> are cancenmade,they should be conducted as cxperi- trated in the western am (salt marshmtrts, and their o$tcO:ntS sft~)ald be Sird's be&, Belblnt;'s Saua~nat: sparruw,close1 y scrut inired before the same kf nd 1 igltt-footed cf apper rail, and Cali fornf a<strong>of</strong> alteration is impl@inent& again,least tern), Since the needs <strong>of</strong> present
and future mnagement will k concentratedin the western am <strong>of</strong> the lagoon,yet little <strong>of</strong> what we now know applieswith certainty to this part 3f the ecosystem,a high priority <strong>of</strong> managementshould be the support and encouragement<strong>of</strong> ecological research in the westernarm. Although any information about thebiota and the environmental regime <strong>of</strong> thearea would be valuable, the needs <strong>of</strong> theendangered species certainly should bestudied, including comparisons with othersystems that might serve as models fordesigning habitat improvements. Currently,the Navy is supporting valuableresearch on endangered species in thewestern arm. Trade-<strong>of</strong>fs for differentsegments <strong>of</strong> the biota should be evaluatedfor increasing tidal exchange. Increasedtidal exchange may mean more completedrainage <strong>of</strong> areas which could be detrimentalfor organisms dependent on surfacewater. This applies to areas that areseasonally flooded because <strong>of</strong> road bermsor dikes, as well as areas where tidalexchange is only restricted.Although considerable information hasbeen gathered on the use <strong>of</strong> the lagoon byfishes, three aspects <strong>of</strong> fish biologyrequire more attention.(1) Use <strong>of</strong> tidal creeks. No informatfonis available for <strong>Mugu</strong> <strong>Lagoon</strong>.Studies in El khorn Slough (Barry andCaill iet 1981) and Ti juana Estuary(Nordby 1982) indicated heavy use byjuveniles and especially larvae <strong>of</strong> somespecies. Thus, retention <strong>of</strong> some waterin tidal creeks should be insured whena7 tera tions to increase t ida7 exchangemight result in drainage to lower elevations,as has occurred in the westernarm.(2) Halibut nursery. <strong>The</strong> possibledependence <strong>of</strong> Caf ifornia ha1 i but, prizedby sport and commercial fishermen alike,on estuarine areas as nursery grounds(Plummer et a1. 1983) and the abundance<strong>of</strong> halibut in the eastern arm <strong>of</strong> <strong>Mugu</strong><strong>Lagoon</strong> (Chapter 4; Onuf and Quammen 1983)suggest that better information abouthabitat requirements and distribution inthe rest <strong>of</strong> the lagoon is desirable.(3) Shovelnose guitarfish nursery.<strong>The</strong> southern <strong>California</strong> fishery forsharks and other el asmobranchs hasexpanded greatly in recent years and nowincludes the taking <strong>of</strong> shovel nose gui tarfish(M. Love, Occidental College, LosAngeles, <strong>California</strong>; pers. comm.). <strong>The</strong>concentration in <strong>Mugu</strong> <strong>Lagoon</strong> <strong>of</strong> verylarge females, carrying large eggs andembryos (Chapter 5; DuBois 19811, indicatesthat <strong>Mugu</strong> <strong>Lagoon</strong> and other southern<strong>California</strong> estuarine systems usually opento the sea might be important to thestock. <strong>The</strong>refore, the unusual characteristics<strong>of</strong> the shovelnose guitarfish's use<strong>of</strong> the lagoon merit more study.This list <strong>of</strong> information gaps is indicativerather than exhaustive. <strong>The</strong> mostimportant function that this pr<strong>of</strong>ile canser-ve is to provide the framework forefficiently fil ling those gaps and othersthat become evident later.
REFERENCESAdams, S.M., and J.W. Angelovic, 1970.Assiinilation <strong>of</strong> detritus and its associatedbacteria by three species <strong>of</strong>estuarine animals. Chesapeake Sci. 10:249-255.Allen, L.G. 1976. Abundance, diversity,seasonality and co~nmuni ty structure <strong>of</strong>the fish populations <strong>of</strong> Newport Bay,<strong>California</strong>. M,A, <strong>The</strong>sis. <strong>California</strong>State University, Ful lerton.Bascorn, W. 1980. Waves and beaches: thedynamics <strong>of</strong> the ocean surface. AnchorPress, Garden City, N.Y,Baxter, J.L. 1974. Inshore fishes <strong>of</strong>Cal i forni a, Cal i fornia Department <strong>of</strong>Fish and Game, Sacramento.Biddle, K.T. 1976. Physical and biogenicsedimentary structures <strong>of</strong> a recentcoastal lagoon. M.A. <strong>The</strong>sis. RiceUniversity, Houston, Tex.Allen, L.G. 1980. Structure and produc- Bradshaw, J., 5. Browning, K. Smith and J.tivity <strong>of</strong> the littoral fish assemblage Speth. 1976. <strong>The</strong> natural resources <strong>of</strong><strong>of</strong> Upper Newport Bay, Gal iforniae PheD* Agua Hedionda <strong>Lagoon</strong>. Coastal WetlandDissertation. University Southern Cali- Series no. 16. <strong>California</strong> Departmentfornia, Los Angcies. Fish and Game, U.S. Fish and WildlifeService,Andre, J.E., and H.W. Anderson. 1961, Variation<strong>of</strong> soil ero~ibi,i ty ,,,it.,<strong>California</strong> Department <strong>of</strong> Food and Agriculgeographiczone, elevation, and vegetationtype in northern <strong>California</strong> wildture.1978. Report on environmentalasses~ment <strong>of</strong> pesticide regulatory pro-1 ands. J. Geophys. Res. 66:3351-3358. grams.Draft.Ven tura County, Sacramento.fitwood, J .I-. , and D.W. I4insky. 1983. Least <strong>California</strong> State Coastal Conservancy.tern foraging ecology at three major 1982. Los Cerritos wetlands: alterna-Cal i fornia breeding colonies. Western tive wet1 and restoration plans report.Birds 14:57-72. Oak1 and, Ca1 i f.Baker, R.~. 1976. ecologicalstudy <strong>of</strong><strong>California</strong> Water Resources Control Board.parasitism in estuarine fishes. Ph.D. 1979. Water quality monitoring reportDissertation. University <strong>of</strong> <strong>California</strong>, No. 79-5, <strong>Mugu</strong> <strong>Lagoon</strong> to Latigo Point.Santa Barbara.Sacramento.Baldwin, J.L. 1974. Climates <strong>of</strong> the UnitedStates. <strong>National</strong> Oceanic and AtmosphericAdministration, Washington, D.C.Barry, J.P., and G.M. Cailliet. 1981, <strong>The</strong>utilization <strong>of</strong> shallow marsh habitats bycoramercial ly important fishes in El khornSlough, <strong>California</strong>, Pages 38-47 in D.Koch, ed. Cal -Neva W i 1 dl i fe ~raxactions.Carpel an, L.H. 1969, Physical characteristics<strong>of</strong> southern <strong>California</strong> coastallagoons. Pages 319-334 2 A.A.CastaEares and F.B. Phfeger, eds. Lagunascosteras, un simposia. UniversidadNacional Autonorna de Mexico.Chapman, J.W., C.P, Onuf, and M.L.Quammen. 1982. Effects <strong>of</strong> fish predationon peracarid crustaceans in <strong>Mugu</strong><strong>Lagoon</strong>, Cal i fornia. Pages 274-285 &
G.M. Cail'ilet and C.A, S4mens tad, AS,Proceedings <strong>of</strong> the Thlrd Pacjfic Rnrkshopon Fish Fosd Habits Sbdies. WarhingtonSea Grant Prograni, Seattle,Coulombe, N.M. 1970. <strong>The</strong> role <strong>of</strong> succulenthalophytes in the water balance <strong>of</strong>sa1 t marsh rodents. Oecologj a 4 :223-247.Devine, C.E. 1966. <strong>Ecology</strong> <strong>of</strong> Caa 1 ianassafil holi Milne-Edwards 1878thallnideaf. Trans. R. Soc. Pi.%.Zoo1 . 8:93-110.deviolini, R. 1975. Climatic surnmwry forthe Pacific Missile Test Center. PacificMissile Test Cent. Tech. Rep. TP-75-25.Dickert, T.G., J. Nybakken, G,M, Cail let,M.S. Foster, G.V. Morejohn, and G, Page.1981, Wet1 ands management In coastalzone plannl ny : a prototype f rameworkFor relating natural science and landuse plannlny. Pages 37-48 & Cali forniaSea Grant Col ley@ Proy ram, biennialreport 1978-80, Institute <strong>of</strong> Marf neResources, University sf Cali fornia, LaJolla.Douglas, P,A,, and R,H. Stroud. 1971, Rsymposium on the bi<strong>of</strong> oyical sfyni ficance<strong>of</strong> esluarjes. %part Fishing Institute,Washfngton, D.C.OuBols, A,J. 1981. Slntdles on fishes frr<strong>Mugu</strong> <strong>Lagoon</strong>, Cat i fornia. Part f. Shovelnosegul tarfish - reproductfve hi ologyand inrpact on <strong>Mugu</strong> <strong>Lagoon</strong>, Part 2.Results <strong>of</strong> fndepend@nt trJal s an gastricmptytng rates in Pacific staghorn sculpinand diamond turbot. M.A. <strong>The</strong>sis.Universf ty <strong>of</strong> Call fornf a, Santa Barbara.Eilers , tI,P, 1'379, Pradiictlorl ccal ogy inan Orcgon coastal salt marsh, KsttiarineCoastal Mar, Scf, 8: 3991410,Eliers, H,P. 1381, Production in coartalsalt rrarshes <strong>of</strong> southern <strong>California</strong>.U.S. Envi ron, Protect. Agency* NaLI,Tech, lnfona. Serv,, Tech. Rep. EPA-60013-81-023,Ferret 1, W.R. 1959. Debris r&uctlonstudies for mountain watersheds, LnsWngeles County Flood Control DS s tri1.tReport, Callf,Fi tch, J.E., and R,3, Laver~bcrq. 1975.fidepclol and nearshore fisher <strong>of</strong> (:a) i-fornia. University <strong>of</strong> <strong>California</strong> Press,ilerkeley.I , . 9 Tectonics <strong>of</strong> faul tinq Insouthern <strong>California</strong>. Calif, Div, f4i.icsBull. 170, Chap, 4:1-13,iiolws, R.M., and W.E, Mahall, 1982, Preliminaryobservations on the effects <strong>of</strong>flooding and desiccation upon the netphotosynthetic rates <strong>of</strong> high interticddlestuarine sedimntc. If mnol . Oceanayr.17 :954-958.Hornheck, D. 1983. Cal i fornia patterns : ayeographlcal and hirtorlcal atlas, NayfSeldPuk1Ss;hing Co,, Palo Alto, Calif.Jahns, R.ti., ed. 1954. Geolqy <strong>of</strong> southernCallfornfa. Calif, Div, Mines Dull,170.Jorles, A.C. 1962. <strong>The</strong> biology <strong>of</strong> theeuryhal ine flshSassel yn, M., csd. 1982, Wetland res torationand enhancement in <strong>California</strong>.Californja Sea Grant College ProgramRep. Ha. T-CSGGP-007, Institute <strong>of</strong>Marine Resources, Universl ty <strong>of</strong> Cal i-fornia, La Jolla,Josselyn, M,N. lYU:?r. <strong>The</strong> ecology <strong>of</strong> SanFrancl'sco Hay tldal marshes: a cannunitypr<strong>of</strong>ile. U.S. Ffsh Mildl. Serv.FWS/aBS-83/23.Juinars, P.A., R.F.L. Self, and A.R.M.Nowelt. 1982, Mechanjcs <strong>of</strong> pdsticleselection by tentaculate depositfeeders.4, Exper. a r Bi<strong>of</strong> . Ecol.64~47-70.Kahrl , M.L. 1918. <strong>The</strong> <strong>California</strong> wawratlas. Offfce <strong>of</strong> Planning and Research,State <strong>of</strong> <strong>California</strong>, Sacramento.K-w.is, A,%, , afid 8% 8aget-. 3'375. Effect<strong>of</strong> limb rqeneration an slze increase <strong>of</strong>molt <strong>of</strong> the shore crabs Hetniqrapsus
orqoncnsi - s and Pachygrapsus crassipes,Js Exp, lool. 193:353-360,Lane, E.D., and C,M, Wilt, cds. 1975, <strong>The</strong>n~arine r-esources <strong>of</strong> Anaheim Bay. Calif.Dep. Fish Game Fish Bull. 165,Macdonald, K,B. 1969. Quantitativestudies <strong>of</strong> salt marsh mollusc faunasfrom the North American Pacific coast.Ecol . Monocgr. 39:33-60,University Contract No. DACW09-78-C-0008, U,S. Am\y Corps <strong>of</strong> Engineers, LosAngeles District.Massey, B.W., R. Zembal , and P.D. Jorgensen.1984, Nesting habitat <strong>of</strong> thel ight-footed clapper rail in southern<strong>California</strong>. J. Field Orni tho1 . 55:67-80.McIntire, C.D., and W.W. Moore. 1977.Marinew 1 i ttoral diatoms. Pages 333-371Macdonald, K.B. 1976a. <strong>The</strong> natural re- in D. Werner, ed. Biology <strong>of</strong> diatoms.sources <strong>of</strong> Carpinterfa Marsh: their xjversity <strong>of</strong> Gal ifornia Press, Berkestatusand future. Coastal <strong>Wetlands</strong> ley.Series no. 13. <strong>California</strong> Department <strong>of</strong>Fish and Game, U.S. Fish and Wildlife ill^^, D.J., and R.N. Lea. 1972. id^Service.to the coastal marine fishes <strong>of</strong> <strong>California</strong>.Calif. Dep. Fish Game FishMacdonald, K.B. 1976b. <strong>The</strong> natural re- Bull. 157.sources <strong>of</strong> Muqu , Laqoon, - Coastal <strong>Wetlands</strong>Series no. 17. <strong>California</strong> Depart- Morris, R.H., ~,p, &bott, and E.C.merit <strong>of</strong> Fish and Game* U*S* Fish and Haederlie. 1980. Intertidal inverte-Wildlife Service. brates <strong>of</strong> Cal ifornia, Stanford UniversityPress, Stanford, Calif.Macdonald, K.B. 1977, Coastal salt marsh.Pages 263-469 in MmGm dnrl J* Mudie, P.J., B. Browning, and J. Speth.Major, eds. ~Grestrial vegetation <strong>of</strong> 1974. <strong>The</strong> natural resources <strong>of</strong> LO^Gal fornia. John wile^ and Sons, rkw Penasquitos <strong>Lagoon</strong>. Recmmndations forYork. use and development. Coastal <strong>Wetlands</strong>Series no. 7. <strong>California</strong> Department <strong>of</strong>Fish and Game. Sacramento.Macdonald, K,B,, and M.G. Barbour. 1974.Beach and salt marsh vegetation <strong>of</strong> theNorth American Pacific coast. Pages175-233 in R.J. Reimold and W.H. Queen,eds. E C O ~ ~ <strong>of</strong> Y halophytes. AcademicPress, Inc,, New York.MacGinitie, E.E. 1934. <strong>The</strong> natural history<strong>of</strong> Callianassa ca1 i forniensis(Dana). h Midl. Nat. 15:166-177,MacGini tie, Go€., 1935. Ecological aspects<strong>of</strong> d <strong>California</strong> marine estuary.h. Midl. Nat. 163629-675.MacGinitie, G.E., and I . MacGini tie.1969. A report on <strong>Mugu</strong> <strong>Lagoon</strong>. Tabulata 2(4): 15-24.Massey, B.W. 1977. A census <strong>of</strong> the breedingpopulation <strong>of</strong> the Belding 's Savannahsparrow in Cal iforina, 1977. Cal ifornidDepartment <strong>of</strong> Fish and Game, Sacrainento.Fiassey, E.H. 1979. Bet ding's Savannahsparrow. Southern <strong>California</strong> OceanStudies Consortium, <strong>California</strong> StateMurphey, T.G., J.C. Newman, and R.J. Dow.19131. <strong>Ecology</strong> and natural history <strong>of</strong>salt marsh bird's beak (Cord lanthusrnari tirnus ssp. mari tlmus-<strong>Lagoon</strong>. Pages 187-190 R.J. Dow, ed.Bienni a1 Muau Laqoon/San Nicolas Islandecological Fesearch symposium. PacificMissile Test Center, Naval Air Station,Point <strong>Mugu</strong>, Calif.Murphy, A.L. 1979. A canprehensive story<strong>of</strong> Ventura County, <strong>California</strong>. M&NPrinting, Oxndrd, Calif,Nixoo, S.W. 1982. <strong>The</strong> ecology <strong>of</strong> NewEngland high salt marshes: a cnmrfiunitypr<strong>of</strong>ile. U,S, Fish Wild?. Serv.FWS/OBS-81/55,Nordby, C. 1982. Comparative ecology <strong>of</strong>ichthyoplanktan within and outsideTijuana Estiary, Cal ifol-nia, M,S,<strong>The</strong>sis. §an Di ego State University,Calif.
Onuf, C.P., and M.L. Quammen. 1983,Fishes in a <strong>California</strong> coastal lagoon:effects <strong>of</strong> major storms on distributionand abundance. Mar. Ecol. Prog. Ser.12:l-14.Onuf, C.P., M.L. Quammen, G.P. Shaffer,C.H. Peterson, 3.W. Chapman, J. Cermak,and R.W Holmes. 1979. An analysis <strong>of</strong>the values <strong>of</strong> central and southern <strong>California</strong>coastal wet1 ands. Pages 186-199- in P.M. Greeson, J.R. Clark, and J.E.Clark, eds. Wetland functions andvalues: the state <strong>of</strong> our understanding.American Water Resources Association,Minneapol is, Minn.Onuf, C.P., R.W. dolmes, and C.H. Peterson.1981a. Coastal wetlands management:application <strong>of</strong> biological criteria.Pages 26-33 in <strong>California</strong> SeaGrant Col lege Program 1978-1980 biennialreport. Institute <strong>of</strong> Marine Resources,University <strong>of</strong> <strong>California</strong>, La Jol la.Onuf, C.P., R.W. Holmes, and C.H. Peterson.1981b. Coastal wetlands management:application <strong>of</strong> biological criteria,Pages 61-63 in <strong>California</strong> SeaGrant Col lege Program 7378-1980 bienni a1report. Institute <strong>of</strong> Marine Resources,University <strong>of</strong> <strong>California</strong>, La Jolla.Page, G.W., L.E. Stenzel , and C.M. Wolfe.1979. Aspects <strong>of</strong> the occurrence <strong>of</strong>shorebirds on a central <strong>California</strong> estuary.Pages 15-32 in F.A. Pitel ka, ed.Shorebi rds in marine envi ronments.Studies in Avian Biology No. 2. AllenPress, Inc. Lawrence, Kan.Parsons, T,, and M. Takahashi, 1973.Biological oceanographic processes.Pergamon Press, New York. 186 pp.Peterson, C.H. 1972. Species diversity,disturbance and time in the bivalve communities <strong>of</strong> some <strong>California</strong> lagoons.Ph.D, Dissertation. University <strong>of</strong> <strong>California</strong>,Santa Barbara.Peterson, C.H. 1975. Stability <strong>of</strong> speciesand <strong>of</strong> community for the benthos <strong>of</strong> tw~lagoons. <strong>Ecology</strong> 56:958-965.Peterson, C.H. 1977. Competitive organization<strong>of</strong> the s<strong>of</strong>t-boltm macrobenthiccmmuni ties <strong>of</strong> southern Cal ifornia1 agoons, Mar. Bi 01. 43:343-359.Peterson, i,H, 1982. <strong>The</strong> importance <strong>of</strong>predation and intra- and interspecificcmpeti tion in the population biology <strong>of</strong>two infaunal sus~ension-feeding bivalves,Protothaca '--staminea and -chioneundatel 1 a. Ecol , Monogr. 52: 437-475.Peterson, C.H., and S.V. Andre. 1980. Anexperimental analysis <strong>of</strong> interspecificcompetition among marine filter feedersin a s<strong>of</strong>t-sediment environment. <strong>Ecology</strong>61 : 129-139.Peterson, C.H., and N.M. Peterson. 1979.<strong>The</strong> ecology <strong>of</strong> intertidal flats <strong>of</strong> NorthCarolina: a community pr<strong>of</strong>ile. U.S.Fish Wildl. Serv. FWS/OBS-79/39,73 PP*Peterson, C.H., and M.L. Quammen. 1982.Siphon nipping: its importance to smallfishes and its im~act on arowth <strong>of</strong> thebivalve ~rotothaca stamiha (Conrad).J. Exp. Mar. Biol. Ecol. 63:249-Plummer, K.M., E.E. DeMartini, and D.A.Roberts. 1983. <strong>The</strong> feeding habits anddistribution <strong>of</strong> juvenile-small adultCali fornia ha1 i but (Para1 ichthys m-fornicus) in coastal waters <strong>of</strong>f northern-0 County. Calif. Coop. OceanicFish. Invest. Rep. 24 : 194-201.Porter, K.G. 1977. <strong>The</strong> plant-animal interfacein freshwater ecosystems. Am.Sci . 65: 159-170.Powell, R.R. 1974. <strong>The</strong> functional morphology<strong>of</strong> the fore-guts <strong>of</strong> the thalassinidcrustaceans, Call ianassa cal iforniensisand Upogebia pugettensim*Calif. Publ. Zool. 102:i-41,Pritchard, D.W. 1967. What is an estuary:physical viewpoint. Pages 3-5 inG.H. Lauff, ed. Estuaries. AmericanAssociation for the Advancement <strong>of</strong> Science,Washington, D.C.Quammen, M.L. 1981. Use <strong>of</strong> exclosuresin studies <strong>of</strong> predation by shorebirdson intertidal mudfl ats. Auk 98:812-817.
guammng M.Le 1982, Influence <strong>of</strong> subtlesubstrate differences on feeding byshorebirds on intertidal mudflats. Mar.Biol . 71 :339-343.Quamnen, M.L. 1984. Predation by shorebirds,fish and crabs on invertebratesin intertidal mudflats: an experimentaltest, ECO~ ogy 65: 529-537.Recher, H.F. 1966. Some aspects <strong>of</strong> thebiology <strong>of</strong> migrant shorebirds. <strong>Ecology</strong>47 : 393-407.Reid, R.G.B., and A. Reid. 1969. Feedingprocesses <strong>of</strong> members <strong>of</strong> the genusMacma. Can. J, Zool. 26:649-657.Rheinheimer, G. 1976. Aquatic microbiology.John Wiley and Sons, Inc., NewYork, 184 pp.Shaffer, G.P., and C.P. Onuf. 1983. Ananalysis <strong>of</strong> factors influencing theprimary production <strong>of</strong> the benthic micr<strong>of</strong>lorain a southern <strong>California</strong> lagoon.Neth. J. Sea Res. 17:126-144.Shaffer, G.P., and C.P. Onuf. 1985.Reducing the error in estimating annualproduction <strong>of</strong> benthic micr<strong>of</strong>lora: hourlyto monthly rates, patchiness in spaceand time. Mar. Ecol. Prog, Ser. 26:221-231.She1 ton, J.S. 1954. Miocene volcanism incoastal southern <strong>California</strong>. Calif.Div. Mines Bull. 170, Chap. 7331-36.Smith, T.P. 1981. Systematics and ecology<strong>of</strong> the benthic ciliates <strong>of</strong> Point <strong>Mugu</strong><strong>Lagoon</strong>, southern <strong>California</strong>. Ph.D. Dissertation.University <strong>of</strong> Southern Cal i-fornia, Los Angeles.Rietsma, C.S., 1. Valiela, and A. Soil Conservation Service. 1970. SoilSyl vester-Serianni. 1982. Food prefer- Survey, Ventura Area, <strong>California</strong>. U,S.ences <strong>of</strong> dominant salt marsh herbivores Department <strong>of</strong> Agriculture, Davis, Calif.and detritivores. Mar. Ecol. 3:179-189.Soil Conservation Service. 1983. Envi-Ronan, T.E., Jr. 1975. Structural andronmental assessment <strong>of</strong> Revol on Sloughpa1 eoecol ogical aspects <strong>of</strong> a rnodernwatershed outlet, Ventura County, Calis<strong>of</strong>t-sediment community : an experifornia.U.S. Department <strong>of</strong> Agriculture,mental field study. Ph.D. Dissertation.Davis, Calif.University <strong>of</strong> <strong>California</strong>, Davis.Russel 1 -Hunter, W .D. 1970, Aquatic productivity. MacMil lan Company, London.Schulnan, E. 1947. Tree-ri ng hydro1 ogyin southern <strong>California</strong>. Univ. Ariz.Lab. Tree-ring Res. Bull. 4.Scott, K.M., and R.P. Williams. 1978.Erosion and sediment yields in theTransverse Ranges, southern Cal i fornia.1J.S. Geol. Surv. Pr<strong>of</strong>. Pap. 1030:l-38.Seliskar, D,M., and J.L. Gallagher. 1983.<strong>The</strong> ecology <strong>of</strong> tidal marshes <strong>of</strong> thePaci fic Northwest coast: a ~CnnmLInityPr<strong>of</strong>ile. U.S. Fish Wildl. Serv. FUS/05s-32/32.Shaffer, G.P, 1982, Primary production<strong>of</strong> the benthic rnicr<strong>of</strong>lora in a southernGal ifornia estuary. MIA. <strong>The</strong>sis. hiversity <strong>of</strong> Gal j fornia, Santa Zarbara.135 pp.Speth, J., R. Fordice, R, Hein, and P.Giguere. 1970. <strong>The</strong> natural resources<strong>of</strong> Go1 eta Slough and recommends ti ons foruse and development. Coastal WetlandSeries No. 2. Cal ifornia DepartmentFish and Game.Steffen, L.J. 1982. <strong>Mugu</strong> <strong>Lagoon</strong> and itstributaries: geology and sedirnentation.U.S. Department <strong>of</strong> Agriculture, SoilConservation Service, Davis, Calif.Steplrens, G.C. 1982. Recent progress inthe study <strong>of</strong> "Die Ernzhrung der Wassertiereund der St<strong>of</strong>fhaushalt derGewBsser," Am. Zool. 22:511-619.Taghon, G.L., 4.R.M. Nowel l, and P.A,Jumars. 1980. induction <strong>of</strong> suspensionfeeding in spionid polychaetes by highparticulate fluxes, Science 210:262-264.Tenore, K.R. 1980, Avail abil i ty <strong>of</strong>detritus <strong>of</strong> different types and ages to
a polychaete mcroconsumr, Capi tel lacapitata, Limnol. Oceanogr. 253553-558.Troxell, H.C., and W, H<strong>of</strong>mann. 1954. Hydrology<strong>of</strong> the Los Angeles region.Calif. Div. Mines Bull. 170, Chap, 6:s-12.Turner, R.E. 1976. Geographic variationsin salt marsh macrophyte production: areview, Contrib. Mar. Sci. 20:47-68.U.S. Environmental Data and InformationService, 1980. C1 imatol ogical data:<strong>California</strong>. Vol. 84, U.S. Dep. Commer.Environ. Data Serv., Asheville, N.C.Mi tlach, R.B., and S. Obrebski. 1380.Feeding selection and coexistence in twodeposit feeding gastropods, Mar, Biol .58~219-226,Wilson, C.J, 1980, <strong>The</strong> effect <strong>of</strong> substratetype on the survival and recruitment<strong>of</strong> epibenthic diatms in <strong>Mugu</strong><strong>Lagoon</strong>, <strong>California</strong>. M.A, <strong>The</strong>sis. University <strong>of</strong> <strong>California</strong>, Santa Barbara.Winfield, T.P. 1980. Dynamics <strong>of</strong> carbonand nitrogen in a southern <strong>California</strong>salt marsh, Ph.D, Dissertation. University <strong>of</strong> <strong>California</strong>, Riverside; SanDiego State University.U.S. Fish and Wildlife Service, 1979.Inventory and management plan <strong>of</strong> thefish and wildlife resources for the Department <strong>of</strong> Navy, <strong>Mugu</strong> <strong>Lagoon</strong>, PacificMissile Test Center, Point <strong>Mugu</strong>, <strong>California</strong>.Region 1, Portland, Ore.Wolfe, J.C., J.W. Cooper, and R.J. Dow.1979. An evaluation <strong>of</strong> increased tidalci rculation in <strong>Mugu</strong> <strong>Lagoon</strong>, Cal ifornia.U.S. Fish and Wildlife Service, Region1, Portland, Oreg.U.S. Geological Survey. 1974, <strong>The</strong> na-Zedler, J.B. 1982. <strong>The</strong> ecology <strong>of</strong> southern<strong>California</strong> coastal salt marshes: ational atlas <strong>of</strong> the United States. cmmunity pr<strong>of</strong>ile. U.S. Fish Wildl.Government Printing Office, Washington, Serv, FWS/OBS-81/54.D.C.Vahl, 0. 1973. Efficiency <strong>of</strong> particleretention in Chlam s islandica (O.F.Mil1 ler). Astard-25.van der Leeden, F, 1975. Water resources<strong>of</strong> the world. Selected statistics.Water Information Center, Port Washington,M.Y.Warme, J.E. 1966. Paleoecological aspects<strong>of</strong> the recent ecology <strong>of</strong> <strong>Mugu</strong><strong>Lagoon</strong>, <strong>California</strong>. Ph.D, Dissertation.University <strong>of</strong> <strong>California</strong>, Los Angeles.Warme, J.E. 1971. Paleoecol ogical aspects<strong>of</strong> a modern coastal lagoon. Univ.Calif. Publ. Geol. Sci. 87:l-131.White, W.S., ROC. Wunderlich, and R.M.Jurek. (Unpublished). <strong>The</strong> natural resources<strong>of</strong> the Ti juana Estuary. Prel iminarydraft. U.S. Fish and WildlifeService, Portland, Ore.Whi tlach, R,B. 1980. Patterns <strong>of</strong> resourceuti 1 ization and co-exis tence inmarine intertidal deposi t-feedi ngnities, J. Mar. Res. 38:743-765.Zedler, J.B. 1984. Salt marsh restoration.A guidebook for southern <strong>California</strong>.Calif. Sea Grant Rep. No. T-GSGCP-009, La Jol 1 a, Cal if.Zedler, J.B., T. Winfield, and D. Mauriello. 1978. Primary productivity in asouthern Cal fornia estuary. Coastalzone ' 78, Vol . 2:649-662, AmericanSociety <strong>of</strong> Civil Engineers, New York.Zembal , R.L., and B.W. Massey. 1981a. Continuationstudy <strong>of</strong> the light-footedclapper rail Rallus longirostrislevi pes, 1981. Final Report. <strong>California</strong>Department <strong>of</strong> Fish and Game,Sacramento,Zembal , R., and B.W. Massey. 198lb. Acensus <strong>of</strong> the light-footed clapper railin <strong>California</strong>. West. Birds 12:87-99.Zembal , R., and B.W. Massey, 1983, <strong>The</strong>1 ight-footed clapper rail : di stribution,nesting strategies, and management,Pages 97-103 & Cal-Neva HfldlifeTransactions.
L R.eigl.nt's rlucrrr.lon No.f he <strong>Ecology</strong> <strong>of</strong> <strong>Mugu</strong> h3o~n, Cal ifornia : An Estuarine Pr<strong>of</strong>ile$4. ewer€ antsJune 1987d.Christopher P.OnufAuthor's Affiliation:Marine Science InstituteUniversity <strong>of</strong> <strong>California</strong>Santa Barbara, CA 93106ra hiactR.+(rmorr writ NO.11- Daa-(C) or Ib*nt(e) NO.02)12. Xpomonna Osy.nt+.Ploa Mdra~<strong>National</strong> Netlands Research CenterResearch and DevelopmentU.S. Fish and Wildlife ServiceWashington, OC 20240ra- rror or ~.a* s, -Id amaeQd<strong>Mugu</strong> <strong>Lagoon</strong> is significant as one <strong>of</strong> the least dfstgrbed and best protected estuariesin southern Calffarnia; thus, this small estuasfne system can serve as a baseline modelfor the region. This report samarrizes and synthesizes scientific data on the ecologicalstructure and functioning <strong>of</strong> the estuary, includ+ng djscussions <strong>of</strong> cltmate, hydrology,geology, physiog~apby, btatic assmblages, and ecological processes and interactions.<strong>The</strong> estuary exhtbtts e~trme~uariability +n freshwater inputs, being at times totd'llymarfne and at ather times flubbed by stomwater cun<strong>of</strong>f frm the watershed. Major stonnsin I978 and 1980 resulted dn sedimentatton that drastically altered benthic cornmartitiesand resulted in changes in the< distribclf ion <strong>of</strong> submerged aquatic vegetation and benthos,and fish and shorebird use .<strong>of</strong>' bhese food resources.<strong>Mugu</strong> <strong>Lagoon</strong> is psrt <strong>of</strong> a nasal base and the~efore not subject to the development pressuresfacing many other southern Cali fornja estuaries. Storm-produced sedtmenttthonremains a management concern, as wll as closure <strong>of</strong> the mouth <strong>of</strong> the lagoon due &olittoral drift <strong>of</strong> sand along Dhe barrier spit.Estuaries, ecology, geology, hydrology, climate, nekton, a1 gae,biological productivityb. Ideritlfi~~/OWn-Endcd T~~~~wetlands, energy flow, nutrient cycl ing, emergent vascular plantsc COSATI FieldlGroupAgsrlrbsilty StatementUnl ini ted distributjonU S GWERNMEMPRIKT1NGOFFICE 1987-761-070 40014(Fcrmerly lfF1.S-35)~epsemwd at commm*


