The-Ogilvy-Mather-guide-to-effectiveness
The-Ogilvy-Mather-guide-to-effectiveness
The-Ogilvy-Mather-guide-to-effectiveness

Create successful ePaper yourself
Turn your PDF publications into a flip-book with our unique Google optimized e-Paper software.
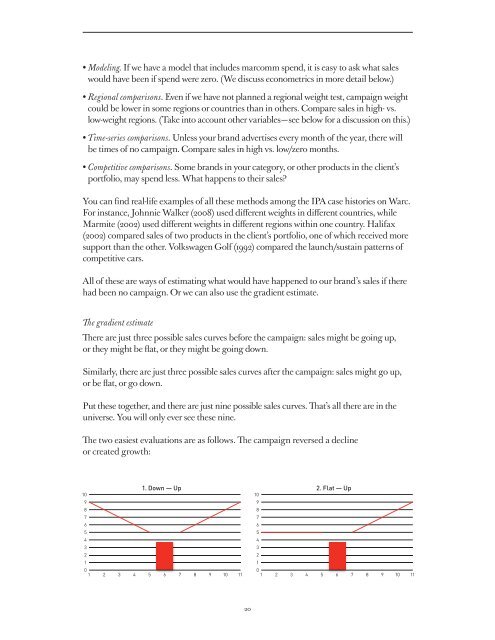
• Modeling. If we have a model that includes marcomm spend, it is easy <strong>to</strong> ask what saleswould have been if spend were zero. (We discuss econometrics in more detail below.)• Regional comparisons. Even if we have not planned a regional weight test, campaign weightcould be lower in some regions or countries than in others. Compare sales in high- vs.low-weight regions. (Take in<strong>to</strong> account other variables — see below for a discussion on this.)• Time-series comparisons. Unless your brand advertises every month of the year, there willbe times of no campaign. Compare sales in high vs. low/zero months.• Competitive comparisons. Some brands in your category, or other products in the client’sportfolio, may spend less. What happens <strong>to</strong> their sales?You can find real-life examples of all these methods among the IPA case his<strong>to</strong>ries on Warc.For instance, Johnnie Walker (2008) used different weights in different countries, whileMarmite (2002) used different weights in different regions within one country. Halifax(2002) compared sales of two products in the client’s portfolio, one of which received moresupport than the other. Volkswagen Golf (1992) compared the launch/sustain patterns ofcompetitive cars.All of these are ways of estimating what would have happened <strong>to</strong> our brand’s sales if therehad been no campaign. Or we can also use the gradient estimate.<strong>The</strong> gradient estimate<strong>The</strong>re are just three possible sales curves before the campaign: sales might be going up,or they might be flat, or they might be going down.Similarly, there are just three possible sales curves after the campaign: sales might go up,or be flat, or go down.Put these <strong>to</strong>gether, and there are just nine possible sales curves. That’s all there are in theuniverse. You will only ever see these nine.<strong>The</strong> two easiest evaluations are as follows. <strong>The</strong> campaign reversed a declineor created growth:1. Down — Up 2. Flat — Up1098765432101098765432101 2 3 4 5 6 7 8 9 10 11 1 2 3 4 5 6 7 8 9 10 1120