

Determinants of Export Performance - unctad
Determinants of Export Performance - unctad
Determinants of Export Performance - unctad

Create successful ePaper yourself
Turn your PDF publications into a flip-book with our unique Google optimized e-Paper software.
<strong>Determinants</strong> <strong>of</strong> export performance<br />
barriers have come down and markets have expanded. Those countries that on<br />
average enjoyed the highest growth rates are Singapore and Malaysia. The results<br />
underline the significant role <strong>of</strong> regional integration for East Asian and Pacific countries.<br />
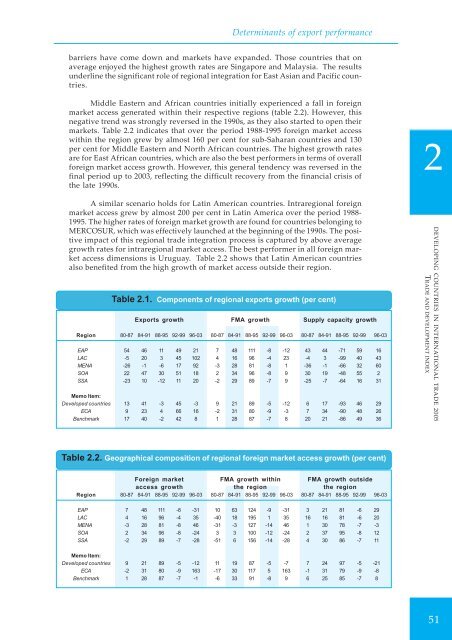
Middle Eastern and African countries initially experienced a fall in foreign<br />
market access generated within their respective regions (table 2.2). However, this<br />
negative trend was strongly reversed in the 1990s, as they also started to open their<br />
markets. Table 2.2 indicates that over the period 1988-1995 foreign market access<br />
within the region grew by almost 160 per cent for sub-Saharan countries and 130<br />
per cent for Middle Eastern and North African countries. The highest growth rates<br />
are for East African countries, which are also the best performers in terms <strong>of</strong> overall<br />
foreign market access growth. However, this general tendency was reversed in the<br />
final period up to 2003, reflecting the difficult recovery from the financial crisis <strong>of</strong><br />
the late 1990s.<br />
A similar scenario holds for Latin American countries. Intraregional foreign<br />
market access grew by almost 200 per cent in Latin America over the period 1988-<br />
1995. The higher rates <strong>of</strong> foreign market growth are found for countries belonging to<br />
MERCOSUR, which was effectively launched at the beginning <strong>of</strong> the 1990s. The positive<br />
impact <strong>of</strong> this regional trade integration process is captured by above average<br />
growth rates for intraregional market access. The best performer in all foreign market<br />
access dimensions is Uruguay. Table 2.2 shows that Latin American countries<br />
also benefited from the high growth <strong>of</strong> market access outside their region.<br />
Table 2.1. Components <strong>of</strong> regional exports growth (per cent)<br />
<strong>Export</strong>s growth FMA growth Supply capacity growth<br />
Region 80-87 84-91 88-95 92-99 96-03 80-87 84-91 88-95 92-99 96-03 80-87 84-91 88-95 92-99 96-03<br />
EAP 54 46 11 49 21 7 48 111 -8 -12 43 44 -71 59 16<br />
LAC -5 20 3 45 102 4 16 96 -4 23 -4 3 -99 40 43<br />
MENA -26 -1 -6 17 92 -3 28 81 -8 1 -36 -1 -66 32 60<br />
SOA 22 47 30 51 18 2 34 96 -8 9 30 19 -48 55 2<br />
SSA -23 10 -12 11 20 -2 29 89 -7 9 -25 -7 -64 16 31<br />
Memo Item:<br />
Developed countries 13 41 -3 45 -3 9 21 89 -5 -12 6 17 -93 46 29<br />
ECA 9 23 4 66 16 -2 31 80 -9 -3 7 34 -90 48 26<br />
Benchmark 17 40 -2 42 8 1 28 87 -7 8 20 21 -86 49 36<br />
Table 2.2. Geographical composition <strong>of</strong> regional foreign market access growth (per cent)<br />
Foreign market FMA growth within FMA growth outside<br />
access growth the region the region<br />
Region 80-87 84-91 88-95 92-99 96-03 80-87 84-91 88-95 92-99 96-03 80-87 84-91 88-95 92-99 96-03<br />
EAP 7 48 111 -8 -31 10 63 124 -9 -31 3 21 81 -6 29<br />
LAC 4 16 96 -4 35 -40 18 195 1 35 16 16 81 -6 20<br />
MENA -3 28 81 -8 46 -31 -3 127 -14 46 1 30 78 -7 -3<br />
SOA 2 34 96 -8 -24 3 3 100 -12 -24 2 37 95 -8 12<br />
SSA -2 29 89 -7 -28 -51 6 156 -14 -28 4 30 86 -7 11<br />
Memo Item:<br />
Developed countries 9 21 89 -5 -12 11 19 87 -5 -7 7 24 97 -5 -21<br />
ECA -2 31 80 -9 163 -17 30 117 5 163 -1 31 79 -9 -8<br />
Benchmark 1 28 87 -7 -1 -6 33 91 -8 9 6 25 85 -7 8<br />
2<br />
DEVELOPING COUNTRIES IN INTERNATIONAL TRADE 2005<br />
TRADE AND DEVELOPMENT INDEX<br />
51


