Energy Analyser
Energy Analyser
Energy Analyser
- No tags were found...

You also want an ePaper? Increase the reach of your titles
YUMPU automatically turns print PDFs into web optimized ePapers that Google loves.
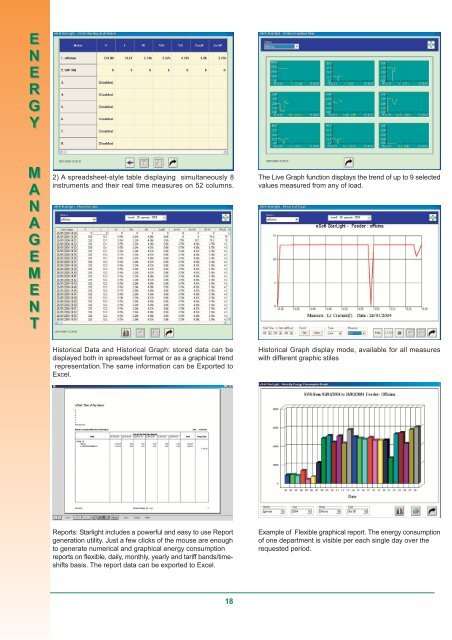
ENERGYMANAGEMENT2) A spreadsheet-style table displaying simultaneously 8instruments and their real time measures on 52 columns.The Live Graph function displays the trend of up to 9 selectedvalues measured from any of load.Historical Data and Historical Graph: stored data can bedisplayed both in spreadsheet format or as a graphical trendrepresentation.The same information can be Exported toExcel.Historical Graph display mode, available for all measureswith different graphic stilesReports: Starlight includes a powerful and easy to use Reportgeneration utility. Just a few clicks of the mouse are enoughto generate numerical and graphical energy consumptionreports on flexible, daily, monthly, yearly and tariff bands/timeshiftsbasis. The report data can be exported to Excel.Example of Flexible graphical report. The energy consumptionof one department is visible per each single day over therequested period.18