UBL Financial Statements - United Bank Limited
UBL Financial Statements - United Bank Limited
UBL Financial Statements - United Bank Limited

You also want an ePaper? Increase the reach of your titles
YUMPU automatically turns print PDFs into web optimized ePapers that Google loves.
A.F. FERGUSON & CO KPMG TASEER HADI & CO.<br />
CHARTERED ACCOUNTANTS CHARTERED ACCOUNTANTS<br />
State Life Building No.1-C, Sheikh Sultan Trust<br />
I.I. Chundrigar Road, Building No. 2, Beaumont Road,<br />
Karachi Karachi<br />
AUDITORS’ REPORT TO THE MEMBERS<br />
We have audited the annexed balance sheet of <strong>United</strong> <strong>Bank</strong> <strong>Limited</strong> as at December 31, 2006 and the related profit and loss<br />
account, cash flow statement and statement of changes in equity, together with the notes forming part thereof (here-in-after referred<br />
to as the 'financial statements') for the year then ended, in which are incorporated the unaudited certified returns from the branches<br />
except for sixty-one branches which have been audited by us and fifteen branches audited by auditors abroad and we state that we<br />
have obtained all the information and explanations which, to the best of our knowledge and belief, were necessary for the purposes<br />
of our audit.<br />
It is the responsibility of the <strong>Bank</strong>’s Board of Directors to establish and maintain a system of internal control and prepare and present<br />
the financial statements in conformity with approved accounting standards and the requirements of the <strong>Bank</strong>ing Companies<br />
Ordinance, 1962 (LVII of 1962) and the Companies Ordinance, 1984 (XLVII of 1984). Our responsibility is to express an opinion on<br />
these statements based on our audit.<br />
We conducted our audit in accordance with the International Standards on Auditing as applicable in Pakistan. These standards<br />
require that we plan and perform the audit to obtain reasonable assurance about whether the financial statements are free of any<br />
material misstatement. An audit includes examining, on a test basis, evidence supporting the amounts and disclosures in the<br />
financial statements. An audit also includes assessing the accounting policies and significant estimates made by management, as<br />
well as, evaluating the overall presentation of the financial statements. We believe that our audit provides a reasonable basis for our<br />
opinion and after due verification, which in the case of loans and advances covered more than sixty percent of the total domestic<br />
loans and advances of the <strong>Bank</strong>, we report that:<br />
a)<br />
b) in our opinion:<br />
c)<br />
d)<br />
in our opinion, proper books of account have been kept by the <strong>Bank</strong> as required by the Companies Ordinance, 1984 (XLVII<br />
of 1984) and the returns referred to above received from the branches have been found adequate for the purposes of our<br />
audit;<br />
(i)<br />
(ii) the expenditure incurred during the year was for the purpose of the <strong>Bank</strong>’s business; and<br />
(iii)<br />
in our opinion and to the best of our information and according to the explanations given to us the balance sheet, profit and<br />
loss account, cash flow statement and statement of changes in equity together with the notes forming part thereof conform<br />
with the approved accounting standards as applicable in Pakistan and give the information required by the <strong>Bank</strong>ing<br />
Companies Ordinance, 1962 (LVII of 1962), and the Companies Ordinance, 1984 (XLVII of 1984), in the manner so required<br />
and give a true and fair view of the state of the <strong>Bank</strong>’s affairs as at December 31, 2006 and its true balance of the profit, its<br />
cash flows and changes in equity for the year then ended; and<br />
in our opinion zakat deductible at source under the Zakat and Ushr Ordinance, 1980 (XVIII of 1980), was deducted by the<br />
<strong>Bank</strong> and deposited in the Central Zakat Fund established under Section 7 of that Ordinance.<br />
A. F. FERGUSON & Co. KPMG TASEER HADI & CO.<br />
Chartered Accountants Chartered Accountants<br />
Karachi<br />
Dated: February 17, 2007<br />
the balance sheet and profit and loss account together with the notes thereon have been drawn up in conformity with<br />
the <strong>Bank</strong>ing Companies Ordinance, 1962 (LVII of 1962) and the Companies Ordinance, 1984 (XLVII of 1984), and are<br />
in agreement with the books of account and are further in accordance with accounting policies consistently applied;<br />
the business conducted, investments made and the expenditure incurred during the year were in accordance with the<br />
objects of the <strong>Bank</strong> and the transactions of the <strong>Bank</strong> which have come to our notice have been within the powers of the<br />
<strong>Bank</strong>;
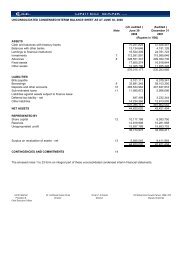
BALANCE SHEET AS AT DECEMBER 31, 2006<br />
Note 2006 2005<br />
(Rupees in ‘000)<br />
ASSETS<br />
Cash and balances with treasury banks 6 48,939,840 34,074,786<br />
Balances with other banks 7 14,034,476 12,717,100<br />
Lendings to financial institutions 8 29,572,070 17,867,552<br />
Investments<br />
Advances<br />
9 67,260,338 63,026,944<br />
Performing 10 243,237,819 201,152,095<br />
Non-performing 10 4,072,074 3,658,375<br />
Fixed assets 11<br />
247,309,893<br />
5,234,463<br />
Deferred tax asset - net 12 906,661<br />
Other assets<br />
LIABILITIES<br />
13 10,062,466<br />
423,320,207<br />
Bills payable 15 4,560,649<br />
Borrowings 16 38,544,920<br />
Deposits and other accounts 17 335,077,873<br />
Sub-ordinated loans 18 5,998,344<br />
Liabilities against assets subject to finance lease -<br />
Other liabilities 19 9,275,034<br />
393,456,820<br />
NET ASSETS 29,863,387<br />
REPRESENTED BY:<br />
Share capital 20 6,475,000<br />
Reserves 8,298,873<br />
Unappropriated profit 12,429,853<br />
27,203,726<br />
Surplus on revaluation of assets - net 21 2,659,661<br />
29,863,387<br />
CONTINGENCIES AND COMMITMENTS 22<br />
The annexed notes 1 to 47 and annexures form an integral part of these financial statements.<br />
204,810,470<br />
4,449,324<br />
2,273,005<br />
7,829,770<br />
347,048,951<br />
4,159,964<br />
21,790,480<br />
289,226,299<br />
3,999,192<br />
-<br />
6,204,746<br />
325,380,681<br />
21,668,270<br />
5,180,000<br />
6,225,461<br />
7,350,813<br />
18,756,274<br />
2,911,996<br />
21,668,270<br />
Atif R. Bokhari Abdul Rauf Malik Sir Mohammed Anwar Pervez, OBE, HPk Nahayan Mabarak Al Nahayan<br />
President and Director Deputy Chairman Chairman<br />
Chief Executive Officer
PROFIT AND LOSS ACCOUNT FOR THE YEAR ENDED DECEMBER 31, 2006<br />
Note 2006 2005<br />
(Rupees in ‘000)<br />
Mark-up / return / interest earned 24 32,991,603<br />
Mark-up / return / interest expensed 25 12,126,809<br />
Net mark-up / interest income 20,864,794<br />
Provision against loans and advances - net 10.3 1,972,936<br />
Provision for diminution in value of investments - net 9.3 74,573<br />
Bad debts written off directly 10.4 269,349<br />
2,316,858<br />
Net mark-up / return / interest income after provisions 18,547,936<br />
Non Mark-up / Interest Income<br />
Fee, commission and brokerage income 3,876,799<br />
Dividend income 837,338<br />
Income from dealing in foreign currencies 659,726<br />
Gain on sale of securities<br />
Unrealized gain/ (loss) on revaluation of investments classified as<br />
26 280,864<br />
held for trading 9.4 (3,335)<br />
Other income 27 1,296,996<br />
Total non mark-up / return / interest income<br />
Non Mark-up / Interest Expenses<br />
6,948,388<br />
25,496,324<br />
Administrative expenses 28 10,952,275<br />
Other provisions / write offs 29 226,313<br />
Other charges 30 25,980<br />
Total non mark-up / interest expenses 11,204,568<br />
Extraordinary items -<br />
Profit before taxation 14,291,756<br />
Taxation - Current 31 3,412,791<br />
Taxation - Prior year 31 45,225<br />
Taxation - Deferred 31 1,365,508<br />
4,823,524<br />
Profit after taxation 9,468,232<br />
Unappropriated profit brought forward 7,350,813<br />
16,819,045<br />
Transfer from surplus on revaluation of fixed assets - net of tax 94,454<br />
Profit available for appropriation 16,913,499<br />
Basic and diluted earnings per share 32 14.62<br />
The annexed notes 1 to 47 and annexures form an integral part of these financial statements.<br />
(Rupees)<br />
20,158,860<br />
6,045,948<br />
14,112,912<br />
1,277,002<br />
112,666<br />
38,140<br />
1,427,808<br />
12,685,104<br />
2,543,739<br />
202,343<br />
675,109<br />
382,419<br />
(780)<br />
1,210,202<br />
5,013,032<br />
17,698,136<br />
7,874,013<br />
335,409<br />
7,066<br />
8,216,488<br />
-<br />
9,481,648<br />
498,748<br />
78,614<br />
2,955,254<br />
3,532,616<br />
5,949,032<br />
3,274,439<br />
9,223,471<br />
94,148<br />
9,317,619<br />
Atif R. Bokhari Abdul Rauf Malik Sir Mohammed Anwar Pervez, OBE, HPk Nahayan Mabarak Al Nahayan<br />
President and Director Deputy Chairman Chairman<br />
Chief Executive Officer<br />
9.19
CASH FLOW STATEMENT FOR THE YEAR ENDED DECEMBER 31, 2006<br />
Note 2006 2005<br />
Rupees in '000<br />
CASH FLOW FROM OPERATING ACTIVITIES<br />
Profit before taxation 14,291,756<br />
9,481,648<br />
Less: Dividend income 684,961<br />
(202,343)<br />
13,606,795<br />
9,279,305<br />
Adjustments:<br />
Depreciation 550,674<br />
412,541<br />
Amortization 52,251<br />
23,381<br />
Provision for retirement benefits 225,172<br />
117,772<br />
Provision against loans and advances 1,972,936<br />
1,277,002<br />
Provision for diminution in value of investments 74,573<br />
112,666<br />
Provision against off- balance sheet items 52,663<br />
238,712<br />
(Gain) on sale of fixed assets (14,393)<br />
(12,771)<br />
Finance charges on leased assets -<br />
3<br />
Bad debts written-off directly 269,349<br />
38,140<br />
Unrealized loss on revaluation of investments classified as held for trading 3,335<br />
780<br />
Provision against other assets 173,650<br />
87,998<br />
Exchange loss on cash and cash equivalents 1,067,593<br />
209,350<br />
4,427,803<br />
2,505,574<br />
(Increase)/ Decrease in operating assets<br />
18,034,598 11,784,879<br />
Lendings to financial institutions (11,704,518)<br />
493,081<br />
Held-for-trading securities 1,376,349<br />
996,353<br />
Advances (44,741,708) (61,974,557)<br />
Other assets (excluding advance taxation) (1,963,795) (3,523,015)<br />
Increase/ (Decrease) in operating liabilities<br />
(57,033,672) (64,008,138)<br />
Bills payable 400,685<br />
348,680<br />
Borrowings 16,754,440<br />
9,814,796<br />
Deposits and other accounts 45,851,574 58,969,672<br />
Other liabilities (excluding current taxation) 2,073,336<br />
(37,510)<br />
65,080,035 69,095,638<br />
26,080,961 16,872,379<br />
Staff retirement benefits paid (548,153)<br />
(110,323)<br />
Income taxes paid (2,635,945)<br />
(328,751)<br />
Net cash flow from operating activities 22,896,863 16,433,305<br />
CASH FLOW FROM INVESTING ACTIVITIES<br />
Net investments in available-for-sale securities (5,844,696)<br />
Dividend income received 687,609<br />
Investments in operating fixed assets (1,396,396)<br />
Sale proceeds from disposal of property and equipment 22,725<br />
Net cash flow on investing activities (6,530,758)<br />
CASH FLOW FROM FINANCING ACTIVITIES<br />
Receipt of sub-ordinated loan 2,000,000<br />
Repayments of principal of sub-ordinated loans (848)<br />
Payments in respect of lease obligations -<br />
Dividends paid (1,295,000)<br />
Net cash flow from / (used in) financing activities 704,152<br />
Exchange differences on translation of net investment on foreign branches 179,766<br />
Increase in cash and cash equivalents 17,250,023<br />
Cash and cash equivalents at beginning of the year as previously reported 46,791,886<br />
Effects of exchange rate changes on cash and cash equivalents (1,067,593)<br />
Cash and cash equivalents at beginning of the year as restated 45,724,293<br />
Cash and cash equivalents at end of the year 33 62,974,316<br />
The annexed notes 1 to 47 and annexures form an integral part of these financial statement<br />
Atif R. Bokhari Abdul Rauf Malik Sir Mohammed Anwar Pervez, OBE, HPk Nahayan Mabarak Al Nahaya<br />
President and Director Deputy Chairman Chairman<br />
Chief Executive Officer<br />
(9,203,902)<br />
289,905<br />
(925,175)<br />
21,706<br />
(9,817,466)<br />
500,000<br />
(808)<br />
(291)<br />
(777,000)<br />
(278,099)<br />
(880,273)<br />
5,457,467<br />
41,543,769<br />
(209,350)<br />
41,334,419<br />
46,791,886
STATEMENT OF CHANGES IN EQUITY FOR THE YEAR ENDED DECEMBER 31, 2006<br />
Share<br />
Capital<br />
Balance as at December 31, 2004 5,180,000<br />
Final dividend for the year ended December 31, 2004 -<br />
at Rs. 1.50 per share<br />
Changes in equity for 2005<br />
Profit after taxation for the year ended<br />
December 31, 2005 -<br />
Transfer from surplus on revaluation of fixed assets<br />
to unappropriated profit - net of tax -<br />
Exchange differences on translation of net investment<br />
in foreign branches -<br />
Net expense recognised directly in equity -<br />
Total recognised income and expense for the year -<br />
Transfer to statutory reserve -<br />
Balance as at December 31, 2005 5,180,000<br />
Final dividend for the year ended December 31, 2005 -<br />
at Rs. 2.50 per share<br />
Transfer to reserves for issue of bonus shares -<br />
Issue of bonus shares 1,295,000<br />
Changes in equity for 2006<br />
Profit after taxation for the year ended<br />
December 31, 2006 -<br />
Transfer from surplus on revaluation of fixed assets<br />
to unappropriated profit - net of tax -<br />
Exchange differences on translation of net investment<br />
in foreign branches -<br />
Net income recognised directly in equity -<br />
Total recognised income and expense for the year -<br />
Transfer to statutory reserve -<br />
Balance as at December 31, 2006 6,475,000<br />
----------Capital reserves----------<br />
Statutory<br />
Reserve<br />
3,945,781<br />
-<br />
-<br />
-<br />
-<br />
-<br />
-<br />
1,189,806<br />
5,135,587<br />
-<br />
-<br />
-<br />
-<br />
-<br />
-<br />
-<br />
-<br />
1,893,646<br />
7,029,233<br />
Exchange<br />
Translation<br />
Reserve<br />
1,970,147<br />
-<br />
-<br />
-<br />
(880,273)<br />
(880,273)<br />
(880,273)<br />
-<br />
1,089,874<br />
-<br />
-<br />
-<br />
-<br />
-<br />
179,766<br />
179,766<br />
179,766<br />
-<br />
1,269,640<br />
The annexed notes 1 to 47 and annexures form an integral part of these financial statements.<br />
Reserve for<br />
issue of<br />
bonus<br />
shares<br />
-<br />
-<br />
-<br />
-<br />
-<br />
-<br />
-<br />
-<br />
-<br />
1,295,000<br />
(1,295,000)<br />
-<br />
-<br />
-<br />
-<br />
-<br />
Unappropria<br />
ted Profit<br />
3,274,439<br />
(777,000)<br />
5,949,032<br />
94,148<br />
-<br />
94,148<br />
6,043,180<br />
(1,189,806)<br />
7,350,813<br />
(1,295,000)<br />
(1,295,000)<br />
9,468,232<br />
94,454<br />
-<br />
94,454<br />
9,562,686<br />
Total<br />
-----------------------------------------------(Rupees in '000)---------------------------------------------<br />
-<br />
-<br />
(1,893,646)<br />
12,429,853<br />
14,370,367<br />
(777,000)<br />
5,949,032<br />
94,148<br />
(880,273)<br />
(786,125)<br />
5,162,907<br />
-<br />
18,756,274<br />
(1,295,000)<br />
-<br />
-<br />
9,468,232<br />
94,454<br />
179,766<br />
274,220<br />
9,742,452<br />
-<br />
27,203,726<br />
Appropriations made by the directors subsequent to the year ended December 31, 2006 are disclosed in note 45 of these financial<br />
statements.<br />
Atif R. Bokhari Abdul Rauf Malik Sir Mohammed Anwar Pervez, OBE, HPk Nahayan Mabarak Al Nahayan<br />
President and Director Deputy Chairman Chairman<br />
Chief Executive Officer
NOTES TO THE FINANCIAL STATEMENTS FOR THE YEAR ENDED DECEMBER 31, 2006<br />
1. STATUS AND NATURE OF BUSINESS<br />
2. BASIS OF PRESENTATION<br />
3. STATEMENT OF COMPLIANCE<br />
3.1<br />
3.2<br />
<strong>United</strong> <strong>Bank</strong> <strong>Limited</strong> is a banking company incorporated in Pakistan and is engaged in commercial banking and<br />
related services. The bank is listed on all three Stock Exchanges in Pakistan. The bank's registered office and<br />
principal office is situated at State Life Building No. 1, I. I. Chundrigar Road, Karachi. The bank operates 1,044<br />
(2005: 1,043) branches inside Pakistan including the Karachi Export Processing Zone Branch (KEPZ) and 15 (2005:<br />
15) branches outside Pakistan. The domestic branch network includes one Islamic <strong>Bank</strong>ing Branch which has been<br />
opened in December 2006.<br />
In accordance with the directives of the Federal Government regarding the shifting of the banking system to Islamic<br />
modes, the State <strong>Bank</strong> of Pakistan has issued various circulars from time to time. Permissible forms of trade-related<br />
modes of financing include purchase of goods by banks from their customers and immediate resale to them at<br />
appropriate mark-up in price on deferred payment basis. The purchases and sales arising under these<br />
arrangements are not reflected in these financial statements as such but are restricted to the amount of facility<br />
actually utilized and the appropriate portion of mark-up thereon.<br />
These financial statements have been prepared in accordance with approved accounting standards as applicable in<br />
Pakistan and the requirements of the Companies Ordinance, 1984 and the <strong>Bank</strong>ing Companies Ordinance, 1962.<br />
Approved accounting standards comprise of such International <strong>Financial</strong> Reporting Standards as notified under the<br />
provisions of the Companies Ordinance, 1984. Wherever the requirements of the Companies Ordinance, 1984,<br />
<strong>Bank</strong>ing Companies Ordinance, 1962 or directives issued by the Securities and Exchange Commission of Pakistan<br />
and the State <strong>Bank</strong> of Pakistan differ with the requirements of these standards, the requirements of the Companies<br />
Ordinance, 1984, <strong>Bank</strong>ing Companies Ordinance, 1962 or the requirements of the said directives take precedence.<br />
The State <strong>Bank</strong> of Pakistan has deferred the applicability of International Accounting Standard (IAS) 39, '<strong>Financial</strong><br />
Instruments: Recognition and Measurement' and International Accounting Standard (IAS) 40, 'Investment Property'<br />
for <strong>Bank</strong>ing Companies through BSD Circular No. 10 dated August 26, 2002. Accordingly, the requirements of these<br />
standards have not been considered in the preparation of these financial statements. However, investments have<br />
been classified and valued in accordance with the requirements prescribed by the State <strong>Bank</strong> of Pakistan through<br />
various circulars.<br />
4. BASIS OF MEASUREMENT<br />
4.1 Accounting convention<br />
These financial statements have been prepared under the historical cost convention except that certain assets have<br />
been stated at revalued amounts, certain investments have been stated at fair value and derivative financial<br />
instruments are measured at fair value.<br />
4.2 Critical accounting estimates and judgements<br />
The preparation of financial statements in conformity with approved accounting standards requires management to<br />
make judgements, estimates and assumptions that effect the reported amounts of assets and liabilities and income<br />
and expenses. It also requires management to exercise judgement in application of its accounting policies. The<br />
estimates and associated assumptions are based on historical experience and various other factors that are<br />
believed to be reasonable under the circumstances. These estimates and assumptions are reviewed on an ongoing<br />
basis. Revisions to accounting estimates are recognized in the period in which the estimate is revised if the revision<br />
affects only that period, or in the period of revision and future periods if the revision affects both current and future<br />
periods.<br />
1
NOTES TO THE FINANCIAL STATEMENTS FOR THE YEAR ENDED DECEMBER 31, 2006<br />
Significant accounting estimates and areas where judgements were made by the management in the application of<br />
accounting policies are as follows:<br />
i) classification of investments (notes 5.3 and 9)<br />
ii) provision against investments (notes 5.3 and 9) and advances (notes 5.4 and 10.3)<br />
iii) income taxes (notes 5.7, 12, 19.2 and 31)<br />
iv) staff retirement benefits (note 35)<br />
v) fair value of derivatives (note 19.4)<br />
5. SUMMARY OF SIGNIFICANT ACCOUNTING POLICIES<br />
5.1 Cash and cash equivalents<br />
Cash and cash equivalents for the purpose of cash flow statement represent cash and balances with treasury banks<br />
and balances with other banks in current and deposit accounts.<br />
5.2 Lendings to / borrowings from financial institutions<br />
The <strong>Bank</strong> enters into transactions of repos and reverse repos at contracted rates for a specified period of time.<br />
These are recorded as under:<br />
(a) Sale under repurchase agreements<br />
Securities sold subject to a re-purchase agreement (repo) are retained in the financial statements as investments<br />
and the counter party liability is included in borrowings from financial institutions. The differential in sale and repurchase<br />
value is accrued over the period of the agreement and recorded as an expense.<br />
(b) Purchase under resale agreements<br />
Securities purchased under agreement to resell (reverse repo) are included in lendings to financial institutions. The<br />
differential between the contracted price and resale price is amortized over the period of the agreement and<br />
recorded as income.<br />
Securities borrowed are not recognized in the financial statements, unless these are sold to third parties, in which<br />
case the obligation to return them is recorded at fair value as a trading liability under borrowings from financial<br />
institutions.<br />
5.3 Investments<br />
The <strong>Bank</strong> classifies its investments as follows:<br />
(a) Held for trading<br />
These are securities, which are either acquired for generating a profit from short-term fluctuations in market prices,<br />
interest rate movements, dealers margin or are securities included in a portfolio in which a pattern of short-term<br />
profit taking exists.<br />
(b) Held to maturity<br />
These are securities with fixed or determinable payments and fixed maturity in respect of which the <strong>Bank</strong> has the<br />
positive intent and ability to hold to maturity.<br />
(c) Available for sale<br />
These are investments, other than those in subsidiaries and associates, that do not fall under the held for trading or<br />
held to maturity categories.<br />
2
NOTES TO THE FINANCIAL STATEMENTS FOR THE YEAR ENDED DECEMBER 31, 2006<br />
Investments other than those categorised as held for trading are initially recognised at fair value which includes<br />
transaction costs associated with the investment. Investments classified as held for trading are initially recognised at<br />
fair value, and transaction costs are expensed in the profit and loss account.<br />
All purchases and sales of investments that require delivery within the time frame established by regulations or<br />
market convention are recognised at the trade date. Trade date is the date on which the bank commits to purchase<br />
or sell the investment.<br />
In accordance with the requirements of State <strong>Bank</strong> of Pakistan, quoted securities other than those classified as 'held<br />
to maturity', investments in subsidiaries and investments in associates (which qualify for accounting under<br />
International Accounting Standard - 28), are subsequently re-measured to market value. Surplus / (deficit) arising on<br />
revaluation of quoted securities classified as 'available for sale', is taken to a separate account shown in the balance<br />
sheet below equity. Surplus / (deficit) arising on revaluation of quoted securities which are classified as 'held for<br />
trading', is taken to the profit and loss account.<br />
Unquoted equity securities excluding investments in subsidiaries and associates are valued at the lower of cost and<br />
break-up value. Break-up value of equity securities is calculated with reference to the net assets of the investee<br />
company as per the latest available audited financial statements. Investments classified as 'held to maturity' are<br />
carried at amortized cost. Investments in subsidiaries and associates (which qualify for accounting under<br />
International Accounting Standard - 28) are carried at cost.<br />
Provision for diminution in the values of securities (except debentures, participation term certificates and term<br />
finance certificates) is made after considering impairment, if any, in their value. Provision for diminution in value of<br />
debentures, participation term certificates and term finance certificates is made as per the requirements of the<br />
Prudential Regulations issued by the State <strong>Bank</strong> of Pakistan.<br />
Profit and loss on sale of investments is included in income currently.<br />
5.4 Advances<br />
Advances are stated net of specific and general provisions. Specific provision against domestic advances (other<br />
than the <strong>Bank</strong>'s consumer financing portfolio comprising of auto loans, personal loans and cash line) is determined<br />
on the basis of Prudential Regulations and other directives issued by the State <strong>Bank</strong> of Pakistan and charged to<br />
the profit and loss account. Specific provision against the <strong>Bank</strong>'s domestic consumer financing portfolio comprising<br />
of auto loans, personal loans and cash line is determined keeping in view the <strong>Bank</strong>'s internal guidelines subject to<br />
the minimum requirements set out by the Prudential Regulations issued by the State <strong>Bank</strong> of Pakistan. General<br />
provision against consumer loans is made in accordance with the requirements of the Prudential Regulations issued<br />
by the State <strong>Bank</strong> of Pakistan. General and specific provisions pertaining to overseas advances are made in<br />
accordance with the requirements of monetary agencies and regulatory authorities of the respective countries.<br />
Advances are written off when there is no realistic prospect of recovery.<br />
5.5 Fixed assets and depreciation<br />
Owned<br />
Property and equipment, other than freehold land which is not depreciated and capital work-in-progress, are stated<br />
at cost or revalued amount less accumulated depreciation and accumulated impairment losses (if any). Freehold<br />
land is carried at revalued amount less impairment losses while capital work-in-progress is stated at cost less<br />
impairment losses. Cost of property and equipment of foreign branches includes exchange difference arising on<br />
currency translation at the year-end rates of exchange.<br />
Depreciation is calculated so as to write off the depreciable amount of the assets over their expected economic lives<br />
at the rates specified in note 11.2 to these financial statements. The depreciation charge for the year is calculated<br />
after taking into account residual value, if any, and using methods depending on the nature of the asset and the<br />
country of its location. The residual values, useful lives and depreciation methods are reviewed and adjusted, if<br />
appropriate, at each balance sheet date.<br />
3
NOTES TO THE FINANCIAL STATEMENTS FOR THE YEAR ENDED DECEMBER 31, 2006<br />
Depreciation on additions is charged from the month the asset is available for use and on disposals upto the month<br />
of disposal.<br />
Land and buildings are revalued by professionally qualified valuers with sufficient regularity to ensure that the net<br />
carrying amount does not differ materially from their fair value.<br />
Surplus arising on revaluation is credited to the surplus on revaluation of fixed assets account. Deficit arising on<br />
subsequent revaluation of fixed assets is adjusted against the balance in the above-mentioned surplus account as<br />
allowed under the provisions of the Companies Ordinance, 1984. The surplus on revaluation of fixed assets to the<br />
extent of incremental depreciation charged on the related assets is transferred to unappropriated profit.<br />
Gains and losses on sale of fixed assets are included in income currently, except that the related surplus on<br />
revaluation of fixed assets (net of deferred taxation) is transferred directly to unappropriated profit.<br />
Major renewals and improvements are capitalized and the assets so replaced, if any, are retired. Normal repairs and<br />
maintenance are charged to the profit and loss account as and when incurred.<br />
Leased<br />
Assets held under finance lease are stated at lower of their fair value or present value of minimum lease payments<br />
at inception less accumulated depreciation. The outstanding obligations under the lease agreements are shown as<br />
a liability net of finance charges allocable to future periods.<br />
The finance charges are allocated to accounting periods in a manner so as to provide a constant periodic rate of<br />
return on the outstanding liability.<br />
Depreciation on assets held under finance lease is charged in a manner consistent with that for depreciable assets<br />
which are owned by the <strong>Bank</strong>.<br />
Intangible assets<br />
Intangible assets having a finite useful life are stated at cost less accumulated amortization and accumulated<br />
impairment losses, if any. Intangible assets are amortized from the month, when these assets are available for use,<br />
using the straight line method, whereby the cost of the intangible asset is amortized on the basis of the estimated<br />
useful life over which economic benefits are expected to flow to the <strong>Bank</strong>. The residual value, useful life and<br />
amortization method is reviewed and adjusted, if appropriate, at each balance sheet date.<br />
Intangible assets having an indefinite useful life are stated at acquisition cost. Provisions are made for permanent<br />
diminution in the value of assets, if any. Gains and losses on disposals, if any, are taken to the profit and loss<br />
account.<br />
5.6 Impairment<br />
The carrying amount of assets are reviewed at each balance sheet date for impairment whenever events or changes<br />
in circumstances indicate that the carrying amounts of the assets may not be recoverable. If such indication exists,<br />
and where the carrying value exceeds the estimated recoverable amount, assets are written down to their<br />
recoverable amount. The resulting impairment loss is taken to the profit and loss account except for impairment loss<br />
on revalued assets, which is adjusted against the related revaluation surplus to the extent that the impairment loss<br />
does not exceed the surplus on revaluation of that asset.<br />
5.7 Taxation<br />
Current<br />
Provision for current taxation is based on taxable income for the year determined in accordance with the prevailing<br />
laws for taxation on income earned from local as well as foreign operations, as applicable to the respective<br />
jurisdictions. The charge for the current tax is calculated using prevailing tax rates or tax rates expected to apply to<br />
the profits for the year at enacted rates. The charge for the current tax also includes adjustments, where considered<br />
necessary relating to prior years, arising from assessments made during the year.<br />
4
NOTES TO THE FINANCIAL STATEMENTS FOR THE YEAR ENDED DECEMBER 31, 2006<br />
Deferred<br />
Deferred tax is recognized using the balance sheet liability method on all major temporary differences between the<br />
amounts attributed to assets and liabilities for financial reporting purposes and amounts used for taxation purposes.<br />
In addition, the <strong>Bank</strong> also records deferred tax asset on available tax losses. Deferred tax is calculated at the rates<br />
that are expected to apply to the period when the differences are expected to reverse, based on tax rates that have<br />
been enacted or substantively enacted by the balance sheet date.<br />
Deferred tax assets are recognized only to the extent that it is probable that future taxable profits will be available<br />
against which the assets can be utilized.<br />
The carrying amount of deferred tax asset is reviewed at each balance sheet date and reduced to the extent that it is<br />
no longer probable that sufficient taxable profits will be available to allow all or part of the deferred tax asset to be<br />
utilized.<br />
The <strong>Bank</strong> also recognizes deferred tax asset / liability on deficit / surplus on revaluation of fixed assets and<br />
securities which is adjusted against the related deficit / surplus in accordance with the requirements of the revised<br />
International Accounting Standard (IAS) 12 dealing with Income Taxes.<br />
5.8 Provisions<br />
Provisions are recognized when the <strong>Bank</strong> has a legal or constructive obligation as a result of past events, it is<br />
probable that an outflow of resources will be required to settle the obligation and a reliable estimate of the amount<br />
can be made. Provisions are reviewed at each balance sheet date and are adjusted to reflect the current best<br />
estimate.<br />
5.9 Staff retirement and other benefits<br />
5.9.1 Staff retirement benefit schemes<br />
a) The <strong>Bank</strong> operates the following staff retirement schemes for its employees<br />
- approved funded pension scheme, introduced in 1986 (defined benefit scheme); and<br />
- approved non-contributory provident fund in lieu of the contributory provident fund.<br />
b) For new employees and for those who opted for the new scheme introduced in 1991, the <strong>Bank</strong> operates<br />
- approved contributory provident fund (defined contribution scheme); and<br />
- approved gratuity scheme (defined benefit scheme).<br />
In the year 2001, the <strong>Bank</strong> modified the pension scheme and introduced a conversion option for employees covered<br />
under option (a) above to option (b). This conversion option ceased on December 31, 2003.<br />
The <strong>Bank</strong> also operates a contributory benevolent fund for all its employees (defined benefit scheme).<br />
Annual contributions towards the defined benefit schemes are made on the basis of actuarial advice using the<br />
Projected Unit Credit Method.<br />
For defined contribution plans, the bank pays contributions to the Fund on a periodic basis. The bank has no further<br />
payment obligation once the contributions have been paid. The contributions are recognised as employee benefit<br />
expense when they are due. Prepaid contributions are recognised as an asset to the extent that a cash refund or a<br />
reduction on the future payments is available.<br />
5
NOTES TO THE FINANCIAL STATEMENTS FOR THE YEAR ENDED DECEMBER 31, 2006<br />
5.9.2 Other benefits<br />
a) Employees' compensated absences<br />
The <strong>Bank</strong> makes provisions for compensated vested and non-vested absences accumulated by its employees on<br />
the basis of actuarial advice under the Projected Unit Credit Method.<br />
b) Post retirement medical benefits (defined benefit scheme)<br />
The bank provides post retirement medical benefits to eligible retired employees. Provision is made annually to<br />
meet the cost of such medical benefit on the basis of actuarial advice under the Projected Unit Credit Method.<br />
5.9.3 Actuarial gains and losses<br />
Actuarial gains and losses arising from experience adjustments and changes in actuarial assumptions in excess of<br />
the greater of 10% of the value of the plan assets or 10% of the defined benefit obligation at the end of the last<br />
reporting year are charged or credited to income over the employees' expected average remaining working lives.<br />
These limits are calculated and applied separately for each defined benefit plan.<br />
Actuarial gains and losses pertaining to long term compensated absences are recognised immediately.<br />
5.10 Borrowings / deposits and their cost<br />
a) Borrowings / deposits are recorded at the proceeds received.<br />
b) Borrowing / deposits costs are recognised as an expense in the period in which these are incurred using<br />
effective mark-up / interest rate method.<br />
5.11 Revenue Recognition<br />
Mark-up / return on performing advances and investments is recognized on a time proportion basis over the term of<br />
loans and advances. Where debt securities are purchased at premium or discount, those premiums / discounts are<br />
amortized through the profit and loss account over the remaining period of maturity.<br />
Interest or mark-up recoverable on non-performing advances and classified investments is recognized on receipt<br />
basis. Interest / return / mark-up on rescheduled / restructured loans and advances and investments is recognized<br />
as permitted by the regulations of the State <strong>Bank</strong> of Pakistan or overseas regulatory authorities of countries where<br />
the branches operate, except where in the opinion of the management, it would not be prudent to do so.<br />
Dividend income is recognized when the right to receive the dividend is established.<br />
Fee, brokerage and commission on letters of credit / guarantee and others are recognized on accrual basis.<br />
5.12 Derivative financial instruments<br />
Derivative financial instruments are initially recognized at fair value on the date on which the derivative contract is<br />
entered into and are subsequently re-measured at fair value using appropriate valuation techniques. All derivative<br />
financial instruments are carried as assets when fair value is positive and liabilities when fair value is negative. Any<br />
change in the fair value of derivative financial instruments is taken to the profit and loss account.<br />
5.13 Foreign Currencies<br />
a) Functional and presentation currency<br />
Items included in the financial statements are measured using the currency of the primary economic environment in<br />
which the bank operates. The financial statements are presented in Pakistani Rupees, which is the bank's functional<br />
and presentation currency.<br />
6
NOTES TO THE FINANCIAL STATEMENTS FOR THE YEAR ENDED DECEMBER 31, 2006<br />
b) Foreign currency transactions<br />
Transactions in foreign currencies are translated to rupees at the foreign exchange rates ruling on the transaction<br />
date. Monetary assets and liabilities in foreign currencies are expressed in rupee terms at the rates of exchange<br />
ruling on the balance sheet date except that certain deposits, which are covered by forward foreign exchange<br />
contracts, are translated at contracted rates. Forward foreign exchange contracts and foreign bills purchased are<br />
valued at forward rates applicable to their respective maturities.<br />
c) Foreign operations<br />
The assets and liabilities of foreign operations are translated to rupees at exchange rates prevailing at the balance<br />
sheet date. The results of foreign operations are translated at the average rate of exchange for the year.<br />
d) Translation gains and losses<br />
Translation gains and losses are included in the profit and loss account, except those arising on the translation of<br />
net investment in foreign branches which are taken to capital reserve (Exchange Translation Reserve).<br />
e) Commitments<br />
Commitments for outstanding forward foreign exchange contracts are disclosed in the financial statements at<br />
contracted rates. Contingent liabilities / commitments for letters of credit and letters of guarantee denominated in<br />
foreign currencies are expressed in rupee terms at the rates of exchange ruling on the date of transaction.<br />
5.14 Segment Reporting<br />
A segment is a distinguishable component of the <strong>Bank</strong> that is engaged either in providing product or services<br />
(business segment), or in providing products or services within a particular economic environment (geographical<br />
segment), which is subject to risks and rewards that are different from those of other segments.<br />
Business segments<br />
Corporate finance<br />
Corporate banking includes, services provided in connection with mergers and acquisition, underwriting,<br />
privatization, securitization, research, debts (government, high yield), equity, syndication, IPO and secondary private<br />
placements.<br />
Trading and sales<br />
It includes fixed income, equity, foreign exchanges, commodities, credit, funding, own position securities, lending<br />
and repos, brokerage debt and prime brokerage.<br />
Retail <strong>Bank</strong>ing<br />
It includes retail lending and deposits, banking services, trust and estates, private lending and deposits, banking<br />
service, trust and estates investment advice, merchant / commercial / corporate cards and private labels and retail.<br />
Commercial banking<br />
Commercial banking includes project finance, real estate, export finance, trade finance, factoring, leasing, lending,<br />
guarantees, bills of exchange and deposits.<br />
7
NOTES TO THE FINANCIAL STATEMENTS FOR THE YEAR ENDED DECEMBER 31, 2006<br />
Geographical segments<br />
The <strong>Bank</strong> operates in three geographical regions being:<br />
- Pakistan (including Karachi Export Processing Zone)<br />
- <strong>United</strong> States of America<br />
- Middle East<br />
5.15 Dividend and appropriation to reserves<br />
5.16 Off setting<br />
5.17 Earnings per share<br />
6. CASH AND BALANCES WITH TREASURY BANKS<br />
6.1<br />
6.2<br />
Dividend and appropriation to reserves, except appropriation which are required by the law after the balance sheet<br />
date, are recognised as liability in the <strong>Bank</strong>s' financial statements in the year in which these are approved.<br />
<strong>Financial</strong> assets and financial liabilities are set off and the net amount is reported in the financial statements when<br />
there is a legally enforceable right to set off and the <strong>Bank</strong> intends to either settle on a net basis, or to realize the<br />
assets and to settle the liabilities simultaneously.<br />
The <strong>Bank</strong> presents basic and diluted earnings per share (EPS) for its shareholders. Basic EPS is calculated by<br />
dividing the profit or loss attributable to ordinary shareholders of the <strong>Bank</strong> by the weighted average number of<br />
ordinary shares outstanding during the period / year. Diluted EPS is determined by adjusting the profit or loss<br />
attributable to ordinary shareholders and the weighted average number of ordinary shares outstanding for the<br />
effects of all dilutive potential ordinary shares, if any.<br />
Note 2006 2005<br />
(Rupees in '000)<br />
In hand<br />
Local currency 5,041,667<br />
Foreign currency<br />
With State <strong>Bank</strong> of Pakistan in<br />
1,691,757<br />
6,733,424<br />
Local currency current account 6.1 17,840,637<br />
Local currency deposit account 3,864<br />
Foreign currency current account 6.2 77,487<br />
Foreign currency deposit account 6.3 2,841,756<br />
20,763,744<br />
With other central banks in foreign currency current account 6.4 18,388,635<br />
With National <strong>Bank</strong> of Pakistan in local currency current account 2,994,861<br />
National Prize Bonds 59,176<br />
48,939,840<br />
4,606,016<br />
1,107,634<br />
5,713,650<br />
13,032,322<br />
3,864<br />
12,107<br />
2,556,535<br />
15,604,828<br />
9,142,105<br />
3,571,650<br />
42,553<br />
34,074,786<br />
The local currency current account is maintained with the State <strong>Bank</strong> of Pakistan (SBP) as per the requirements of<br />
Section 36 of the State <strong>Bank</strong> of Pakistan Act, 1956. This section requires banking companies to maintain a local<br />
currency cash reserve in current account opened with the SBP at a sum not less than such percentage of its time<br />
and demand liabilities in Pakistan as may be prescribed by SBP.<br />
This represents US Dollar Settlement Account maintained with SBP.<br />
8
NOTES TO THE FINANCIAL STATEMENTS FOR THE YEAR ENDED DECEMBER 31, 2006<br />
6.3<br />
6.4<br />
7. BALANCES WITH OTHER BANKS<br />
Note 2006 2005<br />
(Rupees in '000)<br />
Inside Pakistan<br />
In current accounts 5,935<br />
In deposit accounts<br />
Outside Pakistan<br />
48,000<br />
53,935<br />
In current accounts 895,782<br />
In deposit accounts 7.1 13,084,759<br />
13,980,541<br />
14,034,476<br />
7.1 These carry mark-up at rates ranging from 5.07% to 5.28% (2005: 4.40% to 4.45%) per annum.<br />
8. LENDINGS TO FINANCIAL INSTITUTIONS<br />
9,454<br />
-<br />
9,454<br />
4,850,101<br />
7,857,545<br />
12,707,646<br />
12,717,100<br />
Note 2006 2005<br />
(Rupees in '000)<br />
Call money lendings 8.2 447,360<br />
Repurchase agreement lendings 8.3 21,950,095<br />
Lendings to banks / financial institutions 8.4 7,174,615<br />
29,572,070<br />
8.1 Particulars of lendings to financial institutions<br />
8.2<br />
This represents foreign currency cash reserve maintained with SBP equivalent to atleast 20% of the <strong>Bank</strong>'s foreign<br />
currency deposits. The foreign currency cash reserve comprises of an amount equivalent to atleast 5% of the bank's<br />
foreign currency deposits which is kept in a non-remunerative account. The balance reserve equivalent to atleast<br />
15% of the bank's foreign currency deposits is maintained in a remunerative account on which the <strong>Bank</strong> is entitled to<br />
earn a return which is declared by SBP on a monthly basis.<br />
Deposits with other central banks are maintained to meet the minimum cash reserves and capital requirements<br />
pertaining to the foreign branches of the <strong>Bank</strong>.<br />
In local currency 25,981,155<br />
In foreign currencies 3,590,915<br />
29,572,070<br />
8.3 Securities held as collateral against repurchase agreement lendings<br />
Market Treasury Bills 15,504,830<br />
Pakistan Investment Bonds 4,334,500<br />
19,839,330<br />
1,199,534<br />
11,769,693<br />
4,898,325<br />
17,867,552<br />
17,068,392<br />
799,160<br />
17,867,552<br />
These call money lendings carry mark-up at rates ranging from 6.70% to 10.35% per annum (2005: 1.0% to 12.75%<br />
per annum) and are due to mature latest by January 2007.<br />
2006<br />
2005<br />
Further<br />
Further<br />
Held by<br />
<strong>Bank</strong><br />
given as<br />
collateral /<br />
Total<br />
Held by<br />
<strong>Bank</strong><br />
given as<br />
collateral /<br />
Total<br />
sold<br />
sold<br />
------------------------------------------------(Rupees in '000)------------------------------------------------<br />
920,265<br />
1,190,500<br />
2,110,765<br />
9<br />
16,425,095<br />
5,525,000<br />
21,950,095<br />
8,019,693<br />
2,180,000<br />
10,199,693<br />
-<br />
1,570,000<br />
1,570,000<br />
8,019,693<br />
3,750,000<br />
11,769,693
NOTES TO THE FINANCIAL STATEMENTS FOR THE YEAR ENDED DECEMBER 31, 2006<br />
8.4<br />
These carry mark-up at rates ranging from 7.99% to 9.40% per annum (2005: 3.5% to 8.75% per annum) and are<br />
due to mature latest by March 2007.<br />
These carry mark-up at rates ranging from 5.45% to 12.63% per annum and are due to mature latest by March<br />
2011.<br />
9. INVESTMENTS<br />
9.1 Investments by types<br />
2006 2005<br />
Note<br />
Held by <strong>Bank</strong><br />
Given as<br />
collateral<br />
Total Held by <strong>Bank</strong><br />
Given as<br />
collateral<br />
Total<br />
--------------------------------------------------(Rupees in '000)------------------------------------------------<br />
Held for trading securities<br />
Market Treasury Bills 46,438<br />
- 46,438 600,734 460,807 1,061,541<br />
Ordinary shares of listed companies 91,007<br />
- 91,007 453,033<br />
- 453,033<br />
Available for sale securities<br />
137,445<br />
- 137,445 1,053,767 460,807 1,514,574<br />
Market Treasury Bills 15,304,284 16,743,707 32,047,991 16,004,567 3,898,511 19,903,078<br />
Ordinary shares of listed companies 2,403,691<br />
- 2,403,691 1,675,518<br />
- 1,675,518<br />
Pakistan Investment Bonds 3,157,602<br />
- 3,157,602 1,317,980 205,469 1,523,449<br />
Government of Pakistan Islamic Bonds 694,271<br />
- 694,271 833,386<br />
- 833,386<br />
Term Finance Certificates 693,116<br />
- 693,116 749,170<br />
- 749,170<br />
Foreign currency bonds 1,705,045<br />
- 1,705,045 593,782<br />
- 593,782<br />
Ordinary shares of unlisted companies 9.7 497,288<br />
- 497,288 432,680<br />
- 432,680<br />
Euro Bonds 1,247,217<br />
- 1,247,217 279,575<br />
- 279,575<br />
Units of mutual funds 1,222,338<br />
- 1,222,338 550,000<br />
- 550,000<br />
Held to maturity securities<br />
26,924,852 16,743,707 43,668,559 22,436,658 4,103,980 26,540,638<br />
Term Finance Certificates 8,134,206<br />
- 8,134,206 8,661,187<br />
- 8,661,187<br />
Market Treasury Bills 1,205,603<br />
- 1,205,603 4,830,400 3,595,482 8,425,882<br />
Pakistan Investment Bonds 4,691,273<br />
- 4,691,273 5,331,699 335,502 5,667,201<br />
CIRC Bonds 2,900,000<br />
- 2,900,000 4,054,883<br />
- 4,054,883<br />
Government of Pakistan - Guaranteed Bonds 2,410,415<br />
- 2,410,415 4,039,971<br />
- 4,039,971<br />
Foreign currency bonds 1,382,986<br />
- 1,382,986 1,694,788<br />
- 1,694,788<br />
Foreign securities 639,064<br />
- 639,064 492,795<br />
- 492,795<br />
Debentures 11,289<br />
- 11,289 169,351<br />
- 169,351<br />
Participation Term Certificates 55,169<br />
- 55,169 70,087<br />
- 70,087<br />
CDC SAARC Fund 505<br />
-<br />
505 65,501<br />
- 65,501<br />
Federal Investment Bonds 13,906<br />
- 13,906 32,725<br />
- 32,725<br />
Provincial Government Securities -<br />
-<br />
-<br />
1,207<br />
-<br />
1,207<br />
Associates<br />
21,444,416<br />
- 21,444,416 29,444,594 3,930,984 33,375,578<br />
<strong>United</strong> Growth and Income Fund -<br />
-<br />
- 250,000<br />
- 250,000<br />
<strong>United</strong> Stock Advantage Fund 250,000<br />
250,000<br />
-<br />
-<br />
-<br />
<strong>United</strong> Islamic Composite Fund 250,000<br />
250,000<br />
-<br />
-<br />
-<br />
<strong>UBL</strong> Insurers <strong>Limited</strong> 90,000<br />
90,000<br />
-<br />
-<br />
-<br />
Oman <strong>United</strong> Exchange Company, Muscat 6,981<br />
-<br />
6,981 6,981<br />
-<br />
6,981<br />
Subsidiaries<br />
596,981<br />
- 596,981 256,981<br />
- 256,981<br />
<strong>United</strong> National <strong>Bank</strong>, UK 1,482,011<br />
- 1,482,011 1,482,011<br />
- 1,482,011<br />
<strong>United</strong> <strong>Bank</strong> AG Zurich, Switzerland<br />
Domestic subsidiaries<br />
86,237<br />
- 86,237 86,237<br />
- 86,237<br />
<strong>United</strong> Executors and Trustees Company <strong>Limited</strong> 30,100<br />
- 30,100 30,100<br />
- 30,100<br />
<strong>United</strong> <strong>Bank</strong> <strong>Financial</strong> Services (Pvt) <strong>Limited</strong> 2,500<br />
-<br />
2,500 2,500<br />
-<br />
2,500<br />
<strong>UBL</strong> Fund Managers <strong>Limited</strong> 60,000<br />
- 60,000 60,000<br />
- 60,000<br />
1,660,848<br />
- 1,660,848 1,660,848<br />
- 1,660,848<br />
50,764,542 16,743,707 67,508,249 54,852,848 8,495,771 63,348,619<br />
Provision for diminution in value of investments 9.3 (400,639) - (400,639) (634,003) - (634,003)<br />
Investments (net of provisions) 50,363,903 16,743,707 67,107,610 54,218,845 8,495,771 62,714,616<br />
Surplus / (deficit) on revaluation of available for sale<br />
securities<br />
Surplus/ (deficit) on revaluation of held for trading<br />
21.2 163,003<br />
securities 9.4 (3,335)<br />
Total investments at market value 50,523,571<br />
10<br />
(6,940)<br />
-<br />
16,736,767<br />
156,063<br />
(3,335)<br />
67,260,338<br />
312,372<br />
(1,070)<br />
54,530,147<br />
736<br />
290<br />
8,496,797<br />
313,108<br />
(780)<br />
63,026,944
NOTES TO THE FINANCIAL STATEMENTS FOR THE YEAR ENDED DECEMBER 31, 2006<br />
9.2 Investments by segments<br />
Federal Government Securities<br />
Note 2006 2005<br />
(Rupees in '000)<br />
Market Treasury Bills 32,594,095<br />
Pakistan Investment Bonds 7,848,875<br />
Foreign currency bonds 1,382,986<br />
Government of Pakistan Islamic Bonds 694,271<br />
Government of Pakistan - US Dollar / Euro Bonds 1,247,217<br />
Federal Investment Bonds 13,906<br />
43,781,350<br />
Provincial Government Securities -<br />
Overseas Governments' Securities<br />
Foreign securities 2,344,109<br />
Market Treasury Bills 705,937<br />
3,050,046<br />
Other Overseas Securities<br />
Foreign securities -<br />
CDC SAARC Fund 505<br />
505<br />
Fully Paid-up Ordinary Shares<br />
Listed companies 2,494,698<br />
Unlisted companies 9.7 497,288<br />
2,991,986<br />
Units of Mutual Funds 1,222,338<br />
Term Finance Certificates, Debentures, Bonds and<br />
Participation Term Certificates<br />
Term Finance Certificates<br />
Unlisted 7,629,656<br />
Listed 1,197,666<br />
8,827,322<br />
Bonds 5,310,415<br />
Debentures 11,289<br />
Participation Term Certificates 55,169<br />
14,204,195<br />
Investments in subsidiaries and associates 2,257,829<br />
Total investments at cost 67,508,249<br />
Provision for diminution in value of investments 9.3 (400,639)<br />
Investments (net of provisions) 67,107,610<br />
Surplus on revaluation of available for sale securities 21.2 156,063<br />
Deficit on revaluation of held for trading securities 9.4 (3,335)<br />
Total investments at market value 67,260,338<br />
11<br />
29,193,297<br />
7,190,650<br />
1,694,788<br />
833,386<br />
279,575<br />
32,725<br />
39,224,421<br />
1,207<br />
924,001<br />
197,204<br />
1,121,205<br />
162,576<br />
65,501<br />
228,077<br />
2,128,551<br />
432,680<br />
2,561,231<br />
550,000<br />
8,332,720<br />
1,077,637<br />
9,410,357<br />
8,094,854<br />
169,351<br />
70,087<br />
17,744,649<br />
1,917,829<br />
63,348,619<br />
(634,003)<br />
62,714,616<br />
313,108<br />
(780)<br />
63,026,944
NOTES TO THE FINANCIAL STATEMENTS FOR THE YEAR ENDED DECEMBER 31, 2006<br />
9.3 Particulars of provision for diminution in value of investments:<br />
9.3.1 Opening balance 634,003<br />
Charged during the year 81,968<br />
Reversed during the year (7,395)<br />
74,573<br />
Transfers (30,164)<br />
Written off during the year (277,773)<br />
Closing balance 400,639<br />
9.3.2 Particulars of provision for diminution in value of investments by type<br />
Available for sale securities<br />
Ordinary shares of listed companies 33,000<br />
Ordinary shares of unlisted companies 123,217<br />
156,217<br />
Held to maturity securities<br />
Term Finance Certificates 177,964<br />
Debentures 11,289<br />
Participation Term Certificates 55,169<br />
244,422<br />
400,639<br />
9.3.3 Particulars of provision for diminution in value of investments by segment<br />
Fully Paid-up Ordinary Shares<br />
Listed companies 33,000<br />
Unlisted companies 123,217<br />
156,217<br />
Term Finance Certificates, Debentures, Bonds and<br />
Participation Term Certificates<br />
Term Finance Certificates 177,964<br />
Debentures 11,289<br />
Participation Term Certificates 55,169<br />
244,422<br />
400,639<br />
9.4 Unrealized gain/ (loss) on revaluation of held for trading securities<br />
9.5<br />
9.6<br />
9.7<br />
Market Treasury Bills (12)<br />
Ordinary shares of listed companies (3,323)<br />
(3,335)<br />
2006 2005<br />
(Rupees in '000)<br />
540,402<br />
112,666<br />
-<br />
112,666<br />
4,355<br />
(23,420)<br />
634,003<br />
33,000<br />
73,913<br />
106,913<br />
286,272<br />
170,090<br />
70,728<br />
527,090<br />
634,003<br />
33,000<br />
73,913<br />
106,913<br />
286,272<br />
170,090<br />
70,728<br />
527,090<br />
634,003<br />
(1,914)<br />
1,134<br />
(780)<br />
Investments include certain approved / government securities which are held by the <strong>Bank</strong> to comply with the<br />
Statutory Liquidity Requirement determined on the basis of the <strong>Bank</strong>'s demand and time liabilities as set out under<br />
section 29 of the <strong>Bank</strong>ing Companies Ordinance, 1962.<br />
Investments include Rs. 282 million (2005: Rs. 282 million) held by the State <strong>Bank</strong> of Pakistan and National <strong>Bank</strong> of<br />
Pakistan as pledge against demand loan, TT / DD discounting facilities and foreign exchange exposure limit<br />
sanctioned to the <strong>Bank</strong> and Rs. 5 million (2005: Rs. 5 million) held by the Controller of Military Accounts (CMA)<br />
under Regimental Fund Arrangements.<br />
This includes the <strong>Bank</strong>'s subscription towards the paid-up capital of Khushhali <strong>Bank</strong> <strong>Limited</strong> amounting to<br />
Rs. 200 million (2005: Rs. 200 million). Pursuant to Section 10 of the Khushhali <strong>Bank</strong> Ordinance, 2000 strategic<br />
investors including the <strong>Bank</strong> cannot sell or transfer their investment before a period of five years that has expired in<br />
October 2005, from the date of subscription. Thereafter, such sale/ transfer would be subject to the prior approval of<br />
SBP. In addition, profit, if any, and other income of Khushhali <strong>Bank</strong> <strong>Limited</strong>, shall not be used to pay any dividend to<br />
the members, and shall be utilized to promote the objectives of Khushhali <strong>Bank</strong> <strong>Limited</strong>.<br />
12
NOTES TO THE FINANCIAL STATEMENTS FOR THE YEAR ENDED DECEMBER 31, 2006<br />
9.8<br />
Information relating to investments in ordinary and preference shares / certificates of listed and unlisted companies/<br />
modarabas/ mutual funds, term finance certificates, debentures and bonds, required to be disclosed as part of the<br />
financial statements under State <strong>Bank</strong> of Pakistan's BSD Circular No. 4 dated February 17, 2006, is given in<br />
Annexure 'A'. Details in respect of quality of available for sale securities are also disclosed in Annexure 'A' to these<br />
financial statements.<br />
10. ADVANCES<br />
Loans, cash credits, running finances, etc.<br />
In Pakistan 200,080,279<br />
Outside Pakistan 33,369,281<br />
233,449,560<br />
Bills discounted and purchased<br />
(excluding government treasury bills)<br />
Payable in Pakistan 5,661,421<br />
Payable outside Pakistan 4,080,845<br />
9,742,266<br />
243,191,826<br />
Financing in respect of continuous<br />
funding system (CFS) 1,462,242<br />
Advances - gross 244,654,068<br />
Provision against advances<br />
- Specific -<br />
- General 10.3 (1,416,249)<br />
(1,416,249)<br />
Advances - net of provision 243,237,819<br />
10.1 Particulars of advances - gross<br />
10.1.1 In local currency 202,945,510<br />
In foreign currencies 41,708,558<br />
244,654,068<br />
10.1.2 Short term 153,182,946<br />
Long term 91,471,122<br />
244,654,068<br />
10.1.3 Non-performing advances include<br />
a)<br />
Note<br />
Performing Non-performing<br />
2006 2005 2006 2005<br />
--------------------------------- (Rupees in '000) ---------------------------------<br />
169,599,106<br />
21,867,208<br />
191,466,314<br />
2,686,883<br />
7,067,883<br />
9,754,766<br />
201,221,080<br />
1,094,002<br />
202,315,082<br />
-<br />
(1,162,987)<br />
(1,162,987)<br />
201,152,095<br />
173,843,558<br />
28,471,524<br />
202,315,082<br />
9,273,198<br />
4,771,131<br />
14,044,329<br />
876,300<br />
1,334,780<br />
2,211,080<br />
16,255,409<br />
-<br />
16,255,409<br />
(12,183,335)<br />
-<br />
(12,183,335)<br />
4,072,074<br />
11,467,278<br />
4,788,131<br />
16,255,409<br />
9,831,330<br />
5,540,208<br />
15,371,538<br />
417,400<br />
1,171,427<br />
1,588,827<br />
16,960,365<br />
-<br />
16,960,365<br />
(13,301,990)<br />
-<br />
(13,301,990)<br />
3,658,375<br />
10,248,730<br />
6,711,635<br />
16,960,365<br />
Performing<br />
Non-performing<br />
2006 2005 2006 2005<br />
--------------------------------- (Rupees in '000) ---------------------------------<br />
145,700,019<br />
56,615,063<br />
202,315,082<br />
-<br />
16,255,409<br />
16,255,409<br />
-<br />
16,960,365<br />
16,960,365<br />
Advances having Gross Book Value of Rs.199.770 million (2005: Rs. 298.568 million) and Net Book Value of<br />
Rs. 144.793 million (2005: Rs. 284.115 million) though restructured and performing have been placed under<br />
non-performing status as required by the revised Prudential Regulations issued by the State <strong>Bank</strong> of Pakistan,<br />
which requires monitoring for at least one year before any upgradation is considered.<br />
13
NOTES TO THE FINANCIAL STATEMENTS FOR THE YEAR ENDED DECEMBER 31, 2006<br />
10.2<br />
Other Assets Especially<br />
Mentioned * 363,819<br />
Substandard 1,583,124<br />
Doubtful 1,612,613<br />
Loss 7,907,722<br />
11,467,278<br />
Other Assets Especially<br />
Mentioned * 257,812<br />
Substandard 997,226<br />
Doubtful 687,047<br />
Loss 8,306,645<br />
10,248,730<br />
Domestic Overseas Total Domestic Overseas Total Domestic Overseas Total<br />
-<br />
175,597<br />
68,730<br />
4,543,804<br />
4,788,131<br />
363,819<br />
1,758,721<br />
1,681,343<br />
12,451,526<br />
16,255,409<br />
-<br />
222,278<br />
438,416<br />
6,757,969<br />
7,418,663<br />
-<br />
158,901<br />
61,967<br />
4,543,804<br />
4,764,672<br />
-<br />
381,179<br />
500,383<br />
11,301,773<br />
12,183,335<br />
-<br />
222,278<br />
438,416<br />
6,757,969<br />
7,418,663<br />
-<br />
158,901<br />
61,967<br />
4,543,804<br />
4,764,672<br />
-<br />
381,179<br />
500,383<br />
11,301,773<br />
12,183,335<br />
Domestic Overseas Total Domestic Overseas Total Domestic Overseas Total<br />
-<br />
50,087<br />
143,913<br />
6,517,635<br />
6,711,635<br />
257,812<br />
1,047,313<br />
830,960<br />
14,824,280<br />
16,960,365<br />
-<br />
111,660<br />
95,762<br />
6,503,740<br />
6,711,162<br />
* The Other Assets Especially Mentioned category pertains to agricultural finance only<br />
10.3 Particulars of provision against advances<br />
10.3.1<br />
Advances include Rs.16,255 million (2005: Rs. 16,960 million) which have been placed under non-performing<br />
status as detailed below:-<br />
Category of<br />
Classification<br />
Category of<br />
Classification<br />
Classified Advances<br />
Opening balance 13,301,990<br />
Exchange adjustments 115,481<br />
Charge for the year 1,993,064<br />
Reversals (653,810)<br />
1,339,254<br />
Transfers 315,880<br />
Amounts written off 10.4 (2,889,270)<br />
Closing balance 12,183,335<br />
10.3.2 Particulars of provision against advances<br />
In local currency 7,418,663<br />
In foreign currencies 4,764,672<br />
12,183,335<br />
2006<br />
Provision Required<br />
2005<br />
Provision Required<br />
------------------------------------------------ (Rupees in '000) ------------------------------------------------<br />
-<br />
11,892<br />
71,958<br />
6,506,978<br />
6,590,828<br />
-<br />
123,552<br />
167,720<br />
13,010,718<br />
13,301,990<br />
-<br />
111,660<br />
95,762<br />
6,503,740<br />
6,711,162<br />
-<br />
11,892<br />
71,958<br />
6,506,978<br />
6,590,828<br />
-<br />
123,552<br />
167,720<br />
13,010,718<br />
13,301,990<br />
2006<br />
2005<br />
Note Specific General Total Specific General Total<br />
--------------------------------------------- (Rupees in '000) -------------------------------------------<br />
1,162,987<br />
4,252<br />
633,682<br />
-<br />
633,682<br />
(337,760)<br />
(46,912)<br />
1,416,249<br />
14,464,977<br />
119,733<br />
2,626,746<br />
(653,810)<br />
1,972,936<br />
(21,880)<br />
(2,936,182)<br />
13,599,584<br />
15,621,718<br />
12,331<br />
904,940<br />
(279,955)<br />
624,985<br />
(295,036)<br />
(2,662,008)<br />
13,301,990<br />
260,937<br />
861<br />
652,017<br />
-<br />
652,017<br />
272,958<br />
(23,786)<br />
1,162,987<br />
15,882,655<br />
13,192<br />
1,556,957<br />
(279,955)<br />
1,277,002<br />
(22,078)<br />
(2,685,794)<br />
14,464,977<br />
General provision represents provision amounting to Rs. 1,163.019 million (2005: Rs. 699.420 million) against<br />
consumer finance portfolio as required by the revised Prudential Regulations issued by State <strong>Bank</strong> of Pakistan and<br />
Rs. 253.230 million (2005: Rs. 463.567 million) pertaining to overseas advances to meet the requirements of<br />
monetary agencies and regulatory authorities of the respective countries in which the overseas branches operate.<br />
2006 2005<br />
Specific General Total Specific General Total<br />
--------------------------------------------- (Rupees in '000) -------------------------------------------<br />
1,163,019<br />
253,230<br />
1,416,249<br />
8,581,682<br />
5,017,902<br />
13,599,584<br />
6,711,162<br />
6,590,828<br />
13,301,990<br />
Provision Held<br />
------------------------------------------------ (Rupees in '000) ------------------------------------------------<br />
Classified Advances<br />
14<br />
Provision Held<br />
699,420<br />
463,567<br />
1,162,987<br />
7,410,582<br />
7,054,395<br />
14,464,977
NOTES TO THE FINANCIAL STATEMENTS FOR THE YEAR ENDED DECEMBER 31, 2006<br />
10.4 Particulars of write-offs<br />
Note 2006 2005<br />
(Rupees in '000)<br />
10.4.1 Against provisions 10.3 2,936,182<br />
Directly charged to profit and loss account 269,349<br />
3,205,531<br />
10.4.2 Write-offs of Rs. 500,000 and above 10.5 2,906,736<br />
Write-offs of below Rs. 500,000 298,795<br />
3,205,531<br />
10.5 Details of loan write-offs of Rs. 500,000/- and above<br />
10.6 Particulars of loans and advances to executives, directors,<br />
associated companies etc.<br />
Debts due by directors or executives of the <strong>Bank</strong> or any of them<br />
either severally or jointly with any other persons<br />
2,685,794<br />
38,140<br />
2,723,934<br />
1,233,732<br />
1,490,202<br />
2,723,934<br />
In terms of sub-section (3) of Section 33A of the <strong>Bank</strong>ing Companies Ordinance, 1962 the statement in respect of<br />
written-off loans or any other financial relief of five hundred thousand rupees or above allowed to a person during<br />
the year ended December 31, 2006 is given in Annexure-B to these financial statements. These loans are written off<br />
as a book entry without prejudice to the <strong>Bank</strong>'s right of recovery against the customers.<br />
Note 2006 2005<br />
(Rupees in '000)<br />
Balance at beginning of year 471,621<br />
Loans granted during the year 313,544<br />
Repayments (175,762)<br />
Balance at end of year 609,403<br />
Debts due by companies or firms in which the directors of the<br />
bank are interested as directors, partners or in the case<br />
of private companies as members<br />
11. FIXED ASSETS<br />
Balance at beginning of year 1,818,141<br />
Given during the year -<br />
Repaid during the year (817,576)<br />
Balance at end of year 1,000,565<br />
Capital work-in-progress 11.1 408,617<br />
Property and equipment 11.2 4,649,179<br />
Intangible assets 11.3 176,667<br />
11.1 Capital work-in-progress<br />
5,234,463<br />
Capital work-in-progress essentially comprises civil works and advances to suppliers and contractors.<br />
15<br />
35,693<br />
454,145<br />
(18,217)<br />
471,621<br />
2,542,969<br />
1,863,892<br />
(2,588,720)<br />
1,818,141<br />
386,852<br />
3,949,865<br />
112,607<br />
4,449,324
NOTES TO THE FINANCIAL STATEMENTS FOR THE YEAR ENDED DECEMBER 31, 2006<br />
11.2 Property and equipment<br />
At January 1,<br />
2006<br />
Additions/<br />
(deletions)<br />
Other<br />
adjustments*<br />
At December<br />
31, 2006<br />
At January<br />
1, 2006<br />
Charge for<br />
the year/<br />
(depreciation<br />
on<br />
deletions)<br />
Reversal<br />
due to<br />
other<br />
adjustments*<br />
At<br />
December<br />
31, 2006<br />
------------------------------------------------------------------------ (Rupees in '000) ---------------------------------------------------------------------------<br />
Owned<br />
Freehold land 408,194 17,520 - 425,714 - - -<br />
- 425,714 -<br />
Leasehold land 2,274,007 75,173 - 2,349,180 192,389 91,788 (11,249) 272,928 2,076,252 1 - 3.33<br />
Buildings on<br />
freehold land<br />
64,189 2,748 - 66,937 6,108 3,313 (82) 9,339 57,598 5<br />
Buildings on<br />
leasehold land<br />
565,380 219,487 1,243 786,110 96,156 52,264 12,137 160,557 625,553 5<br />
Furniture and fixtures 544,586 118,032 (36,204) 622,967 404,539 35,505 (34,683) 402,087 220,880 10<br />
Electrical, office<br />
(3,447)<br />
(3,274)<br />
and computer 1,547,433 624,036 (33,774) 2,133,980 939,230 288,661 (11,175) 1,213,009 920,971 20-25<br />
equipment (3,715)<br />
(3,707)<br />
Vehicles 380,703 279,771 (73,796) 530,759 196,205 79,143 (19,032) 208,548 322,211 20<br />
Assets held under<br />
finance lease<br />
(55,919)<br />
(47,768)<br />
Vehicles -<br />
- -<br />
-<br />
- - -<br />
-<br />
2006 5,784,492 1,336,767 (142,531) 6,915,647 1,834,627 550,674 (64,084) 2,266,468<br />
(63,081)<br />
(54,749)<br />
At January 1,<br />
2005<br />
Additions/<br />
(deletions)<br />
Other<br />
adjustments*<br />
At December<br />
31, 2005<br />
At January<br />
1, 2005<br />
Charge for<br />
the year/<br />
(depreciation<br />
on<br />
deletions)<br />
Reversal<br />
due to<br />
other<br />
adjustments*<br />
At<br />
December<br />
31, 2005<br />
-<br />
4,649,179<br />
------------------------------------------------------------------------ (Rupees in '000) ---------------------------------------------------------------------------<br />
Owned<br />
Freehold land 408,194 - - 408,194 - - -<br />
- 408,194 -<br />
Leasehold land 2,285,608 - (11,601) 2,274,007 151,210 90,082 (48,903) 192,389 2,081,618 1 - 3.33<br />
Buildings on<br />
freehold land<br />
57,956 6,233 - 64,189 2,898 3,210 - 6,108 58,081 5<br />
Buildings on<br />
leasehold land<br />
460,737 104,420 223 565,380 72,042 33,709 (9,595) 96,156 469,224 5<br />
Furniture and fixtures 517,163 62,507 (28,390) 544,586 458,307 27,849 (75,972) 404,539 140,047 10<br />
Electrical, office<br />
(6,694)<br />
(5,645)<br />
and computer 1,292,192 322,195 (53,709) 1,547,433 775,490 228,044 (51,184) 939,230 608,203 20-25<br />
equipment (13,245)<br />
(13,120)<br />
Vehicles 326,279<br />
Assets held under<br />
finance lease<br />
Vehicles 2,215<br />
2005 5,350,344<br />
*<br />
------------------------------------------------------------------------------ 2006 --------------------------------------------------------------------------<br />
COST/ REVALUATION ACCUMULATED DEPRECIATION<br />
------------------------------------------------------------------------------ 2005 --------------------------------------------------------------------------<br />
COST / REVALUATION ACCUMULATED DEPRECIATION<br />
119,358<br />
(31,362)<br />
-<br />
(33,572)<br />
(2,215)<br />
380,703<br />
-<br />
202,117<br />
1,326<br />
29,647<br />
(23,601)<br />
-<br />
(11,958)<br />
(1,326)<br />
196,205<br />
614,713 (129,264) 5,784,492 1,663,390 412,541 (198,938) 1,834,627<br />
(51,301)<br />
(42,366)<br />
-<br />
Net book<br />
value at<br />
December<br />
31, 2005<br />
184,498<br />
-<br />
3,949,865<br />
This represents write - off / reclassification of fixed assets based on an exercise being carried out by the management to reconcile their<br />
subsidiary records of fixed assets with the ledger balances. This exercise is expected to be completed shortly<br />
16<br />
Net book<br />
value at<br />
December<br />
31, 2006<br />
Annual<br />
rate of<br />
depreciation<br />
%<br />
20<br />
Annual<br />
rate of<br />
depreciation<br />
%<br />
20<br />
20
NOTES TO THE FINANCIAL STATEMENTS FOR THE YEAR ENDED DECEMBER 31, 2006<br />
11.3 Intangible assets<br />
--------------------------------------------------------------------------------- 2006 ---------------------------------------------------------------------------------<br />
Software 145,210<br />
Software 46,871<br />
At<br />
Additions/<br />
January 1,<br />
(deletions)<br />
2006<br />
116,311<br />
At<br />
Additions/<br />
January 1,<br />
(deletions)<br />
2005<br />
98,339<br />
Other<br />
adjustments*<br />
-<br />
Other<br />
adjustments*<br />
11.4 Revaluation of domestic properties<br />
Cost Accumulated Amortization<br />
-<br />
At<br />
December<br />
31, 2006<br />
261,521<br />
At<br />
December<br />
31, 2005<br />
145,210<br />
At<br />
January 1,<br />
2006<br />
32,603<br />
At<br />
January 1,<br />
2005<br />
9,222<br />
Charge for<br />
the year/<br />
(amortisation<br />
on<br />
deletion)<br />
52,251<br />
Charge for<br />
the year/<br />
(amortisation<br />
on<br />
deletion)<br />
23,381<br />
Other<br />
adjustments<br />
-<br />
Other<br />
adjustments<br />
-<br />
At<br />
December<br />
31, 2006<br />
------------------------------------------------- (Rupees in '000) --------------------------------------------<br />
84,854<br />
At<br />
December<br />
31, 2005<br />
32,603<br />
176,667<br />
--------------------------------------------------------------------------------- 2005 ---------------------------------------------------------------------------------<br />
Cost Accumulated Amortization<br />
------------------------------------------------- (Rupees in '000) --------------------------------------------<br />
112,607<br />
The properties of the <strong>Bank</strong> were last revalued by independent professional valuers as at December 31, 2003. The<br />
revaluation was carried out by M/s. Pirsons Chemicals Engineering (Private) <strong>Limited</strong> and M/s. Consultancy Support<br />
Services on the basis of professional assessment of present market values and resulted in a surplus of Rs. 991<br />
million . Had there been no revaluation, the carrying amount of revalued assets would have been as follows:<br />
Freehold land 21,974<br />
Leasehold land 107,966<br />
Buildings on freehold land 15,560<br />
Buildings on leasehold land 494,171<br />
11.5 Carrying amount of temporarily idle property. 19,382<br />
11.6 The gross carrying amount of fully depreciated assets that are still in use<br />
Net book<br />
value at<br />
December<br />
31, 2005<br />
Furniture and fixtures 11,847<br />
Electrical, office and computer equipment 21,315<br />
Vehicles 37,718<br />
IT Hardware 136,636<br />
17<br />
Net book<br />
value at<br />
December<br />
31, 2006<br />
Annual rate<br />
of amortisation<br />
%<br />
25<br />
Annual rate<br />
of amortisation<br />
%<br />
25<br />
Rupees in '000
NOTES TO THE FINANCIAL STATEMENTS FOR THE YEAR ENDED DECEMBER 31, 2006<br />
11.7 Disposals of fixed assets during the year<br />
Furniture and fixtures<br />
Cost<br />
Items having book value of less<br />
than Rs. 250,000 or cost of<br />
less than Rs. 1,000,000 3,447<br />
Electrical, office and computer<br />
equipment<br />
Items having book value of less<br />
than Rs. 250,000 or cost of<br />
less than Rs. 1,000,000 3,715<br />
Vehicles<br />
Toyota Corolla 849<br />
Toyota Corolla 939<br />
Toyota Corolla 849<br />
Toyota Corolla 849<br />
Toyota Corolla 939<br />
Toyota Corolla 939<br />
Toyota Corolla 849<br />
Honda Civic 939<br />
Suzuki Cultus 555<br />
Items having book value of more<br />
than Rs. 250,000 and cost of<br />
more than Rs. 1,000,000<br />
Honda Civic 1,245<br />
Honda Civic 1,245<br />
Honda Civic 1,245<br />
Honda Civic 1,245<br />
Honda Civic 1,245<br />
Honda Civic 1,245<br />
Items having book value of less<br />
than Rs. 250,000 and cost of<br />
less than Rs. 1,000,000 40,742<br />
55,919<br />
Total 63,081<br />
Accumulateddepreciation<br />
3,274<br />
3,707<br />
552<br />
626<br />
524<br />
524<br />
610<br />
563<br />
453<br />
563<br />
102<br />
Book<br />
value<br />
173<br />
8<br />
297<br />
313<br />
325<br />
325<br />
329<br />
376<br />
396<br />
376<br />
453<br />
Sale<br />
proceeds<br />
--------------(Rupees in '000)--------------<br />
726<br />
726<br />
726<br />
726<br />
726<br />
706<br />
38,915<br />
47,768<br />
54,749<br />
519<br />
519<br />
519<br />
519<br />
519<br />
539<br />
1,827<br />
8,151<br />
8,332<br />
18<br />
979<br />
62<br />
509<br />
329<br />
524<br />
496<br />
407<br />
376<br />
665<br />
548<br />
453<br />
519<br />
560<br />
560<br />
560<br />
560<br />
642<br />
13,976<br />
21,684<br />
22,725<br />
Mode of disposal<br />
Auction Various<br />
Auction Various<br />
Negotiation<br />
Employee benefit<br />
Negotiation<br />
Negotiation<br />
Employee benefit<br />
Retirement benefit<br />
Insurance claim<br />
Negotiation<br />
Insurance claim<br />
Employee benefit<br />
Negotiation<br />
Negotiation<br />
Negotiation<br />
Negotiation<br />
Employee benefit<br />
Particulars of Buyers<br />
Mr. Abrar Mir (Ex-employee)<br />
Dr.Khalid Aslam (Ex-employee)<br />
Mr. Mir Akbar Ali (SVP)<br />
Mr. Arif Rasheed (SVP)<br />
Mr. M.A Mannan (Ex-employee)<br />
Mr. Najmul Hassan (EVP)<br />
Adamjee Insurance Company Ltd.<br />
Mr. Khawaja Asif (SEVP)<br />
Adamjee Insurance Company Ltd.<br />
Mr. Noman Hussain (Ex-employee)<br />
Mr. Muhammad Asghar (SEVP)<br />
Mr. Muhammad Ejazuddin (SEVP)<br />
Mr. Ali Sameer (SEVP)<br />
Mr. Aameer Karachiwalla (SEVP)<br />
Mr. M.A Mannan (Ex-employee)
NOTES TO THE FINANCIAL STATEMENTS FOR THE YEAR ENDED DECEMBER 31, 2006<br />
12. DEFERRED TAX ASSET - NET<br />
Note 2006 2005<br />
(Rupees in '000)<br />
Deferred tax asset - net 12.1 906,661<br />
12.1 The balance of deferred taxation comprises:<br />
Deductible temporary differences on<br />
recognized tax losses -<br />
deficit on revaluation of investments 21.2 18,849<br />
other deductible differences<br />
Taxable temporary differences on<br />
1,028,589<br />
1,047,438<br />
surplus on revaluation of fixed assets 21.1 (60,697)<br />
accelerated tax depreciation (80,080)<br />
(140,777)<br />
13. OTHER ASSETS<br />
906,661<br />
Income / mark-up accrued in local currency 7,918,432<br />
Income / mark-up accrued in foreign currency 1,486,652<br />
9,405,084<br />
Suspense accounts 428,256<br />
Hajj refund 558,407<br />
Stationery and stamps on hand 88,581<br />
Non banking assets acquired in satisfaction of claims 13.2 68,571<br />
Advances, deposits, advance rent and other prepayments 1,001,128<br />
Receivable from staff retirement funds 1,289,559<br />
Due from other banks against telegraphic and demand drafts 699,967<br />
Unrealized gain on forward foreign exchange contracts 83,807<br />
Unrealized gain on securities not yet purchased 54,334<br />
Others 547,933<br />
14,225,627<br />
Provision held against other assets 13.1 (1,794,691)<br />
Unrealized mark-up held in suspense account (2,368,470)<br />
Other Assets (Net of Provisions) 10,062,466<br />
13.1 Provision against other assets<br />
13.2<br />
Opening balance 2,280,212<br />
Exchange adjustments -<br />
2,280,212<br />
Charge for the year 181,249<br />
Reversals (7,599)<br />
29 173,650<br />
Transfers 33,029<br />
Amounts written off (692,200)<br />
Closing balance 1,794,691<br />
2,273,005<br />
1,511,888<br />
19,685<br />
805,699<br />
2,337,272<br />
(64,267)<br />
-<br />
(64,267)<br />
2,273,005<br />
7,621,653<br />
2,793,121<br />
10,414,774<br />
449,455<br />
826,068<br />
79,524<br />
-<br />
687,736<br />
844,360<br />
95,468<br />
120,538<br />
41,726<br />
792,421<br />
14,352,070<br />
(2,280,212)<br />
(4,242,088)<br />
7,829,770<br />
3,052,803<br />
230<br />
3,053,033<br />
87,998<br />
-<br />
87,998<br />
49,028<br />
(909,847)<br />
2,280,212<br />
These are carried at carrying value of amount due from the customers. Market value of these assets as determined<br />
by management of the <strong>Bank</strong> was higher than the carrying amount.<br />
19
NOTES TO THE FINANCIAL STATEMENTS FOR THE YEAR ENDED DECEMBER 31, 2006<br />
14. CONTINGENT ASSETS<br />
There were no contingent assets as at the balance sheet date.<br />
15. BILLS PAYABLE<br />
Note 2006 2005<br />
(Rupees in '000)<br />
In Pakistan 3,723,994<br />
Outside Pakistan 836,655<br />
4,560,649<br />
16. BORROWINGS<br />
In Pakistan 38,002,758<br />
Outside Pakistan 542,162<br />
38,544,920<br />
16.1 Particulars of borrowings with respect to currencies<br />
In local currency 38,002,758<br />
In foreign currencies 542,162<br />
38,544,920<br />
16.2 Details of borrowings from financial institutions<br />
16.3<br />
16.4<br />
16.5<br />
16.6<br />
16.7<br />
Secured<br />
Borrowings from the State <strong>Bank</strong> of Pakistan under<br />
- Export refinance scheme 16.3 9,414,812<br />
- Long-term financing under export oriented projects 16.4 5,333,691<br />
- Locally manufactured machinery refinance scheme 16.5 3,382<br />
14,751,885<br />
Repurchase agreement borrowings<br />
Unsecured<br />
16.6 17,527,738<br />
32,279,623<br />
Call borrowings 16.7 4,600,000<br />
Overdrawn nostro accounts 542,162<br />
Trading liabilities 1,123,135<br />
6,265,297<br />
38,544,920<br />
4,080,008<br />
79,956<br />
4,159,964<br />
21,676,489<br />
113,991<br />
21,790,480<br />
21,676,489<br />
113,991<br />
21,790,480<br />
7,453,261<br />
303,410<br />
5,195<br />
7,761,866<br />
8,434,771<br />
16,196,637<br />
4,000,000<br />
113,991<br />
1,479,852<br />
5,593,843<br />
21,790,480<br />
The bank has entered into agreements with the State <strong>Bank</strong> of Pakistan (SBP) for extending export finance to<br />
customers. As per the terms of the agreement, the bank has granted SBP the right to recover the outstanding<br />
amount from the bank at the date of maturity of finances by directly debiting the current account maintained by the<br />
bank with SBP. These borrowings are repayable within six months upto June 2007.<br />
These borrowings have been made from SBP for providing financing facilities to customers for import of machinery,<br />
plant, equipment and accessories thereof (not manufactured locally) by export oriented units.<br />
According to agreements with SBP, these loans were obtained for providing finance to customers against locally<br />
manufactured machinery.<br />
These repurchase agreement borrowings are secured against market treasury bills and carry mark-up at rates<br />
ranging from 8.19% to 8.82% per annum (2005: 6.50% to 8.45% per annum). These borrowings are repayable latest<br />
by March 2007.<br />
These call borrowings carry mark-up at rates ranging from 8.1% to 10.1% per annum (2005: 1% to 9.25% per<br />
annum) and are repayable latest by March 2007.<br />
20
NOTES TO THE FINANCIAL STATEMENTS FOR THE YEAR ENDED DECEMBER 31, 2006<br />
17. DEPOSITS AND OTHER ACCOUNTS<br />
Customers<br />
Fixed deposits 114,927,897<br />
Savings deposits 121,878,162<br />
Sundry deposits 4,942,064<br />
Margin deposits 2,698,999<br />
Current accounts - remunerative 1,908,055<br />
Current accounts - non-remunerative<br />
<strong>Financial</strong> Institutions<br />
88,662,089<br />
335,017,266<br />
Remunerative deposits 35,539<br />
Non-remunerative deposits 25,068<br />
60,607<br />
335,077,873<br />
17.1 Particulars of deposits and other accounts<br />
In local currency 256,318,445<br />
In foreign currencies 78,759,428<br />
335,077,873<br />
18. SUB-ORDINATED LOANS - UNSECURED<br />
18.1<br />
Term Finance Certificates - I<br />
Note Issue Date Tenor<br />
Rate % per<br />
annum<br />
Maturity<br />
Frequency<br />
of principal<br />
redemption<br />
August 2004 8 years 8.45% August 2012 Semi Annual 1,998,464<br />
Term Finance Certificates - II March 2005 8 years 9.49% March 2013 Semi Annual 1,999,880<br />
Term Finance Certificates - III September 2006 8 years Kibor+1.70% September 2014 Semi Annual 2,000,000<br />
5,998,344<br />
19. OTHER LIABILITIES<br />
2006 2005<br />
(Rupees in '000)<br />
79,841,687<br />
122,662,484<br />
4,148,275<br />
2,214,877<br />
1,886,548<br />
78,324,614<br />
289,078,485<br />
-<br />
147,814<br />
147,814<br />
289,226,299<br />
235,708,482<br />
53,517,817<br />
289,226,299<br />
2006 2005<br />
1,999,232<br />
1,999,960<br />
-<br />
3,999,192<br />
Note 2006 2005<br />
(Rupees in '000)<br />
Mark-up / return / interest payable in local currency 2,432,045<br />
Mark-up / return / interest payable in foreign currency 247,872<br />
Accrued expenses 19.1 1,470,098<br />
Branch adjustment account (414,734)<br />
Payable under severance scheme 35,226<br />
Unearned commission 308,098<br />
Provision for taxation - net 19.2 1,024,954<br />
Provision against off - balance sheet obligations 19.3 652,339<br />
Unrealized loss on derivative financial instruments - net 19.4 152,401<br />
Deferred liabilities 19.5 2,409,310<br />
Others 957,425<br />
9,275,034<br />
(Rupees in '000)<br />
These represent listed Term Finance Certificates (TFCs) issued by the bank in the year 2004 , 2005 and 2006<br />
having tenor of eight years. The liability of the bank is subordinated as to the payment of principal and profit to all<br />
other indebtedness of the bank (including deposits) and is not redeemable before maturity without approval of the<br />
State <strong>Bank</strong> of Pakistan.<br />
21<br />
1,775,186<br />
132,657<br />
752,355<br />
38,015<br />
37,060<br />
21,149<br />
202,883<br />
612,480<br />
160,574<br />
2,287,092<br />
185,295<br />
6,204,746
NOTES TO THE FINANCIAL STATEMENTS FOR THE YEAR ENDED DECEMBER 31, 2006<br />
19.1<br />
19.2<br />
This includes an accrual of Rs. 559 million in respect of a new employee bonus scheme introduced by the <strong>Bank</strong> in<br />
the current year. The accrual represents benefits for the years 2005 (Rs 270 million) and 2006 as the scheme is<br />
effective from 2005. The object of the scheme is to reward, motivate and retain high performing executives and<br />
officers of the <strong>Bank</strong> by way of bonus in the form of shares of <strong>UBL</strong>. The liability of the <strong>Bank</strong> in respect of this scheme<br />
is fixed and is approved each year by the Board of Directors of the <strong>Bank</strong>. The scheme will be managed by a<br />
separate trust for which the trust deed and rules are currently in the process of finalization.<br />
The income tax assessments of the bank for domestic branches have been finalized under normal law upto the<br />
assessment year 2002-2003 and tax years 2004 to 2006 under the provisions of section 120 (1) of the Income Tax<br />
Ordinance, 2001 which are deemed to be assessed unless selected for audit. The case of the tax year 2003 was<br />
selected for audit under section 177 of the Income Tax Ordinance, 2001 and the proceedings are pending before<br />
the taxation officer. In respect of Azad Kashmir Branches, assessment for the tax years 2003 and 2004 have been<br />
finalized in the light of agreement reached between the banks and Azad Kashmir Council in May 2005. The returns<br />
for the tax year 2005 and 2006 have also been filed as per the terms of the said agreement.<br />
19.3 Provision against off - balance sheet obligations<br />
Note 2006 2005<br />
(Rupees in '000)<br />
Opening balance 612,480<br />
Charge during the year 29 52,663<br />
Transfers during the year (12,804)<br />
652,339<br />
19.4 Unrealized loss on derivative financial instruments<br />
2006 2005<br />
Contract/<br />
Contract/<br />
Notional amount Fair values Notional amount<br />
Unrealized loss on:<br />
Interest rate swaps 6,884,347<br />
Equity futures 382,026<br />
Forward purchase and sale contracts of government<br />
securities 8,468,302<br />
15,734,675<br />
19.5 Deferred liabilities<br />
151,872<br />
731<br />
(202)<br />
152,401<br />
7,826,415<br />
43,765<br />
598,194<br />
8,468,374<br />
Provision for post retirement medical benefits 1,226,331<br />
Provision for gratuity - overseas 108,721<br />
Provision for compensated absences 1,074,258<br />
2,409,310<br />
20. SHARE CAPITAL<br />
20.1 Authorized Capital<br />
2006 2005<br />
Number of shares<br />
1,030,000,000 1,030,000,000 Ordinary shares of Rs 10 each 10,300,000<br />
20.2 Issued, subscribed and paid-up capital<br />
Fully paid-up ordinary shares of Rs 10 each<br />
2006 2005<br />
Number of shares<br />
518,000,000 518,000,000<br />
Fully paid-up ordinary shares of Rs 10 each<br />
Issued for cash 5,180,000<br />
129,500,000 - Issued as bonus shares 1,295,000<br />
647,500,000 518,000,000 6,475,000<br />
22<br />
---------------- (Rupees in '000) ------------------<br />
370,544<br />
238,712<br />
3,224<br />
612,480<br />
Fair values<br />
2006 2005<br />
(Rupees in '000)<br />
156,272<br />
(2,125)<br />
6,427<br />
160,574<br />
1,154,400<br />
95,192<br />
1,037,500<br />
2,287,092<br />
10,300,000<br />
5,180,000<br />
-<br />
5,180,000
NOTES TO THE FINANCIAL STATEMENTS FOR THE YEAR ENDED DECEMBER 31, 2006<br />
20.3 Major shareholders (holding more than 5% of total paid-up capital)<br />
2006<br />
Number of Percentage of<br />
Name of shareholder shares held shareholding<br />
State <strong>Bank</strong> of Pakistan 287,908,654<br />
Abu Dhabi Group 165,112,500<br />
Best Way Group 165,112,500<br />
618,133,654<br />
21. SURPLUS ON REVALUATION OF ASSETS<br />
44.46%<br />
25.50%<br />
25.50%<br />
95.46%<br />
Note 2006 2005<br />
(Rupees in '000)<br />
Surplus arising on revaluation of assets - net of tax :<br />
Fixed assets 21.1 2,484,749<br />
Securities 21.2 174,912<br />
2,659,661<br />
21.1 Surplus on revaluation of fixed assets<br />
Surplus on revaluation of fixed assets at January 1 2,643,470<br />
Transferred to unappropriated profit in respect of incremental<br />
depreciation charged during the year (94,454)<br />
Related deferred tax liability of incremental depreciation charged<br />
during the year (3,570)<br />
2,545,446<br />
Less: Related deferred tax liability on:<br />
Revaluation as on January 1 64,267<br />
Incremental depreciation charged on related assets (3,570)<br />
60,697<br />
2,484,749<br />
21.2 Surplus on revaluation available-for-sale securities<br />
21.3<br />
Market Treasury Bills (10,437)<br />
Pakistan Investment Bonds (58,140)<br />
Quoted securities 224,640<br />
156,063<br />
Related deferred tax asset/ (liability) 18,849<br />
174,912<br />
22. CONTINGENCIES AND COMMITMENTS<br />
22.1 Direct credit substitutes<br />
Contingent liabilities in respect of guarantees given favouring<br />
Government 9,636,483<br />
<strong>Bank</strong>ing companies and other financial institutions 2,443,965<br />
Others 4,079,842<br />
16,160,290<br />
2,579,203<br />
332,793<br />
2,911,996<br />
2,741,494<br />
(94,148)<br />
(3,876)<br />
2,643,470<br />
68,143<br />
(3,876)<br />
64,267<br />
2,579,203<br />
(11,405)<br />
(60,063)<br />
384,576<br />
313,108<br />
19,685<br />
332,793<br />
Deferred tax liability on surplus on revaluation of quoted securities amounting to Rs. 32.589 million has not been<br />
recognised by the <strong>Bank</strong> in the financial statements as the management is confident that the existing tax exemption<br />
on sale of listed securities will be extended by the Government of Pakistan beyond tax year 2007.<br />
23<br />
2006 2005<br />
(Rupees in '000)<br />
1,683,912<br />
769,256<br />
2,325,041<br />
4,778,209
NOTES TO THE FINANCIAL STATEMENTS FOR THE YEAR ENDED DECEMBER 31, 2006<br />
22.2 Transaction-related contingent liabilities<br />
Contingent liabilities in respect of performance bonds,<br />
bid bonds, warranties, etc. given favouring<br />
Government 27,269,975<br />
<strong>Bank</strong>ing companies and other financial institutions 1,387,386<br />
Others 4,585,391<br />
33,242,752<br />
22.3 Trade-related contingent liabilities<br />
Contingent liabilities in respect of letters of credit opened favouring<br />
Government 50,372,611<br />
<strong>Bank</strong>ing companies and other financial institutions 36,266<br />
Others 42,628,833<br />
93,037,710<br />
22.4 Other contingencies<br />
Claims against the <strong>Bank</strong> not acknowledged as debts 13,732,499<br />
22.5 Commitments in respect of forward lending<br />
22.6 Commitments in respect of forward foreign exchange contracts<br />
Sale 57,465,478<br />
Purchase 55,369,664<br />
2006 2005<br />
(Rupees in '000)<br />
14,640,161<br />
785,981<br />
5,287,560<br />
20,713,702<br />
1,485,183<br />
291,841<br />
70,827,123<br />
72,604,147<br />
6,054,243<br />
The bank makes commitments to extend credit in the normal course of its business but these being revocable<br />
commitments do not attract any significant penalty or expense if the facility is unilaterally withdrawn.<br />
22.7 Other commitments<br />
Forward purchase contracts of government securities 5,634,902<br />
Forward sale contracts of government securities 2,833,400<br />
Interest rate swaps 6,884,347<br />
Equity futures 382,026<br />
Sale of securities not yet purchased 1,067,735<br />
Commitments in respect of capital expenditure 89,037<br />
23. DERIVATIVE INSTRUMENTS<br />
38,202,754<br />
34,338,394<br />
598,194<br />
-<br />
7,826,415<br />
43,765<br />
1,479,279<br />
217,112<br />
“Derivative” means a type of financial contract the value of which is determined by reference to one or more<br />
underlying assets or indices. The major categories of such contracts include forwards, futures, swaps and options.<br />
Derivative also includes structured financial products that have one or more characteristics of forwards, futures,<br />
swaps and options.<br />
24
NOTES TO THE FINANCIAL STATEMENTS FOR THE YEAR ENDED DECEMBER 31, 2006<br />
The <strong>Bank</strong> as an Authorized Derivative Dealer (ADD) is an active participant in the derivatives’ market of Pakistan.<br />
Though the ADD license covers the below mentioned transactions only (permitted under <strong>Financial</strong> Derivatives<br />
Business Regulations issued by SBP), but the <strong>Bank</strong> offers a wide variety of derivative products to satisfy customers’<br />
needs (specific approval for which is sought from SBP on transaction basis):<br />
a. Foreign Currency Options<br />
b. Forward Rate Agreements<br />
c. Interest Rate Swaps<br />
These transactions cover both the aspects of market making and hedging.<br />
The authority for approving policies lie with the BOD, who has delegated its powers to Market Risk Committee<br />
(MRC), which runs the affairs in line with policies approved by the BOD.<br />
With regard to derivatives, the Market Risk Committee (MRC) is authorized to:<br />
- Review derivatives business with reference to market risk exposure and assign various limits in accordance<br />
with the risk appetite of the bank<br />
- Review and approve the Derivatives Business Policy<br />
- Review and sign off derivatives’ product programs<br />
- Authorize changes in procedures and processes regarding derivatives and structured products<br />
Overall responsibility for derivatives trading activity lies with Treasury and Capital Markets (TCM). Identifying and<br />
quantifying market risk on derivatives; Coordinating approvals on temporary or permanent market risk limits;<br />
Formulation of policies and procedures with respect to market risk arising from derivatives; Formal monitoring of<br />
market and credit risk exposure and limits and its reporting to the senior management and BOD is done by Treasury<br />
and Market Risk (TMR).Treasury Operations (TROPS) records derivative activity in the bank’s books, and its<br />
reporting to SBP.<br />
Derivative Risk Management<br />
There are a number of risks undertaken by the <strong>Bank</strong>, which need to be monitored and assessed. The “risk<br />
continuum” includes:<br />
Credit Risk<br />
This refers to the risk of non-performance or default by a party (a customer, guarantor, trade counterparty, third<br />
party, etc.), resulting in a negative impact on the bank’s equity. There are two types of credit risk (Settlement and Pre-<br />
Settlement risk) that are associated with derivatives transactions and monitored on regular basis. To mitigate the<br />
settlement risk, settlement is carried out by netting the amounts receivable and payable, i.e., net amount is either<br />
received or paid. Further, for Pre-Settlement Risk, the bank has constituted Treasury Product Credit Committee<br />
(TPCC) that is authorized to approve credit limits (based on internal obligor risk rating) for all derivative<br />
counterparties. Credit exposure for each counterparty is calculated and monitored by an independent risk monitoring<br />
and control department i.e. Treasury Middle Office.<br />
Market Risk<br />
Market risk exposure limits have been assigned in accordance with the risk appetite of the bank and being monitored<br />
on daily basis, which include sensitivity limits, tenor limits, and notional limits. An exercise is under way to model VaR<br />
structure, which will then help in deriving VaR limits.<br />
Liquidity Risk<br />
Derivative transactions, usually being non-funded in nature, do not involve funds therefore there is no specific risk of<br />
liquidity.<br />
25
NOTES TO THE FINANCIAL STATEMENTS FOR THE YEAR ENDED DECEMBER 31, 2006<br />
The other aspect of liquidity refers to the availability of certain instrument or hedge in the market, which is very much<br />
true in the local market, as interest rate derivatives have a unidirectional demand, and no perfect hedge is available.<br />
The <strong>Bank</strong> mitigates its risk, on one side, by limiting the portfolio in terms of tenor, notional, and sensitivity limits, and on<br />
the other side its running a short position in fixed income securities to partially cover the unfavorable movement in<br />
interest rates.<br />
Operational Risk<br />
The human resources involved in the process of trading, settlement and risk management of derivatives are carefully<br />
selected and subsequently trained to deal with the delicacies involved in the process. A state-of-the-art system has<br />
been put in place which handles the derivative transactions. As each and every product / transaction is processed in<br />
accordance with the product program or transaction memo, which contains in detail the accounting and operational<br />
aspects of the transaction, it further mitigates the operational risk. In addition, Treasury Middle Office (TMO) and<br />
Compliance and Control Department (CCD) are assigned with the responsibility of monitoring any deviation from the<br />
policies and procedures. <strong>Bank</strong>’s Audit and Inspection wing also reviews this function, which covers regular review of<br />
systems, transactional processes, accounting practices, end-user roles and responsibilities.<br />
The <strong>Bank</strong> has installed a state-of-the-art derivatives system (PRINCIPIA), which provides an end-to-end solution.<br />
Other than supporting the routine transactional process it also provides analytical tools to measure various risk<br />
exposures and stress / sensitivity analysis.<br />
Treasury Middle Office produces various reports for higher management (BOD, MRC etc) on daily, monthly and adhoc<br />
basis. These reports provide a quick look on derivatives business profile various risk exposures.<br />
Derivatives market in Pakistan, except for currency options, has a unidirectional demand, therefore the portfolio<br />
structure, as regards interest rate derivatives, is liability dominant.<br />
23.1 Product Analysis<br />
With <strong>Bank</strong>s for<br />
Hedging 2<br />
Market Making -<br />
With FIs other than banks<br />
Hedging -<br />
Market Making -<br />
With other entities<br />
Total<br />
Hedging -<br />
Market Making 20<br />
Hedging 2<br />
Market Making 20<br />
--------------------------------------------------------- 2006 ---------------------------------------------------------<br />
Interest Rate Swaps Forward Rate Agreements FX Options<br />
No. of Notional No. of Notional No. of Notional<br />
Contracts Principal Contracts Principal Contracts Principal<br />
(Rupees in '000) (Rupees in '000) (Rupees in '000)<br />
702,529<br />
-<br />
-<br />
-<br />
-<br />
6,181,818<br />
702,529<br />
6,181,818<br />
26<br />
-<br />
-<br />
-<br />
-<br />
-<br />
-<br />
-<br />
-<br />
-<br />
-<br />
-<br />
-<br />
-<br />
-<br />
-<br />
-<br />
3<br />
-<br />
-<br />
-<br />
-<br />
3<br />
3<br />
3<br />
621,571<br />
-<br />
-<br />
-<br />
-<br />
621,571<br />
621,571<br />
621,571
NOTES TO THE FINANCIAL STATEMENTS FOR THE YEAR ENDED DECEMBER 31, 2006<br />
With <strong>Bank</strong>s for<br />
Hedging 2<br />
Market Making -<br />
With FIs other than banks<br />
Hedging -<br />
Market Making -<br />
With other entities<br />
Hedging -<br />
Market Making 18<br />
Total<br />
Hedging 2<br />
Market Making 18<br />
23.2 Maturity Analysis<br />
Interest Rate Swaps<br />
Remaining Maturity<br />
--------------------------------------------------------- 2005 ---------------------------------------------------------<br />
Interest Rate Swaps Forward Rate Agreements FX Options<br />
No. of Notional No. of Notional No. of Notional<br />
Contracts Principal Contracts Principal Contracts Principal<br />
(Rupees in '000) (Rupees in '000) (Rupees in '000)<br />
618,637<br />
-<br />
-<br />
-<br />
-<br />
7,207,778<br />
618,637<br />
7,207,778<br />
Upto 1 Month -<br />
1 to 3 Month -<br />
3 to 6 Month 1<br />
6 Month to 1 Year 1<br />
1 to 2 Year 3<br />
2 to 3 Year 7<br />
3 to 5 Year 10<br />
5 to 10 Year -<br />
Above 10 Year -<br />
22<br />
Remaining Maturity<br />
Upto 1 Month -<br />
1 to 3 Month -<br />
3 to 6 Month -<br />
6 Month to 1 Year -<br />
1 to 2 Year 1<br />
2 to 3 Year 3<br />
3 to 5 Year 14<br />
5 to 10 Year 2<br />
Above 10 Year -<br />
20<br />
-<br />
-<br />
-<br />
-<br />
-<br />
-<br />
-<br />
-<br />
-<br />
-<br />
-<br />
-<br />
-<br />
-<br />
-<br />
-<br />
8<br />
-<br />
-<br />
-<br />
-<br />
8<br />
8<br />
8<br />
545,100<br />
-<br />
-<br />
-<br />
-<br />
545,100<br />
545,100<br />
545,100<br />
------------------------------------------------- 2006 -----------------------------------------------<br />
No. of Notional<br />
Mark to Market<br />
Contracts Principal Negative Positive Net<br />
------------------------------- (Rupees in '000) -----------------------------<br />
-<br />
-<br />
300,000<br />
500,000<br />
1,900,000<br />
1,595,000<br />
2,589,347<br />
-<br />
-<br />
6,884,347<br />
-<br />
-<br />
(155)<br />
(4,927)<br />
(16,880)<br />
(58,953)<br />
(73,751)<br />
-<br />
-<br />
(154,666)<br />
-<br />
-<br />
-<br />
-<br />
-<br />
-<br />
2,794<br />
-<br />
-<br />
2,794<br />
-<br />
-<br />
(155)<br />
(4,927)<br />
(16,880)<br />
(58,953)<br />
(70,957)<br />
-<br />
-<br />
(151,872)<br />
------------------------------------------------- 2005 -----------------------------------------------<br />
No. of Notional<br />
Mark to Market<br />
Contracts Principal Negative Positive Net<br />
------------------------------- (Rupees in '000) -----------------------------<br />
-<br />
-<br />
-<br />
-<br />
1,000,000<br />
2,500,000<br />
3,976,415<br />
350,000<br />
-<br />
7,826,415<br />
-<br />
-<br />
-<br />
-<br />
(18,381)<br />
(23,646)<br />
(115,879)<br />
(6,179)<br />
-<br />
(164,085)<br />
-<br />
-<br />
-<br />
-<br />
-<br />
-<br />
7,156<br />
657<br />
-<br />
7,813<br />
-<br />
-<br />
-<br />
-<br />
(18,381)<br />
(23,646)<br />
(108,723)<br />
(5,522)<br />
-<br />
(156,272)<br />
23.3 In addition the <strong>Bank</strong> enters into transactions relating to equity futures. The contract amount and fair values of equity<br />
futures outstanding at December 31, 2006 are stated in note 19.4 of these financial statements.<br />
27
NOTES TO THE FINANCIAL STATEMENTS FOR THE YEAR ENDED DECEMBER 31, 2006<br />
24. MARK-UP / RETURN / INTEREST EARNED<br />
On loans and advances<br />
- Customers 25,148,095<br />
- <strong>Financial</strong> institutions<br />
On investments in<br />
1,077,714<br />
26,225,809<br />
- Available for sale securities 3,542,217<br />
- Held to maturity securities 1,607,616<br />
- Associates and subsidiaries 31,513<br />
5,181,346<br />
On deposits with financial institutions 125,280<br />
On securities purchased under resale agreements 1,442,904<br />
Discount income 16,264<br />
32,991,603<br />
25. MARK-UP / RETURN / INTEREST EXPENSED<br />
On deposits 9,822,044<br />
On securities sold under repurchase agreements 1,020,155<br />
On other short - term borrowings 751,372<br />
On long - term borrowings 471,851<br />
Discount expense 61,387<br />
12,126,809<br />
26. GAIN / (LOSS) ON SALE OF SECURITIES<br />
Federal Government Securities<br />
Market Treasury Bills<br />
Pakistan Investment Bonds<br />
Fully paid - up ordinary shares<br />
Listed companies<br />
Unlisted companies<br />
Other securities<br />
27. OTHER INCOME<br />
2006 2005<br />
(Rupees in '000)<br />
(3,607)<br />
(98,397)<br />
(102,004)<br />
388,706<br />
-<br />
388,706<br />
(5,838)<br />
280,864<br />
Charges recovered from customers 1,140,184<br />
Rent on properties 92,975<br />
Liabilities no longer required written back<br />
Income from non-banking assets and profit from sale of or dealing<br />
-<br />
with such assets 14,393<br />
Others 49,444<br />
1,296,996<br />
28<br />
14,434,808<br />
604,879<br />
15,039,687<br />
2,554,113<br />
1,262,153<br />
28,790<br />
3,845,056<br />
159,977<br />
1,103,566<br />
10,574<br />
20,158,860<br />
4,995,752<br />
295,952<br />
699,716<br />
24,088<br />
30,440<br />
6,045,948<br />
1,918<br />
49,077<br />
50,995<br />
232,681<br />
-<br />
232,681<br />
98,743<br />
382,419<br />
1,083,091<br />
89,340<br />
25,000<br />
12,771<br />
-<br />
1,210,202
NOTES TO THE FINANCIAL STATEMENTS FOR THE YEAR ENDED DECEMBER 31, 2006<br />
28. ADMINISTRATIVE EXPENSES<br />
Personnel Cost<br />
Note 2006 2005<br />
(Rupees in '000)<br />
Salaries, allowances etc. 5,187,595<br />
Charge for compensated absences 201,501<br />
Medical expenses 263,931<br />
Contribution to defined contribution plan 104,287<br />
Reversal in respect of defined benefit obligations<br />
Premises Cost<br />
(80,616)<br />
5,676,698<br />
Rent, taxes, insurance, electricity etc. 948,757<br />
Depreciation 11.2 147,365<br />
Repairs and maintenance<br />
Other Operating Cost<br />
74,594<br />
1,170,716<br />
Outsourced service charges including sales commission 1,036,243<br />
Communications 491,627<br />
Advertisement and publicity 461,223<br />
Depreciation 11.2 403,309<br />
Stationery and printing 246,223<br />
<strong>Bank</strong>ing service charge 239,811<br />
Legal and professional charges 206,847<br />
Cash transportation charges 138,629<br />
Travelling 138,067<br />
Vehicle expenses 89,673<br />
Repairs and maintenance 85,742<br />
Training and seminar 82,507<br />
Office running expenses 64,217<br />
Entertainment 54,163<br />
Amortization 11.3 52,251<br />
Cartage, freight and conveyance 49,643<br />
Sub-ordinated debt issuance costs 27,804<br />
Auditors' remuneration 28.2 26,322<br />
Subscriptions 19,449<br />
Brokerage expenses 18,551<br />
Donations 28.1 11,350<br />
Computer expenses 6,476<br />
Non-executive directors' fee and allowances 117<br />
Finance charges on leased assets -<br />
Miscellaneous expenses 154,617<br />
4,104,861<br />
29<br />
10,952,275<br />
3,798,545<br />
129,628<br />
233,003<br />
89,423<br />
(101,279)<br />
4,149,320<br />
684,835<br />
127,000<br />
29,899<br />
841,734<br />
621,217<br />
387,739<br />
343,331<br />
285,541<br />
194,599<br />
150,399<br />
134,522<br />
116,980<br />
85,520<br />
56,305<br />
75,958<br />
35,509<br />
49,036<br />
46,234<br />
23,381<br />
36,174<br />
1,909<br />
25,708<br />
16,568<br />
14,865<br />
63,361<br />
13,872<br />
40<br />
3<br />
104,188<br />
2,882,959<br />
7,874,013
NOTES TO THE FINANCIAL STATEMENTS FOR THE YEAR ENDED DECEMBER 31, 2006<br />
28.1<br />
Donations were not made to any donee in which the bank or a director or his spouse had any interest.<br />
28.2 Auditors' remuneration<br />
Audit fee 5,100<br />
Fee for audit of EPZ branch 60<br />
Special certifications and sundry advisory services 200<br />
Fee for audit of overseas branches -<br />
Out of pocket expenses 968<br />
6,328<br />
Audit fee 4,730<br />
Fee for audit of EPZ branch 56<br />
Special certifications and sundry advisory services 725<br />
Fee for audit of overseas branches -<br />
Out of pocket expenses 1,677<br />
7,188<br />
29. OTHER PROVISIONS / WRITE OFFS<br />
A. F. Ferguson<br />
2006<br />
KPMG Taseer Total<br />
& Co. Hadi & Co.<br />
---------------------- (Rupees in '000) ----------------------<br />
5,100<br />
-<br />
-<br />
-<br />
889<br />
5,989<br />
10,200<br />
60<br />
200<br />
14,005<br />
1,857<br />
26,322<br />
A. F. Ferguson<br />
2005<br />
KPMG Taseer Total<br />
& Co. Hadi & Co.<br />
---------------------- (Rupees in '000) ----------------------<br />
4,730<br />
-<br />
725<br />
-<br />
1,676<br />
7,131<br />
Note 2006 2005<br />
(Rupees in '000)<br />
Provision against other assets - net 13.1 173,650<br />
Provision against off - balance sheet obligations 19.3 52,663<br />
Other provisions / write offs -<br />
226,313<br />
30. OTHER CHARGES<br />
Penalties imposed by State <strong>Bank</strong> of Pakistan 25,980<br />
9,460<br />
56<br />
1,450<br />
11,389<br />
3,353<br />
25,708<br />
87,998<br />
238,712<br />
8,699<br />
335,409<br />
31. TAXATION 2006<br />
Overseas Azad Kashmir Domestic Total<br />
-----------------------------------(Rupees in '000)--------------------------------<br />
Current tax 592,045<br />
Prior year tax 19,058<br />
Deferred taxation 274,554<br />
885,657<br />
354,752<br />
17,626<br />
111,043<br />
483,421<br />
Current tax 255,948 223,366<br />
Prior year tax 7,589 71,025<br />
Deferred taxation 617,100 188,634<br />
880,637 483,025<br />
2,465,994<br />
8,541<br />
979,911<br />
3,454,446<br />
7,066<br />
3,412,791<br />
45,225<br />
1,365,508<br />
4,823,524<br />
2005<br />
Overseas Azad Kashmir Domestic Total<br />
-----------------------------------(Rupees in '000)--------------------------------<br />
30<br />
19,434<br />
-<br />
2,149,520<br />
2,168,954<br />
498,748<br />
78,614<br />
2,955,254<br />
3,532,616
NOTES TO THE FINANCIAL STATEMENTS FOR THE YEAR ENDED DECEMBER 31, 2006<br />
31.1 Relationship between tax expense and accounting profit<br />
Accounting profit for the year 14,291,756<br />
Tax on income @ 35% (2005: 38%)<br />
Tax effect of items that are either not included in determining taxable profit or<br />
5,002,115<br />
taxed at reduced rates<br />
Deferred tax liability / (asset) recognized on assessed losses / temporary<br />
(281,864)<br />
differences 61,618<br />
Reversal of deferred tax liability on incremental depreciation (3,570)<br />
Prior year tax charge 45,225<br />
Tax charge 4,823,524<br />
32. BASIC / DILUTED EARNINGS PER SHARE<br />
Profit after taxation for the year 9,468,232<br />
Weighted average number of ordinary shares 647,500,000<br />
2006 2005<br />
(Rupees in '000)<br />
9,481,648<br />
3,603,026<br />
(56,248)<br />
(88,900)<br />
(3,876)<br />
78,614<br />
3,532,616<br />
5,949,032<br />
647,500,000<br />
Basic / diluted earnings per share 14.62 9.19<br />
33. CASH AND CASH EQUIVALENTS<br />
Cash and balances with treasury banks 48,939,840<br />
Balances with other banks 14,034,476<br />
62,974,316<br />
34. STAFF STRENGTH<br />
Permanent 9,734<br />
Contractual basis 4<br />
<strong>Bank</strong>'s own staff strength at the end of the year 9,738<br />
Outsourced 5,631<br />
Total number of employees at the end of the year 15,369<br />
35. DEFINED BENEFIT PLAN<br />
35.1 General description<br />
(Number of shares)<br />
(Rupees)<br />
2006 2005<br />
(Rupees in '000)<br />
(Number)<br />
34,074,786<br />
12,717,100<br />
46,791,886<br />
9,353<br />
1<br />
9,354<br />
4,125<br />
13,479<br />
The <strong>Bank</strong> operates a funded pension scheme established in 1986. The <strong>Bank</strong> also operates a funded gratuity scheme<br />
for new employees and those employees who have not opted for the pension scheme. Further, the <strong>Bank</strong> also<br />
operates a contributory benevolent fund scheme and provides post retirement medical to eligible retired employees.<br />
The benevolent fund plan and post retirement medical plan cover all the regular employees of the <strong>Bank</strong>. Actuarial<br />
valuation of the defined benefit plan scheme is carried out every year and the latest valuation was carried out as at<br />
December 31, 2006.<br />
31
NOTES TO THE FINANCIAL STATEMENTS FOR THE YEAR ENDED DECEMBER 31, 2006<br />
35.2 Principal actuarial assumptions<br />
The latest actuarial valuation was carried out as at December 31, 2006. Projected unit credit actuarial cost method,<br />
using following significant assumptions was used for the valuation of the defined benefit plans:<br />
2006 2005<br />
Discount rate 9% 9%<br />
Expected rate of return on plan assets 9% 9%<br />
Expected rate of salary increase 9% 9%<br />
Expected rate of pension increase 4% 4%<br />
35.3 Reconciliation of (receivable from) / payable to defined benefit plans<br />
Pension<br />
fund<br />
Present value of funded<br />
obligations 4,433,583<br />
Fair value of plan assets (7,116,577)<br />
(2,682,994)<br />
Present value of unfunded<br />
obligation -<br />
Net actuarial gains or<br />
(losses) not recognized 2,175,323<br />
(Receivable) / payable (507,671)<br />
Gratuity<br />
fund<br />
437,373<br />
(335,449)<br />
101,924<br />
-<br />
(103,944)<br />
(2,020)<br />
35.4 Movement in defined benefit obligation<br />
Pension<br />
fund<br />
Obligation at the beginning<br />
of the year 4,184,487<br />
Current service cost 19,626<br />
Interest cost 376,604<br />
Benefits paid by the fund (629)<br />
Benefits paid by the bank (385,005)<br />
Actuarial (gain)/ loss on<br />
obligation 238,500<br />
Obligation at the end<br />
of the year 4,433,583<br />
Gratuity<br />
fund<br />
381,983<br />
46,838<br />
34,378<br />
-<br />
(59,373)<br />
33,547<br />
437,373<br />
2006 2005<br />
Benevolent<br />
fund<br />
670,979<br />
(917,522)<br />
(246,543)<br />
-<br />
188,256<br />
(58,287)<br />
Benevolent<br />
fund<br />
665,686<br />
17,758<br />
59,912<br />
(597)<br />
Post<br />
retirement<br />
medical<br />
-<br />
-<br />
-<br />
1,298,048<br />
(71,717)<br />
1,226,331<br />
Post retirement<br />
medical<br />
1,263,750<br />
15,511<br />
113,738<br />
-<br />
Pension<br />
fund<br />
4,184,487<br />
Gratuity<br />
fund<br />
381,983<br />
(6,349,249) (345,484)<br />
(2,164,762) 36,499<br />
-<br />
1,818,703<br />
(346,059)<br />
Pension<br />
fund<br />
4,027,184<br />
21,416<br />
322,175<br />
(117,022)<br />
-<br />
(39,872)<br />
(3,373)<br />
Gratuity<br />
fund<br />
292,738<br />
40,895<br />
23,419<br />
(25,766)<br />
Benevolent<br />
fund<br />
665,686<br />
(773,365)<br />
(107,679)<br />
-<br />
98,124<br />
(9,555)<br />
Benevolent<br />
fund<br />
719,317<br />
18,345<br />
57,545<br />
(56,439)<br />
Post<br />
retirement<br />
medical<br />
---------------------------------------------------------- (Rupees in '000) ----------------------------------------------------------<br />
2006<br />
(60,716)<br />
(11,064)<br />
(57,318)<br />
(37,633)<br />
(11,580)<br />
(57,686)<br />
-<br />
50,697<br />
(8,456)<br />
(64,626)<br />
-<br />
-<br />
-<br />
1,263,750<br />
(109,350)<br />
1,154,400<br />
Post retirement<br />
medical<br />
---------------------------------------------------------- (Rupees in '000) ----------------------------------------------------------<br />
670,979<br />
32<br />
1,298,048<br />
4,184,487<br />
381,983<br />
2005<br />
665,686<br />
1,256,633<br />
19,922<br />
100,531<br />
-<br />
(48,863)<br />
(64,473)<br />
1,263,750
NOTES TO THE FINANCIAL STATEMENTS FOR THE YEAR ENDED DECEMBER 31, 2006<br />
35.5 Movement in fair value of plan assets<br />
Pension<br />
fund<br />
Gratuity<br />
fund<br />
Benevolent<br />
fund<br />
Post retirement<br />
medical<br />
Pension<br />
fund<br />
Gratuity<br />
fund<br />
Benevolent<br />
fund<br />
Post retirement<br />
medical<br />
---------------------------------------------------------- (Rupees in '000) ----------------------------------------------------------<br />
Fair value at the beginning<br />
of the year 6,349,249 345,484 773,365 - 6,496,932 278,261 698,839 -<br />
Expected return on<br />
plan assets 571,432<br />
Contribution by the<br />
bank -<br />
Contribution by the<br />
employees -<br />
Amount paid by the<br />
fund to the bank (516,973)<br />
Benefits paid by the<br />
fund (629)<br />
Actuarial gain/ (loss)<br />
on plan assets 713,498<br />
Fair value at the end of<br />
the year 7,116,577<br />
31,094<br />
51,259<br />
-<br />
(61,696)<br />
-<br />
(30,692)<br />
335,449<br />
69,603<br />
10,000<br />
10,290<br />
(26,129)<br />
(597)<br />
80,990<br />
917,522<br />
35.6 Movement in (receivable) / payable to defined benefit plans<br />
Pension<br />
fund<br />
Opening balance (346,059)<br />
Charge/ (reversal) for the<br />
year (293,580)<br />
Contribution to / (refund<br />
from) fund made during<br />
the year 516,973<br />
Benefits paid (385,005)<br />
Closing balance (507,671)<br />
Gratuity<br />
fund<br />
(3,373)<br />
50,289<br />
10,437<br />
(59,373)<br />
(2,020)<br />
2006 2005<br />
2006<br />
Benevolent<br />
fund<br />
(9,555)<br />
(4,113)<br />
16,129<br />
(60,748)<br />
-<br />
-<br />
-<br />
-<br />
-<br />
-<br />
Post<br />
retirement<br />
medical<br />
1,154,400<br />
129,249<br />
-<br />
(57,318)<br />
523,293<br />
-<br />
-<br />
(360,000)<br />
(117,022)<br />
(193,954)<br />
6,349,249<br />
Pension<br />
fund<br />
(384,854)<br />
(309,773)<br />
360,000<br />
(11,432)<br />
25,938<br />
41,749<br />
-<br />
(1,309)<br />
(25,766)<br />
26,611<br />
345,484<br />
Gratuity<br />
fund<br />
(1,309)<br />
38,376<br />
(40,440)<br />
-<br />
55,907<br />
10,541<br />
10,541<br />
(612)<br />
(56,439)<br />
54,588<br />
773,365<br />
Benevolent<br />
fund<br />
(612)<br />
9,442<br />
(9,929)<br />
(8,456)<br />
-<br />
-<br />
-<br />
-<br />
-<br />
-<br />
Post retirement<br />
medical<br />
---------------------------------------------------------- (Rupees in '000) ----------------------------------------------------------<br />
(58,287)<br />
33<br />
1,226,331<br />
(346,059)<br />
(3,373)<br />
2005<br />
(9,555)<br />
1,076,874<br />
125,269<br />
-<br />
(47,743)<br />
1,154,400
NOTES TO THE FINANCIAL STATEMENTS FOR THE YEAR ENDED DECEMBER 31, 2006<br />
35.7 Charge for defined benefit plans<br />
Pension<br />
fund<br />
Current service cost 19,626<br />
Interest cost 376,604<br />
Expected return on plan<br />
assets (571,432)<br />
Actuarial (gains) and<br />
losses (118,378)<br />
Employees' contribution -<br />
(293,580)<br />
35.8 Actual return on plan assets<br />
Pension<br />
fund<br />
Expected return on plan<br />
assets 571,432<br />
Actuarial gain/ (loss) on<br />
plan assets 713,498<br />
1,284,930<br />
Gratuity<br />
fund<br />
46,838<br />
34,378<br />
(31,094)<br />
167<br />
-<br />
50,289<br />
Gratuity<br />
fund<br />
31,094<br />
(30,692)<br />
402<br />
Benevolent<br />
fund<br />
17,758<br />
59,912<br />
(69,603)<br />
(1,890)<br />
(10,290)<br />
(4,113)<br />
Benevolent<br />
fund<br />
69,603<br />
80,990<br />
150,593<br />
Post retirement<br />
medical<br />
15,511<br />
113,738<br />
-<br />
-<br />
-<br />
129,249<br />
Post retirement<br />
medical<br />
-<br />
-<br />
-<br />
Pension<br />
fund<br />
21,416<br />
322,175<br />
(523,293)<br />
(130,071)<br />
-<br />
(309,773)<br />
Pension<br />
fund<br />
523,293<br />
(193,954)<br />
329,339<br />
35.9 Five year data on surplus/ deficit of the plans and experience adjustments<br />
Present value of defined benefit obligation (4,433,583)<br />
Fair value of plan assets 7,116,577<br />
Surplus / (Deficit) 2,682,994<br />
Experience adjustments on plan liabilities [loss/(gain)] 238,500<br />
Experience adjustments on plan assets [loss/(gain)] (411,713)<br />
2006 2005<br />
Gratuity<br />
fund<br />
40,895<br />
23,419<br />
(25,938)<br />
-<br />
-<br />
38,376<br />
Gratuity<br />
fund<br />
25,938<br />
26,611<br />
Benevolent<br />
fund<br />
18,345<br />
57,545<br />
(55,907)<br />
-<br />
(10,541)<br />
9,442<br />
Benevolent<br />
fund<br />
55,907<br />
54,588<br />
Post retirement<br />
medical<br />
---------------------------------------------------------- (Rupees in '000) ----------------------------------------------------------<br />
52,549<br />
110,495<br />
19,922<br />
100,531<br />
-<br />
4,816<br />
-<br />
125,269<br />
Amongst the defined benefit plans, currently the pension, gratuity and benevolent fund plans are funded. The actual<br />
return earned on the assets during the year are:<br />
2006 2005<br />
Post retirement<br />
medical<br />
---------------------------------------------------------- (Rupees in '000) ----------------------------------------------------------<br />
2006 2005 2004 2003 2002<br />
------------------------------------- (Rupees in '000) -----------------------------------<br />
34<br />
(4,184,487)<br />
6,349,249<br />
2,164,762<br />
251,108<br />
(438,971)<br />
Pension Fund<br />
(4,027,184)<br />
6,541,166<br />
2,513,982<br />
292,061<br />
(534,091)<br />
(3,363,652)<br />
5,985,788<br />
2,622,136<br />
(213,654)<br />
(402,753)<br />
-<br />
-<br />
-<br />
(4,388,718)<br />
5,256,228<br />
867,510<br />
(54,125)<br />
(164,095)
NOTES TO THE FINANCIAL STATEMENTS FOR THE YEAR ENDED DECEMBER 31, 2006<br />
Present value of defined benefit obligation (437,373)<br />
Fair value of plan assets 335,449<br />
Surplus / (Deficit) (101,924)<br />
Experience adjustments on plan liabilities [loss/(gain)] 33,547<br />
Experience adjustments on plan assets [loss/(gain)] 10,979<br />
Present value of defined benefit obligation (670,979)<br />
Fair value of plan assets 917,522<br />
Surplus / (Deficit) 246,543<br />
Experience adjustments on plan liabilities [loss/(gain)] (11,064)<br />
Experience adjustments on plan assets [loss/(gain)] (64,187)<br />
Present value of defined benefit obligation (1,298,048)<br />
Experience adjustments on plan liabilities [loss/(gain)] (37,633)<br />
35.10 Effects of a 1% movement in assumed medical cost trend rates<br />
35.11 Components of plan assets as a percentage of total plan assets<br />
Pension<br />
fund<br />
Gratuity<br />
fund<br />
Benevolent<br />
fund<br />
2006 2005<br />
Gratuity Fund<br />
2004 2003 2002<br />
------------------------------------- (Rupees in '000) -----------------------------------<br />
(381,983)<br />
345,484<br />
(36,499)<br />
50,697<br />
757<br />
(292,738)<br />
324,220<br />
31,482<br />
1,029<br />
(1,023)<br />
(279,509)<br />
373,367<br />
93,858<br />
(39,872)<br />
13,931 -<br />
(257,955)<br />
333,334<br />
75,379<br />
(26,482)<br />
2006 2005<br />
Benevolent Fund<br />
2004 2003 2002<br />
------------------------------------- (Rupees in '000) -----------------------------------<br />
(665,686)<br />
773,365<br />
107,679<br />
33,543<br />
(59,679)<br />
(719,317)<br />
694,182<br />
(25,135)<br />
286,097<br />
(60,667)<br />
(582,699)<br />
607,327<br />
24,628<br />
(89,812)<br />
(46,803)<br />
(607,590)<br />
525,797<br />
(81,793)<br />
143,160<br />
(26,378)<br />
Post retirement medical<br />
2006 2005 2004 2003 2002<br />
------------------------------------- (Rupees in '000) -----------------------------------<br />
Post retirement<br />
medical<br />
Government securities 88.80% 48.00% 95.00% -<br />
Units of mutual funds 0.01% 23.00% 2.40% -<br />
Ordinary shares of listed<br />
companies 0.00% 0.00% 2.50% -<br />
Term finance certificates 0.00% 28.00% -<br />
Others (including bank<br />
balances) 11.19% 1.00% 0.10% -<br />
100.00% 100.00% 100.00% -<br />
(1,263,750)<br />
(12,195)<br />
Pension<br />
fund<br />
(1,256,633)<br />
36,389<br />
Gratuity<br />
fund<br />
(1,064,831)<br />
160,963<br />
Benevolent<br />
fund<br />
(1,065,729)<br />
307,721<br />
Annual medical expense limit is based on frozen non-monetized basic pay of employees as on June 30, 2001.<br />
Accordingly, movement in medical cost trend rates would not affect current service cost, interest cost and defined benefit<br />
obligation.<br />
2006<br />
Post retirement<br />
medical<br />
---------------------------------------------------------- (Rupees in '000) ----------------------------------------------------------<br />
89.40% 50.00% 94.00% -<br />
0.00% 34.00% 2.90% -<br />
0.00% 0.00% 2.50% -<br />
0.00% 14.00% 0.00% -<br />
10.60% 2.00% 0.60% -<br />
100.00% 100.00% 100.00% -<br />
As per the actuarial recommendations the expected return on plan assets was taken as 9% per annum. The expected<br />
return on plan assets was determined by considering the expected returns available on the assets underlying the current<br />
investment policy.<br />
35<br />
2005
NOTES TO THE FINANCIAL STATEMENTS FOR THE YEAR ENDED DECEMBER 31, 2006<br />
35.12 Expected contributions to be paid to the funds in the next financial year<br />
The <strong>Bank</strong> contributes to the pension and gratuity funds according to the actuary's advice. Contribution to the benevolent<br />
fund is made by the <strong>Bank</strong> as per the rates set out in the benevolent scheme. Based on actuarial advice the management<br />
estimate that the charge in respect of defined benefit plans for the year ending December 31, 2007 would be as follows:<br />
Pension<br />
fund<br />
Expected charge for the year (384,593)<br />
36. OTHER EMPLOYEE BENEFITS<br />
36.1 Defined contribution plan<br />
36.2 Employee compensated absences<br />
37. COMPENSATION OF DIRECTORS AND EXECUTIVES<br />
Fees -<br />
Managerial remuneration 48,385<br />
Charge for defined benefit plan 455<br />
Contribution to defined contribution plan 1,380<br />
Rent and house maintenance 1,440<br />
Utilities 303<br />
Medical 21<br />
Reimbursement of children's education fees 1,035<br />
Vehicle running, maintenance and others 447<br />
53,466<br />
Number of persons 1<br />
Gratuity<br />
fund<br />
71,777<br />
Benevolent<br />
fund<br />
(23,689)<br />
Post retirement<br />
medical<br />
131,518<br />
President / Chief<br />
Executive<br />
Directors Executives<br />
2006 2005 2006 2005 2006 2005<br />
--------------------------------------- (Rupees in '000) ---------------------------------------<br />
-<br />
19,604<br />
524<br />
903<br />
1,970<br />
346<br />
33<br />
43<br />
639<br />
24,062<br />
1<br />
--------------------------- (Rupees in '000) -------------------------<br />
The <strong>Bank</strong> operates a contributory provident fund scheme for 6,255 (2005: 5,495) employees who are not in the pension<br />
scheme. The employer and employee both contribute 8.33% of the basic salaries to the funded scheme every month.<br />
The liability of the <strong>Bank</strong> in respect of long-term employee compensated absences is determined based on actuarial<br />
valuation carried out using Projected Unit Credit Method. The liability of the bank as per the latest actuarial valuation<br />
carried out as at December 31, 2006 amounted to Rs. 1,074.258 million (2005: Rs 1,037.5 million) which has been fully<br />
provided by the bank. The charge for the year in respect of these absences amounted to Rs.201.501 million (2005: Rs<br />
129.628 million) which is included in note 28 to these financial statements.<br />
117<br />
-<br />
-<br />
-<br />
-<br />
-<br />
-<br />
-<br />
-<br />
117<br />
3<br />
40<br />
-<br />
-<br />
-<br />
-<br />
-<br />
-<br />
-<br />
-<br />
40<br />
3<br />
2007<br />
-<br />
394,833<br />
6,850<br />
20,759<br />
116,143<br />
25,810<br />
25,810<br />
-<br />
33,476<br />
623,681<br />
269<br />
-<br />
276,608<br />
9,247<br />
15,782<br />
85,224<br />
18,939<br />
18,939<br />
-<br />
12,634<br />
437,373<br />
The Chief Executive and certain executives are provided with free use of the bank's maintained cars and household<br />
equipments. In addition as mentioned in note 19.1 an amount of Rs 559 million (including an amount of Rs 270 million in<br />
respect of year ended December 31, 2005) has also been charged in these financial statements in respect of new<br />
employee bonus scheme introduced in the current year. The individual entitlements under the scheme will be<br />
determined by a separate fund which the bank intends to form for the management of the scheme.<br />
36<br />
207
NOTES TO THE FINANCIAL STATEMENTS FOR THE YEAR ENDED DECEMBER 31, 2006<br />
38. FAIR VALUE OF FINANCIAL INSTRUMENTS<br />
The fair value of traded investments other than those classified as held to maturity is based on quoted market price.<br />
Fair value of unquoted equity investments is determined on the basis of break-up value of these investments as per<br />
the latest available audited financial statements.<br />
Fair value of fixed term loans, other assets, other liabilities and fixed term deposits cannot be calculated with<br />
sufficient reliability due to absence of current and active market for assets and liabilities and reliable data regarding<br />
market rates for similar instruments. The provision for impairment of loans and advances has been calculated in<br />
accordance with the bank's accounting policy as stated in note 5.4 to these financial statements.<br />
The repricing profile, effective rates and maturity are stated in notes 43.2.3 and 43.3.1 respectively.<br />
In the opinion of the management, the fair value of the remaining financial assets and liabilities are not significantly<br />
different from their carrying values since assets and liabilities are either short term in nature or in the case of<br />
customer loans and deposits are frequently repriced.<br />
39. SEGMENT DETAILS WITH RESPECT TO BUSINESS ACTIVITIES<br />
Corporate<br />
Finance<br />
Trading & Sales Retail <strong>Bank</strong>ing<br />
Commercial<br />
<strong>Bank</strong>ing<br />
------------------------------------------ (Rupees in '000) ----------------------------------------<br />
Total income 14,025,291 3,847,341 10,267,444 11,799,915<br />
Total expenses 11,296,419 3,309,286 8,265,009 2,777,521<br />
Net income / (loss) 2,728,872 538,055 2,002,435 9,022,394<br />
Segment assets (gross of NPL provision) 152,767,328 129,467,258 76,513,514 76,755,442<br />
Segment non performing loans 7,497,348 40,382 2,056,954 6,660,725<br />
Segment provision required (NPL) 6,627,909 34,138 1,600,564 3,920,724<br />
Segment liabilities 133,477,487 124,240,234 74,932,683 60,806,416<br />
Segment return on assets (ROA) (%) 10% 7% 15% 8%<br />
Segment cost of funds (%) 8% 7% 9% 3%<br />
----------------------------------- 2005 -----------------------------------<br />
Corporate<br />
Commercial<br />
Trading & Sales Retail <strong>Bank</strong>ing<br />
Finance<br />
<strong>Bank</strong>ing<br />
------------------------------------------ (Rupees in '000) ----------------------------------------<br />
Total income 7,170,360 6,494,464 5,353,980 6,153,089<br />
Total expenses 5,213,383 5,372,866 3,822,147 1,281,847<br />
Net income / (loss) 1,956,977 1,121,598 1,531,833 4,871,242<br />
Segment assets (gross of NPL provision) 126,053,796 106,828,073 64,135,407 63,333,665<br />
Segment non performing loans 7,789,630 41,956 2,208,388 6,920,391<br />
Segment provision required (NPL) 7,249,974 37,342 1,725,969 4,288,705<br />
Segment liabilities 110,696,378 103,035,682 61,220,267 50,428,354<br />
Segment return on assets (ROA) (%) 8% 5% 12% 6%<br />
Segment cost of funds (%) 6% 5% 7% 2%<br />
40. TRUST ACTIVITIES<br />
The <strong>Bank</strong> is not engaged in any significant trust activities. However, it acts as security agent for some of the Term<br />
Finance Certificates it arranges and distributes on behalf of its customers.<br />
41. RELATED PARTY TRANSACTIONS<br />
----------------------------------- 2006 -----------------------------------<br />
The <strong>Bank</strong> has related party relationship with its associated undertakings, subsidiary companies (refer note 9.1),<br />
employee benefit plans (refer note 35) and its directors and executive officers (including their associates).<br />
<strong>Bank</strong>ing transactions with related parties are executed substantially on the same terms, including mark-up rates and<br />
collateral, as those prevailing at the time for comparable transactions with unrelated parties and do not involve more<br />
than a normal risk. Details of loans and advances to the key management personnel, the companies or firms in which<br />
the directors of the group are interested as directors, partners or in case of private companies as members are given<br />
in note 10.6 to these financial statements.<br />
37
NOTES TO THE FINANCIAL STATEMENTS FOR THE YEAR ENDED DECEMBER 31, 2006<br />
Contributions to and accruals in respect of staff retirements and other benefit plans are made in accordance with the<br />
actuarial valuations / terms of the contribution plan (refer note 35 to these financial statements for the details of plans).<br />
Remuneration to the executives, disclosed in note 37 to these financial statements are determined in accordance with the<br />
terms of their appointment.<br />
Details of transactions with related parties during the year, other than those which have been disclosed elsewhere in these<br />
financial statements, are as follows:<br />
2006 2005<br />
Key<br />
management<br />
personnel<br />
Subsidiaries Associates<br />
Other related<br />
parties<br />
Key<br />
management<br />
personnel<br />
Subsidiaries Associates<br />
Other related<br />
parties<br />
---------------------------------------------------------- (Rupees in '000) ----------------------------------------------------------<br />
Advances<br />
At January 01 80,694<br />
-<br />
- 1,818,141 61,709<br />
-<br />
- 2,542,969<br />
Given during the year 45,557<br />
-<br />
-<br />
-<br />
31,112<br />
-<br />
- 1,863,892<br />
Repaid during the year (32,603)<br />
-<br />
- (817,576) (12,127) -<br />
- (2,588,720)<br />
At December 31 93,648<br />
-<br />
- 1,000,565 80,694<br />
-<br />
- 1,818,141<br />
Deposits<br />
At January 01 15,542<br />
Received during the year 189,638<br />
Withdrawn during the year (191,931)<br />
At December 31 13,249<br />
Placements made during the year -<br />
Placements settled during the year<br />
Maximum amount of a placement<br />
-<br />
made during the year -<br />
Borrowings made during the year<br />
Borrowing settlement during<br />
-<br />
the year -<br />
Mark-up / return / interest earned 3,651<br />
Mark-up / return / interest expensed<br />
Reimbursement of liaison office<br />
expenses paid to Dubai and Abu<br />
-<br />
Dhabi Group -<br />
Investment made during year<br />
Payable in respect of acquisition<br />
-<br />
of shares -<br />
Distribution commission income -<br />
Distribution commission receivable -<br />
Other receivables -<br />
Dividend income received -<br />
Other expenses paid -<br />
Remuneration paid 189,407<br />
Post employment benefits 7,506<br />
42. CAPITAL ADEQUACY<br />
42.1 Capital Management<br />
4,146<br />
4,907,637<br />
(4,906,124)<br />
5,659<br />
375,007,932<br />
373,529,852<br />
2,394,927<br />
1,272,600<br />
1,272,600<br />
31,229<br />
1,369<br />
-<br />
-<br />
30,000<br />
1,411<br />
5,979<br />
2,815<br />
145,572<br />
-<br />
-<br />
-<br />
-<br />
138,201<br />
(135,732)<br />
2,469<br />
500,000<br />
500,000<br />
-<br />
-<br />
-<br />
2,349<br />
-<br />
-<br />
590,000<br />
-<br />
-<br />
-<br />
-<br />
-<br />
22,620<br />
-<br />
-<br />
1,524,441<br />
149,323,191<br />
(147,480,585)<br />
3,367,047<br />
-<br />
-<br />
-<br />
-<br />
-<br />
100,545<br />
115,530<br />
36,170<br />
-<br />
-<br />
-<br />
-<br />
-<br />
-<br />
-<br />
-<br />
-<br />
13,415<br />
121,382<br />
(119,255)<br />
15,542<br />
-<br />
-<br />
-<br />
-<br />
-<br />
-<br />
-<br />
-<br />
-<br />
-<br />
-<br />
-<br />
-<br />
-<br />
-<br />
66,750<br />
3,829<br />
39,320<br />
66,747<br />
(101,921)<br />
4,146<br />
41,752,807<br />
41,752,807<br />
2,981,500<br />
-<br />
-<br />
13,806<br />
-<br />
27<br />
60,000<br />
30,000<br />
2,607<br />
1,866<br />
403<br />
55,420<br />
-<br />
-<br />
-<br />
-<br />
-<br />
-<br />
-<br />
-<br />
-<br />
-<br />
-<br />
-<br />
-<br />
-<br />
-<br />
250,000<br />
-<br />
-<br />
-<br />
-<br />
-<br />
-<br />
-<br />
-<br />
796,564<br />
30,792,517<br />
(30,064,640)<br />
1,524,441<br />
-<br />
-<br />
-<br />
-<br />
-<br />
70,002<br />
28,975<br />
29,789<br />
180,000<br />
The <strong>Bank</strong>'s objectives when managing capital, which is a broader concept than the 'equity' on the face of the balance sheet<br />
are:<br />
- To comply with the capital requirements set by the regulators of the banking markets where the <strong>Bank</strong> operates;<br />
- To safeguard the <strong>Bank</strong>'s ability to continue as a going concern so that it can continue to provide returns for<br />
shareholders and benefits for others stakeholders; and<br />
- To maintain a strong capital base to support the development of its business.<br />
38<br />
-<br />
-<br />
-<br />
100<br />
-<br />
-<br />
-<br />
-
NOTES TO THE FINANCIAL STATEMENTS FOR THE YEAR ENDED DECEMBER 31, 2006<br />
42.2<br />
In accordance with BSD Circular No. 6 dated October 28, 2005 the State <strong>Bank</strong> of Pakistan has raised the minimum<br />
paid-up capital requirement for locally incorporated banks to Rs. 6 billion (net of losses) to be achieved in a phased<br />
manner by December 31, 2009. The minimum capital requirement to be achieved by December 31, 2006 is Rs. 3<br />
billion. In addition all banking companies carrying on business in Pakistan are required to maintain capital and<br />
unencumbered general reserves the amount of which should at least be equivalent to 8% of the risk weighted<br />
assets of the banking company.<br />
The adequacy of <strong>UBL</strong>’s capital is monitored using, among other measures, the rules and ratios established by the<br />
State <strong>Bank</strong> of Pakistan. The ratios compare the amount of eligible capital with the total of risk-weighted assets<br />
(RWAs). <strong>UBL</strong> monitors and reports its capital ratios under SBP rules, which ultimately determine the regulatory<br />
capital required to be maintained by <strong>Bank</strong>s and DFIs.<br />
Eligible capital consists of two parts. Tier 1 capital comprises share capital, share premium, reserve for bonus<br />
shares, general reserves and retained earnings. Certain adjustments are made to profit and reserves, in line with<br />
SBP recommendations, as prescribed by SBP circulars. Tier 2 capital includes general provisions, revaluation<br />
reserves, exchange translation reserve and subordinated long-term debt. Total regulatory capital is to be at least<br />
8% of RWAs and <strong>UBL</strong>’s capital is well over this requirement as shown in note 42.2. <strong>UBL</strong> will continue to maintain<br />
this requirement either through its risk management strategies or by increasing the capital requirements in line with<br />
business and capital needs.<br />
<strong>UBL</strong> has already successfully issued TFCs in the past and continues to be in a position, if needed, to raise capital<br />
in the financial markets.<br />
<strong>UBL</strong> is in the process of developing an internal economic capital model, where each business unit will be allocated<br />
capital according to the risks generated including incorporating the diversification concept of each risk type.<br />
Capital Adequacy Ratio<br />
The capital to risk weighted assets ratio, calculated in accordance with the State <strong>Bank</strong> of Pakistan's guidelines on<br />
capital adequacy was as follows:<br />
2006 2005<br />
(Rupees in '000)<br />
Regulatory capital base<br />
Tier I Capital<br />
Share capital 6,475,000 5,180,000<br />
Reserves 7,029,233 5,135,587<br />
Unappropriated profits 12,429,853 6,055,813<br />
Less: Adjustments<br />
- Investments in equity of subsidiary companies engaged<br />
25,934,086 16,371,400<br />
in banking and financial activities (1,660,848) (1,660,848)<br />
- Deficit on account of revaluation of investments classified as AFS (164,607) (59,732)<br />
(1,825,455) (1,720,580)<br />
Total Tier I Capital 24,108,631 14,650,820<br />
Tier II Capital<br />
Subordinated debt (upto 50% of total Tier I Capital) 5,860,474<br />
General provisions (subject to 1.25% of total risk weighted assets) 1,163,019<br />
Exchange translation reserve 1,269,640<br />
Revaluation reserves 1,341,909<br />
Total Tier II Capital 9,635,042<br />
Eligible Tier III Capital -<br />
Total regulatory capital (a) 33,743,673<br />
39<br />
3,999,192<br />
-<br />
1,089,874<br />
1,484,425<br />
6,573,491<br />
-<br />
21,224,311
NOTES TO THE FINANCIAL STATEMENTS FOR THE YEAR ENDED DECEMBER 31, 2006<br />
42.2.1<br />
42.2.2<br />
42.2.3<br />
42.2.4<br />
42.2.5<br />
Risk weighted exposures<br />
Credit risk<br />
Balance sheet items:<br />
Cash and balances with<br />
treasury banks 45,944,979<br />
Balances with other banks 42.2.1 17,029,337<br />
Lendings to financial institutions 29,572,070<br />
Investments 42.2.2 65,465,380<br />
Advances 42.2.3 245,918,252<br />
Fixed assets 5,234,463<br />
Deferred tax asset - net 906,661<br />
Other assets<br />
Off - balance sheet items:<br />
42.2.4 10,477,200<br />
420,548,342<br />
Loan repayment guarantees 42.2.5 23,780,520<br />
Performance bonds etc 42.2.6 32,614,417<br />
Stand by letters of credit 42.2.7 83,371,268<br />
Outstanding interest rate swaps 6,884,347<br />
Outstanding foreign exchange<br />
contracts 42.2.8<br />
Purchase 50,666,568<br />
Sales 50,249,750<br />
100,916,318<br />
2006 2005<br />
Note Book Value<br />
Risk Adjusted<br />
Value<br />
Book Value<br />
Risk Adjusted<br />
Value<br />
--------------------------------------------- (Rupees in '000) ---------------------------------------------<br />
247,566,870<br />
-<br />
3,405,867<br />
7,203,011<br />
9,795,125<br />
204,168,103<br />
5,234,463<br />
906,661<br />
9,885,850<br />
240,599,080<br />
23,610,280<br />
14,497,856<br />
15,338,387<br />
250,519<br />
312,206<br />
296,318<br />
608,524<br />
54,305,566<br />
Credit risk weighted exposures 294,904,646<br />
Market Risk<br />
General market risk 158,767<br />
Specific market risk 37,258<br />
Foreign exchange risk 532,613<br />
Total capital charge for market risk (b) 728,638<br />
Market risk weighted exposures (b x 12.5) 9,107,975<br />
Total risk weighted exposures (c) 304,012,621<br />
30,503,136<br />
16,288,750<br />
17,867,552<br />
59,852,302<br />
200,474,573<br />
4,449,324<br />
2,273,005<br />
7,829,770<br />
339,538,412<br />
11,473,990<br />
20,713,703<br />
63,693,491<br />
7,826,415<br />
29,006,474<br />
35,412,209<br />
64,418,683<br />
168,126,282<br />
-<br />
3,260,171<br />
4,628,859<br />
8,720,805<br />
160,686,787<br />
4,449,324<br />
2,273,005<br />
7,092,967<br />
191,111,918<br />
11,469,020<br />
8,079,153<br />
12,216,631<br />
281,421<br />
178,086<br />
260,102<br />
438,188<br />
32,484,413<br />
223,596,331<br />
147,078<br />
39,665<br />
275,146<br />
461,889<br />
5,773,613<br />
229,369,944<br />
Capital Adequacy Ratio (a / c x 100) 11.10% 9.25%<br />
Balances with other banks includes balances with National <strong>Bank</strong> of Pakistan in local currency current account<br />
amounting to Rs 2,994.861 million (2005: Rs 3,571.650 million) classified under cash and balances with treasury<br />
banks in these financial statements.<br />
Investments exclude investment in equity of subsidiary companies amounting to Rs 1,660.848 million (2005: Rs<br />
1,660.848 million) and held-for-trading portfolio amounting to Rs. 134.110 million (2005: Rs 1,513.794 million) . The<br />
held-for-trading portfolio is subject to market risk and is included in the computation of capital charge for market<br />
Advances secured against government securities / own deposits / cash margin amounting to Rs 2,554.660 million<br />
(2005: Rs 4,335.897 million) have been deducted from gross advances. Advances are gross of general reserve for<br />
consumer financing amounting to Rs 1,163.019 million (2005: Nil). This reserve has been added to supplementary<br />
capital.<br />
Other assets include branch adjustment account amounting to Rs. 414.734 million (2005: Nil) classified under other<br />
liabilities in these financial statements.<br />
Cash margins amounting to Rs 1,362.709 million (2005: Rs 1,163.393 million) have been deducted from loan<br />
repayment guarantees.<br />
42.2.6 Cash margins amounting to Rs 628.335 million (2005: Nil) have been deducted from performance bonds etc.<br />
42.2.7 Cash margins amounting to Rs 683.503 million (2005: Rs 1,051.483 million) have been deducted from stand by<br />
letters of credit.<br />
40
NOTES TO THE FINANCIAL STATEMENTS FOR THE YEAR ENDED DECEMBER 31, 2006<br />
42.2.8<br />
Forward foreign exchange contracts with maturity of less than or equal to 14 days amounting to Rs. 11,918.824<br />
million (2005: Rs. 8,122.465 million) have been excluded from the above in accordance with the guidelines for<br />
determination of CAR prescribed by SBP.<br />
43. RISK MANAGEMENT<br />
This section presents information about <strong>UBL</strong>’s exposure to and its management and control of risks, in particular<br />
the primary risks associated with its use of financial instruments:<br />
43.1 Credit risk<br />
- Credit risk is the risk of loss resulting from client or counterparty default<br />
- Market risk is exposure to market variables such as interest rates, exchange rates and equity indices<br />
- Liquidity risk is the risk that <strong>UBL</strong> may be unable to meet its payment obligations when due<br />
- Operational risk is the risk of loss resulting from inadequate or failed internal processes, people and systems<br />
or from external events, and therefore includes legal risk<br />
Representations of risk are for a given period and <strong>UBL</strong>’s risk management will constantly evolve as its business<br />
activities change in response to credit, market, product and other developments. There have been many initiatives<br />
started by the <strong>Bank</strong> including IT projects for replacing the core <strong>Bank</strong>ing system, business process re-engineering<br />
and inventorying the risks and controls within the <strong>Bank</strong>'s existing business and process units. All of these<br />
initiatives, as they partially or completely roll out, will have a direct impact on the risk management function within<br />
Credit risk is the risk of loss to <strong>UBL</strong> as a result of failure by a client or counterparty to meet its contractual<br />
obligations. It is inherent in loans, commitments to lend and contingent liabilities, such as letters of credit – and in<br />
traded products – derivative contracts such as forwards, swaps and options, repurchase agreements (repos and<br />
reverse repos) and securities borrowing and lending transactions.<br />
The Risk and Credit Policy Group, has the Credit Administration, Market and Treasury Risk, Commercial and<br />
FIRMU Credit Policy, Consumer and Retail Credit, Credit Risk Management and Operational Risk and Basel II<br />
functions reporting directly to the Risk and Credit Policy Group Executive. There are senior managers heading<br />
each risk category, managing a team solely dedicated to risk management and to maintain a sound and effective<br />
risk management culture. The role of the Risk and Credit Policy Group particularly includes:<br />
- Participation in portfolio planning and management.<br />
- Establishment of credit policies and standards that conform to regulatory requirements and the <strong>Bank</strong>’s overall<br />
objectives.<br />
- Working with Business Groups in keeping aggregate credit risk well within the <strong>Bank</strong>’s risk taking capacity.<br />
- Developing and maintaining Credit Approval Authority structure.<br />
- Approving major credits.<br />
- Granting approval authority to qualified and experienced individuals.<br />
- Reviewing the adequacy of credit training across the <strong>Bank</strong>.<br />
- Organizing portfolio reviews focusing on quality assessment, risk profiles, industry concentrations, etc.<br />
- Setting systems to identify significant portfolio indicators, problem credits and level of provisioning required.<br />
Counterparty ratings, are obtained through the two local SBP authorized External Credit Rating Agencies; JCR<br />
VIS and PACRA and other international sources such as Standard and Poors, Fitch and Moody’s. Credit risk<br />
assessment and the continuous monitoring of counterparty and portfolio credit exposures is carried out by the<br />
Credit Risk Management function.<br />
The wholesale portfolio, which includes corporate, commercial and agricultural loans are ideally collateralized by<br />
cash equivalents, fixed and current assets including property plant and equipment, and land. Loans to individuals<br />
are typically secured by autos for car loans and private or income producing real estate is secured by a mortgage<br />
over the relevant property.<br />
41
NOTES TO THE FINANCIAL STATEMENTS FOR THE YEAR ENDED DECEMBER 31, 2006<br />
<strong>UBL</strong> manages limits and controls concentrations of credit risk as identified, in particular to individual<br />
counterparties and groups, and to industries and countries, where appropriate. Concentrations of credit risk exist if<br />
clients are engaged in similar activities, or are located in the same geographic region or have comparable<br />
economic characteristics such that their ability to meet contractual obligations would be similarly affected by<br />
changes in economic, political or other conditions. <strong>UBL</strong> sets limits on its credit exposure to counterparty groups,<br />
by industry, product, counterparty and geographical location, in line with SBP standards. Limits are also applied in<br />
a variety of forms to portfolios or sectors where <strong>UBL</strong> considers it appropriate to restrict credit risk concentrations<br />
or areas of higher risk, or to control the rate of portfolio growth.<br />
<strong>UBL</strong> classifies a claim as impaired if it considers it likely that it will suffer a loss on that claim as a result of the<br />
obligor’s inability to meet its commitments (including interest payments, principal repayments or other payments<br />
due) after realization of any available collateral. Loans carried at amortized cost are classified as non-performing<br />
where payment of interest, principal or fees is overdue by more than 90 days. Allowances or provisions are<br />
determined such that the carrying values of impaired claims are consistent with the requirements of SBP. The<br />
authority to establish allowances, provisions and credit valuation adjustments for impaired claims, is vested in<br />
Finance Division and is according to SBP regulations. Details are given in note 10 to these financial statements.<br />
43.1.1 Segmental information<br />
43.1.1.1 Segments by class of business<br />
Chemical and pharmaceuticals 4,511,482<br />
Agri business 7,094,810<br />
Textile spinning 15,907,533<br />
Textile weaving 10,183,090<br />
Textile composite 14,621,254<br />
Textile others 13,042,842<br />
Cement 4,152,150<br />
Sugar 8,724,207<br />
Shoes and leather garments 2,794,697<br />
Automobile and transportation equipment 2,682,292<br />
<strong>Financial</strong> 4,907,293<br />
Insurance -<br />
Electronics and electrical appliances 4,145,485<br />
Production and transmission of energy 13,627,321<br />
Paper and allied 2,232,501<br />
Surgical and metal 430,915<br />
Contractors 3,121,222<br />
Wholesale traders 12,066,514<br />
Fertilizer dealers 3,495,328<br />
Sports goods 600,862<br />
Food industries 4,989,463<br />
Airlines 1,529,443<br />
Cables 378,700<br />
Construction 7,412,466<br />
Containers and ports 678,956<br />
Engineering 3,716,097<br />
Glass and Allied 236,206<br />
Hotels 1,329,976<br />
Infrastructure 3,731,454<br />
Media 1,163,559<br />
Polyester and fibre 5,632,711<br />
Telecommunication 4,860,597<br />
Individuals 53,574,542<br />
Others 43,333,509<br />
260,909,477<br />
Gross advances<br />
2006<br />
Deposits<br />
Contingencies and<br />
commitments<br />
Rupees in '000 Percent Rupees in '000 Percent Rupees in '000 Percent<br />
42<br />
1.73% 3,385,450<br />
2.72% 16,129,894<br />
6.10% 578,445<br />
3.90% 859,102<br />
5.60% 799,958<br />
5.00% 1,184,991<br />
1.59% 1,307,382<br />
3.34% 1,052,314<br />
1.07% 1,034,507<br />
1.03% 3,086,128<br />
1.88% 6,169,928<br />
0.00% 9,099,143<br />
1.59% 2,331,234<br />
5.22% 11,518,679<br />
0.86% 1,705,473<br />
0.17% 409,751<br />
1.20% 9,130,375<br />
4.62% 20,251,886<br />
1.34% 2,742,458<br />
0.23% 189,950<br />
1.91% 971,182<br />
0.59% 1,028,614<br />
0.15% 70,630<br />
2.84% 4,221,903<br />
0.26% 335,051<br />
1.42% 2,349,450<br />
0.09% 86,001<br />
0.51% 407,649<br />
1.43% 4,462,439<br />
0.45% 774,282<br />
2.16% 23,793<br />
1.86% 2,406,121<br />
20.53% 180,742,330<br />
16.61% 44,231,380<br />
100% 335,077,873<br />
1.01% 3,144,371<br />
4.81% 333,860<br />
0.17% 1,020,821<br />
0.26% 1,427,245<br />
0.24% 943,938<br />
0.35% 3,750,257<br />
0.39% 1,321,918<br />
0.31% 503,673<br />
0.31% 113,422<br />
0.92% 1,755,318<br />
1.84% 145,192,308<br />
2.72% 510<br />
0.70% 1,289,381<br />
3.44% 10,220,940<br />
0.51% 7,330,271<br />
0.12% 443,919<br />
2.72% 2,651,680<br />
6.04% 1,381,908<br />
0.82% 856,482<br />
0.06% 25,140<br />
0.29% 978,629<br />
0.31% 16,864<br />
0.02% 448,706<br />
1.26% 18,288,833<br />
0.10% 11,109<br />
0.70% 1,316,492<br />
0.03% 116,763<br />
0.12% 2,582<br />
1.33% 6,268<br />
0.23% 267,043<br />
0.01% 177,910<br />
0.72% 4,358,017<br />
53.94% 3,154,182<br />
13.20% 73,049,080<br />
100% 285,899,840<br />
1.10%<br />
0.12%<br />
0.36%<br />
0.50%<br />
0.33%<br />
1.31%<br />
0.46%<br />
0.18%<br />
0.04%<br />
0.61%<br />
50.78%<br />
0.00%<br />
0.45%<br />
3.58%<br />
2.56%<br />
0.16%<br />
0.93%<br />
0.48%<br />
0.30%<br />
0.01%<br />
0.34%<br />
0.01%<br />
0.16%<br />
6.40%<br />
0.00%<br />
0.46%<br />
0.04%<br />
0.00%<br />
0.00%<br />
0.09%<br />
0.06%<br />
1.52%<br />
1.10%<br />
25.55%<br />
100%
NOTES TO THE FINANCIAL STATEMENTS FOR THE YEAR ENDED DECEMBER 31, 2006<br />
Gross advances<br />
2005<br />
Deposits<br />
Contingencies and<br />
commitments<br />
Rupees in '000 Percent Rupees in '000 Percent Rupees in '000 Percent<br />
---------------------------------------------- (Rupees in '000) ---------------------------------------------<br />
Chemical and pharmaceuticals 4,519,197 2.06% 2,068,372<br />
Agri business 7,267,123 3.31% 16,148,663<br />
Textile spinning 20,800,926 9.49% 932,308<br />
Textile weaving 10,129,530 4.62% 431,727<br />
Textile composite 15,323,544 6.99% 793,144<br />
Textile others 9,058,847 4.13% 1,199,851<br />
Cement 5,605,446 2.56% 1,388,644<br />
Sugar 4,926,779 2.25% 1,003,565<br />
Shoes and leather garments 2,959,030 1.35% 1,419,547<br />
Automobile and transportation equipment 17,190,233 7.84% 2,387,889<br />
<strong>Financial</strong> 5,420,870 2.47% 5,756,213<br />
Insurance 54,447 0.02% 7,949,837<br />
Electronics and electrical appliances 2,712,010 1.24% 1,937,391<br />
Production and transmission of energy 2,975,521 1.36% 15,389,571<br />
Paper and allied 1,232,621 0.56% 880,748<br />
Surgical and metal 1,976,967 0.90% 342,919<br />
Contractors 1,679,640 0.77% 6,400,646<br />
Wholesale traders 15,375,249 7.01% 15,744,320<br />
Fertilizer dealers 906,756 0.41% 4,121,160<br />
Sports goods 632,811 0.29% 206,891<br />
Food industries 3,723,894 1.70% 1,657,190<br />
Airlines 1,373,927 0.63% 1,072,230<br />
Cables 450,100 0.21% 43,088<br />
Construction 13,760,142 6.28% 5,124,897<br />
Containers and ports 300,000 0.14% 22,603<br />
Engineering 288,433 0.13% 3,384,066<br />
Glass and Allied 35,712 0.02% 96,059<br />
Hotels 571,470 0.26% 1,071,395<br />
Infrastructure 0.00% 2,175,662<br />
Media 458,746 0.21% 658,451<br />
Polyester and fibre - 0.00% 62,952<br />
Telecommunication 5,818,502 2.65% 879,751<br />
Individuals 22,349,780 10.19% 154,957,725<br />
Others 39,397,194 17.97% 31,516,824<br />
219,275,447 100% 289,226,299<br />
43.1.1.2 Segment by Sector<br />
0.72% 1,858,752<br />
5.58% 1,987,455<br />
0.32% 1,541,572<br />
0.15% 240,840<br />
0.27% 1,018,389<br />
0.41% 1,706,837<br />
0.48% 727,334<br />
0.35% 19,228<br />
0.49% 263,216<br />
0.83% 2,359,732<br />
1.99% 91,674,255<br />
2.75% 32,989<br />
0.67% 494,506<br />
5.32% 4,786,428<br />
0.30% 316,211<br />
0.12% 342,823<br />
2.21% 3,175,151<br />
5.44% 3,885,616<br />
1.42% 69,540<br />
0.07% -<br />
0.57% 392,343<br />
0.37% 385<br />
0.01% 343,944<br />
1.77% 416,141<br />
0.01% 500<br />
1.17% 4,954,642<br />
0.03% 19,009<br />
0.37% 2,631,880<br />
0.75% 38,406<br />
0.23% 90,208<br />
0.02% 306,152<br />
0.30% 3,642,497<br />
53.58% 8,378,670<br />
10.90% 49,140,563<br />
100% 186,856,214<br />
0.99%<br />
1.06%<br />
0.83%<br />
0.13%<br />
0.55%<br />
0.91%<br />
0.39%<br />
0.01%<br />
0.14%<br />
1.26%<br />
49.06%<br />
0.02%<br />
0.26%<br />
2.56%<br />
0.17%<br />
0.18%<br />
1.70%<br />
2.08%<br />
0.04%<br />
0.00%<br />
0.21%<br />
0.00%<br />
0.18%<br />
0.22%<br />
0.00%<br />
2.65%<br />
0.01%<br />
1.41%<br />
0.02%<br />
0.05%<br />
0.16%<br />
1.95%<br />
4.48%<br />
26.30%<br />
100%<br />
Gross advances<br />
2006<br />
Deposits<br />
Contingencies and<br />
commitments<br />
Rupees in '000 Percent Rupees in '000 Percent Rupees in '000 Percent<br />
Public/Government 27,328,192 10.47% 53,541,219 15.98% 60,804,698 21.27%<br />
Private 233,581,285 89.53% 281,536,654 84.02% 225,095,142 78.73%<br />
260,909,477 100% 335,077,873 100% 285,899,840 100%<br />
260,909,477<br />
335,077,873<br />
2005<br />
Gross advances Deposits<br />
Contingencies and<br />
commitments<br />
Rupees in '000 Percent Rupees in '000 Percent Rupees in '000 Percent<br />
Public/Government 24,344,709<br />
Private 194,930,738<br />
219,275,447<br />
43<br />
11.10% 43,707,375<br />
88.90% 245,518,924<br />
100% 289,226,299<br />
15.11% 52,493,676<br />
84.89% 134,362,538<br />
100% 186,856,214<br />
28.09%<br />
71.91%<br />
100%
NOTES TO THE FINANCIAL STATEMENTS FOR THE YEAR ENDED DECEMBER 31, 2006<br />
43.1.2 Details of non performing advances and specific provisions by class of business segment<br />
Classified<br />
Advances<br />
Chemical and pharmaceuticals 751,726<br />
Agri business 913,266<br />
Textile spinning 1,538,999<br />
Textile weaving 253,351<br />
Textile composite 754,257<br />
Textile others 2,257,048<br />
Cement 24,507<br />
Sugar 37,187<br />
Shoes and leather garments 146,517<br />
Automobile and transportation equipment 144,950<br />
<strong>Financial</strong> 138,369<br />
Insurance -<br />
Electronics and electrical appliances 96,467<br />
Production and transmission of energy 154,429<br />
Paper and allied 180,046<br />
Surgical and metal 952<br />
Contractor -<br />
Wholesale traders 550,518<br />
Fertilizer dealers 263<br />
Sports goods 180,208<br />
Food industries 769,500<br />
Airlines -<br />
Cables -<br />
Construction 451,311<br />
Containers and ports -<br />
Engineering 23,446<br />
Steel 271,447<br />
Glass and Allied -<br />
Hotels 245,802<br />
Infrastructure -<br />
Media 94,004<br />
Polyester and fibre 1,789<br />
Telecommunication -<br />
Individuals 3,155,992<br />
Others 3,119,058<br />
16,255,409<br />
43.1.3 Details of non performing advances and specific provision by sector<br />
Public/Government 60,750<br />
Private 16,194,659<br />
16,255,409<br />
Specific<br />
Provision<br />
Held<br />
639,609<br />
348,712<br />
1,225,149<br />
184,686<br />
617,940<br />
1,787,406<br />
22,037<br />
37,187<br />
89,922<br />
142,581<br />
69,435<br />
-<br />
93,614<br />
154,429<br />
53,102<br />
952<br />
-<br />
370,297<br />
263<br />
2,552<br />
361,644<br />
-<br />
-<br />
293,529<br />
-<br />
6,953<br />
254,447<br />
-<br />
66,992<br />
-<br />
18,947<br />
1,789<br />
-<br />
2,486,333<br />
2,852,828<br />
12,183,335<br />
-<br />
12,183,335<br />
12,183,335<br />
Classified<br />
Advances<br />
794,614<br />
965,370<br />
1,626,803<br />
267,805<br />
797,289<br />
2,348,718<br />
25,905<br />
39,309<br />
154,876<br />
153,220<br />
146,263<br />
-<br />
101,971<br />
154,429<br />
56,132<br />
1,006<br />
-<br />
581,927<br />
278<br />
190,489<br />
813,402<br />
-<br />
-<br />
529,912<br />
-<br />
7,903<br />
286,934<br />
-<br />
95,803<br />
-<br />
103,718<br />
1,891<br />
-<br />
3,408,530<br />
3,305,868<br />
16,960,365<br />
75,000<br />
16,885,365<br />
16,960,365<br />
Specific<br />
Provision<br />
Held<br />
--------------------------------- (Rupees in '000) --------------------------------<br />
44<br />
2006 2005<br />
706,876<br />
385,385<br />
1,353,995<br />
204,109<br />
682,928<br />
1,965,688<br />
24,355<br />
41,098<br />
99,379<br />
157,576<br />
76,737<br />
-<br />
103,459<br />
154,429<br />
58,687<br />
1,052<br />
409,241<br />
291<br />
2,820<br />
399,678<br />
-<br />
-<br />
307,439<br />
-<br />
7,684<br />
281,207<br />
-<br />
71,969<br />
20,940<br />
1,977<br />
-<br />
2,766,510<br />
3,016,481<br />
13,301,990<br />
-<br />
13,301,990<br />
13,301,990
NOTES TO THE FINANCIAL STATEMENTS FOR THE YEAR ENDED DECEMBER 31, 2006<br />
43.1.4 Geographical segment analysis<br />
Profit before<br />
2006<br />
Total assets Net assets Contingencies<br />
taxation employed employed & commitments<br />
------------------------------------ (Rupees in '000) ------------------------------------<br />
Pakistan<br />
Domestic Operations 11,809,015 347,463,419 28,152,873 224,632,873<br />
Asia Pacific (including South Asia) 38,323 1,674,855<br />
28,987<br />
80,775<br />
Overseas<br />
11,847,338 349,138,274 28,181,860 224,713,648<br />
<strong>United</strong> States of America 176,205 1,302,816<br />
93,905<br />
42,481<br />
Middle East 2,268,213 72,879,117 1,587,622 61,143,711<br />
2,444,418 74,181,933 1,681,527 61,186,192<br />
14,291,756 423,320,207 29,863,387 285,899,840<br />
Profit before<br />
2005<br />
Total assets Net assets Contingencies<br />
taxation employed employed & commitments<br />
------------------------------------ (Rupees in '000) ------------------------------------<br />
Pakistan<br />
Domestic Operations 7,557,326 290,806,691 13,090,538 173,163,465<br />
Asia Pacific (including South Asia) 35,099 2,475,089<br />
57,067 125,993<br />
Overseas<br />
7,592,425 293,281,780 13,147,605 173,289,458<br />
<strong>United</strong> States of America 167,893 1,669,054 406,213<br />
91,734<br />
Middle East 1,721,330 52,098,117 8,114,452 13,475,022<br />
1,889,223 53,767,171 8,520,665 13,566,756<br />
9,481,648 347,048,951 21,668,270 186,856,214<br />
9,481,648 347,048,951 21,668,270<br />
Total assets employed include intra group items of Rs Nil<br />
43.2 Market Risk<br />
Market risk is the risk of loss arising from movements in market variables including observable variables such as<br />
interest rates, exchange rates and equity indices, and others which may be only indirectly observable such as<br />
volatilities and correlations.<br />
Market risk measures and controls are applied at the portfolio level, and concentration limits and other controls are<br />
applied where necessary to individual risk types, to particular books and to specific exposures. Portfolio risk measures<br />
are common to all market risks, but concentration limits and other controls are tailored to the nature of the activities<br />
and the risks they create.<br />
Trading activities are centered in the Treasury & Capital Market (TCM) and include market making, facilitation of client<br />
business and proprietary position taking. <strong>UBL</strong> is active in the cash and derivative markets for equities, fixed income<br />
and interest rate products and foreign exchange.<br />
Controls are also applied to prevent any undue risk concentrations in trading books, taking into account variations in<br />
price volatility and market depth and liquidity. They include controls on exposure to individual market risk variables,<br />
such as individual interest or exchange rates (’risk factors’), and on positions in the securities of individual issuers.<br />
Treasury and Market Risk (TMR) division performs all market risk management activities within <strong>UBL</strong>. The Division is<br />
composed of two wings, i.e., Treasury Middle Office and Market Risk Management. The Market Risk department is<br />
responsible for developing and reviewing market risk policies, strategies, processes, conducting market research,<br />
involved in model construction & testing etc. Middle Office is taking care of the operational side. It has to ensure<br />
monitoring and implementation of market risk and other policies, escalation of any deviation to senior management,<br />
compilation and MIS reporting, etc.<br />
45
NOTES TO THE FINANCIAL STATEMENTS FOR THE YEAR ENDED DECEMBER 31, 2006<br />
The scope of market risk management is as follows:<br />
-<br />
-<br />
-<br />
-<br />
To keep the market risk exposure within the bank’s risk appetite as assigned by the Board of Directors (BOD).<br />
All the market risk policies are approved by the BOD and implementation is done by the senior management<br />
through MRC, Treasury and Market Risk division.<br />
Various limits have been assigned to different businesses on a product-portfolio basis. All the products have been<br />
approved through product programs, where all the risk have been identified and limits and parameters to operate<br />
have been set.<br />
Any transaction/product falling beyond the Product Policy Manuals must be approved through separate<br />
transaction/product memo.<br />
43.2.1 Foreign Exchange Risk<br />
Pakistan Rupee 335,107,027<br />
303,647,299<br />
2,063,995<br />
33,523,723<br />
US Dollar 18,245,213<br />
18,687,061<br />
(6,185,767)<br />
(6,627,615)<br />
Pound Sterling 2,301,068<br />
2,731,873<br />
2,048,560<br />
1,617,755<br />
Euro 695,082<br />
1,707,797<br />
1,103,693<br />
90,978<br />
Japanese Yen 239,126<br />
4,461<br />
(264,715)<br />
(30,050)<br />
Other Currencies 66,732,691<br />
66,678,329<br />
1,234,234<br />
1,288,596<br />
423,320,207<br />
393,456,820<br />
-<br />
29,863,387<br />
423,320,207<br />
393,456,820<br />
29,863,387<br />
Assets Liabilities<br />
2005<br />
Off - balance sheet<br />
items<br />
Net foreign<br />
currency exposure<br />
--------------------------------------------------- (Rupees in '000) -------------------------------------------------<br />
Pakistan Rupee 288,001,610<br />
261,217,900<br />
(4,078,046)<br />
22,705,664<br />
US Dollar 20,374,084<br />
25,637,948<br />
3,299,203<br />
(1,964,661)<br />
Pound Sterling 4,491,815<br />
3,421,554<br />
(645,619)<br />
424,642<br />
Euro 1,901,391<br />
1,390,159<br />
514,839<br />
1,026,071<br />
Japanese Yen 465,140<br />
1,952<br />
488,031<br />
951,219<br />
Other Currencies 31,814,911<br />
33,711,168<br />
421,592<br />
(1,474,665)<br />
347,048,951<br />
325,380,681<br />
-<br />
21,668,270<br />
347,048,951 325,380,681 21,668,270<br />
Foreign Exchange Risk is the risk of loss resulting from changes in exchange rates. Foreign exchange positions are<br />
reported on a consolidated basis and limits are used to monitor exposure in individual currencies.<br />
43.2.2 Equity position risk<br />
Assets Liabilities<br />
2006<br />
Off - balance sheet<br />
items<br />
Net foreign<br />
currency exposure<br />
--------------------------------------------------- (Rupees in '000) -------------------------------------------------<br />
The <strong>Bank</strong> is an active participant in currency cash and derivatives markets and carries currency risk from these<br />
trading activities, conducted primarily in the Treasury & Capital Markets. These trading exposures are subject to<br />
prescribed stress, sensitivity and concentration limits.<br />
The <strong>Bank</strong>'s reporting currency is the PKR, but its assets, liabilities, income and expense are denominated in many<br />
currencies. Reported profits or losses are translated daily into PKR, reducing volatility in <strong>UBL</strong>’s earnings from<br />
subsequent changes in exchange rates within the limits regulated by SBP. Treasury also, from time to time,<br />
proactively hedges significant expected foreign currency earnings / costs (mainly USD, EUR and GBP) within a time<br />
horizon up to one year, in accordance with the instructions of the SBP and subject to pre-defined limits.<br />
Equity position risk in trading book arises due to changes in prices of individual stocks or levels of equity indices.<br />
The <strong>Bank</strong>’s equity trading book comprises of Treasury Capital Market’s (TCM) Held for trading (HFT) & Available for<br />
Sale (AFS) portfolios and Investment <strong>Bank</strong>ing Group’s (IBG) AFS portfolio. Objective of Treasury Capital Market’s<br />
HFT portfolio is to take advantages of short-term capital gains, while the AFS portfolio is maintained with a mediumterm<br />
view of capital gains and dividend income. IBG maintaines its AFS portfolio with a medium-long term view of<br />
capital gains and higher dividend yields. Separate product program manuals have been developed to discuss in<br />
detail the objectives/policies, risks/mitigants, limits/controls for equity trading portfolios of TCM and IBG.<br />
46
NOTES TO THE FINANCIAL STATEMENTS FOR THE YEAR ENDED DECEMBER 31, 2006<br />
43.2.3<br />
Mismatch of Interest Rate Sensitive Assets and Liabilities<br />
Effective<br />
yield/ Interest<br />
rate<br />
%<br />
On-balance sheet financial instruments<br />
Assets<br />
Cash and balances with<br />
Total<br />
treasury banks 4.3% 48,939,840<br />
Balances with other banks 7.0% 14,034,476<br />
Lendings to financial institutions 8.0% 29,572,070<br />
Investments<br />
Advances<br />
8.0% 67,260,338<br />
Performing 11.0% 243,237,819<br />
Non Performing 0% 4,072,074<br />
Other assets 0% 7,127,308<br />
414,243,925<br />
Liabilities<br />
Bills payable 0% 4,560,649<br />
Borrowings 3.0%-14.% 38,544,920<br />
Deposits and other accounts 0.2%-10.7% 335,077,873<br />
Subordinated loans 10.20% 5,998,344<br />
Other liabilities 0% 6,594,551<br />
390,776,337<br />
On-balance sheet gap 23,467,588<br />
Non financial net assets 6,395,799<br />
Total net assets 29,863,387<br />
Off-balance sheet financial instruments<br />
Foreign currency forward purchases 55,369,664<br />
Foreign currency forward sales (57,465,479)<br />
Derivatives - Long position 6,181,818<br />
Derivatives - Short position (6,181,818)<br />
Forward Purchase of Govt. Securities 5,634,902<br />
Forward Sale of Govt. Securities (2,833,400)<br />
Sale of Govt. Securities not yet purchased (1,067,735)<br />
Off-balance sheet gap (362,048)<br />
Upto One<br />
month<br />
20,522,278<br />
13,132,759<br />
20,496,941<br />
1,710,884<br />
51,991,738<br />
-<br />
-<br />
107,854,600<br />
-<br />
20,688,136<br />
67,849,675<br />
-<br />
-<br />
88,537,811<br />
19,316,789<br />
23,960,216<br />
(29,273,594)<br />
-<br />
(1,930,000)<br />
5,586,200<br />
(2,833,400)<br />
-<br />
(4,490,578)<br />
Total Yield/Interest Risk Sensitivity Gap 14,826,211<br />
Cumulative Yield/Interest Risk<br />
Sensitivity Gap 14,826,211<br />
Over 1 month<br />
to 3 months<br />
-<br />
-<br />
3,149,180<br />
1,202,307<br />
103,852,271<br />
-<br />
-<br />
108,203,758<br />
-<br />
10,835,255<br />
100,364,959<br />
424<br />
-<br />
111,200,638<br />
(2,996,880)<br />
21,643,738<br />
(17,368,333)<br />
800,000<br />
(2,778,333)<br />
-<br />
-<br />
-<br />
2,297,072<br />
(699,808)<br />
14,126,403<br />
Over 3<br />
months to 6<br />
months<br />
Yield risk is the risk of decline in earnings due to adverse movement of the yield curve.<br />
---------------------------------------------------------- 2006 ----------------------------------------------------------<br />
Exposed to Yield / Interest risk<br />
-<br />
-<br />
529,243<br />
9,768,021<br />
37,108,564<br />
-<br />
-<br />
47,405,828<br />
-<br />
1,451,561<br />
21,887,391<br />
2,000,000<br />
-<br />
25,338,952<br />
22,066,876<br />
8,973,761<br />
(8,960,479)<br />
300,000<br />
(673,485)<br />
48,702<br />
-<br />
-<br />
Over 6<br />
months to 1<br />
year<br />
-<br />
-<br />
2,026,964<br />
26,157,905<br />
37,108,563<br />
-<br />
-<br />
65,293,432<br />
-<br />
2,903,122<br />
31,662,983<br />
424<br />
-<br />
34,566,529<br />
30,726,903<br />
791,949<br />
(1,863,073)<br />
500,000<br />
-<br />
-<br />
-<br />
-<br />
Over 1 year<br />
to 2 years<br />
-<br />
-<br />
1,476,884<br />
7,307,394<br />
7,421,712<br />
-<br />
-<br />
16,205,990<br />
-<br />
2,666,846<br />
5,834,948<br />
848<br />
-<br />
8,502,642<br />
7,703,348<br />
-<br />
-<br />
1,100,000<br />
(800,000)<br />
-<br />
-<br />
-<br />
Over 2 year<br />
to 3 years<br />
-<br />
-<br />
1,792,858<br />
3,443,386<br />
4,947,808<br />
-<br />
-<br />
10,184,052<br />
-<br />
-<br />
3,397,385<br />
848<br />
-<br />
3,398,233<br />
6,785,819<br />
-<br />
-<br />
1,595,000<br />
-<br />
-<br />
(99,285)<br />
Over 3 year<br />
to 5 years<br />
---------------------------------------------------------- (Rupees in '000) ----------------------------------------------------------<br />
(311,501)<br />
21,755,375<br />
35,881,778<br />
(571,124)<br />
30,155,779<br />
66,037,557<br />
300,000<br />
8,003,348<br />
74,040,905<br />
Interest rate risk is the risk that the value of the financial instrument will fluctuate due to changes in the market interest rates.<br />
47<br />
1,495,715<br />
8,281,534<br />
82,322,439<br />
-<br />
-<br />
100,000<br />
4,524,915<br />
807,163<br />
-<br />
-<br />
5,432,078<br />
-<br />
-<br />
4,123,586<br />
666,315<br />
-<br />
4,789,901<br />
642,177<br />
-<br />
-<br />
1,886,818<br />
-<br />
-<br />
-<br />
1,886,818<br />
2,528,995<br />
84,851,434<br />
Over 5 year<br />
to 10 years<br />
-<br />
-<br />
-<br />
6,478,904<br />
-<br />
-<br />
-<br />
6,478,904<br />
-<br />
-<br />
3,628,725<br />
3,329,485<br />
-<br />
6,958,210<br />
(479,306)<br />
-<br />
-<br />
-<br />
-<br />
-<br />
(968,450)<br />
(968,450)<br />
(1,447,756)<br />
83,403,678<br />
Over 10 years<br />
-<br />
-<br />
-<br />
1,764<br />
-<br />
-<br />
-<br />
1,764<br />
-<br />
-<br />
-<br />
-<br />
-<br />
-<br />
1,764<br />
-<br />
-<br />
-<br />
-<br />
-<br />
-<br />
-<br />
-<br />
1,764<br />
83,405,442<br />
Non-interest<br />
bearing<br />
financial<br />
instruments<br />
28,417,562<br />
901,717<br />
-<br />
6,664,858<br />
-<br />
4,072,074<br />
7,127,308<br />
47,183,519<br />
4,560,649<br />
96,328,221<br />
6,594,551<br />
107,483,421<br />
(60,299,902)<br />
-<br />
-<br />
-<br />
-<br />
-<br />
-<br />
-<br />
-<br />
(60,299,902)<br />
23,105,540
NOTES TO THE FINANCIAL STATEMENTS FOR THE YEAR ENDED DECEMBER 31, 2006<br />
On-balance sheet financial<br />
instruments<br />
Effective<br />
yield/ Interest<br />
rate<br />
%<br />
Assets<br />
Cash and balances with<br />
treasury banks 2.90% 34,062,679<br />
Balances with other banks 3.80% 12,729,207<br />
Lendings to financial institutions 6.50% 17,867,553<br />
Investments<br />
Advances<br />
5.80% 63,026,944<br />
Performing 8.50% 201,152,095<br />
Non performing - 3,658,375<br />
Other assets - 6,502,315<br />
338,999,168<br />
Liabilities<br />
Bills payable - 4,159,967<br />
Borrowings 8.30% 21,790,480<br />
Deposits and other accounts 2.00% 289,226,298<br />
Subordinated loans 9.10% 3,999,192<br />
Other liabilities - 2,713,786<br />
321,889,723<br />
On-balance sheet gap 17,109,445<br />
Non financial net assets 4,558,825<br />
Total net assets 21,668,270<br />
Off-balance sheet financial instruments<br />
Total<br />
---------------------------------------------------------- 2005 --------------------------------------------------------<br />
Exposed to Yield / Interest risk<br />
Over 1 Over 3 Over 6<br />
Upto One<br />
Over 1 year Over 2 year Over 3 year Over 5 year<br />
month to 3 months to 6 months to 1<br />
month<br />
to 2 years to 3 years to 5 years to 10 years<br />
months months year<br />
---------------------------------------------------------- (Rupees in '000) --------------------------------------------------------<br />
8,658,736<br />
7,866,999<br />
7,458,465<br />
29,984<br />
42,241,940<br />
-<br />
-<br />
66,256,124<br />
-<br />
13,122,108<br />
36,508,750<br />
-<br />
49,630,858<br />
16,625,266<br />
-<br />
-<br />
4,477,823<br />
3,400,374<br />
84,483,880<br />
-<br />
-<br />
92,362,077<br />
-<br />
6,227,906<br />
73,017,499<br />
414<br />
79,245,819<br />
13,116,258<br />
-<br />
-<br />
982,939<br />
571,259<br />
31,672,814<br />
-<br />
-<br />
33,227,012<br />
-<br />
2,440,466<br />
26,383,541<br />
-<br />
28,824,007<br />
4,403,005<br />
Foreign currency forward purchases 34,338,395 18,977,689 10,520,397 3,043,521<br />
Foreign currency forward sales (38,202,754) (17,364,715) (11,760,808) (6,068,509)<br />
Interest rate derivatives - long position 8,477,530 350,000 350,000<br />
-<br />
Interest rate derivatives - short position (8,486,415) (3,019,319) (3,498,207) (1,968,889)<br />
Forward purchase of Govt. securities -<br />
-<br />
-<br />
-<br />
Forward sale of Govt. securities -<br />
-<br />
-<br />
-<br />
Sale of Govt. securities not yet purchased (1,544,194) -<br />
-<br />
-<br />
Off-balance sheet gap (5,417,438) (1,056,345) (4,388,618) (4,993,877)<br />
Total yield / interest risk sensitivity gap 15,568,921<br />
Cumulative yield / interest risk sensitivity gap 15,568,921<br />
8,727,640<br />
24,296,561<br />
Yield risk is the risk of decline in earnings due to adverse movement of the yield curve.<br />
(590,872)<br />
23,705,689<br />
-<br />
-<br />
347,517<br />
27,677,624<br />
28,672,814<br />
-<br />
-<br />
56,697,955<br />
-<br />
-<br />
32,516,665<br />
414<br />
32,517,079<br />
24,180,876<br />
1,796,788<br />
(3,008,722)<br />
-<br />
-<br />
-<br />
-<br />
-<br />
(1,211,934)<br />
22,968,942<br />
46,674,631<br />
-<br />
-<br />
4,600,809<br />
6,703,727<br />
6,034,563<br />
-<br />
-<br />
17,339,099<br />
-<br />
-<br />
15,656,128<br />
-<br />
15,656,128<br />
1,682,971<br />
-<br />
-<br />
1,000,000<br />
-<br />
-<br />
-<br />
-<br />
1,000,000<br />
2,682,971<br />
49,357,602<br />
Interest rate risk is the risk that the value of the financial instrument will fluctuate due to changes in the market interest rates.<br />
48<br />
-<br />
-<br />
-<br />
5,818,347<br />
4,023,042<br />
-<br />
-<br />
9,841,389<br />
-<br />
-<br />
5,718,709<br />
-<br />
5,718,709<br />
4,122,680<br />
-<br />
-<br />
2,500,000<br />
-<br />
-<br />
-<br />
-<br />
2,500,000<br />
6,622,680<br />
55,980,282<br />
-<br />
-<br />
-<br />
7,144,839<br />
4,023,042<br />
-<br />
-<br />
11,167,881<br />
-<br />
-<br />
4,718,709<br />
3,312<br />
4,722,021<br />
6,445,860<br />
-<br />
-<br />
3,927,530<br />
-<br />
-<br />
-<br />
(328,581)<br />
3,598,949<br />
10,044,809<br />
66,025,091<br />
-<br />
-<br />
-<br />
7,531,208<br />
-<br />
-<br />
-<br />
7,531,208<br />
-<br />
-<br />
7,984,169<br />
3,995,052<br />
11,979,221<br />
(4,448,013)<br />
-<br />
-<br />
350,000<br />
-<br />
-<br />
-<br />
(1,215,613)<br />
(865,613)<br />
(5,313,626)<br />
60,711,465<br />
Over 10<br />
years<br />
-<br />
-<br />
-<br />
2,000<br />
-<br />
-<br />
-<br />
2,000<br />
-<br />
-<br />
-<br />
-<br />
-<br />
2,000<br />
-<br />
-<br />
-<br />
-<br />
-<br />
-<br />
-<br />
-<br />
2,000<br />
60,713,465<br />
Non-interest<br />
bearing<br />
financial<br />
instruments<br />
25,403,943<br />
4,862,208<br />
-<br />
4,147,582<br />
-<br />
3,658,375<br />
6,502,315<br />
44,574,423<br />
4,159,967<br />
-<br />
86,722,128<br />
-<br />
2,713,786<br />
93,595,881<br />
(49,021,458)<br />
-<br />
-<br />
-<br />
-<br />
-<br />
-<br />
-<br />
-<br />
(49,021,458)<br />
11,692,007
NOTES TO THE FINANCIAL STATEMENTS FOR THE YEAR ENDED DECEMBER 31, 2006<br />
43.3 Liquidity Risk<br />
<strong>UBL</strong>’s approach to liquidity management is to ensure, as far as possible, that it will always have sufficient liquidity to<br />
meet its liabilities when due, under both normal and stressed conditions without incurring unacceptable losses or risking<br />
sustained damage to business franchises. A centralized approach is adopted, based on an integrated framework<br />
incorporating an assessment of all material known and expected cash flows and the availability of high-grade collateral<br />
which could be used to secure additional funding if required. The framework entails careful monitoring and control of the<br />
daily liquidity position, and regular liquidity stress testing under a variety of scenarios. Scenarios encompass both normal<br />
and stressed market conditions, including general market crises and the possibility that access to markets could be<br />
impacted by a stress event affecting some part of <strong>UBL</strong>’s business.<br />
43.3.1 Maturities of Assets and Liabilities - Based on contractual maturity of the assets and liabilities of the <strong>Bank</strong><br />
The above mentioned maturity profile has been prepared on the basis of contractual maturities. The management<br />
believes that such a maturity analysis does not reveal the expected maturity of current and saving deposits as a<br />
contractual maturity analysis of deposits alone does not provide information about the conditions expected in normal<br />
circumstances. The maturity profile disclosed in note 43.3.2 that includes maturities of current and saving deposits<br />
determined by the Assets and Liabilities Management Committee (ALCO) keeping in view historical withdrawl pattern of<br />
these deposits reflects a more meaningful analysis the liquidity risk of the bank.<br />
Assets<br />
Total<br />
Cash and balances with<br />
treasury banks 48,939,840<br />
Balances with other banks 14,034,476<br />
Lendings to financial<br />
institutions 29,572,070<br />
Investments 67,260,338<br />
Advances 247,309,893<br />
Fixed assets 5,234,463<br />
Other assets 10,062,466<br />
Deferred tax assets 906,661<br />
Liabilities<br />
423,320,207<br />
Bills payable 4,560,649<br />
Borrowings 38,544,920<br />
Deposits and other<br />
accounts 335,077,873<br />
Subordinated loans 5,998,344<br />
Other liabilities 9,275,034<br />
393,456,820<br />
Net assets 29,863,387<br />
Represented by:<br />
Share capital 6,475,000<br />
Reserves 8,298,873<br />
Unappropriated profit 12,429,853<br />
Surplus on revaluation<br />
of assets 2,659,661<br />
29,863,387<br />
Upto One<br />
month<br />
46,098,084<br />
13,721,065<br />
20,546,941<br />
1,801,891<br />
40,773,508<br />
50,492<br />
29,390<br />
5,749<br />
123,027,120<br />
4,560,649<br />
20,688,136<br />
199,421,373<br />
-<br />
2,936<br />
224,673,094<br />
(101,645,974)<br />
Over 1 month<br />
to 3 months<br />
-<br />
-<br />
3,489,135<br />
1,202,305<br />
72,535,948<br />
100,988<br />
7,695,620<br />
11,497<br />
85,035,493<br />
-<br />
10,835,255<br />
37,782,002<br />
824<br />
6,184,029<br />
54,802,110<br />
30,233,383<br />
Over 3<br />
months to 6<br />
months<br />
-<br />
-<br />
641,795<br />
Over 6<br />
months to 1<br />
year<br />
-<br />
-<br />
1,524,459<br />
11,638,523 27,454,233<br />
20,503,879 19,369,611<br />
151,481<br />
1,266,535<br />
18,817<br />
302,963<br />
1,222<br />
32,923<br />
34,221,030 48,685,411<br />
-<br />
1,451,561<br />
-<br />
2,903,122<br />
19,313,374 18,031,470<br />
-<br />
8,807<br />
824<br />
17,613<br />
20,773,742 20,953,029<br />
13,447,288 27,732,382<br />
2006<br />
Over 1 years<br />
to 2 years<br />
-<br />
-<br />
1,476,884<br />
7,766,592<br />
32,283,235<br />
605,925<br />
-<br />
50,137<br />
42,182,773<br />
-<br />
2,666,846<br />
40,592<br />
Over 2 years<br />
to 3 years<br />
-<br />
-<br />
1,792,856<br />
3,443,387<br />
13,142,950<br />
605,925<br />
-<br />
50,137<br />
19,035,255<br />
-<br />
60<br />
Over 3 years<br />
to 5 years<br />
-<br />
-<br />
100,000<br />
5,022,524<br />
21,147,312<br />
925,041<br />
-<br />
272,474<br />
27,467,351<br />
-<br />
17,826,001<br />
Over 5 years<br />
to 10 years<br />
----------------------------------------------------------------------------------------- (Rupees in '000) -----------------------------------------------------------------------<br />
49<br />
1,648<br />
2,709,086<br />
39,473,687<br />
1,648<br />
1,708<br />
19,033,547<br />
667,915<br />
652,339<br />
19,146,255<br />
8,321,096<br />
-<br />
-<br />
-<br />
6,671,288<br />
19,749,636<br />
780,180<br />
1,069,699<br />
275,370<br />
28,546,173<br />
-<br />
42,663,001<br />
5,325,485<br />
2,409,310<br />
50,397,796<br />
(21,851,623)<br />
Over 10<br />
years<br />
2,841,756<br />
313,411<br />
-<br />
2,259,595<br />
7,803,814<br />
1,711,468<br />
-<br />
189,557<br />
15,119,601<br />
-<br />
-<br />
-<br />
-<br />
-<br />
15,119,601
NOTES TO THE FINANCIAL STATEMENTS FOR THE YEAR ENDED DECEMBER 31, 2006<br />
Assets<br />
Total<br />
Cash and balances with<br />
treasury banks 34,062,679<br />
Balances with other banks 12,729,207<br />
Lendings to financial<br />
institutions 17,867,552<br />
Investments 63,026,944<br />
Advances 204,810,470<br />
Other assets 7,829,770<br />
Fixed assets 4,449,324<br />
Deferred tax assets 2,273,005<br />
Liabilities<br />
347,048,951<br />
Bills payable 4,159,964<br />
Borrowings 21,790,480<br />
Deposits and other<br />
accounts 289,226,299<br />
Subordinated loan 3,999,192<br />
Other liabilities 6,204,746<br />
325,380,681<br />
Net assets 21,668,270<br />
Represented by:<br />
Share capital 5,180,000<br />
Reserves 6,225,461<br />
Unappropriated profit<br />
Surplus on revaluation<br />
7,350,813<br />
of assets 2,911,996<br />
21,668,270<br />
Upto One<br />
month<br />
34,062,679<br />
12,412,496<br />
5,553,996<br />
3,006,176<br />
29,719,776<br />
2,380,678<br />
48,971<br />
131,354<br />
87,316,126<br />
4,159,964<br />
6,450,005<br />
84,175,411<br />
-<br />
1,028,925<br />
95,814,305<br />
(8,498,179)<br />
Over 1 month<br />
to 3 months<br />
-<br />
-<br />
3,232,292<br />
1,064,299<br />
59,439,553<br />
4,761,356<br />
97,943<br />
262,709<br />
68,858,152<br />
-<br />
12,900,009<br />
168,350,825<br />
414<br />
2,057,850<br />
183,309,098<br />
(114,450,946)<br />
Over 3<br />
months to 6<br />
months<br />
-<br />
-<br />
310,152<br />
2,088,214<br />
13,637,575<br />
108,981<br />
394,064<br />
16,538,986<br />
-<br />
813,489<br />
5,320,793<br />
-<br />
105,689<br />
6,239,971<br />
10,299,015<br />
Over 6<br />
months to 1<br />
year<br />
-<br />
-<br />
420,304<br />
28,114,129<br />
27,275,151<br />
217,961<br />
788,129<br />
56,815,674<br />
-<br />
1,626,977<br />
10,641,585<br />
414<br />
211,376<br />
12,480,352<br />
44,335,322<br />
2005<br />
Over 1 years<br />
to 2 years<br />
-<br />
-<br />
1,450,202<br />
3,002,855<br />
12,169,340<br />
398,678<br />
48,403<br />
17,069,478<br />
-<br />
-<br />
2,741,308<br />
828<br />
Over 2 years<br />
to 3 years<br />
-<br />
-<br />
1,150,202<br />
8,099,222<br />
12,169,342<br />
398,000<br />
48,403<br />
21,865,169<br />
-<br />
-<br />
2,740,000<br />
828<br />
Over 3 years<br />
to 5 years<br />
-<br />
-<br />
2,650,404<br />
9,105,705<br />
24,338,684<br />
796,678<br />
96,805<br />
36,988,276<br />
-<br />
-<br />
5,481,308<br />
1,656<br />
Over 5 years<br />
to 10 years<br />
----------------------------------------------------------------------------------------- (Rupees in '000) -----------------------------------------------------------------------<br />
50<br />
115,360<br />
2,857,496<br />
14,211,982<br />
115,000<br />
2,855,828<br />
19,009,341<br />
230,361<br />
5,713,325<br />
31,274,951<br />
-<br />
-<br />
3,100,000<br />
5,624,830<br />
22,402,674<br />
687,736<br />
2,382,112<br />
503,138<br />
34,700,490<br />
-<br />
-<br />
4,344,475<br />
3,995,052<br />
1,040,083<br />
9,379,610<br />
25,320,880<br />
Over 10<br />
years<br />
-<br />
316,711<br />
-<br />
2,921,514<br />
3,658,375<br />
-<br />
6,896,600<br />
-<br />
-<br />
5,430,594<br />
-<br />
1,300,102<br />
6,730,696<br />
165,904
NOTES TO THE FINANCIAL STATEMENTS FOR THE YEAR ENDED DECEMBER 31, 2006<br />
43.3.2Maturities<br />
of Assets and Liabilities - Based on working prepared by the Assets and Liabilities Management<br />
Committee (ALCO) of the <strong>Bank</strong><br />
Current and savings deposits do not have any contractual maturity therefore, current deposits and savings accounts<br />
have been classified between all four maturities. Further, it has been assumed that on a going concern basis, these<br />
deposits are not expected to fall below the current year's level.<br />
Assets<br />
Total<br />
Cash and balances with<br />
treasury banks 48,939,840<br />
Balances with other<br />
banks 14,034,476<br />
Lendings to financial<br />
institutions 29,572,070<br />
Investments 67,260,338<br />
Advances - Performing 243,237,819<br />
Advances - Non Perform 4,072,074<br />
Other assets 10,062,466<br />
Fixed assets 5,234,463<br />
Deferred tax assets 906,661<br />
Liabilities<br />
423,320,207<br />
Bills payable 4,560,649<br />
financial institutions 38,544,920<br />
Deposits and other<br />
accounts 335,077,873<br />
Subordinated loan 5,998,344<br />
Other liabilities 9,275,034<br />
393,456,820<br />
Net assets 29,863,387<br />
Represented by:<br />
Share capital 6,475,000<br />
Reserves 8,298,873<br />
Unappropriated profit 12,429,853<br />
Surplus on revaluation<br />
of assets 2,659,661<br />
29,863,387<br />
----------------------------------------------------------------------------------------------- 2006 -----------------------------------------------------------------------------------<br />
Upto One<br />
month<br />
14,584,511<br />
7,777,370<br />
24,488,971<br />
6,742,446<br />
40,272,014<br />
-<br />
699,967<br />
-<br />
Over 1 month<br />
to 3 months<br />
16,019,732<br />
1,904,327<br />
3,088,209<br />
2,195,081<br />
72,485,704<br />
-<br />
739,349<br />
-<br />
Over 3<br />
months to 6<br />
months<br />
3,036,627<br />
1,225,800<br />
365,476<br />
5,173,673<br />
20,555,252<br />
-<br />
7,036,614<br />
-<br />
Over 6<br />
months to 1<br />
year<br />
2,623,123<br />
919,729<br />
776,637<br />
26,228,752<br />
19,369,472<br />
-<br />
-<br />
-<br />
Over 1 year<br />
to 2 years<br />
3,437,078<br />
919,350<br />
852,777<br />
11,984,863<br />
19,765,777<br />
-<br />
-<br />
-<br />
Over 2 year<br />
to 3 years<br />
2,068,770<br />
612,900<br />
-<br />
3,674,593<br />
19,308,028<br />
-<br />
-<br />
-<br />
Over 3 year<br />
to 5 years<br />
2,078,861<br />
675,000<br />
-<br />
1,300,724<br />
27,312,919<br />
-<br />
-<br />
-<br />
Over 5 year<br />
to 10 years<br />
----------------------------------------------------------------------------------------- (Rupees in '000) -----------------------------------------------------------------------<br />
-<br />
94,565,279.00<br />
3,629,856<br />
20,460,429<br />
73,567,106<br />
-<br />
-<br />
97,657,391.00<br />
(3,092,112)<br />
-<br />
96,432,402<br />
930,793<br />
13,144,791<br />
52,722,054<br />
824<br />
4,813,757<br />
71,612,219<br />
24,820,183<br />
-<br />
37,393,442<br />
-<br />
4,939,700<br />
35,648,394<br />
-<br />
16,082<br />
40,604,176<br />
(3,210,734)<br />
51<br />
407,998<br />
50,325,711<br />
-<br />
-<br />
33,733,103<br />
824<br />
-<br />
33,733,927<br />
16,591,784<br />
181,332<br />
37,141,177<br />
-<br />
-<br />
37,885,193<br />
1,648<br />
-<br />
37,886,841<br />
(745,664)<br />
163,199<br />
25,827,490<br />
-<br />
-<br />
1,164,153<br />
1,648<br />
-<br />
1,165,801<br />
24,661,689<br />
154,132<br />
31,521,636<br />
-<br />
-<br />
2,412,900<br />
667,915<br />
-<br />
3,080,815<br />
28,440,821<br />
5,088,149<br />
-<br />
-<br />
9,958,206<br />
8,082,791<br />
-<br />
4,072,074<br />
1,007,396<br />
-<br />
-<br />
28,208,616<br />
-<br />
-<br />
97,933,417<br />
5,325,485<br />
4,445,195<br />
107,704,097<br />
(79,495,481)<br />
Over 10<br />
years<br />
2,989<br />
-<br />
-<br />
2,000<br />
16,085,862<br />
-<br />
579,140<br />
5,234,463<br />
-<br />
21,904,454<br />
-<br />
-<br />
11,553<br />
-<br />
-<br />
11,553<br />
21,892,901
NOTES TO THE FINANCIAL STATEMENTS FOR THE YEAR ENDED DECEMBER 31, 2006<br />
Assets<br />
Total<br />
Cash and balances with<br />
treasury banks 34,062,679<br />
Balances with other<br />
banks 12,729,207<br />
Lendings to financial<br />
institutions 17,867,552<br />
Investments 63,026,944<br />
Advances<br />
Performing 201,152,095<br />
Non Performing 3,658,375<br />
Other assets 7,829,770<br />
Fixed assets 4,449,324<br />
Deferred tax assets 2,273,005<br />
Liabilities<br />
347,048,951<br />
Bills payable 4,159,964<br />
Borrowings 21,790,480<br />
Deposits and other<br />
accounts 289,226,299<br />
Subordinated loan 3,999,192<br />
Other liabilities 6,204,746<br />
325,380,681<br />
Net assets 21,668,270<br />
Represented by:<br />
Share capital 5,180,000<br />
Reserves 6,225,461<br />
Unappropriated profit<br />
Surplus on revaluation<br />
7,350,813<br />
of assets 2,911,996<br />
21,668,270<br />
Upto One<br />
month<br />
10,218,804<br />
7,001,064<br />
9,827,154<br />
3,151,347<br />
-<br />
-<br />
-<br />
-<br />
-<br />
30,198,369<br />
3,327,971<br />
11,984,764<br />
63,629,786<br />
-<br />
-<br />
78,942,521<br />
(48,744,152)<br />
Over 1 month<br />
to 3 months<br />
8,662,667<br />
5,411,432<br />
2,109,134<br />
3,392,811<br />
89,159,329<br />
-<br />
2,232,779<br />
-<br />
-<br />
110,968,152<br />
831,993<br />
7,365,250<br />
28,341,974<br />
414<br />
2,333,421<br />
38,873,052<br />
72,095,100<br />
Over 3<br />
months to 6<br />
months<br />
2,043,761<br />
-<br />
536,027<br />
5,042,156<br />
-<br />
-<br />
-<br />
-<br />
-<br />
7,621,944<br />
-<br />
2,440,466<br />
31,814,893<br />
-<br />
121,730<br />
34,377,089<br />
(26,755,145)<br />
2005<br />
Over 6<br />
months to 1<br />
year<br />
2,431,177<br />
-<br />
794,428<br />
22,649,084<br />
40,912,726<br />
-<br />
4,567,437<br />
-<br />
1,022,852<br />
72,377,704<br />
-<br />
-<br />
Over 1 years<br />
to 2 years<br />
1,703,134<br />
-<br />
536,027<br />
11,344,850<br />
-<br />
-<br />
-<br />
-<br />
454,601<br />
14,038,612<br />
-<br />
-<br />
Over 2 years<br />
to 3 years<br />
1,362,507<br />
-<br />
536,027<br />
3,151,347<br />
-<br />
-<br />
-<br />
-<br />
409,141<br />
5,459,022<br />
-<br />
-<br />
Over 3 years<br />
to 5 years<br />
474,019<br />
-<br />
3,528,755<br />
2,993,407<br />
48,677,366<br />
-<br />
-<br />
-<br />
386,411<br />
56,059,958<br />
-<br />
-<br />
Over 5 years<br />
to 10 years<br />
----------------------------------------------------------------------------------------- (Rupees in '000) -----------------------------------------------------------------------<br />
52<br />
28,622,175<br />
414<br />
81,154<br />
28,703,743<br />
43,673,961<br />
17,353,578<br />
414<br />
-<br />
17,353,992<br />
(3,315,380)<br />
14,461,315<br />
414<br />
-<br />
14,461,729<br />
(9,002,707)<br />
13,673,673<br />
2,484<br />
-<br />
13,676,157<br />
42,383,801<br />
7,163,204<br />
316,711<br />
-<br />
11,301,942<br />
22,402,674<br />
3,658,375<br />
645,924<br />
-<br />
-<br />
45,488,830<br />
-<br />
-<br />
88,436,642<br />
3,995,052<br />
3,668,441<br />
96,100,135<br />
(50,611,305)<br />
Over 10<br />
years<br />
3,406<br />
-<br />
-<br />
-<br />
-<br />
-<br />
383,630<br />
4,449,324<br />
-<br />
4,836,360<br />
-<br />
-<br />
2,892,263<br />
-<br />
-<br />
2,892,263<br />
1,944,097
NOTES TO THE FINANCIAL STATEMENTS FOR THE YEAR ENDED DECEMBER 31, 2006<br />
43.4 Operational Risk<br />
Operational risk is the risk of loss resulting from inadequate or failed internal processes, people and system or from<br />
external events.<br />
<strong>UBL</strong>’s Operational Risk Management implementation framework, is based on advanced risk management<br />
architecture. The framework is flexible enough to implement in stages, and permits the overall risk management<br />
approach to evolve in response to organizational learning and the future needs of the organization.<br />
Following are the high-level strategic initiatives that <strong>UBL</strong> has undertaken for the effective implementation of<br />
Operational Risk Management:<br />
-<br />
-<br />
-<br />
-<br />
-<br />
Recruiting skilled resources for Operational Risk Management<br />
Engaging external consultants to assist us in the development of an operational risk management infrastructure.<br />
In conjunction with the external consultants, determining the current state of key risks and their controls residing<br />
in each Business Unit.<br />
Developing policies, procedures and defining end to end information flow to establish a vigorous governance<br />
infrastructure.<br />
Analyzing current systems for data collection, migration, validation and retention for current and historical<br />
reference and calculation. Data warehousing solutions are being assessed for timely availability and storage of<br />
data.<br />
A consolidated Business Continuity Plan is being augmented for <strong>UBL</strong> which encompasses roles and responsibilities,<br />
recovery strategy, IT and structural back ups, scenario and impact analyses and testing directives.<br />
There are several IT developments underway in the credit, market and operational risk areas. Specifically for<br />
operational risk mitigation and control, an IT infrastructure is being developed along with the other high-level initiatives,<br />
including process re-engineering and inventorying of risks and controls within the <strong>Bank</strong>. A methodology for Risk and<br />
Control Self Assessment is ready to be implemented at all core units of <strong>UBL</strong>.<br />
44. ISLAMIC BANKING BUSINESS<br />
During the year the bank opened its first Islamic banking branch in Karachi in December 2006. The balance sheet of<br />
this branch as at December 31, 2006 is as follows:<br />
2006 2005<br />
Rupees in '000<br />
ASSETS<br />
Cash and balances with treasury banks 1,087<br />
Balances with and due from financial institutions 48,000<br />
Other assets 1,951<br />
Total Assets 51,038<br />
LIABILITIES<br />
Deposits and other accounts 1,006<br />
NET ASSETS 50,032<br />
REPRESENTED BY<br />
Islamic <strong>Bank</strong>ing Fund 50,000<br />
Unappropriated/ Unremitted profit 32<br />
50,032<br />
53<br />
-<br />
-<br />
-<br />
-<br />
-<br />
-<br />
-<br />
-<br />
-
NOTES TO THE FINANCIAL STATEMENTS FOR THE YEAR ENDED DECEMBER 31, 2006<br />
45. NON-ADJUSTING EVENT AFTER THE BALANCE SHEET DATE<br />
The Board of Directors in its meeting held on February 14, 2007 has proposed a cash dividend in respect of 2006 of<br />
Rs. 3.00 per share (2005: cash dividend Rs 2.50 per share). In addition, the directors have also announced a bonus<br />
issue of 25 percent. These appropriations will be approved in the forthcoming Annual General Meeting. The financial<br />
statements for the year ended December 31, 2006 do not include the effect of these appropriations which will be<br />
accounted for in the financial statements for the year ending December 31, 2007.<br />
46. DATE OF AUTHORIZATION<br />
These financial statements were authorized for issue on February 14, 2007 by the Board of Directors of the <strong>Bank</strong>.<br />
47. GENERAL<br />
47.1 Revised forms of annual financial statements<br />
These financial statements have been prepared using the revised format of financial statements prescribed in BSD<br />
Circular No. 4 dated February 17, 2006 issued by the State <strong>Bank</strong> of Pakistan. The revised format for presentation of<br />
financial statements is applicable for annual financial statements prepared by banks for periods commencing from<br />
January 1, 2006. The significant changes in the revised format for presentation of financial statements include the<br />
introduction of disclosures in respect of segment details with respect of business activities and capital adequacy and<br />
expanded disclosures in respect of the <strong>Bank</strong>'s derivative instruments and risk management.<br />
47.2 Amendments to published standards and new interpretations effective in 2006<br />
IAS 19 (Amendment) - Employee Benefits, is mandatory for the bank's accounting period beginning on or after<br />
January 1, 2006. It introduces the option of an alternative recognition approach for actuarial gains and losses. It also<br />
adds new disclosure requirements. As the bank does not intend to change the accounting policy adopted for<br />
recognition of actuarial gains and losses, adoption of this amendment only impacts the format and extent of disclosure<br />
presentation in the financial statements.<br />
Other new standards, amendments and interpretations that are mandatory for accounting periods beginning on or after<br />
January 1, 2006 which are not considered relevant nor have any significant effect on the bank's operations are not<br />
detailed in these financial statements.<br />
47.3 Standards, interpretations and amendments to published approved accounting standard that are not<br />
yet effective<br />
The following standards, amendments and interpretations of approved accounting standards, effective for accounting<br />
periods beginning on or after January 1, 2007 are either not relevant to <strong>Bank</strong>'s operations or are not expected to have<br />
significant impact on the <strong>Bank</strong>'s financial statements other than certain increased disclosure in certain cases:<br />
IAS 1 - Presentation of financial statements - amendments relating effective from accounting period beginning<br />
capital disclosures on or after January 1, 2007<br />
IFRS 2 - Share based payment effective from accounting period beginning<br />
on or after January 1, 2007<br />
IFRS 3 - Business combinations effective from accounting period beginning<br />
on or after January 1, 2007<br />
54
NOTES TO THE FINANCIAL STATEMENTS FOR THE YEAR ENDED DECEMBER 31, 2006<br />
IFRS 5 - Non-current assets held for sale and discontinued effective from accounting period beginning<br />
operations on or after January 1, 2007<br />
IFRS 6 - Exploration for and evaluation of mineral resources effective from accounting period beginning<br />
on or after January 1, 2007<br />
IFRIC 8 - Scope of IFRS 2 - share based payments effective for accounting period beginning<br />
on or after May 1, 2006<br />
IFRIC 9 - Reassessment of embedded derivatives effective for accounting period beginning<br />
on or after June 1, 2006<br />
IFRIC 10 - Interim financial reporting and impairment effective for accounting period beginning<br />
on or after November 1, 2006<br />
IFRIC 11 - Group and treasury share transactions effective for accounting period beginning<br />
on or after March 1, 2007<br />
IFRIC 12 - Services concession arrangements effective for accounting period beginning<br />
on or after January 1, 2008<br />
47.4 Comparatives<br />
Comparative information has been re-classified, re-arranged or additionally incorporated in these financial statements,<br />
wherever necessary to facilitate comparison and to conform with changes in presentation in the current year.<br />
Atif R. Bokhari Abdul Rauf Malik Sir Mohammed Anwar Pervez, OBE, HPk Nahayan Mabarak Al Nahayan<br />
President and Director Deputy Chairman Chairman<br />
Chief Executive Officer<br />
55