Using Three Dimensional Hydrodynamic Modeling and Fish ...
Using Three Dimensional Hydrodynamic Modeling and Fish ...
Using Three Dimensional Hydrodynamic Modeling and Fish ...
- No tags were found...

Create successful ePaper yourself
Turn your PDF publications into a flip-book with our unique Google optimized e-Paper software.
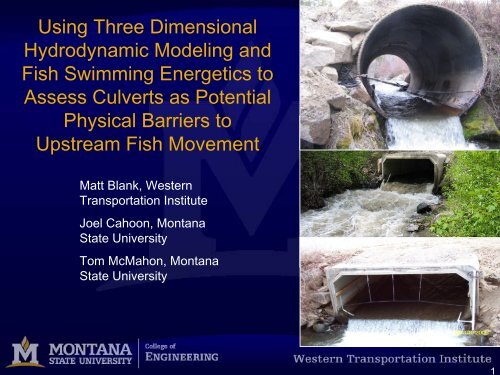
1<strong>Using</strong> <strong>Three</strong> <strong>Dimensional</strong><strong>Hydrodynamic</strong> <strong>Modeling</strong> <strong>and</strong><strong>Fish</strong> Swimming Energetics toAssess Culverts as PotentialPhysical Barriers toUpstream <strong>Fish</strong> MovementMatt Blank, WesternTransportation InstituteJoel Cahoon, MontanaState UniversityTom McMahon, MontanaState University
2Overview of Presentation• Aquatic barriers• Factors affecting passage• Assessment methods• 3-D D hydrodynamic method (<strong>and</strong> 1-D) 1• Comparison to fish movement• Future research directions
3Aquatic Barriers• 2.5 million aquatic barriers in U.S. byculverts, dams <strong>and</strong> canals (National<strong>Fish</strong> Passage Summit, 2006).• Estimated 1.4 million stream-roadroadcrossings in U.S. (U.S. <strong>Fish</strong> <strong>and</strong>Wildlife, National <strong>Fish</strong> PassageProgram, unpublished data).• 1,500 culverts on fish bearing streamswithin Montana’s s National Forests:47% barriers, 15% passable <strong>and</strong> 38%unclassified (Williams, 2007).
4Physical Factors Influencing <strong>Fish</strong>Passage• High water velocity• excessive turbulence• Shallow water depth• Outlet drop• pool depth/leap height ratio• jump location• air entrainment• Debris/sediment blockage
5<strong>Fish</strong> Locomotion• Species <strong>and</strong> size• Temperature• Dissolved oxygen• Motivation• Gender• Physical condition• Disease• Sexual maturity
6Types of Barriers• Total Barrier• Partial Barrier• Temporal Barrier• No Barrier
7Assessment TechniquesDirect Approach Field experimentsthat measure fish movementdirectly <strong>and</strong> compare movementto flow conditions in a structure.Indirect Approach Approximate movementpotential using thresholds, modeling orcomparisons between populationcharacteristics measured upstream <strong>and</strong>downstream of a crossing.•Tagging studies: markrecapture,PIT tagging orothers (e.g. radio telemetry)•Visual observations•Video camera•Regional screens based upon field<strong>and</strong> laboratory experiments•Hydraulic modeling•Comparisons between upstream <strong>and</strong>downstream fish populationcharacteristics
8Assessment TechniquesDirect Approach Field experimentsthat measure fish movementdirectly <strong>and</strong> compare movementto flow conditions in a structure.Indirect Approach Approximate movementpotential using thresholds, modeling orcomparisons between populationcharacteristics measured upstream <strong>and</strong>downstream of a crossing.•Tagging studies: markrecapture,PIT tagging orothers (e.g. radio telemetry)•Visual observations•Video camera•Regional screens based upon field<strong>and</strong> laboratory experiments•Hydraulic modeling•Comparisons between upstream <strong>and</strong>downstream fish populationcharacteristics
Upper Clearwater River BasinAbove Seeley Lake outlet•143 square miles•121 miles of stream•Assessed 46 culvertsHighway 83Seeley LakeAll Base Maps Courtesy of the MSU Environmental Statistics Group: Map overlayscreated by Drake Burford9
10Summary of Results for Sites WhereMultiple Methods Were Applied<strong>Fish</strong>Xing ResultsDirect PassageResultsUpstream vs.DownstreamSite Adult Juvenile Passage Size AbundanceIdentificationIndicator2 B B -0.36 no no10 B B 0.35 x x11 B P 0.2 yes no13 B B -1 x x19 B B 0.13 no no20 B B 0.03 no no23 P P -0.56 no no27 B B -0.19 no no28 B B -0.54 no no33 B B -0.85 yes no35 B B -0.69 no no43 B B -0.22 no no
11Development <strong>and</strong> Testing of 3-D 3Method – Mulherin CreekYe llo wstone R iver•Concrete Box Culvert•Length ~ 37 ft•Width ~ 12 ft•Slope ~ 1.1%•Outlet Drop ~ 1.5 ftMu lhe rin Cre ekCin nab ar Cree kUpp er Mulh erin C reekMain study culvertsCu lvert stu die d 200 4 <strong>and</strong> 2 005Culverts stu die in d companion 200 5 studyN
12Direct Passage Measurement• Visual observations• PIT tagging w/antennae• Mark-Recapture
13<strong>Hydrodynamic</strong> Model DevelopmentCFD model development using ANSYS CFX platform.Boundary ConditionsInlet: mass flow rate, turbulence intensity<strong>and</strong> length scaleOutlet: static pressure (water depth)Culvert sides <strong>and</strong> floor: no-slip wall boundariesInitial ConditionsInlet: grid of water velocitiesOutlet: water depthVelocities: 0 m/sVOF: step function
14Model ValidationObserved0.30.90.61.21.2 1.50.60.90.31.51.82.12.4PredictedFlow0.30.60.91.21.51.82.11.20.90.60.3
15Model Validation2.502.00Predicted Velocity (m/s)1.501.000.50r2mod= 0.86, rmod= 0.932r fit= 0.90, r fit= 0.950.000.00 0.50 1.00 1.50 2.00 2.50 3.00Observed Velocity (m/s)
16Barrier Assessment 1-D1Flow8.20 ft/s8.62 ft/s8.91 ft/s9.02 ft/s9.13 ft/s9.22 ft/s9.31 ft/s9.38 ft/s9.46 ft/s9.53 ft/s9.59 ft/s1) V f -V w = V progress2) Time = 1 /V progress3) If Total Time > 5seconds, then fail,otherwise pass.<strong>Fish</strong>Movement
Barrier Assessment (3D)170.5101.01.5982.071.00.5Flow652.5431.00.51.52.021•Estimate 3-D velocity field.June 25 Model•Find minimum energy path for each starting point.•Estimate passage using velocities along each path.
18Energy Paths0.5101.00.51.01.52.02.51.52.09876543210MinimumEnergy PathObservedEnergy PathsMaximumEnergy PathJune 29 ModelFlow
19<strong>Fish</strong> Swimming DataTemperatureSpecies Burst Speed Burst Speed Burst Speed Range Size Range Size Range Time Range Rangeft/s m/s m/s cm inches s CSource <strong>and</strong> NotesCutthroat Trout 4.12 Bell (1991)Cutthroat Trout 13.50 4.12 1.82 to 4.12 - - - Bell (1991).Rainbow Trout - 1.86 to 2.26 58 to 67 23 to 26 10 to 15Paulik <strong>and</strong> Delacy (1957) as cited in Hoar <strong>and</strong>R<strong>and</strong>all, eds. (1978).Rainbow Trout - 5.36 to 8.17 61 to 81 24 to 32 1.5Weaver (1963) as cited in Hoar <strong>and</strong> R<strong>and</strong>all,eds. (1978).Rainbow Trout - 0.3 to 2.5 14.3 5.6 0.08Webb, as cited in Hoar <strong>and</strong> R<strong>and</strong>all, eds.(1978).Rainbow Trout 0.3 to 1.8 14.3 5.6 0.04Webb, as cited in Hoar <strong>and</strong> R<strong>and</strong>all, eds.(1978).Rainbow Trout 2.72 0.83 - - -Jones et al. (1974) as listed in <strong>Fish</strong>XingSwimming Speed table.Rainbow Trout 5.33 1.62 - 10.3 to 28 4.1 to 11 1 to 20Bainbridge (1960) as cited in Hunter <strong>and</strong>Mayor (1986).Rainbow Trout 6.91 2.11 - 10.3 to 81.3 4.1 to 32 1 to 20 7 to 19Bainbridge (1960), Weaver (1963) <strong>and</strong>Beamish (1978) as cited in Hunter <strong>and</strong> Mayor(1986).Rainbow Trout 2.11** Hunter <strong>and</strong> Mayor (1986)Rainbow Trout 10.75 3.28 - 61 to 81.3 24 to 32 1.6 to 12.5 7 to 19Weaver (1963) <strong>and</strong> Beamish (1978) as citedin Hunter <strong>and</strong> Mayor (1986).
20Four Different Assessments1. 1-D flow model with Bell (1991) data.2. 1-D flow model with Hunter <strong>and</strong>Mayor’s (1986) data.3. 3-D flow model with Bell (1991) data.4. 3-D flow model with Hunter <strong>and</strong>Mayor’s (1986) data.
21Comparison of Predictions toDirect ObservationsFlow (m 3 /s)6.005.004.003.002.001. 1-D with Bell.2. 1-D with Hunter<strong>and</strong> Mayor.3. 3-D with Bell.4. 3-D with Hunter<strong>and</strong> Mayor1.000.004/3/04 5/23/04 7/12/04 8/31/04 10/20/04Date•DocumentedPassage <strong>and</strong>Failed Attempt•DocumentedPassage
22Future Research• Further validate 3-D 3 D hydrodynamic modeling forbarrier assessment.• Determine high end (burst) swimming speeds.• Assessment should be in terms of probabilities,not yes/no.• Marriage of aquatic ecology <strong>and</strong> hydraulics.
23Acknowledgements•Western Transportation Institute•Montana Department of Transportation•Montana <strong>Fish</strong>, Wildlife <strong>and</strong> Parks•United States Forest Service
24Thank You!Matt Blank, Ph.D.Research Scientist/Assistant Research ProfessorWestern Transportation Institute <strong>and</strong> Civil Engineering DepartmentMontana State Universitymblank@coe.montana.edu406-994-7120
25Energy Paths21.91.50.52.11.51.10.522.31.00.9221.21zx
26Energy Paths350Select flow rate of interest.330310290Stage (mm)270250230Model velocity through culvert using ANSYS-CFX.2101901701503-Apr 23-Apr 13-May 2-Jun 22-Jun 12-Jul 1-AugDate <strong>and</strong> TimeExport velocity field on plane 0.06 m above culvertbed from ANYS-CFX to Microsoft Excel.Calculate energy paths using Microsoft Excelwith VBA code.E=s∫0F dsF = 05 . C ρA( V −V)d s f2
27Energy Paths1 2 3 4