A4 Report Template - CII
A4 Report Template - CII
A4 Report Template - CII

You also want an ePaper? Increase the reach of your titles
YUMPU automatically turns print PDFs into web optimized ePapers that Google loves.
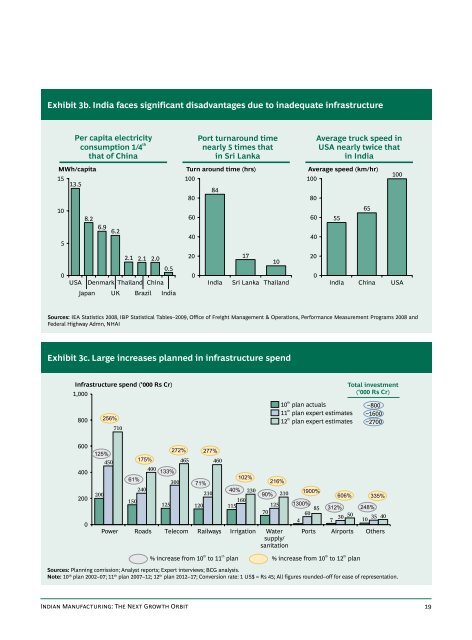
Exhibit 3b. India faces significant disadvantages due to inadequate infrastructurePer capita electricitythconsumption 1/4that of ChinaMWh/capita15105013.5USA8.2Japan6.96.22.12.12.0Denmark Thailand China0.5UK Brazil IndiaPort turnaround timenearly 5times thatin Sri LankaTurn around time (hrs)10080604020084India17Sri Lanka10ThailandAverage truck speed inUSA nearly twice thatin IndiaAverage speed (km/hr)10080604020055India65China100USASources: IEA Statistics 2008, IBP Statistical Tables–2009, Office of Freight Management & Operations, Performance Measurement Programs 2008 andFederal Highway Admn, NHAIExhibit 3c. Large increases planned in infrastructure spendInfrastructure spend (‘000 Rs Cr)1,000800256%710th10 plan actualsth11 plan expert estimatesth12 plan expert estimatesTotal investment(‘000 Rs Cr)~800~1600~27006004002000125%20045061%150175%240400133%125272%30046571%120277%21046040%102%16011523090%216%12570Power Roads Telecom Railways Irrigation Watersupply/sanitation2101900%1300%85604606%312%30507248%335%35 4010Ports Airports Othersth th% increase from 10 to 11 planth th% increase from 10 to 12 planSources: Planning comission; Analyst reports; Expert interviews; BCG analysis.Note: 10 th plan 2002–07; 11 th plan 2007–12; 12 th plan 2012–17; Conversion rate: 1 US$ = Rs 45; All figures rounded–off for ease of representation.Indian Manufacturing: The Next Growth Orbit 19