Cancer Reform Strategy - First Annual Report - Merseyside ...
Cancer Reform Strategy - First Annual Report - Merseyside ...
Cancer Reform Strategy - First Annual Report - Merseyside ...

You also want an ePaper? Increase the reach of your titles
YUMPU automatically turns print PDFs into web optimized ePapers that Google loves.
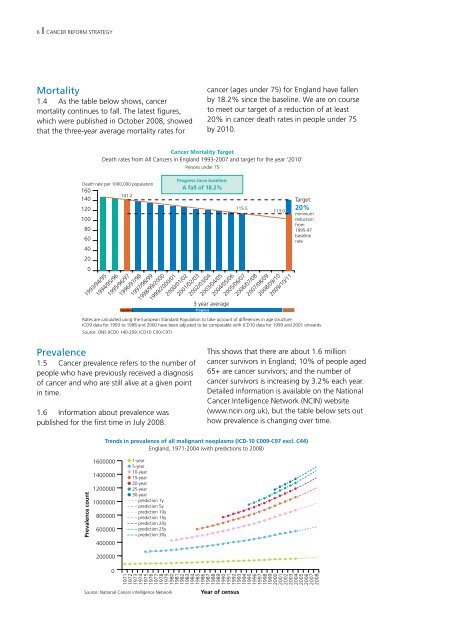
6 CANCER REFoRM STRATEgyMortality1.4 As the table below shows, cancermortality continues to fall. The latest figures,which were published in october 2008, showedthat the three-year average mortality rates forcancer (ages under 75) for England have fallenby 18.2% since the baseline. We are on courseto meet our target of a reduction of at least20% in cancer death rates in people under 75by 2010.<strong>Cancer</strong> Mortality TargetDeath rates from All <strong>Cancer</strong>s in England 1993-2007 and target for the year ‘2010’Persons under 75Death rate per 1000,000 population160141.21401201008060402001993/94/951994/95/96Progress since baseline:A fall of 18.2%115.5113.01995/96/971996/97/981997/98/991998/99/20001999/2000/012000/01/022001/02/032002/03/042003/04/052004/05/062005/06/072006/07/082007/08/092008/09/102009/10/113 year averagebaseline Progress targetTarget:20%minimumreductionfrom1995-97baselinerateRates are calculated using the European Standard Population to take account of differences in age structure.ICD9 data for 1993 to 1998 and 2000 have been adjusted to be comparable with ICD10 data for 1999 and 2001 onwards.Source: ONS (ICD0 140-209; ICD10 C00-C97)Prevalence1.5 <strong>Cancer</strong> prevalence refers to the number ofpeople who have previously received a diagnosisof cancer and who are still alive at a given pointin time.1.6 Information about prevalence waspublished for the first time in July 2008.This shows that there are about 1.6 millioncancer survivors in England; 10% of people aged65+ are cancer survivors; and the number ofcancer survivors is increasing by 3.2% each year.Detailed information is available on the National<strong>Cancer</strong> Intelligence Network (NCIN) website(www.ncin.org.uk), but the table below sets outhow prevalence is changing over time.Trends in prevalence of all malignant neoplasms (ICD-10 C009-C97 excl. C44)England, 1971-2004 (with predictions to 2008)Prevalence count1600000140000012000001000000800000600000400000● 1-year● 5-year● 10-year● 15-year● 20-year● 25-year● 30-year– – – prediction 1y– – – prediction 5y– – – prediction 10y– – – prediction 15y– – – prediction 20y– – – prediction 25y– – – prediction 30y200000019711972197319741975197619771978197919801981198219831984198519861987198819891990199119921993199419951996199719981999200020012002200320042005200620072008Source: National <strong>Cancer</strong> intelligence NetworkYear of census