A Closer Look at Higher Education Minority Ethnic Students and ...
A Closer Look at Higher Education Minority Ethnic Students and ...
A Closer Look at Higher Education Minority Ethnic Students and ...

Create successful ePaper yourself
Turn your PDF publications into a flip-book with our unique Google optimized e-Paper software.
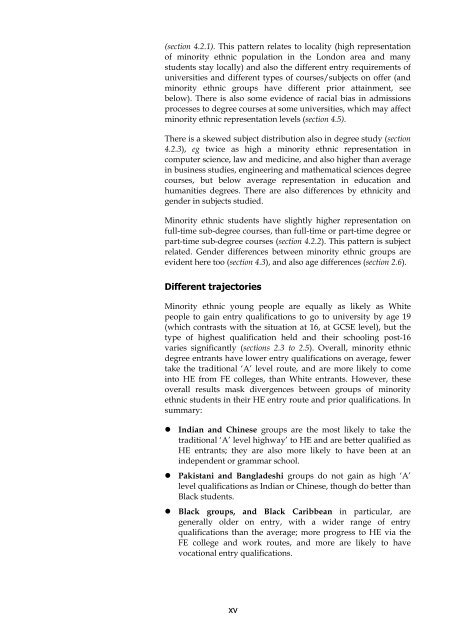
(section 4.2.1). This p<strong>at</strong>tern rel<strong>at</strong>es to locality (high represent<strong>at</strong>ionof minority ethnic popul<strong>at</strong>ion in the London area <strong>and</strong> manystudents stay locally) <strong>and</strong> also the different entry requirements ofuniversities <strong>and</strong> different types of courses/subjects on offer (<strong>and</strong>minority ethnic groups have different prior <strong>at</strong>tainment, seebelow). There is also some evidence of racial bias in admissionsprocesses to degree courses <strong>at</strong> some universities, which may affectminority ethnic represent<strong>at</strong>ion levels (section 4.5).There is a skewed subject distribution also in degree study (section4.2.3), eg twice as high a minority ethnic represent<strong>at</strong>ion incomputer science, law <strong>and</strong> medicine, <strong>and</strong> also higher than averagein business studies, engineering <strong>and</strong> m<strong>at</strong>hem<strong>at</strong>ical sciences degreecourses, but below average represent<strong>at</strong>ion in educ<strong>at</strong>ion <strong>and</strong>humanities degrees. There are also differences by ethnicity <strong>and</strong>gender in subjects studied.<strong>Minority</strong> ethnic students have slightly higher represent<strong>at</strong>ion onfull-time sub-degree courses, than full-time or part-time degree orpart-time sub-degree courses (section 4.2.2). This p<strong>at</strong>tern is subjectrel<strong>at</strong>ed. Gender differences between minority ethnic groups areevident here too (section 4.3), <strong>and</strong> also age differences (section 2.6).Different trajectories<strong>Minority</strong> ethnic young people are equally as likely as Whitepeople to gain entry qualific<strong>at</strong>ions to go to university by age 19(which contrasts with the situ<strong>at</strong>ion <strong>at</strong> 16, <strong>at</strong> GCSE level), but thetype of highest qualific<strong>at</strong>ion held <strong>and</strong> their schooling post-16varies significantly (sections 2.3 to 2.5). Overall, minority ethnicdegree entrants have lower entry qualific<strong>at</strong>ions on average, fewertake the traditional ‘A’ level route, <strong>and</strong> are more likely to comeinto HE from FE colleges, than White entrants. However, theseoverall results mask divergences between groups of minorityethnic students in their HE entry route <strong>and</strong> prior qualific<strong>at</strong>ions. Insummary:• Indian <strong>and</strong> Chinese groups are the most likely to take thetraditional ‘A’ level highway’ to HE <strong>and</strong> are better qualified asHE entrants; they are also more likely to have been <strong>at</strong> anindependent or grammar school.• Pakistani <strong>and</strong> Bangladeshi groups do not gain as high ‘A’level qualific<strong>at</strong>ions as Indian or Chinese, though do better thanBlack students.• Black groups, <strong>and</strong> Black Caribbean in particular, aregenerally older on entry, with a wider range of entryqualific<strong>at</strong>ions than the average; more progress to HE via theFE college <strong>and</strong> work routes, <strong>and</strong> more are likely to havevoc<strong>at</strong>ional entry qualific<strong>at</strong>ions.xv