Employment Rights at Work: Survey of Employees ... - DTI Home Page
Employment Rights at Work: Survey of Employees ... - DTI Home Page
Employment Rights at Work: Survey of Employees ... - DTI Home Page
- No tags were found...

You also want an ePaper? Increase the reach of your titles
YUMPU automatically turns print PDFs into web optimized ePapers that Google loves.
AcknowledgementsThis research was commissioned by the Department <strong>of</strong> Trade and Industry(<strong>DTI</strong>). We are gr<strong>at</strong>eful to Steven Taylor and John McQueeney for theirmanagement <strong>of</strong> this research, and to members <strong>of</strong> the advisory group from the<strong>DTI</strong>, DCA, Acas and the LSRC for their comments and suggestions about thedesign <strong>of</strong> the survey, the analysis process and the present<strong>at</strong>ion <strong>of</strong> results.We would like to thank Bruce Hayward, Carole Maxwell and Tim Hanson <strong>at</strong> BMRBwho worked jointly with us on the design <strong>of</strong> the survey, who were responsiblefor conducting the survey and for the prepar<strong>at</strong>ion <strong>of</strong> the survey d<strong>at</strong>a, and whoprovided useful suggestions on the analysis <strong>of</strong> the d<strong>at</strong>a and the present<strong>at</strong>ion <strong>of</strong>the results. We would also like to thank James Walker-Hebborn for providing allthe administr<strong>at</strong>ive support for the project <strong>at</strong> IES.Finally, we would like to thank all those who particip<strong>at</strong>ed in the survey, as wellas those who particip<strong>at</strong>ed in cognitive and pilot interviews prior to the survey,for giving up their time to take part in this important research.iv
ContentsExecutive summary 11. Introduction and methodology 71.1 The research aims 71.2 <strong>Employment</strong> rights – background 81.3 Methodology 131.4 Comparisons with the first benchmark survey 171.5 Present<strong>at</strong>ion <strong>of</strong> the findings 171.6 Structure <strong>of</strong> the report 181.7 D<strong>at</strong>a availability 182. Awareness <strong>of</strong> employment rights 192.1 How well informed respondents feel about their rights <strong>at</strong> work 192.2 Whether respondents know as much as they need to about theirrights <strong>at</strong> work 242.3 Whether respondents would know where to find inform<strong>at</strong>ion aboutrights <strong>at</strong> work 242.4 Awareness <strong>of</strong> employers’ legal oblig<strong>at</strong>ions 272.5 Knowledge <strong>of</strong> the detail <strong>of</strong> the law 352.6 Awareness deficits 402.7 Awareness score 412.8 Summary 453. Knowledge <strong>of</strong> specific employment rights 493.1 The approach to measuring and analysing factual knowledge 493.2 <strong>Work</strong>ing time, annual leave and rest breaks 503.3 N<strong>at</strong>ional Minimum Wage 623.4 Children and dependants 763.5 Other key knowledge issues 803.6 Knowledge scores 893.7 Summary 924. Experience <strong>of</strong> problems 964.1 Measuring the incidence <strong>of</strong> problems 964.2 Experiencing a problem 98v
4.3 Types <strong>of</strong> problems experienced 1014.4 Number <strong>of</strong> separ<strong>at</strong>e problems experienced 1024.5 Wh<strong>at</strong> types <strong>of</strong> problems were the most serious? 1044.6 Advice or inform<strong>at</strong>ion sought 1064.7 Actions taken 1134.8 Resolution 1154.9 Likelihood <strong>of</strong> future problems 1224.10 Summary 1295. Finding inform<strong>at</strong>ion and advice 1335.1 Where respondent would go to find out general inform<strong>at</strong>ion abouttheir rights <strong>at</strong> work 1335.2 Who is responsible for ensuring employees are aware <strong>of</strong> their rights<strong>at</strong> work? 1385.3 How useful respondents think different inform<strong>at</strong>ionservices would be 1405.4 Which inform<strong>at</strong>ion service respondents would find most useful 1425.5 Getting inform<strong>at</strong>ion or advice about hypothetical future problems 1435.6 Summary 1446. Key findings by employment right 1476.1 Children and dependants 1476.2 <strong>Work</strong>ing time, annual leave and rest breaks 1516.3 Pay, contracts, disciplinary and grievance procedures, andemployment tribunals 1546.4 Discrimin<strong>at</strong>ion 1607. Concluding remarks 1647.1 Which rights are people most (and least) aware <strong>of</strong>, orknowledgeable about? 1647.2 Which groups are most (and least) aware <strong>of</strong>, or knowledgeableabout, their rights? 1677.3 Which sources <strong>of</strong> inform<strong>at</strong>ion and advice are most commonly usedand most useful? 1697.4 Who experiences problems <strong>at</strong> work and who resolvesthem? 170vi
Appendix 1: Description <strong>of</strong> sample 171Appendix 2: Regression methodology and results 177Appendix 3: On-call working 194Appendix 4: List <strong>of</strong> acronyms 201Bibliography 202vii
List <strong>of</strong> Tables and ChartsTable 2.1: How well informed respondents feel about their rights <strong>at</strong> work 20Figure 2.1: How well informed respondents feel about their rights <strong>at</strong> work:2005 survey compared to 2001 survey 21Figure 2.2: Whether respondents know as much as they need to knowabout their rights <strong>at</strong> work, or could do with knowing more 25Table 2.2: Whether respondents would know where to find outinform<strong>at</strong>ion about their rights <strong>at</strong> work if they needed to 26Figure 2.3: Awareness <strong>of</strong> employers’ legal oblig<strong>at</strong>ions: proportion <strong>of</strong>respondents who think employers have to do this according tolaw 28Table 2.3: Awareness <strong>of</strong> rights in the area <strong>of</strong> children and dependants 34Table 2.4:How much respondents said they know about the detail <strong>of</strong> thelaw <strong>of</strong> the rights th<strong>at</strong> they were aware <strong>of</strong> 36Figure 2.4: Awareness deficits 40Table 2.5: Awareness score 42Figure 3.1: Estim<strong>at</strong>e <strong>of</strong> the weekly working time limit 51Table 3.1: Estim<strong>at</strong>es <strong>of</strong> the weekly working time limit 51Table 3.2: Opting out <strong>of</strong> the working time limit 54Table 3.3: Estim<strong>at</strong>es <strong>of</strong> minimum holiday entitlement 56Table 3.4: Is there a legal entitlement to public holidays on top <strong>of</strong> theminimum leave entitlement? 58Figure 3.2: Entitlement to days <strong>of</strong>f over a 14-day period 59Figure 3.3: Number <strong>of</strong> hours before rest break 60Table 3.5: Proportions giving correct responses to days <strong>of</strong>f in 14-dayperiod and rest breaks questions 60Figure 3.4: Which groups are covered by the NMW? 63Table 3.6:Which groups are covered by the NMW? (percentage sayingyes) 64Table 3.7: Is the NMW the same for different age groups? 66Figure 3.5: How much is the NMW for each age group? 67viii
Table 3.8: How much is the NMW for 16 and 17 year olds? 68Table 3.9: How much is the NMW for 18 to 21 year olds? 70Table 3.10: How much is the NMW for 22 to 64 year olds? 71Figure 3.6: Estim<strong>at</strong>e <strong>of</strong> the average (mean) NMW r<strong>at</strong>e for 22 to 64 yearolds, by d<strong>at</strong>e <strong>of</strong> interview 73Table 3.11: How much is the NMW for those aged 65 and over? 74Table 3.12: Time <strong>of</strong>f for dependants (in an emergency) 76Figure 3.7: Wh<strong>at</strong> rights a mother has after ordinary m<strong>at</strong>ernity leave 77Table 3.13: Wh<strong>at</strong> rights a mother has after ordinary m<strong>at</strong>ernity leave, byrespondents’ characteristics 78Figure 3.8: Wh<strong>at</strong> rights a mother has after additional m<strong>at</strong>ernity leave 79Table 3.14: Wh<strong>at</strong> rights a mother has after additional m<strong>at</strong>ernity leave, byrespondents’ characteristics 80Table 3.15: The point <strong>at</strong> which employees are legally entitled to rights 82Table 3.16: Proportion <strong>of</strong> respondents giving the right answer about thepoint <strong>at</strong> which employees are legally entitled to rights 82Figure 3.9: Whether respondents have the right to be accompanied todisciplinary or grievance hearings, and who can accompanyemployees 84Table 3.17: Proportion <strong>of</strong> respondents getting the right answer about whocan accompany employees to disciplinary or grievancehearings 85Figure 3.10: Wh<strong>at</strong> employees have to do before making a claim to anemployment tribunal 87Table 3.18: Proportion <strong>of</strong> respondents getting the right answer about wh<strong>at</strong>employees have to do before making a claim to anemployment tribunal 88Table 3.19: Results <strong>of</strong> the knowledge score 90Table 4.1: Percentage reporting a problem <strong>at</strong> work in the past five years 98Figure 4.1: Type <strong>of</strong> problem(s) experienced in the past five years 102Table 4.2:Average number <strong>of</strong> separ<strong>at</strong>e problems experienced in the pastfive years 103Figure 4.2: Most serious problem experienced in the past five years 105ix
Figure 5.2: Where respondents would seek inform<strong>at</strong>ion or advice (multipleresponse) 144Table A1.1: Personal characteristics 172Table A1.2: Family and household characteristics 173Table A1.3: Characteristics <strong>of</strong> employer 174Table A1.4: Characteristics <strong>of</strong> respondent’s job 175Table A1.5: Details <strong>of</strong> respondent’s employment 176Table A2.1: General awareness, classific<strong>at</strong>ion table 181Table A2.2: General self-assessed awareness <strong>of</strong> employment rights(dependent variable) 182Table A2.3: General awareness collinearity diagnostics 184Table A2.4: Problems experienced, classific<strong>at</strong>ion table 185Table A2.5: Prompted measure <strong>of</strong> whether a problem has beenexperienced <strong>at</strong> work in the past five years (dependentvariable) 186Table A2.6: Problems experienced collinearity diagnostics 188Table A2.7: Resolved s<strong>at</strong>isfactorily classific<strong>at</strong>ion table 190Table A2.8: Has a problem, once experienced and 'now over'/ 'most likelyover', been resolved s<strong>at</strong>isfactorily? (dependent variable) 191Table A2.9: Resolved s<strong>at</strong>isfactorily, collinearity diagnostics 193Figure A3.1: Average number <strong>of</strong> hours on call per calendar month actuallyspent <strong>at</strong> place <strong>of</strong> work 195Figure A3.2: Average number <strong>of</strong> hours on call per calendar month <strong>at</strong> place<strong>of</strong> work and actively doing work 196Table A3.1: Whether required to do on-call working 196Figure A3.3: Industries <strong>of</strong> those doing on-call working 198Figure A3.4: Frequency <strong>of</strong> on-call 199Figure A3.5: Average hours required to be on call per calendar month 200xi
Executive summaryAlmost two-thirds <strong>of</strong> respondents said they felt either well informed(51 per cent) or very well informed (15 per cent) about theiremployment rights. Groups th<strong>at</strong> might be expected to be morevulnerable <strong>at</strong> work had lower levels <strong>of</strong> awareness and knowledge abouttheir rights <strong>at</strong> work than other workers.The research also suggests th<strong>at</strong> being a trade union member and/orbeing aware <strong>of</strong> employment rights may, to some extent, protectemployees from having problems to do with their rights <strong>at</strong> work, andmay help them resolve these problems.In all, 42 per cent <strong>of</strong> respondents said they had experienced a problem<strong>at</strong> work in the past five years. The most common problem reportedwas issues to do with pay, which affected 22 per cent <strong>of</strong> allrespondents.Aims and objectivesThe main aims <strong>of</strong> the study were:• to assess employees’ general awareness <strong>of</strong> the scope <strong>of</strong> their employmentrights• for selected topics, to establish employees’ knowledge <strong>of</strong> specificemployment rights provision (eg level <strong>of</strong> the N<strong>at</strong>ional Minimum Wage, NMW,qualifying period for taking action on the grounds <strong>of</strong> unfair dismissal anddiscrimin<strong>at</strong>ion cases, and rules for the award <strong>of</strong> costs in employmenttribunal cases)• to find out the main sources <strong>of</strong> inform<strong>at</strong>ion and pr<strong>of</strong>essional advice aboutemployment rights issues and, when employees have had a recent problem(eg in the past five years), where they sought advice and guidance andwh<strong>at</strong> they did to try and resolve the problem• to identify the personal and employment characteristics th<strong>at</strong> influenceemployees’ levels <strong>of</strong> awareness, knowledge and preparedness to seekadvice and take action to enforce their individual employment rights(including employment st<strong>at</strong>us).BackgroundThe first benchmark survey <strong>of</strong> ‘Awareness, Knowledge and Exercise <strong>of</strong>Individual <strong>Employment</strong> <strong>Rights</strong>’ was conducted in 2001 to assess the extent towhich individuals were aware <strong>of</strong> their rights, had detailed knowledge <strong>of</strong> wh<strong>at</strong>those rights entailed, and were exercising their rights. Since this firstbenchmark survey was conducted, further legisl<strong>at</strong>ion has been introduced,most notably the <strong>Employment</strong> Act 2002, which covers a broad range <strong>of</strong> issues1
including work and parents, and dispute resolution in the workplace. Thisreport presents the results <strong>of</strong> the second benchmark survey conducted in2005, after the introduction <strong>of</strong> this legisl<strong>at</strong>ion.It is particularly important th<strong>at</strong> individuals have sufficient levels <strong>of</strong> awarenessand knowledge <strong>of</strong> the rights introduced in this legisl<strong>at</strong>ion, as they arerequired to enforce these aspects <strong>of</strong> the law themselves. Individuals are onlyable to exercise their rights if they are aware th<strong>at</strong> their employer is in breach<strong>of</strong> the law, and know where to get inform<strong>at</strong>ion and advice if they experiencea problem to do with their rights <strong>at</strong> work.Awareness <strong>of</strong> employment rightsRespondents were asked how well informed they felt about their rights <strong>at</strong>work. Sixty-five per cent <strong>of</strong> respondents felt either very well informed or wellinformed about their rights <strong>at</strong> work: 15 per cent <strong>of</strong> respondents felt very wellinformed, and a further 51 per cent felt well informed. Twenty-eight per centdid not feel very well informed, and six per cent did not feel well informed <strong>at</strong>all. Forty-four per cent <strong>of</strong> all respondents felt th<strong>at</strong> they knew as much as theyneeded to know about their rights <strong>at</strong> work, while 55 per cent felt th<strong>at</strong> theycould do with knowing more. Three-quarters <strong>of</strong> all respondents (76 per cent)would know where to find out inform<strong>at</strong>ion about their rights <strong>at</strong> work if theyneeded to.The rights which the most respondents were aware <strong>of</strong> were as follows(percentage <strong>of</strong> all respondents who were aware <strong>of</strong> the right is shown inbrackets): race discrimin<strong>at</strong>ion law (94 per cent), the NMW (93 per cent),disability discrimin<strong>at</strong>ion law (92 per cent), sex discrimin<strong>at</strong>ion law (91 percent), unfair dismissal law (90 per cent), ordinary m<strong>at</strong>ernity leave (88 percent), sexual orient<strong>at</strong>ion discrimin<strong>at</strong>ion law (87 per cent), religiousdiscrimin<strong>at</strong>ion law (87 per cent), entitlement to in-work rest breaks (85 percent), entitlement to a written st<strong>at</strong>ement <strong>of</strong> terms and conditions (84 percent), paid holiday entitlement (81 per cent), and the entitlement to a setdisciplinary procedure (81 per cent). There were only three rights where lessthan half <strong>of</strong> respondents were aware th<strong>at</strong> the entitlement was a right:additional m<strong>at</strong>ernity leave (49 per cent), time <strong>of</strong>f for dependants in anemergency (42 per cent), and parental leave (27 per cent).Respondents who were aware th<strong>at</strong> a right was an actual legal oblig<strong>at</strong>ion onemployers were then asked how much they knew about the detail <strong>of</strong> th<strong>at</strong>right. The rights where a high proportion <strong>of</strong> these respondents said th<strong>at</strong> theyknew a lot about the detail <strong>of</strong> the law were: the right to have a writtenst<strong>at</strong>ement <strong>of</strong> terms and conditions (37 per cent <strong>of</strong> those who knew it was aright knew a lot about the detail), the right to the NMW (33 per cent <strong>of</strong> thosewho knew it was a right knew a lot about the detail), the right not to bedismissed unfairly (28 per cent <strong>of</strong> those who knew it was a right knew a lotabout the detail), the right to an in-work rest break (27 per cent <strong>of</strong> those whoknew it was a right knew a lot about the detail), and the right not to bediscrimin<strong>at</strong>ed against on the grounds <strong>of</strong> race (27 per cent <strong>of</strong> those who knewit was a right knew a lot about the detail). Around a quarter <strong>of</strong> respondentswho knew about other rights, to do with discrimin<strong>at</strong>ion, working time andpay/contracts/disciplinary and grievance procedures, also said th<strong>at</strong> they knew2
a lot about the detail. In contrast to these more universally relevant rights,the rights where the highest proportion <strong>of</strong> respondents said they knew hardlyanything about the detail were in the area <strong>of</strong> children and dependants.An awareness score was developed by giving respondents points for gettingthe answers to awareness questions right and giving those with higher levels<strong>of</strong> general awareness more points than those with lower awareness. Analysisshows th<strong>at</strong> it is the groups th<strong>at</strong> might be expected to be vulnerable workersand to have low awareness levels <strong>of</strong> their rights <strong>at</strong> work th<strong>at</strong> do in fact havelower awareness. For example, younger workers, those without an HRdepartment, those who do not have managerial/supervisory duties, nonunion/staffassoci<strong>at</strong>ion members, and those employed in smaller workplaces.Knowledge <strong>of</strong> specific employment rightsRespondents were asked about their knowledge <strong>of</strong> rights in the area <strong>of</strong>working time. When asked wh<strong>at</strong> the working time limit was, just over aquarter (26 per cent) <strong>of</strong> respondents accur<strong>at</strong>ely cited the actual limit <strong>of</strong> 48hours. However, the average (mean) number <strong>of</strong> hours cited by respondentswas 44.54, while the median number was 45.00 hours, both below the actualworking time limit. Forty-three per cent <strong>of</strong> respondents incorrectly thoughtth<strong>at</strong> an individual could opt out <strong>of</strong> the working time limit informally, and onein five respondents incorrectly thought th<strong>at</strong> an employer could make optingout a condition <strong>of</strong> employment. Two-thirds <strong>of</strong> respondents (66 per cent) werecorrect in knowing th<strong>at</strong> employees could legally opt out by signing a writtendocument.When asked the minimum number <strong>of</strong> weeks <strong>of</strong> paid holiday employees areentitled to, 61 per cent <strong>of</strong> respondents knew the entitlement was four weeks.Only one-third <strong>of</strong> respondents (33 per cent) knew th<strong>at</strong> employees wereentitled to two days <strong>of</strong>f in a 14-day period. Fewer than one in tenrespondents (nine per cent) knew th<strong>at</strong> employees had to work more than sixhours before being legally entitled to a rest break.Respondents were asked a range <strong>of</strong> questions about the NMW. Almost allrespondents (95 per cent) said, correctly, th<strong>at</strong> 22 to 64 year olds have a rightto the NMW; and nearly as many (93 per cent), th<strong>at</strong> workers aged 18 to 21are covered. The large majority (83 per cent) also said th<strong>at</strong> 14 to 15 yearolds do not have minimum wage protection. Knowledge <strong>of</strong> the NMW position<strong>of</strong> 16 and 17 year olds was lower. Just under six in ten (58 per cent) <strong>of</strong>respondents knew th<strong>at</strong> this group is covered by the NMW. In addition, overone-quarter (26 per cent) <strong>of</strong> survey respondents incorrectly thought th<strong>at</strong>people above the standard retirement age do not have a right to the NMW.One-third (33 per cent) <strong>of</strong> all respondents indic<strong>at</strong>ed th<strong>at</strong> they thought th<strong>at</strong>there was a single r<strong>at</strong>e <strong>of</strong> the NMW th<strong>at</strong> applied regardless <strong>of</strong> age. For all agegroups where the NMW applies, respondents over-estim<strong>at</strong>ed the r<strong>at</strong>e. Theaverage (mean) r<strong>at</strong>e cited was £4.07 for 16 and 17 year olds, where theactual r<strong>at</strong>e was £3; the average r<strong>at</strong>e cited for 18 to 21 year olds was £4.61,considerably higher than the actual r<strong>at</strong>e <strong>of</strong> £4.10. For 22 to 64 year olds theaverage r<strong>at</strong>e cited was £5.08, with the actual r<strong>at</strong>e being £4.85, while for3
those aged 65 and over the average r<strong>at</strong>e cited was slightly less <strong>at</strong> £5.03,compared to the actual r<strong>at</strong>e <strong>of</strong> £4.85.Respondents were also asked some knowledge questions about rights in theareas <strong>of</strong> children and dependants. Sixty-two per cent <strong>of</strong> respondents knewth<strong>at</strong> employees are not entitled to be paid for taking time <strong>of</strong>f for a dependantin an emergency. A similar proportion (63 per cent) knew th<strong>at</strong> a motherwould be entitled to return to exactly the same job after ordinary m<strong>at</strong>ernityleave. Seventy-three per cent <strong>of</strong> respondents knew th<strong>at</strong> a mother wasentitled to return to exactly the same job, or to an equivalent job with thesame r<strong>at</strong>e <strong>of</strong> pay, after additional m<strong>at</strong>ernity leave.When asked when employees’ entitlement to key rights began, over nine inten respondents knew th<strong>at</strong> the right to the NMW covers employees from thefirst day <strong>of</strong> their employment. Again, over nine in ten respondents (93 percent) knew th<strong>at</strong> the right to be covered by anti-discrimin<strong>at</strong>ion laws coversemployees from the first day <strong>of</strong> their employment. In contrast, only six percent <strong>of</strong> respondents knew th<strong>at</strong> the right to be covered by unfair dismissallaws comes into force after they have been with their employer for one year.Only two per cent <strong>of</strong> respondents knew th<strong>at</strong> the right to a contract comesinto force after employees have been with their employer for two months.Questions were also asked about the right to be accompanied in disciplinaryand grievance issues, and on taking a case to an employment tribunal. Overnine out <strong>of</strong> ten respondents (93 per cent) were correct in thinking th<strong>at</strong>employees have the right to be accompanied to disciplinary or grievancehearings. However, when asked who could accompany them, only 18 percent got the answer exactly right and knew employees were only entitled totake a trade union <strong>of</strong>ficer and a work colleague with them. Just over half <strong>of</strong>respondents (52 per cent) knew th<strong>at</strong> employees only had to put theircomplaint in writing before making a claim (and so did not have to informAcas or appoint a solicitor, or make a claim without doing any <strong>of</strong> thesethings).A knowledge score was developed by giving respondents one point for eachanswer they got exactly right for some key knowledge questions. Theanalysis suggests th<strong>at</strong> it is the groups th<strong>at</strong> might be expected to be morevulnerable and to have low knowledge levels <strong>of</strong> their rights <strong>at</strong> work th<strong>at</strong> do infact have lower knowledge. For example, younger and older workers, parttimeworkers, those without an HR department, those who do not havemanagerial/supervisory duties, and lower earners.Experience <strong>of</strong> problemsIn all, 42 per cent <strong>of</strong> respondents had experienced a problem <strong>at</strong> work in thepast five years. Logistic regression shows th<strong>at</strong> having a long-term healthproblem or disability (compared to not having one) increased the odds <strong>of</strong>having had a problem, as did being ‘separ<strong>at</strong>ed/divorced’ compared to being‘single’, being in a ‘sales and customer services’ or ‘pr<strong>of</strong>essional’ occup<strong>at</strong>ion,compared to being in an ‘elementary occup<strong>at</strong>ion’, and being a tradeunion/staff associ<strong>at</strong>ion member, compared to not being one. Being ‘aware’ <strong>of</strong>their employment rights compared to ‘not being aware’ decreased the odds <strong>of</strong>4
having experienced a problem. As a respondent’s age increased by one year,the odds <strong>of</strong> them having had a problem decreased.Of those respondents th<strong>at</strong> had experienced a problem, the most commonproblem reported was issues to do with pay, which affected 22 per cent <strong>of</strong> allrespondents. This was followed by problems associ<strong>at</strong>ed with receiving acontract or written st<strong>at</strong>ement <strong>of</strong> the terms and conditions <strong>of</strong> the job; takingrest breaks <strong>at</strong> work; and the number <strong>of</strong> hours or days required to work; all <strong>of</strong>which were reported by 13 per cent <strong>of</strong> all respondents. Overall, respondentswho had had a problem reported an average <strong>of</strong> 2.8 distinct problems in theprevious five years. In terms <strong>of</strong> the most serious problem, the most commonarea was, again, issues rel<strong>at</strong>ed to pay, which accounted for 24 per cent <strong>of</strong>those respondents who had experienced a problem. Just under two-thirds <strong>of</strong>those respondents who had experienced a problem (65 per cent) felt th<strong>at</strong>their most serious problem had now been resolved.Just over half <strong>of</strong> those respondents reporting a problem (53 per cent) soughtadvice about their most serious problem. A manager <strong>at</strong> work (cited by 32 percent <strong>of</strong> only those who actually sought advice) followed by a trade unionrepresent<strong>at</strong>ive (cited by 19 per cent <strong>of</strong> those who actually sought advice)were the most popular sources <strong>of</strong> advice or inform<strong>at</strong>ion for the first contact arespondent made. The most popular sources <strong>of</strong> advice for subsequentcontacts were a manager <strong>at</strong> work (cited by 15 per cent <strong>of</strong> only those whoactually sought advice) followed by another colleague <strong>at</strong> work (cited by 12per cent <strong>of</strong> only those who actually sought advice).Over three-quarters <strong>of</strong> those respondents who had experienced a problem(77 per cent) discussed the issue face to face with their employer. Almostone-quarter <strong>of</strong> respondents who had experienced a problem (24 per cent) puttheir concerns in writing to their employer. Of those respondents th<strong>at</strong> diddiscuss the issues with their employer, one in four went to a formal meetingwith their employer. Of those who did not discuss the issue with theiremployer, more than half (54 per cent) said they would have liked to havehad this opportunity. Just three per cent <strong>of</strong> those who experienced a problemreported th<strong>at</strong> they had brought an employment tribunal case against theiremployer as a result <strong>of</strong> the problem(s). However, 20 per cent <strong>of</strong> those whoexperienced a problem reported leaving their employer as a direct result <strong>of</strong> aproblem <strong>at</strong> work in the previous five years. This is equivalent to eight percent <strong>of</strong> all respondents reporting leaving their employer as a direct result <strong>of</strong> aproblem <strong>at</strong> work in the previous five years.Logistic regression showed th<strong>at</strong> the following factors increased the odds <strong>of</strong> aproblem <strong>at</strong> work being resolved s<strong>at</strong>isfactorily: being a trade union/staffassoci<strong>at</strong>ion member (compared to not being one), being ‘aware’ in general <strong>of</strong>their employment rights (compared to ‘not being aware’), and discussing theproblem with their employer face to face (compared to not discussing it faceto face).Future sources <strong>of</strong> inform<strong>at</strong>ion and adviceRespondents were asked where they would go if they wanted to find outsome general inform<strong>at</strong>ion about their rights <strong>at</strong> work. Just over one in five <strong>of</strong>5
all respondents (21 per cent) said th<strong>at</strong> they would go to Personnel or an HR<strong>of</strong>ficer first, while 18 per cent would go to a manager <strong>at</strong> work, 16 per centwould use a website/the Internet, 14 per cent would use a Citizens’ AdviceBureau (CAB), and just over one in ten (11 per cent) would go to a tradeunion. Respondents were asked where they would go then if they had not gotthe inform<strong>at</strong>ion they had wanted, and an interesting shift occurs. Over one infive (22 per cent) <strong>of</strong> respondents who knew who they would contact firstwould then go to a CAB, while just under one in ten (19 per cent) who knewwho they would contact first would then go to a Personnel or HR <strong>of</strong>ficer.Sixteen per cent who knew who they would contact first would use awebsite/the Internet if they had not got the inform<strong>at</strong>ion they wanted, while13 per cent who knew who they would contact first would then go to amanager <strong>at</strong> work, and 13 per cent would go to a trade union.In all, 61 per cent <strong>of</strong> all respondents thought th<strong>at</strong> employers were mainlyresponsible for informing employees about their rights <strong>at</strong> work, 27 per cent <strong>of</strong>respondents thought th<strong>at</strong> employees were responsible for informingthemselves about their rights <strong>at</strong> work, while nine per cent thought th<strong>at</strong> it wasthe responsibility <strong>of</strong> government, and two per cent thought th<strong>at</strong> it was theresponsibility <strong>of</strong> trade unions. Thirty-four per cent <strong>of</strong> all respondents thoughtth<strong>at</strong> a dedic<strong>at</strong>ed website would be the most useful source if they neededinform<strong>at</strong>ion about their rights <strong>at</strong> work, 31 per cent <strong>of</strong> respondents thoughtth<strong>at</strong> a helpline similar to NHS Direct would be most useful, and 34 per centthought th<strong>at</strong> a booklet given to all employees would be most useful.About this surveyThis research was carried out as part <strong>of</strong> the Department <strong>of</strong> Trade andIndustry’s (<strong>DTI</strong>’s) employment rel<strong>at</strong>ions research programme. The reportpresents findings from the second benchmark survey <strong>of</strong> ‘<strong>Employees</strong>’Awareness, Knowledge and Exercise <strong>of</strong> <strong>Employment</strong> <strong>Rights</strong>’ conducted in2005 among adults <strong>of</strong> working age who had worked as employees in Gre<strong>at</strong>Britain in the previous two years. The research was undertaken by theInstitute for <strong>Employment</strong> Studies (IES), in partnership with the British MarketResearch Bureau. Using computer-assisted personal interviewing (CAPI),1,038 face-to-face interviews were conducted between June and October2005 in the homes <strong>of</strong> individuals. Improvements in questionnaire design,sampling, and the shift from a telephone to a face-to-face d<strong>at</strong>a collectionmethod mean th<strong>at</strong> it is not possible to make reliable comparisons betweenfindings from the 2001 and 2005 surveys.6
1Introduction andmethodologyA wide range <strong>of</strong> legisl<strong>at</strong>ion has been introduced in recent years to protect therights <strong>of</strong> individuals in employment. It is particularly important th<strong>at</strong>individuals have sufficient levels <strong>of</strong> awareness and knowledge <strong>of</strong> the rightsintroduced in this legisl<strong>at</strong>ion, as they are required to enforce these aspects <strong>of</strong>the law themselves. Individuals are only able to exercise their rights if theyare aware th<strong>at</strong> their employer is in breach <strong>of</strong> the law, and know where to getinform<strong>at</strong>ion and advice if they experience a problem to do with their rights <strong>at</strong>work.The first benchmark survey <strong>of</strong> ‘Awareness, Knowledge and Exercise <strong>of</strong>Individual <strong>Employment</strong> <strong>Rights</strong>’ was conducted in 2001 to assess the extent towhich individuals were aware <strong>of</strong> their rights, had detailed knowledge <strong>of</strong> wh<strong>at</strong>those rights entailed, and were exercising their rights (Meager et al., 2002).Since this first benchmark survey was conducted, further legisl<strong>at</strong>ion has beenintroduced, most notably the <strong>Employment</strong> Act 2002, which covers a broadrange <strong>of</strong> issues including work and parents and dispute resolution in theworkplace. This report presents the results <strong>of</strong> the second benchmark surveyconducted in 2005, after the introduction <strong>of</strong> this legisl<strong>at</strong>ion.This report will answer the question: are employees aware <strong>of</strong>, knowledgeableabout, and inclined to exercise their rights <strong>at</strong> work? It presents the findings<strong>of</strong> research undertaken by the Institute for <strong>Employment</strong> Studies (IES), inpartnership with the British Market Research Bureau (BMRB), andcommissioned by the <strong>DTI</strong>.1.1 The research aimsThe main aims <strong>of</strong> the study were:• to assess employees’ general awareness <strong>of</strong> the scope <strong>of</strong> their employmentrights and, where appropri<strong>at</strong>e and relevant, to draw comparisons with the2001 survey• for selected topics to establish employees’ knowledge <strong>of</strong> specificemployment rights provisions (eg level <strong>of</strong> the N<strong>at</strong>ional Minimum Wage,NMW), qualifying period for taking action on the grounds <strong>of</strong> unfair dismissaland discrimin<strong>at</strong>ion cases, and rules for the award <strong>of</strong> costs in employmenttribunal cases)7
• to find out the main sources <strong>of</strong> inform<strong>at</strong>ion and pr<strong>of</strong>essional advice aboutemployment rights issues and, where employees have had a recent problem(eg in the past five years), where they sought advice and guidance andwh<strong>at</strong> they did to try and resolve the problem• to identify the personal and employment characteristics th<strong>at</strong> influenceemployees’ levels <strong>of</strong> awareness, knowledge and preparedness to seekadvice and take action to enforce their individual employment rights(including employment st<strong>at</strong>us).Additional aims <strong>of</strong> the survey were:• to investig<strong>at</strong>e employees’ reasons and choices for overtime and long-hoursworking (as defined by the <strong>Work</strong>ing Time Regul<strong>at</strong>ions, WTR)• to estim<strong>at</strong>e the extent <strong>of</strong> on-call working in the UK, differenti<strong>at</strong>ing betweenthose on call <strong>at</strong> their place <strong>of</strong> work (residential on-call) and those who areable to leave their place <strong>of</strong> work.1.2 <strong>Employment</strong> rights – background1.2.1 Legisl<strong>at</strong>ive framework 1There have been key reforms in UK employment law over the past few years.These include:• the <strong>Employment</strong> Rel<strong>at</strong>ions Act 1999, which introduced a range <strong>of</strong> provisionsincluding: parental leave and dependant care leave (by mid-December1999), an increase in the limit on unfair dismissal compens<strong>at</strong>ion to amaximum <strong>of</strong> £50,000 (from 25 October 1999), and the right to beaccompanied <strong>at</strong> disciplinary and grievance proceedings (from Spring 2000)• the NMW Act 1998 and the NMW Regul<strong>at</strong>ions 1999, which applied from April1999, introducing a minimum wage <strong>at</strong> £3.60 per hour (£3.70 from October2000), and a youth r<strong>at</strong>e <strong>at</strong> £3.00 for 18 to 21 year olds (£3.20 from June2000). The NMW has been up-r<strong>at</strong>ed each year since its introduction, and aminimum r<strong>at</strong>e for 16 and 17 year olds not on apprenticeships wasintroduced in October 2004• Collective Redundancies and Transfer <strong>of</strong> Undertakings (Protection <strong>of</strong><strong>Employment</strong>), which came into force from July 1999• the WTR 1998 (which aim to limit average working hours), introduced inOctober 1998• M<strong>at</strong>ernity and Parental Leave Regul<strong>at</strong>ions, which took effect from December1999• the Human <strong>Rights</strong> Act 1998, which came into force in October 20001This section builds on Meager et al. (2002).8
• Sex Discrimin<strong>at</strong>ion (Gender Re-assignment) Regul<strong>at</strong>ions 1999, which tookeffect from June 1999• the Disability <strong>Rights</strong> Commission (DRC) Act 1999, which resulted in theestablishment <strong>of</strong> the DRC in April 2000• the Disability Discrimin<strong>at</strong>ion Act (DDA) 1995 (which was designed to end thediscrimin<strong>at</strong>ion th<strong>at</strong> many disabled people face and included giving disabledpeople rights in the areas <strong>of</strong> employment), introduced in phases inDecember 1996, October 1999 and October 2004• the DDA 2005 (which extended existing provisions in the DDA 1995,including requiring public bodies to promote equality <strong>of</strong> opportunity fordisabled people and ensuring th<strong>at</strong> discrimin<strong>at</strong>ion law covers all the activities<strong>of</strong> the public sector), introduced in phases in December 2005 and December2006• the <strong>Employment</strong> Act 2002, which introduced a range <strong>of</strong> provisions including:changes to m<strong>at</strong>ernity/p<strong>at</strong>ernity/adoption leave and pay provisions (whichcame into force in April 2003), tribunal reform (which came into force inOctober 2004), right to request flexible working for parents <strong>of</strong> childrenunder six or disabled children under 18 (which came into force in April2003), and dispute resolution in the workplace (which came into force inOctober 2004).1.2.2 Institutional framework 2If an individual wishes to pursue a claim against their employer because <strong>of</strong> aninfringement <strong>of</strong> their employment rights, they are able to use theemployment tribunal system. <strong>Employment</strong> tribunals are independent judicialbodies, which determine disputes rel<strong>at</strong>ing mainly to individual employmentrights. Dealing with over 50 different types <strong>of</strong> complaint, including unfairdismissal, unlawful deduction <strong>of</strong> wages and breach <strong>of</strong> contract, they aim toprovide speedy, accessible and rel<strong>at</strong>ively informal justice. In addition, the<strong>Employment</strong> Appeals Tribunal deals with appeals against employmenttribunal decisions, based on points <strong>of</strong> law.There are also several bodies which can assist individuals in finding out aboutand enforcing their employment rights. Sources <strong>of</strong> free legal advice includethe following.• The Advisory, Concili<strong>at</strong>ion and Arbitr<strong>at</strong>ion Service (Acas) plays a central rolein the promotion <strong>of</strong> good industrial rel<strong>at</strong>ions and is able to intervene indisputes to promote settlement. A copy <strong>of</strong> all claims th<strong>at</strong> go to employmenttribunal is sent to a concili<strong>at</strong>ion <strong>of</strong>ficer <strong>at</strong> Acas.• Law centres and Citizens’ Advice Bureaux (CABs) <strong>of</strong>fer free advice and canprovide further assistance such as completion <strong>of</strong> claim forms, but are notable to provide represent<strong>at</strong>ion.2This section builds on Meager et al. (2002).9
• A variety <strong>of</strong> telephone help-lines (eg th<strong>at</strong> <strong>of</strong>fered by the <strong>DTI</strong> on the NMW)and specialist advice centres are available.If an individual does decide to pursue an employment tribunal claim there areseveral potential sources <strong>of</strong> support or funding, which include:• legal aid, which although not generally available for claims <strong>at</strong> employmenttribunals, is available for those eligible (by income) to get some free legaladvice and assistance through the ‘ET1’ form• trade unions, which usually have funds set aside to assist members withemployment disputes• the Commission for Racial Equality, which can help with claims based onrace discrimin<strong>at</strong>ion• the Equal Opportunities Commission, which can help with claims which fallunder the Sex Discrimin<strong>at</strong>ion Act or Equal Pay Act• the DRC, which can provide legal advice and support to individuals whobelieve they have been discrimin<strong>at</strong>ed against because <strong>of</strong> a disability• the Health and Safety Commission, which can give assistance where theclaim falls under the Health and Safety <strong>at</strong> <strong>Work</strong> Act, or in the context <strong>of</strong> anyhealth and safety issue <strong>at</strong> work• pressure groups, associ<strong>at</strong>ions and pro bono legal groups, who may bewilling to support an individual, where the claim is felt to highlight aparticular campaign or issue.1.2.3 Tribunal applic<strong>at</strong>ionsThe <strong>Survey</strong> <strong>of</strong> <strong>Employment</strong> Tribunal Applic<strong>at</strong>ions (SETA) provided inform<strong>at</strong>ionon the characteristics <strong>of</strong> the parties in, and key fe<strong>at</strong>ures <strong>of</strong>, employmenttribunal cases (Hayward et al., 2004). SETA 2003 3 found th<strong>at</strong>:‘The characteristics <strong>of</strong> the parties have not changed much since the 1998survey. Applicants were more likely to be men, managerial workers or aged45 or over. The priv<strong>at</strong>e sector accounted for 82 per cent <strong>of</strong> cases withsmall workplaces (1-24) and small-medium sized organis<strong>at</strong>ions (50-249)over-represented. Employers were significantly more likely than applicantsto report th<strong>at</strong> workplace dispute resolution procedures were in place andfollowed. Solicitors were the main providers <strong>of</strong> legal advice but were usedsignificantly more by employers. Four in ten parties received unsolicitedcalls <strong>of</strong>fering pr<strong>of</strong>essional advice and represent<strong>at</strong>ion. Overall s<strong>at</strong>isfactionwith the employment tribunal system was quite high, more so amongstapplicants (72% v 65%), though employers were more likely to be s<strong>at</strong>isfiedwith the outcome <strong>of</strong> the case (67% v 56%).’(page xv, Hayward et al., 2004)3SETA 2003 is the fourth in a series or surveys conducted in 1987, 1992, 1998 and2003.10
These and other findings from SETA 2003 were based on a random sample <strong>of</strong>employment tribunal cases and are, therefore, not directly comparable to thefindings in this report (for example, in the case <strong>of</strong> advice sources used). Thefindings in this report are based on a represent<strong>at</strong>ive sample <strong>of</strong> people <strong>of</strong>working age who have been employees within the past two years, not onapplicants and employers in <strong>Employment</strong> Tribunal cases. Findings presentedin this report show th<strong>at</strong> a very small minority <strong>of</strong> respondents tookemployment tribunal cases in response to a self-defined problem to do withtheir rights <strong>at</strong> work (see Chapter 4).1.2.4 Changing employment rel<strong>at</strong>ionsFirst findings 4 from the 2004 <strong>Work</strong>place <strong>Employment</strong> Rel<strong>at</strong>ions <strong>Survey</strong> (WERS2004) provide inform<strong>at</strong>ion on the key dimensions <strong>of</strong> employment rel<strong>at</strong>ionsand working life in Britain, and in limited areas, on change since the 1998survey 5 (Kersley et al., 2005), in a period where a range <strong>of</strong> relevantlegisl<strong>at</strong>ion discussed above has been introduced.The first findings from WERS 2004 show th<strong>at</strong> many aspects <strong>of</strong> employmentrel<strong>at</strong>ions have not changed substantially since the 1998 survey, including theincidence <strong>of</strong> various dispute, grievance and disciplinary procedures (Kersleyet al., 2005). One <strong>of</strong> the most striking areas th<strong>at</strong> has changed, cited by theauthors, was the continued decline <strong>of</strong> collective labour organis<strong>at</strong>ion:‘<strong>Employees</strong> were less likely to be union members than they were in 1998;workplaces were less likely to recognise unions for bargaining over pay andconditions; and collective bargaining was less prevalent’.(page 35-36, Kersley et al., 2005)However, Kersley et al. (2005) also emphasise th<strong>at</strong> the r<strong>at</strong>e <strong>of</strong> declineappears to have slowed from th<strong>at</strong> seen in earlier periods, and th<strong>at</strong> half <strong>of</strong>employees were employed in workplaces with a recognised union, one-thirdwere union members and four in ten had their pay set through collectivebargaining. Union involvement in pay setting and the joint regul<strong>at</strong>ion <strong>of</strong> theworkplace was the exception in the priv<strong>at</strong>e sector and in smaller workplaces(p36, Kersley et al., 2005). As Meager et al. (2002) highlight, these changesto collective labour organis<strong>at</strong>ion, if anything, reinforce the importance <strong>of</strong>individuals having awareness and knowledge <strong>of</strong> their employment rights.The first findings also show th<strong>at</strong> collective workplace conflict has remainedlow since 1998, but while managers’ perceptions <strong>of</strong> management-employeerel<strong>at</strong>ions have improved, there had been little change in employees’ views.The findings show a substantial increase in the availability <strong>of</strong> flexible workingarrangements, as well as increases in the incidence <strong>of</strong> paid p<strong>at</strong>ernity leaveand special paid leave. However, employees did not perceive a change inemployer <strong>at</strong>titudes in the area <strong>of</strong> work-life balance, and were also <strong>of</strong>ten45A full report <strong>of</strong> the findings <strong>of</strong> WERS 2004 is due to be published in summer 2006.WERS 2004 is the fifth in a series <strong>of</strong> surveys conducted in 1980, 1984, 1990, 1998and 2004.11
unaware <strong>of</strong> wh<strong>at</strong> was available to them personally in terms <strong>of</strong> flexible workingarrangements (p36, Kersley et al., 2005).1.2.5 <strong>Survey</strong> d<strong>at</strong>a on individuals’ propensities to take action onemployment issuesThe Legal Services Research Centre (LSRC) report on the English and WelshCivil and Social Justice <strong>Survey</strong> incorpor<strong>at</strong>es findings from the 2004 survey(Pleasence, 2006). It consists <strong>of</strong> face-to-face interviews across England andWales and examines:‘… justiciable problems in a broader social and geographical context,setting out more details <strong>of</strong> the impact <strong>of</strong> problems, further revealing levels<strong>of</strong> awareness and understanding <strong>of</strong> legal and advice services, furtherdepicting the methods and resources used by people to access suchservices and assessing the degree to which legal and advice servicesfacilit<strong>at</strong>e problem resolution and prevention. In doing so, it again illustr<strong>at</strong>esand underlines the important links between justiciable problems and socialexclusion, and between civil law and social justice’.(p5, Pleasence, 2006)The survey was a random general popul<strong>at</strong>ion survey and focused onexploring people’s experience <strong>of</strong> 18 possible justiciable problem areas in thepreceding three years th<strong>at</strong> had been ‘difficult to solve’. The justiciableproblem areas were wide ranging and included, for example, areas such asconsumer problems, personal injury, money/debt problems, and difficultieswith neighbours or housing. The c<strong>at</strong>egory <strong>of</strong> ‘employment problems’ includedunfavourable changes being made to terms and conditions <strong>of</strong> employment,the work environment being uns<strong>at</strong>isfactory or dangerous, and being sackedor made redundant. Those reporting <strong>at</strong> least one problem area proceeded tothe main interview which focused on a single problem in more depth. Themain interview included areas such as the advice taken (including awarenessand obstacles), impact <strong>of</strong> the problems, resolution and general <strong>at</strong>titudes tothe civil justice system.Where possible in Chapter 4 (The Experience <strong>of</strong> Problems), comparison hasbeen made with the LSRC research. However, because <strong>of</strong> the very differentcharacteristics <strong>of</strong> the interview subjects, little direct comparison is possible.For example, although both surveys talk about the prevalence <strong>of</strong> employmentrel<strong>at</strong>ed problems, the LSRC figure <strong>of</strong> five per cent <strong>of</strong> respondents reportingsuch a problem is drawn from a base <strong>of</strong> respondents experiencing <strong>at</strong> leastone <strong>of</strong> any number <strong>of</strong> problem areas r<strong>at</strong>her than from a random sample <strong>of</strong>employed adults.The LSRC respondents came from a variety <strong>of</strong> circumstances including thosenot working or self-employed; d<strong>at</strong>a reported in the LSRC report such as thefinding th<strong>at</strong> employment problems were more likely to be reported by theunemployed than those working, illustr<strong>at</strong>es the difficulties in comparingfindings across the two surveys. Nevertheless, LSRC findings have beenreported where appropri<strong>at</strong>e.12
1.3 MethodologyKey elements <strong>of</strong> the methodology for this survey are set out in brief here,while the detailed methodology used to conduct this survey is set out in theTechnical Report, Cognitive Report and Pilot Report produced by BMRB th<strong>at</strong>are published alongside this report (BMRB 2006a, 2006b, 2006c).This report presents findings from the Second Benchmark <strong>Survey</strong> <strong>of</strong><strong>Employees</strong>’ Awareness, Knowledge and Exercise <strong>of</strong> <strong>Employment</strong> <strong>Rights</strong>, asurvey conducted in 2005 <strong>of</strong> adults <strong>of</strong> working age (16 to 64 for men and 16to 59 for women) who have worked as an employee in Gre<strong>at</strong> Britain in theprevious two years. Random sampling with one adult interviewed perhousehold was conducted. Face-to-face interviews were conducted in thehome using Computer-assisted personal interviewing (CAPI). The targetresponse r<strong>at</strong>e was 65 per cent. The final number <strong>of</strong> interviews completed was1,038 <strong>at</strong> a 58 per cent response r<strong>at</strong>e.1.3.1 Questionnaire designWhile the survey was designed building on the questionnaire used in the firstbenchmark survey conducted in 2001, there was a large amount <strong>of</strong> re-designinvolved. This re-design took place to take into account the aims <strong>of</strong> the 2005survey, the shift in emphasis <strong>of</strong> the 2005 survey 6 , the move to conductingthe survey face to face r<strong>at</strong>her than on the telephone 7 and the opportunitiesthis presented in the way th<strong>at</strong> questions could be asked, and lessons learnedfrom the design and analysis <strong>of</strong> the 2001 survey. The questionnaire had fivemain substantive sections:• awareness• knowledge• experience <strong>of</strong> problems• likelihood <strong>of</strong> future problems• future sources <strong>of</strong> inform<strong>at</strong>ion and advice.In terms <strong>of</strong> the section on awareness, the survey included some generalquestions about how well informed respondents felt about their rights <strong>at</strong>work, whether they knew as much as they felt th<strong>at</strong> they needed to know, andwhere they would go to find out inform<strong>at</strong>ion about their rights. The approach,when asking about awareness <strong>of</strong> particular rights, differed substantially fromthe 2001 survey, which did not prompt the awareness <strong>of</strong> rights. In the 2005survey, a card-sorting exercise was used as a way <strong>of</strong> asking questions aboutrespondents’ awareness <strong>of</strong> the large number <strong>of</strong> different employment rights67With a gre<strong>at</strong>er emphasis placed on the importance <strong>of</strong> awareness and knowingwhere to go to get inform<strong>at</strong>ion about rights, r<strong>at</strong>her than needing to have detailedknowledge <strong>of</strong> a large number <strong>of</strong> rights <strong>at</strong> work.A telephone methodology was used in the 2001 survey.13
which the survey covered. These exercises consisted <strong>of</strong> specific employmentrights or employer responsibilities being printed on small cards (known as‘shuffle cards’) and respondents being asked to sort the cards onto a boardshowing a response list or scale. Shuffle cards were used to help respondentsdeal with a large number <strong>of</strong> rights in a user-friendly way and to help breakupthe interview (BMRB, 2006a). The cards given to respondents includedreal employment rights and some provisions th<strong>at</strong> are not covered by law.Card exercises were also used to examine how much respondents’ felt th<strong>at</strong>they knew about the detail <strong>of</strong> these rights and how important it was for themto know about them.When testing respondents’ knowledge, it was decided in the 2005 survey t<strong>of</strong>ocus on key employment rights th<strong>at</strong> were the most universally relevant,where it was particularly important th<strong>at</strong> respondents know the detail <strong>of</strong> thelaw, or where it was important for respondents to know when key rightscame into force (in terms <strong>of</strong> dur<strong>at</strong>ion <strong>of</strong> employment). Again, a new approachwas used from th<strong>at</strong> used in the 2001 survey, so th<strong>at</strong> respondents were askedwh<strong>at</strong> they thought their rights were in a particular case, asked to choosefrom a range <strong>of</strong> responses, and then asked how sure they were about theanswer to a question. 8 This approach is set out in more detail in Chapter 3.When asking respondents about their experience <strong>of</strong> problems, shuffle cardswere used to prompt respondents about their experience <strong>of</strong> problems in thepast five years. Again, this was very different to the 2001 survey whereproblems were unprompted. Respondents in the 2005 survey were givencards to sort onto a board to indic<strong>at</strong>e wh<strong>at</strong> types <strong>of</strong> problems they hadexperienced. Where they had experienced a problem, they were also askedwhether they had sought advice or help and wh<strong>at</strong> the outcome <strong>of</strong> theproblem had been. The approach taken to asking about problems is furtheroutlined in Chapter 4.All respondents who were currently working were asked about whether theywere likely to experience problems to do with their rights <strong>at</strong> work in thefuture. They were also asked if they would seek inform<strong>at</strong>ion and advice, wh<strong>at</strong>sources they would use, and how confident they were th<strong>at</strong> they could dealwith the potential problem.Finally, all respondents were asked how they would go about findinginform<strong>at</strong>ion or advice about their rights <strong>at</strong> work if they needed to in thefuture. As well as being asked about where they would go to get inform<strong>at</strong>ionand advice, they were also asked who they felt was responsible for makingthem aware about their rights <strong>at</strong> work and wh<strong>at</strong> inform<strong>at</strong>ion services theywould find more useful.1.3.2 SamplingThe sampling str<strong>at</strong>egy used for this survey is set out in detail in BMRB 2006a.As discussed by BMRB (2006a), the sample needed to be represent<strong>at</strong>ive <strong>of</strong>8In the 2001 survey respondents were given the detail <strong>of</strong> a right and then asked ifthey were aware <strong>of</strong> it.14
people <strong>of</strong> working age who were current employees, or had been employeesin the previous two years, and who were living in priv<strong>at</strong>e households in Gre<strong>at</strong>Britain. In order to reach this specific popul<strong>at</strong>ion, the sample was initiallyselected to be represent<strong>at</strong>ive <strong>of</strong> the general popul<strong>at</strong>ion, with additionalscreening carried out on the doorstep by interviewers. The sample designwas a conventional multi-stage design using postcode sectors, orcombin<strong>at</strong>ions <strong>of</strong> postcode sectors, as primary sampling units. The sample <strong>of</strong>postcode sectors was proportionally str<strong>at</strong>ified (see BMRB, 2006a, for furtherdetails). The findings <strong>of</strong> this report are based on these interviews, <strong>of</strong> which1,038 were achieved.1.3.3 PilotingThe piloting str<strong>at</strong>egy used for this survey is discussed in detail in BMRB2006a, 2006b and 2006c. Three stages <strong>of</strong> pilot work were carried out beforethe main fieldwork stage:• a small-scale cognitive testing stage carried out by BMRB researchers,alongside researchers from IES• a pilot stage carried out by BMRB interviewers, alongside researchers fromBMRB, <strong>DTI</strong> and IES• a larger scale ‘dress rehearsal’ stage.As set out in BMRB 2006a and 2006b, cognitive testing seeks to understandthe thought processes a respondent uses in trying to answer a surveyquestion. The cognitive testing exercise was carried out using a paper version<strong>of</strong> the questionnaire and aimed to test respondents’ understanding <strong>of</strong> thedraft questions. A total <strong>of</strong> 12 interviews were conducted in this stage.After changes had been made to the questionnaire based on findings fromthe cognitive testing, a pilot survey was conducted (BMRB 2006a and 2006c).Interviewers conducted these interviews using laptops, testing thequestionnaire in CAPI form for the first time, and interviews were observedby members <strong>of</strong> the research team. This allowed the identific<strong>at</strong>ion <strong>of</strong> areas <strong>of</strong>doubt, misunderstanding or incomprehension on the part <strong>of</strong> the respondent,and also allowed assessment <strong>of</strong> the length <strong>of</strong> the interview. A total <strong>of</strong> 12interviews were achieved <strong>at</strong> this pilot stage, with quotas on sex and age.Changes were made to the questionnaire based on findings from the pilotsurvey, and a ‘dress rehearsal’ was then conducted to rehearse the surveyprocedures, to anticip<strong>at</strong>e problems th<strong>at</strong> might arise in the field, to establisheffective ways <strong>of</strong> introducing the questionnaire, to provide a robust test <strong>of</strong>interview length, and to test the full CAPI version <strong>of</strong> the questionnaire(BMRB, 2006a). A total <strong>of</strong> 38 interviews were completed in this dressrehearsal stage. After a de-briefing session with interviewers and members <strong>of</strong>the research team, a number <strong>of</strong> final changes to the questionnaire wereagreed.15
1.4 Comparisons with the first benchmark surveyThe major differences in questionnaire design and the shift from a telephoneto a face-to-face methodology between the 2001 and 2005 surveys(described in Section 1.3 above), mean th<strong>at</strong> it is not possible to make reliablecomparisons between findings from the two surveys. While this applies tocomparing all findings from the 2005 survey with the 2001 survey, this isparticularly the case where questions th<strong>at</strong> were un-prompted in 2001 arenow prompted (such as awareness <strong>of</strong> particular rights and experience <strong>of</strong>problems), and knowledge <strong>of</strong> rights, which is tested in a different way.1.5 Present<strong>at</strong>ion <strong>of</strong> the findingsFor the most part, the results presented in the report will be based on simplebivari<strong>at</strong>e cross-tabul<strong>at</strong>ions <strong>of</strong> survey variables (although some regressionanalysis is also presented in Chapters 2 and 4, and in more detail in Appendix2). Key rel<strong>at</strong>ionships between the relevant variables are presented in thetables in the report.Rel<strong>at</strong>ionships are only reported in the text <strong>of</strong> the report if they arest<strong>at</strong>istically significant 9 , and rel<strong>at</strong>ionships th<strong>at</strong> are not significant will not bediscussed in the text. 10 Significance is measured <strong>at</strong> a cut-<strong>of</strong>f <strong>of</strong> 90 per centsignificance in a two-sided test. However, if the minimum expected frequencyis less than one, or the number <strong>of</strong> cells with an expected frequency <strong>of</strong> lessthan five applies to more than 20 per cent <strong>of</strong> the cells, the sample size is toosmall for the test to be reliable, and the result is not reported as significant,regardless <strong>of</strong> the Chi-Square st<strong>at</strong>istic. Pearson’s Chi-Square has been used totest significance on cross-tabul<strong>at</strong>ions, and One-Way ANOVA has been used totest significance on mean scores.Where any <strong>of</strong> the weighted cell counts are fewer than five, the cell is markedwith an asterisk, while where there are no respondents in a cell, the cell ismarked with a dash. ‘Don’t know’ responses are included in the table wherethey are <strong>of</strong> relevance to the question or are a large group, and are excludedwhere they are a very small number <strong>of</strong> cases.Some groups within the sample are very small, particularly those from non-White ethnic groups, those with a religion other than Christianity, and thosewho do not describe themselves as heterosexual. It has, therefore, not been9SPSS Complex Samples was used when testing st<strong>at</strong>istical significance so th<strong>at</strong>survey design effects could be taken into account. SPSS Base package calcul<strong>at</strong>essignificance using weighted d<strong>at</strong>a, while SPSS Complex Samples ignores the weightvariable and calcul<strong>at</strong>es significance using unweighted d<strong>at</strong>a. Tests for significancewere therefore conducted in both SPSS Base and SPSS Complex Samples, and theresults reported in this report as significant are those th<strong>at</strong> were significant in bothSPSS Base and SPSS Complex Samples.10 Except in a few cases where the rel<strong>at</strong>ionship is thought to be relevant/interestingto the topic being discussed. Where this is the case, it will be made clear th<strong>at</strong> therel<strong>at</strong>ionship is not significant.17
possible to conduct detailed analysis on ethnicity, religion and sexualorient<strong>at</strong>ion.1.6 Structure <strong>of</strong> the reportThe findings from the survey are presented in the following chapters.Chapter 2 presents the findings from the awareness section <strong>of</strong> the survey,discussing general awareness and awareness <strong>of</strong> specific rights.Chapter 3 discusses the findings from the knowledge section <strong>of</strong> the survey,examining:• working time, annual leave and rest breaks• NMW• rights around employees having children and dependants• the point <strong>at</strong> which rights came into force• disciplinary and grievance procedures• the process around making a claim to an employment tribunal.Chapter 4 examines respondents’ experience <strong>of</strong> problems to do with theirrights <strong>at</strong> work. Chapter 5 reviews wh<strong>at</strong> future sources or inform<strong>at</strong>ion andadvice respondents would use to get inform<strong>at</strong>ion about their rights <strong>at</strong> work.Chapter 6 presents a summary <strong>of</strong> key findings by employment right. Chapter7 draws together some conclusions from the survey as a whole.Finally, the report contains:• Appendix 1, which is a description <strong>of</strong> the sample• Appendix 2, which presents the logistic regression methodology and results• Appendix 3, which presents the results on on-call working• Appendix 4, which presents a list <strong>of</strong> acronyms• Bibliography, citing the sources referred to in this report.1.7 D<strong>at</strong>a availabilityIn the interests <strong>of</strong> openness and public accountability, the <strong>DTI</strong> will make thed<strong>at</strong>aset and supporting technical inform<strong>at</strong>ion available through the UK D<strong>at</strong>aArchive based <strong>at</strong> the University <strong>of</strong> Essex (http://www.d<strong>at</strong>a-archive.ac.uk) inspring 2006. The <strong>DTI</strong> encourages secondary analysis <strong>of</strong> this d<strong>at</strong>aset andthose who conduct such analysis are also encouraged to inform theDepartment <strong>of</strong> findings or public<strong>at</strong>ions which result from such analysis byemailing emar@dti.gsi.gov.uk..18
2Awareness <strong>of</strong>employment rightsThis chapter examines respondents’ awareness <strong>of</strong> their employment rights. Itfirstly examines how well informed respondents feel about their rights <strong>at</strong>work, before looking <strong>at</strong> whether respondents feel th<strong>at</strong> they know as much asthey need to know about their rights <strong>at</strong> work, and whether they would knowwhere to go to find out inform<strong>at</strong>ion about their rights <strong>at</strong> work. The chapterthen examines levels <strong>of</strong> awareness <strong>of</strong> a specific set <strong>of</strong> employment rights, aswell as some provisions th<strong>at</strong> are not covered by law, and looks <strong>at</strong> how muchrespondents’ know about the detail <strong>of</strong> those provisions th<strong>at</strong> they think arecovered by law. It then analyses the ‘awareness deficits’ <strong>of</strong> actual rights, th<strong>at</strong>is, the proportion <strong>of</strong> respondents who were unaware th<strong>at</strong> a right was a legaloblig<strong>at</strong>ion, but felt th<strong>at</strong> it was very important for them to know about it.Finally, the chapter presents analysis on the development <strong>of</strong> an awarenessscore, where respondents were given a score based on their answers toawareness questions. Rel<strong>at</strong>ionships are only reported in the text <strong>of</strong> thischapter if they are st<strong>at</strong>istically significant (unless otherwise st<strong>at</strong>ed).2.1 How well informed respondents feel about their rights <strong>at</strong>workRespondents were asked:‘So, first <strong>of</strong> all, very generally, how well informed do you feel about yourrights <strong>at</strong> work?’Table 2.1 shows the results <strong>of</strong> this question. It shows th<strong>at</strong> 15 per cent <strong>of</strong>respondents felt very well informed about their rights <strong>at</strong> work, with a further51 per cent feeling well informed, 28 per cent feeling not very well informed,and six per cent feeling not well informed <strong>at</strong> all. Public-sector workers weremore likely to feel informed about their rights <strong>at</strong> work than priv<strong>at</strong>e-sectorworkers, as were those with managerial/supervisory duties compared tothose without such duties. Those who had experienced problems in the pastto do with their rights <strong>at</strong> work were less likely to feel informed about theirrights <strong>at</strong> work than those who had not experienced a problem, perhapsbecause their problem had made them aware <strong>of</strong> the extent to which theylacked necessary inform<strong>at</strong>ion.19
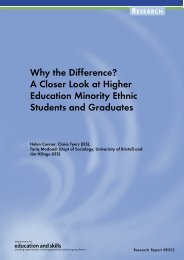
Table 2.1: How well informed respondents feel about their rights <strong>at</strong>workVery wellinformedWellinformedNot verywellinformedNot wellinformed <strong>at</strong>all% % % %UnweightedbaseAll respondents 15 51 28 6 1,038Age 16-24 13 39 36 12 11425-34 13 54 29 3 21535-44 17 52 27 4 28945-54 12 57 22 9 24955-64 17 45 30 6 170Gender Male 12 52 29 6 472Female 17 49 27 7 566Earnings Under £15,000 12 44 35 9 412£15,000 to £24,999 17 53 24 6 260£25,000 to £39,999 13 57 26 4 174£40,000 + 12 70 15 3 79Hours worked Full-time 14 53 27 6 781Part-time 17 54 33 7 250Type <strong>of</strong> organis<strong>at</strong>ion Public sector 20 54 22 3 336Priv<strong>at</strong>e sector 12 49 31 8 662Whether has Yes 18 54 24 4 735HR/personnel deptNo 8 44 35 13 259Whether experienced Yes 11 47 34 8 416problemsNo 17 53 24 6 622Managerial/supervisory Yes 18 58 20 4 387dutiesNo 13 46 33 8 651Number <strong>of</strong> employees 1 to 9 15 44 31 9 159in workplace10 to 24 12 51 28 9 16824 to 99 9 51 34 5 250100 to 499 17 49 27 6 228500+ 21 56 20 4 208Note: ‘Don’t know’ responses not included as only four weighted cases.Source: IES/BMRB, 2005Figure 2.1 compares the results from this question from all respondents inthe 2005 survey and all respondents in the 2001 survey. Comparisonsbetween findings from the two surveys should be tre<strong>at</strong>ed with extremecaution and cannot be seen as reliable, because <strong>of</strong> the change inmethodology and survey design (see Chapter 1, Section 1.4 for moreinform<strong>at</strong>ion).20
Figure 2.1: How well informed respondents feel about their rights <strong>at</strong>work: 2005 survey compared to 2001 surveyper cent10090807060504030201006 628 2551 5715 12All respondents 2005 (1,038) All respondents 2001 (1,000)Very well informed Well informed Not very well informed Not well informed <strong>at</strong> allSource: IES/BMRB, 2005Figure 2.1 shows th<strong>at</strong> in the 2005 survey, 65 per cent <strong>of</strong> respondents felteither very well informed or well informed, compared to 69 per cent in the2001 survey. In the 2005 survey, more respondents feel very well informed(15 per cent) than they did in the 2001 survey (12 per cent), but fewer feelwell informed (51 per cent in 2005 compared to 57 per cent in 2001).2.1.1 Regression analysis on general awarenessTo explore the rel<strong>at</strong>ionships th<strong>at</strong> may exist between general awareness andthe characteristics analysed above (such as gender and hours worked)regression analysis is needed. Regression analysis fits a predictive model tothe d<strong>at</strong>a and uses the model to predict the dependent variable, in this casegeneral awareness, from one or more independent variables. Therefore, it ispossible to look <strong>at</strong> the predictive power <strong>of</strong> a given factor, such as gender, ongeneral awareness, holding other factors constant.The technique used is logistic regression, where the dependent variable iscoded 1 or 0. For example, if the respondent is c<strong>at</strong>egorised as ‘aware’ this iscoded as 1, and coded as 0 if they are ‘not aware’. The st<strong>at</strong>istical model isestim<strong>at</strong>ed with a range <strong>of</strong> independent variables and assesses the effect <strong>of</strong>changing one <strong>of</strong> the independent variables on the odds 11 <strong>of</strong> the respondentbeing, for example, aware <strong>of</strong> their employment rights. For a detailed account<strong>of</strong> how regression analysis on general awareness <strong>of</strong> employment rights wasconducted, see Appendix 2.11 Odds in this context are just an altern<strong>at</strong>ive way <strong>of</strong> representing probabilities, so ifthe probability <strong>of</strong> the respondent being aware is ten per cent, the odds are nine toone against, or 0.11.21
Independent variables were selected which could affect how generally aware<strong>of</strong> their employment rights a respondent believes themselves to be. Thesecan be grouped into two broad c<strong>at</strong>egories: employment characteristics andpersonal characteristics. The factors which were examined are listed below.Personal characteristics:• gender• marital st<strong>at</strong>us• whether the respondent has a dependent child• whether the respondent has a long-term illness, disability or health problem• ethnicity• sexual orient<strong>at</strong>ion• age (in years)• highest qualific<strong>at</strong>ion level achieved• language spoken <strong>at</strong> home.<strong>Employment</strong> characteristics:• job st<strong>at</strong>us - permanent or temporary• trade union/staff associ<strong>at</strong>ion member• type <strong>of</strong> organis<strong>at</strong>ion work for (public, priv<strong>at</strong>e or voluntary/charitableorganis<strong>at</strong>ion)• hours worked – full-time or part-time (less than 30 hours)• occup<strong>at</strong>ion• sector• earnings per year (under £10,000; £10,000 to £19,999; £20,000 to£29,999; £30,000 to £39,999; £40,000 to £49,999; £50,000 or more).An additional independent variable was also included in this model which waswhether or not a respondent had experienced a problem <strong>at</strong> work in the pastfive years.Logistic regression was used to isol<strong>at</strong>e which <strong>of</strong> these factors were significant,ie whether they were likely to affect whether someone was ‘aware’ or ‘notaware’. In total, six variables had co-efficients which were significant. Thefactors below increased the odds <strong>of</strong> a respondent being aware <strong>of</strong> theiremployment rights.• having a dependent child (compared to not having one)22
• being a trade union/staff associ<strong>at</strong>ion member (compared to not being one)• earning between £10,000 and £39,999 per year (compared to earning under£10,000 per year) 12• being more ‘highly’ qualified (specifically, being in the ‘highest qualific<strong>at</strong>ionobtained’ c<strong>at</strong>egories ‘NVQ level 2 or equivalent’, ‘NVQ level 4 or equivalent’and ‘NVQ level 5 or equivalent’ compared to having no qualific<strong>at</strong>ions) 13 .The factors below decreased the chances th<strong>at</strong> a respondent would be aware<strong>of</strong> their employment rights.• having experienced a problem (compared to not having experienced aproblem)• having a job th<strong>at</strong> is temporary in some way (compared to having apermanent job).It may be th<strong>at</strong> being a trade union/staff associ<strong>at</strong>ion member is likely to makean employee more aware <strong>of</strong> their employment rights as they have access toinform<strong>at</strong>ion and advice from their union on rights <strong>at</strong> work. Having ‘higher’qualific<strong>at</strong>ions may be associ<strong>at</strong>ed with a respondent being more likely toassess themselves as being aware <strong>of</strong> their employment rights. In contrast,being in a temporary job may lead to an employee feeling less secure andknowledgeable about how employment rights apply to them; thus, resultingin their assessing themselves as not being very aware <strong>of</strong> their employmentrights.Other results are harder to explain. It is not clear why having a dependentchild could make someone more generally aware <strong>of</strong> their rights, when havinga dependent child did not make respondents more likely to be aware <strong>of</strong> rightsin the area <strong>of</strong> children and dependants (see Section 2.4 below). It is also notclear why having experienced a problem decreases the odds <strong>of</strong> a respondentbeing aware <strong>of</strong> their employment rights, particularly as it could behypothesised th<strong>at</strong> if someone had experienced a problem <strong>at</strong> work then this islikely to make them more aware <strong>of</strong> their employment rights as a result.However, the measure <strong>of</strong> awareness used for this regression is a self-assessedone, therefore, if a problem has been experienced this may have highlighted toa respondent the limit<strong>at</strong>ions <strong>of</strong> their knowledge about employment rights.12 The co-efficients <strong>of</strong> the other earnings c<strong>at</strong>egories were not significant.13 The co-efficients <strong>of</strong> the other ‘highest qualific<strong>at</strong>ion obtained’ c<strong>at</strong>egories were notsignificant.23
2.2 Whether respondents know as much as they need to abouttheir rights <strong>at</strong> workRespondents were asked:‘And would you say you know as much as you need to know about yourrights <strong>at</strong> work, or could you do with knowing more about your rights <strong>at</strong>work?’Figure 2.2 shows the results <strong>of</strong> this question. Figure 2.2 shows th<strong>at</strong> 44 percent <strong>of</strong> all respondents felt th<strong>at</strong> they knew as much as they needed to know,while 55 per cent felt th<strong>at</strong> they could do with knowing more. Part-timeworkers were more likely than full-time workers to feel th<strong>at</strong> they knew asmuch as they needed to know. Public-sector workers were more likely thanpriv<strong>at</strong>e-sector workers to feel they knew as much as they needed to know.2.3 Whether respondents would know where to findinform<strong>at</strong>ion about rights <strong>at</strong> workRespondents were asked:‘Would you know where to find out inform<strong>at</strong>ion about your rights <strong>at</strong> work ifyou needed to?’Table 2.2 shows th<strong>at</strong> three-quarters <strong>of</strong> all respondents (76 per cent) wouldknow where to find out inform<strong>at</strong>ion about their rights <strong>at</strong> work if they neededto. Public-sector workers were more likely than priv<strong>at</strong>e-sector workers to saythey would know where to find out inform<strong>at</strong>ion about their rights <strong>at</strong> work ifthey needed to; those with an HR (Human Resources) department were morelikely than those without an HR Department to say this, as were those withmanagerial/supervisory duties compared to those without such duties.Interestingly, those who had experienced a problem in the past to do withtheir rights <strong>at</strong> work were less likely than those who had not experienced aproblem to say they would know where to find inform<strong>at</strong>ion they needed abouttheir rights <strong>at</strong> work. This may be because experiencing a problem makes aperson more likely to realise the limits <strong>of</strong> their knowledge <strong>of</strong> where to go t<strong>of</strong>ind out inform<strong>at</strong>ion about their rights <strong>at</strong> work.24
Figure 2.2: Whether respondents know as much as they need to knowabout their rights <strong>at</strong> work, or could do with knowing moreAll respondents (1,038)Age16-24 (114)25-34 (215)35-44 (289)45-54 (249)55-64 (170)GenderMale (472)Female (566)IncomeUnder £15,000 (412)£15,000 to £24,999 (260)£25,000 to £39,999 (174)£40,000 + (79)Hours workedFull-time (781)Part-time (250)Type <strong>of</strong> organis<strong>at</strong>ionPublic sector (336)Priv<strong>at</strong>e sector (662)Whether has HR/personnel deptYes (735)No (259)Whether experienced problemsYes (416)No (622)Managerial/supervisory dutiesYes (387)No (651)Number <strong>of</strong> employees in workplace1 to 9 (159)10 to 24 (168)24 to 99 (250)100 to 499 (228)500+ (208)4439434349464643414446554446534049363253484251413543545560565650535456595553455652465950646746525748596456460 10 20 30 40 50 60 70 80 90 100per centKnow as much as need to know Could do with knowing moreSource: IES/BMRB, 200525
Table 2.2: Whether respondents would know where to find outinform<strong>at</strong>ion about their rights <strong>at</strong> work if they needed toYes NoUnweighted% % baseAll respondents 76 23 1,038Age 16-24 64 35 11425-34 79 20 21535-44 75 24 28945-54 82 17 24955-64 73 25 170Gender Male 75 24 472Female 76 23 566Earnings Under £15,000 68 31 412£15,000 to £24,999 78 22 260£25,000 to £39,999 85 14 174£40,000 + 85 13 79Hours worked Full-time 76 22 781Part-time 75 24 250Type <strong>of</strong> organis<strong>at</strong>ion Public sector 87 13 336Priv<strong>at</strong>e sector 70 29 662Whether has HR/personnel dept Yes 83 16 735No 60 38 259Whether experienced problems Yes 71 28 416No 79 20 622Managerial/supervisory duties Yes 84 15 387No 71 28 651Number <strong>of</strong> employees in workplace 1 to 9 69 30 15910 to 24 70 30 16824 to 99 71 28 250100 to 499 81 18 228500+ 85 13 208How well informed about rights <strong>at</strong> work Very well informed 94 5 151Well informed 83 16 525Not very well informed 59 39 292Not well informed <strong>at</strong> all 49 49 67Note: ‘Don’t know’ responses not included as only one per cent <strong>of</strong> total (ten weighted cases).Source: IES/BMRB, 200526
2.4 Awareness <strong>of</strong> employers’ legal oblig<strong>at</strong>ionsWhether respondents have an awareness <strong>of</strong> their rights is extremelyimportant, as it is only by being aware <strong>of</strong> specific rights th<strong>at</strong> individuals canfind out more about the detail <strong>of</strong> these rights and ensure th<strong>at</strong> their employersare meeting their legal oblig<strong>at</strong>ions.Respondents were given a set <strong>of</strong> 25 cards listing possible legal oblig<strong>at</strong>ionsth<strong>at</strong> employers might have, with some being actual legal oblig<strong>at</strong>ions, whileothers were provisions th<strong>at</strong> were not covered by law. This str<strong>at</strong>egy waschosen to check whether respondents could accur<strong>at</strong>ely say th<strong>at</strong> someprovisions were not covered by law, and to try and discourage guessing. Theywere given the following instructions:‘All employers in the UK have to abide by employment laws th<strong>at</strong> aredesigned to protect people’s rights <strong>at</strong> work. This means th<strong>at</strong> employershave legal oblig<strong>at</strong>ions to the people who work for them, in terms <strong>of</strong> theway people are tre<strong>at</strong>ed and the benefits they receive. These cards describethe sorts <strong>of</strong> things I’m talking about. I would like you to place the cards onthis board to show which <strong>of</strong> them you think employers have to doaccording to the law and which you think employers can choose whether ornot to do’.The results <strong>of</strong> this exercise are shown in Figure 2.3, which shows th<strong>at</strong> levels<strong>of</strong> awareness were much higher for some rights than others. <strong>Rights</strong> to dowith ensuring employees are not discrimin<strong>at</strong>ed against on the basis <strong>of</strong> variouspersonal characteristics had higher levels <strong>of</strong> awareness than did some <strong>of</strong>those rights to do with having children and dependants. Some provisions th<strong>at</strong>are legal oblig<strong>at</strong>ions <strong>of</strong> employers only had low levels <strong>of</strong> awareness, forexample, only 27 per cent <strong>of</strong> respondents were aware th<strong>at</strong> parental leave wasa right.In addition, some provisions th<strong>at</strong> are not legal oblig<strong>at</strong>ions <strong>of</strong> employers werethought by some respondents to be actual rights. Over three-quarters (78per cent) <strong>of</strong> respondents were incorrect in thinking th<strong>at</strong> employers mustensure th<strong>at</strong> employees are not discrimin<strong>at</strong>ed against because <strong>of</strong> age (whichdoes not come into force until 1 October 2006), while over half <strong>of</strong>respondents (54 per cent) were incorrect in thinking th<strong>at</strong> employers mustensure th<strong>at</strong> employees are not discrimin<strong>at</strong>ed against because <strong>of</strong> appearance,44 per cent were incorrect in thinking th<strong>at</strong> unpaid p<strong>at</strong>ernity leave was a right,and 30 per cent were incorrect in thinking th<strong>at</strong> employers had to seriouslyconsider a request for flexible working to look after elderly parents. Only 11per cent incorrectly thought th<strong>at</strong> carrying over unused holiday to the nextyear was a right, and only eight per cent incorrectly thought th<strong>at</strong> having anunlimited amount <strong>of</strong> unpaid holiday each year was a right.27
Figure 2.3: Awareness <strong>of</strong> employers’ legal oblig<strong>at</strong>ions: proportion <strong>of</strong>respondents who think employers have to do thisaccording to lawDiscrimin<strong>at</strong>ion because <strong>of</strong> racePay minimum hourly wageDiscrimin<strong>at</strong>ion because <strong>of</strong> disabilityDiscrimin<strong>at</strong>ion because <strong>of</strong> genderNot dismiss employees without fair reasonOrdinary m<strong>at</strong>ernity leaveDiscrimin<strong>at</strong>ion because <strong>of</strong> sexual orient<strong>at</strong>ionDiscrimin<strong>at</strong>ion because <strong>of</strong> religionRest breaks after working a certain number <strong>of</strong> hoursProvide written st<strong>at</strong>ement <strong>of</strong> terms and conditionsMinimum number <strong>of</strong> weeks paid holiday each yearHave a set disciplinary procedureDiscrimin<strong>at</strong>ion because <strong>of</strong> ageHave a set grievance procedureLimit on working hoursPaid p<strong>at</strong>ernity leaveDiscrimin<strong>at</strong>ion because <strong>of</strong> appearanceSeriously consider a request for flexible working (for children)Additional m<strong>at</strong>ernity leaveUnpaid p<strong>at</strong>ernity leaveTime <strong>of</strong>f in emergencySeriously consider a request for flexible working (for elderly rel<strong>at</strong>ives)Parental leaveCarry over unused holiday to the next yearUnlimited amount <strong>of</strong> unpaid holiday each year0% 10% 20% 30% 40% 50% 60% 70% 80% 90% 100%Employer oblig<strong>at</strong>ionNot an employer oblig<strong>at</strong>ionNote: All respondents 1,038. Darker shade in chart indic<strong>at</strong>es incorrect answer.Source: IES/BMRB, 2005Awareness <strong>of</strong> each <strong>of</strong> the actual legal oblig<strong>at</strong>ions <strong>of</strong> employers is examined inmore detail in the sections below. 1414 Discrimin<strong>at</strong>ion on the grounds <strong>of</strong> age is also examined, as this will become a righton 1 October 2006.28
2.4.1 Discrimin<strong>at</strong>ionThe Sex Discrimin<strong>at</strong>ion Act <strong>of</strong> 1975 outlawed discrimin<strong>at</strong>ion on the grounds <strong>of</strong>gender, the Race Rel<strong>at</strong>ions Act 1976 outlawed discrimin<strong>at</strong>ion on the grounds<strong>of</strong> race, and the DDA <strong>of</strong> 1995 outlawed discrimin<strong>at</strong>ion on the grounds <strong>of</strong>disability. New regul<strong>at</strong>ions introduced in 2003 provide protection againstdiscrimin<strong>at</strong>ion on the basis <strong>of</strong> sexual orient<strong>at</strong>ion, religion and belief. Whenthese new regul<strong>at</strong>ions were introduced, they received publicity in the n<strong>at</strong>ionaland regional press, were advertised online, and had limited public rel<strong>at</strong>ionsexercises focused on them. A further set <strong>of</strong> regul<strong>at</strong>ory changes will beintroduced in 2006 to provide similar protection against age-rel<strong>at</strong>eddiscrimin<strong>at</strong>ion. The results in this area are discussed below.• 94 per cent <strong>of</strong> respondents were aware th<strong>at</strong> employers have a legaloblig<strong>at</strong>ion to ensure th<strong>at</strong> employees are not tre<strong>at</strong>ed unfairly because <strong>of</strong> theirrace. The high awareness <strong>of</strong> this right no doubt reflects its having been aright for 30 years, as well as ongoing publicity by bodies such as theCommission for Racial Equality. While there was some vari<strong>at</strong>ion betweenWhite respondents and respondents from other ethnic groups in theirawareness <strong>of</strong> this right, it was not st<strong>at</strong>istically significant.• 92 per cent <strong>of</strong> respondents were aware th<strong>at</strong> employers have a legaloblig<strong>at</strong>ion to ensure th<strong>at</strong> employees are not tre<strong>at</strong>ed unfairly because <strong>of</strong> theirdisability. This high awareness may reflect publicity surrounding theintroduction <strong>of</strong> the right and ongoing campaigns by the DRC and disabledcharities. Those with a long-term health problem or disability were lesslikely than those who did not have a long-term health problem or disabilityto be aware <strong>of</strong> this right: 86 per cent <strong>of</strong> those with a healthproblem/disability were aware <strong>of</strong> this right, compared to 92 per cent <strong>of</strong>those who did not have a health problem/disability.• 91 per cent <strong>of</strong> respondents were aware th<strong>at</strong> employers have a legaloblig<strong>at</strong>ion to ensure th<strong>at</strong> employees are not tre<strong>at</strong>ed unfairly because <strong>of</strong> theirgender. As with racial discrimin<strong>at</strong>ion, this high awareness may well be aproduct <strong>of</strong> the longevity <strong>of</strong> this right, as well as continuing publicity bybodies such as the Equal Opportunities Commission. While there was somevari<strong>at</strong>ion between men and women in their awareness <strong>of</strong> this right, it wasnot st<strong>at</strong>istically significant.There was slightly lower awareness <strong>of</strong> the more recently introduced rights notto be discrimin<strong>at</strong>ed against on the grounds <strong>of</strong> sexual orient<strong>at</strong>ion and religion.Nevertheless, in both cases, awareness was still high.• 87 per cent <strong>of</strong> respondents were aware th<strong>at</strong> employers have a legaloblig<strong>at</strong>ion to ensure th<strong>at</strong> employees are not tre<strong>at</strong>ed unfairly because <strong>of</strong> theirsexual orient<strong>at</strong>ion. The still-high awareness may reflect the publicity aroundthe time th<strong>at</strong> this right was introduced. While there was some vari<strong>at</strong>ion29
etween heterosexual and non-heterosexual respondents in their awareness<strong>of</strong> this right, it was not st<strong>at</strong>istically significant. 15• 87 per cent <strong>of</strong> respondents were aware th<strong>at</strong> employers have a legaloblig<strong>at</strong>ion to ensure th<strong>at</strong> employees are not tre<strong>at</strong>ed unfairly because <strong>of</strong> theirreligion. As with sexual orient<strong>at</strong>ion, the high awareness <strong>of</strong> this right couldreflect the publicity this rel<strong>at</strong>ively new right received when it wasintroduced. Respondents may also be confl<strong>at</strong>ing religious discrimin<strong>at</strong>ion withrace discrimin<strong>at</strong>ion. While there was some vari<strong>at</strong>ion between Christians andrespondents with other religions in their awareness <strong>of</strong> this right, it was notst<strong>at</strong>istically significant.There was also high awareness <strong>of</strong> age discrimin<strong>at</strong>ion, although the legalrights in this area do not come into force until October 2006.• 78 per cent <strong>of</strong> respondents incorrectly thought th<strong>at</strong> employers already havea legal oblig<strong>at</strong>ion to ensure th<strong>at</strong> employees are not tre<strong>at</strong>ed unfairly because<strong>of</strong> their age. This may be because <strong>of</strong> discussion <strong>of</strong> this right in the media inadvance <strong>of</strong> it being introduced, or respondents assuming it had beenintroduced alongside other recent rights not to be discrimin<strong>at</strong>ed against. Theolder respondents were, the less likely they were to think this was a right.Eighty-five per cent <strong>of</strong> those aged 16 to 24 thought it was a right, comparedto 82 per cent <strong>of</strong> those aged 25 to 34, 79 per cent <strong>of</strong> those aged 35 to 44,71 per cent <strong>of</strong> those aged 45 to 54, and 69 per cent <strong>of</strong> those aged 55 to 64.This is interesting, as older respondents may be the ones who will mostneed to be aware <strong>of</strong> the right once it has been introduced.2.4.2 <strong>Work</strong>ing timeThe WTR came into force in the UK on 1 October 1998 and marked theintroduction <strong>of</strong> law into wh<strong>at</strong> had previously been a largely unregul<strong>at</strong>ed areain the UK. The WTR introduced average weekly working hours limits, placedrestrictions on night working, provided for minimum in-work, daily andweekly rest breaks, and introduced a minimum entitlement to paid annualleave. Awareness <strong>of</strong> the rights to a minimum number <strong>of</strong> weeks’ paid holiday,in-work rest breaks, and a limit on working hours was examined by thestandard set <strong>of</strong> personal or employment characteristics (the standardbreaks 16 ), as well as by whether respondents were members <strong>of</strong> a tradeunion/staff associ<strong>at</strong>ion and whether they worked over 48 hours a week.Minimum number <strong>of</strong> weeks’ paid holiday: 81 per cent <strong>of</strong> respondentswere aware th<strong>at</strong> employers have a legal oblig<strong>at</strong>ion to let employees take a15 Only ten weighted cases (one per cent <strong>of</strong> respondents) in the sample were nonheterosexual.16 Standard breaks were: age, sex, earnings, hours worked (full-time or part-time),organis<strong>at</strong>ion type (public or priv<strong>at</strong>e sector), whether the respondents’ employerhad a Personnel/HR department (referred to as HR department in the rest <strong>of</strong> thisreport), whether the respondent had experienced a problem to do with their rights<strong>at</strong> work in the past, whether the respondent had managerial or supervisory duties,and number <strong>of</strong> employees <strong>at</strong> the respondents’ workplace.30
minimum number <strong>of</strong> weeks paid holiday each year. The high awareness <strong>of</strong>this right may be because <strong>of</strong> its being universally relevant and <strong>of</strong> highinterest to respondents. While there was some vari<strong>at</strong>ion between groups intheir awareness <strong>of</strong> this right, it was not st<strong>at</strong>istically significant.Rest breaks: 85 per cent <strong>of</strong> respondents were aware th<strong>at</strong> employers have alegal oblig<strong>at</strong>ion to give employees a rest break after working a certainnumber <strong>of</strong> hours. The high awareness <strong>of</strong> this right may be because <strong>of</strong> itsuniversal relevance and daily relevance to respondents. While there wassome vari<strong>at</strong>ion between groups in their awareness <strong>of</strong> this right, it was notst<strong>at</strong>istically significant.Limit on working hours: 63 per cent <strong>of</strong> respondents were aware th<strong>at</strong>employers have a legal oblig<strong>at</strong>ion not to make employees work more than agiven number <strong>of</strong> hours each week. This lower level <strong>of</strong> awareness than otherrights in the area <strong>of</strong> working time may be because it is less relevant to someworkers than to others. Men were marginally more likely than women to beaware <strong>of</strong> this right, with 64 per cent <strong>of</strong> men aware, compared to 63 per cent<strong>of</strong> women. Whether respondents were aware <strong>of</strong> this right also varied byearnings, with those most likely to be aware earning over £40,000 per year(where 80 per cent were aware), compared to 64 per cent <strong>of</strong> those earning£25,000 to £39,999 per year, 62 per cent <strong>of</strong> those earning under £15,000per year, and 60 per cent <strong>of</strong> those earning £15,000 to £24,999.Full-time workers were more likely than part-time workers to be aware <strong>of</strong> thisright: 64 per cent <strong>of</strong> full-timers compared to 63 per cent <strong>of</strong> part-timers.Public-sector workers were also more likely to be aware than priv<strong>at</strong>e-sectorworkers: 69 per cent <strong>of</strong> public-sector workers compared to 62 per cent <strong>of</strong>those in the priv<strong>at</strong>e sector, although this may be because they were betterinformed <strong>of</strong> their rights r<strong>at</strong>her than necessarily because they were likely towork longer hours. Those with an HR department were also more likely thanthose without an HR department to be aware <strong>of</strong> this right: 66 per cent <strong>of</strong>those in an organis<strong>at</strong>ion with an HR department were aware, compared to 57per cent in an organis<strong>at</strong>ion without an HR department.Respondents with managerial/supervisory duties were more likely to beaware <strong>of</strong> this right than those who did not have such responsibilities; again,possibly as they have to supervise the working p<strong>at</strong>terns <strong>of</strong> their employees:69 per cent <strong>of</strong> respondents with managerial/supervisory responsibilities wereaware compared to 60 per cent without. Those who worked over 48 hours aweek were actually slightly less aware <strong>of</strong> this right than those who did not.Sixty-three per cent <strong>of</strong> those working more than 48 hours a week were awareth<strong>at</strong> employers had a legal oblig<strong>at</strong>ion not to make employees work more thana given number <strong>of</strong> hours, compared to 64 per cent working 48 hours perweek or less.2.4.3 Pay, contracts, disciplinary and grievance proceduresA st<strong>at</strong>utory NMW was introduced in April 1999. The original legisl<strong>at</strong>ion setminimum r<strong>at</strong>es for workers aged 22 and over and those aged 18 to 21. Itincluded some exemptions in cases <strong>of</strong> younger workers on apprenticeshipprogrammes. The two r<strong>at</strong>es have been increased each year since the31
introduction <strong>of</strong> the NMW. There has been publicity for each increase <strong>of</strong> theNMW, including n<strong>at</strong>ional and consumer press advertising, limited publicrel<strong>at</strong>ions exercises, online advertising, and in the financial year April 2004 toMarch 2005, direct mailings to ethnic community leaders. In the financialyear April 2005 to March 2006, when this survey was conducted, publicityalso included public rel<strong>at</strong>ions exercises th<strong>at</strong> were especially targeted <strong>at</strong> thehairdressing sector, direct mailings to young hairdressers, as well as directmailings to ethnic community leaders.The <strong>Employment</strong> Act 2002 (Dispute Resolution) Regul<strong>at</strong>ions came into forceon 1 October 2004, introducing minimum st<strong>at</strong>utory procedures for dealingwith dismissal, disciplinary action and grievances in the workplace. Theseinclude the right to a written st<strong>at</strong>ement <strong>of</strong> employment particulars, such aspay and hours, and must include a note <strong>of</strong> the employer’s disciplinary andgrievance procedures. <strong>Employees</strong> have the right to receive this within twomonths <strong>of</strong> the starting d<strong>at</strong>e. Dispute Resolution Regul<strong>at</strong>ions were recentlypublicised (in the financial year April 2004 to March 2005) using publicrel<strong>at</strong>ions exercises. The current right not to be dismissed unfairly wasintroduced in the <strong>Employment</strong> <strong>Rights</strong> Act 1996, although its origins d<strong>at</strong>e backto the 1971 Industrial Rel<strong>at</strong>ions Act.Awareness <strong>of</strong> the right to a NMW, a written st<strong>at</strong>ement <strong>of</strong> terms andconditions, to have employers follow a set procedure when dealing with acomplaint or grievance, and not to be dismissed unfairly, were examined bythe standard set <strong>of</strong> personal or employment characteristics (the standardbreaks), as well as by whether respondents were members <strong>of</strong> a tradeunion/staff associ<strong>at</strong>ion. The results are discussed below.• 93 per cent <strong>of</strong> respondents were aware th<strong>at</strong> employers have a legaloblig<strong>at</strong>ion to pay employees a minimum hourly wage. The high awareness <strong>of</strong>this right no doubt reflects the publicity it has received. While there wassome vari<strong>at</strong>ion between groups in their awareness <strong>of</strong> this right, it was notst<strong>at</strong>istically significant.• 90 per cent <strong>of</strong> respondents were aware th<strong>at</strong> employers should not dismissan employee without having a fair reason for doing so. High awareness <strong>of</strong>this right may reflect its universal relevance and importance to employees.Women were more likely than men to be aware <strong>of</strong> this right (93 per cent <strong>of</strong>women compared to 88 per cent <strong>of</strong> men). Those with managerial/supervisory responsibilities were also more likely than those without suchresponsibilities to be aware <strong>of</strong> this right, possibly as their role as managers<strong>of</strong> staff requires them to be aware <strong>of</strong> this right (94 per cent <strong>of</strong> those withmanagerial/supervisory responsibilities were aware, compared to 88 percent <strong>of</strong> those without). Those who had experienced a problem in the past todo with their rights <strong>at</strong> work were more likely than those who had notexperienced a problem to be aware <strong>of</strong> this right, possibly having been madeaware <strong>of</strong> it through the problem they experienced (see Chapter 4): 91 percent <strong>of</strong> those who had experienced a problem were aware compared to 90per cent <strong>of</strong> those who had not.• 84 per cent <strong>of</strong> respondents were aware th<strong>at</strong> employers must provideemployees with a written st<strong>at</strong>ement <strong>of</strong> the terms and conditions <strong>of</strong> their job.32
This fairly high awareness may reflect the universally relevant n<strong>at</strong>ure <strong>of</strong> thisright. Women were more likely than men to be aware <strong>of</strong> this right (88 percent <strong>of</strong> women, compared to 81 per cent <strong>of</strong> men), as were trade union/staffassoci<strong>at</strong>ion members (88 per cent compared to 83 per cent <strong>of</strong> non-unionmembers), and those with an HR department (87 per cent compared to 78per cent <strong>of</strong> those without an HR department).• 81 per cent <strong>of</strong> respondents were aware th<strong>at</strong> employers must follow a setprocedure when dealing with a complaint against employees. Highawareness <strong>of</strong> this right, as well as <strong>of</strong> grievance procedures (discussedbelow), may reflect the recent publicity <strong>of</strong> dispute resolution regul<strong>at</strong>ions.However, those who had experienced a problem in the past to do with theirrights <strong>at</strong> work were less likely to be aware <strong>of</strong> this right than those who hadnot experienced a problem (78 per cent <strong>of</strong> those who had experienced aproblem were aware, compared to 83 per cent <strong>of</strong> those who had not).• 78 per cent <strong>of</strong> respondents were aware th<strong>at</strong> employers must follow a setprocedure when dealing with a grievance or other work-rel<strong>at</strong>ed problemwhich an employee has against an employer. The older a respondent, themore likely they were to be aware <strong>of</strong> this right, perhaps reflecting theirgre<strong>at</strong>er experience in the workplace (64 per cent <strong>of</strong> those aged 16 to 24, 74per cent <strong>of</strong> those aged 25 to 34, 81 per cent <strong>of</strong> those aged 35 to 44 and 87per cent <strong>of</strong> those aged 45 to 54 and 55 to 64). Whether respondents wereaware <strong>of</strong> this right also varied by earnings, with those most likely to beaware earning over £40,000 per year (where 90 per cent were aware),compared to 82 per cent <strong>of</strong> those earning £15,000 to £24,999 per year, 76per cent <strong>of</strong> those earning less than £15,000 per year, and 74 per cent <strong>of</strong>those earning £25,000 to £39,999 per year. Those with an HR departmentwere more likely than those without an HR department to be aware <strong>of</strong> thisright (81 per cent <strong>of</strong> those with an HR department compared to 78 per cent<strong>of</strong> those without). Again, trade union members were also more likely to beaware <strong>of</strong> this right than non-union members (83 per cent <strong>of</strong> union memberswere aware, compared to 77 per cent <strong>of</strong> non-union members).2.4.4 Children and dependantsThe right to m<strong>at</strong>ernity leave is long established, although there have beenrecent improvements to it. The <strong>Employment</strong> <strong>Rights</strong> Act 1996, as amended bythe <strong>Employment</strong> Act 2002, contains the framework for enhanced m<strong>at</strong>ernityleave. Since 2003, all pregnant employees have been entitled to <strong>at</strong> least 26weeks’ ordinary m<strong>at</strong>ernity leave. This applies regardless <strong>of</strong> length <strong>of</strong> service.<strong>Employees</strong> who have completed 26 weeks’ continuous employment by thebeginning <strong>of</strong> the 14th week before the expected week <strong>of</strong> childbirth areentitled to 26 weeks additional m<strong>at</strong>ernity leave. Additional m<strong>at</strong>ernity leavebegins <strong>at</strong> the end <strong>of</strong> ordinary m<strong>at</strong>ernity leave. The <strong>Employment</strong> Act 2002 setsout the basic rights to p<strong>at</strong>ernity leave. The right to p<strong>at</strong>ernity leave andSt<strong>at</strong>utory P<strong>at</strong>ernity Pay allows an eligible employee to take paid leave to carefor his baby or to support the mother following birth. Since 6 April 2003, hecan take either one week’s or two weeks’ consecutive p<strong>at</strong>ernity leave.The <strong>Employment</strong> Act 2002 also sets out the right <strong>of</strong> employees to requestflexible working. Since 6 April 2003, eligible employees have the right to33
apply to work flexibly and to have their applic<strong>at</strong>ion considered properly inaccordance with the set procedure, and refused only where there is a clearbusiness ground for doing so. Where an applic<strong>at</strong>ion is refused, employeeshave the right to have a written explan<strong>at</strong>ion giving the reasons why and toappeal against the employer’s decision to refuse an applic<strong>at</strong>ion. <strong>Employees</strong>are eligible if they have a child under six, or a disabled child under 18.The right to time <strong>of</strong>f for dependants is contained in section 57A <strong>of</strong> the<strong>Employment</strong> <strong>Rights</strong> Act 1996, as amended by the <strong>Employment</strong> Rel<strong>at</strong>ions Act1999. The section came into effect on 15 December 1999. The right to time<strong>of</strong>f is available to all those who have a contract <strong>of</strong> employment with anemployer (whether in writing or not), whether they work full time or parttime. The right does not include an entitlement to pay.The right to parental leave was first introduced on 15 December 1999 under theM<strong>at</strong>ernity and Parental Leave Regul<strong>at</strong>ions 1999. These Regul<strong>at</strong>ions were madeunder the <strong>Employment</strong> <strong>Rights</strong> Act 1996, as amended by the <strong>Employment</strong>Rel<strong>at</strong>ions Act 1999. Parents with one year’s service with their employer are ableto take up to 13 weeks’ unpaid leave to care for a child. Leave must be takenbefore the child’s fifth birthday. Parents <strong>of</strong> disabled children are able to take 18weeks’ parental leave up to their child’s 18th birthday.The new rights for working parents th<strong>at</strong> came into force in April 2003 werepublicised (in the Financial Year April 2003 to March 2004) through n<strong>at</strong>ionalpress advertising, ethnic radio advertising, and public rel<strong>at</strong>ions exercises.<strong>Rights</strong> in the area <strong>of</strong> children and dependants were examined by whetherrespondents had dependent children, had children under six, or wereplanning to have a child in the next year. Table 2.3 shows the results <strong>of</strong> thisanalysis.Table 2.3: Awareness <strong>of</strong> rights in the area <strong>of</strong> children and dependantsDependentchildrenChildrenaged 0-5Planning to have achild in next yearYes No Yes No Yes NoAll respondents % % % % % %Ordinary m<strong>at</strong>ernity leave 88 88 87 86 88 91 88Paid p<strong>at</strong>ernity leave 55 57 53 57 54 66 54Seriously consider a request forflexible working (for children)51 57 47 61 49 67 50Additional m<strong>at</strong>ernity leave 49 56 44 57 47 65 48Time <strong>of</strong>f for dependants 42 43 41 47 40 52 40Parental leave 27 36 21 39 24 34 26Unweighted base 1,038 426 612 188 850 68 948Source: IES/BMRB, 2005The results from Table 2.3 are discussed below:34
Ordinary m<strong>at</strong>ernity leave: 88 per cent <strong>of</strong> respondents were aware th<strong>at</strong>employers have a legal oblig<strong>at</strong>ion to let women take paid time <strong>of</strong>f when theyhave a baby. This highest level <strong>of</strong> awareness among the rights to do withchildren and dependants may reflect the long-standing n<strong>at</strong>ure <strong>of</strong> this right.While there was some vari<strong>at</strong>ion between groups in their awareness <strong>of</strong> thisright, it was not st<strong>at</strong>istically significant.The level <strong>of</strong> awareness <strong>of</strong> the next two rights was somewh<strong>at</strong> lower, thoughstill higher than for other rights in the area <strong>of</strong> children and dependants. Theirrel<strong>at</strong>ively high awareness compared to these other rights may be a reflection<strong>of</strong> the publicity when these rights came into force, as well as political deb<strong>at</strong>eabout the issues in 2005.Paid p<strong>at</strong>ernity leave: 55 per cent <strong>of</strong> respondents were aware th<strong>at</strong>employers have a legal oblig<strong>at</strong>ion to let men take paid time <strong>of</strong>f when theirpartner has a baby. While there was some vari<strong>at</strong>ion between groups in theirawareness <strong>of</strong> this right, it was not st<strong>at</strong>istically significant.Right to request flexible working: 51 per cent <strong>of</strong> respondents were awareth<strong>at</strong> employers have a legal oblig<strong>at</strong>ion to seriously consider a request forflexible working from parents <strong>of</strong> a young or disabled child. Respondents witha child under six were more likely to be aware <strong>of</strong> this right than those withoutchildren under six.Additional m<strong>at</strong>ernity leave: In contrast to ordinary m<strong>at</strong>ernity leave,awareness <strong>of</strong> additional m<strong>at</strong>ernity leave was much lower. Forty-nine per cent<strong>of</strong> respondents were aware th<strong>at</strong> employers have a legal oblig<strong>at</strong>ion to letwomen take additional unpaid time <strong>of</strong>f when they have a baby. Respondentswith a child under six were more likely to be aware <strong>of</strong> this right than thosewithout children in this age group.The two rights in the area <strong>of</strong> children and dependants with the lowest levels<strong>of</strong> awareness are those introduced in 1999, and which have not recently beenpublicised more recently.Time <strong>of</strong>f for dependants: 42 per cent <strong>of</strong> respondents were aware th<strong>at</strong>employers have a legal oblig<strong>at</strong>ion to let employees take time <strong>of</strong>f to look aftera dependant in an emergency. While there was some vari<strong>at</strong>ion betweengroups in their awareness <strong>of</strong> this right, it was not st<strong>at</strong>istically significant.Parental leave: 27 per cent <strong>of</strong> respondents were aware th<strong>at</strong> employers havea legal oblig<strong>at</strong>ion to let parents <strong>of</strong> young children have a set amount <strong>of</strong>unpaid time <strong>of</strong>f work to spend with them. Respondents with a child under sixwere more likely to be aware <strong>of</strong> this right than those without young children.2.5 Knowledge <strong>of</strong> the detail <strong>of</strong> the lawAfter respondents had completed the exercise where they placed cards on aboard according to whether they thought the cards showed legal oblig<strong>at</strong>ions<strong>of</strong> employers (actual employment rights) or not, they were then given thefollowing instruction:35
‘These are the cards with the things th<strong>at</strong> you thought employers have to doby law. I’d now like you to place these cards on this board to show howmuch you feel you know about the detail <strong>of</strong> the law regarding these issues.How much do you know about the detail <strong>of</strong> the law regarding this issue?’Table 2.4 details the results <strong>of</strong> this exercise, examining how muchrespondents said they knew about the detail <strong>of</strong> the law <strong>of</strong> rights th<strong>at</strong> theywere aware <strong>of</strong>. It examines only actual legal oblig<strong>at</strong>ions <strong>of</strong> employers. 17Table 2.4: How much respondents said they know about the detail <strong>of</strong>the law <strong>of</strong> the rights th<strong>at</strong> they were aware <strong>of</strong>Ensuring th<strong>at</strong>employees are nottre<strong>at</strong>ed unfairlybecause <strong>of</strong> their<strong>Work</strong>ing timePay, contracts,disciplinary andgrievanceproceduresChildren anddependantsKnow alot aboutthe detailKnow a fairamount aboutthe detailKnow alittle aboutthe detailKnow hardlyanything aboutthe detail% % % %UnweightedbaseGender 24 29 31 16 935Sexual orient<strong>at</strong>ion 24 25 31 20 899Race 27 27 29 17 966Religion 24 26 32 19 902Disability 25 25 34 16 946Age 21 23 36 19 793Minimum number <strong>of</strong> weeks’ paidholiday each yearRest breaks after working acertain number <strong>of</strong> hours25 31 30 14 83627 32 30 11 891Limit on working hours 24 31 32 13 654Pay minimum hourly wage 33 34 27 7 956Provide written st<strong>at</strong>ement <strong>of</strong>terms and conditions37 31 23 10 882Have a set disciplinary procedure 26 31 29 13 846Have a set grievance procedure 25 32 30 13 823Not dismiss employees withoutfair reasonSeriously consider a request forflexible working (for children)28 34 26 12 93113 20 35 31 539Parental leave 14 19 35 30 286Time <strong>of</strong>f for dependants 16 22 32 30 428Ordinary m<strong>at</strong>ernity leave 25 30 29 15 915Additional m<strong>at</strong>ernity leave 20 24 34 22 515Paid p<strong>at</strong>ernity leave 21 22 35 21 554Note: ‘Don’t know’ responses not included as numbers were too small.Source: IES/BMRB, 200517 Discrimin<strong>at</strong>ion on the grounds <strong>of</strong> age is also examined, as this will become a righton 1 October 2006.36
While respondents may be aware <strong>of</strong> the existence <strong>of</strong> a right, Table 2.4 showsth<strong>at</strong> how much they said they know about the detail <strong>of</strong> the right variesconsiderably.Highest perceived levels <strong>of</strong> detailed knowledge were in rel<strong>at</strong>ion to the right tohave a written st<strong>at</strong>ement <strong>of</strong> terms and conditions (37 per cent), the right tothe NMW (33 per cent), the right not to be dismissed unfairly (28 per cent),the right to an in-work rest break (27 per cent), and the right not to bediscrimin<strong>at</strong>ed against on the grounds <strong>of</strong> race (27 per cent). Other rights to dowith discrimin<strong>at</strong>ion, working time and pay/contracts/disciplinary andgrievance procedures also had around a quarter <strong>of</strong> respondents saying th<strong>at</strong>they knew a lot about the detail.The rights where the highest proportions <strong>of</strong> respondents said th<strong>at</strong> they knewhardly anything about the detail were in the area <strong>of</strong> children and dependants.Thirty-one per cent said th<strong>at</strong> they knew hardly anything about the detail <strong>of</strong>the right to request flexible working, while 30 per cent knew hardly anythingabout the detail <strong>of</strong> parental leave, 30 per cent knew hardly anything aboutthe detail <strong>of</strong> the right to take time <strong>of</strong>f for dependants in an emergency, 22per cent knew hardly anything about the detail <strong>of</strong> additional m<strong>at</strong>ernity leave,and 21 per cent knew hardly anything about the detail <strong>of</strong> paid p<strong>at</strong>ernityleave. The exception to this was ordinary m<strong>at</strong>ernity leave, where only 15 percent knew ‘hardly anything’ about the detail.Whether there were differences between different groups <strong>of</strong> respondents intheir knowledge <strong>of</strong> the detail <strong>of</strong> these rights is examined in the sectionsbelow.2.5.1 Discrimin<strong>at</strong>ionHow much respondents said they knew about the detail <strong>of</strong> the law on therights not to be discrimin<strong>at</strong>ed against on the basis <strong>of</strong> race, gender, disability,religion, sexual orient<strong>at</strong>ion and age, was examined by whether or not theyhad personal characteristics th<strong>at</strong> were relevant to th<strong>at</strong> right. For example,whether those with a health problem/disability differed from those without ahealth problem/disability in their knowledge <strong>of</strong> the detail <strong>of</strong> the law outlawingdisability discrimin<strong>at</strong>ion. However, although there were some vari<strong>at</strong>ionsbetween groups, none was st<strong>at</strong>istically significant.2.5.2 <strong>Work</strong>ing timeHow much respondents said they knew about the detail <strong>of</strong> the law around therights to a minimum number <strong>of</strong> weeks’ paid holiday, in-work rest breaks, anda limit on working hours, was examined by the standard set <strong>of</strong> personal oremployment characteristics (the standard breaks), as well as by whetherrespondents were members <strong>of</strong> a trade union/staff associ<strong>at</strong>ion and whetherthey worked over 48 hours a week. Again, while there were some vari<strong>at</strong>ionsbetween groups, none was st<strong>at</strong>istically significant.37
2.5.3 Pay, contracts, disciplinary and grievance proceduresHow much respondents said they knew about the detail <strong>of</strong> the law around therights to a NMW, a written st<strong>at</strong>ement <strong>of</strong> terms and conditions, to haveemployers follow a set procedure when dealing with a complaint or grievance,and not to be dismissed unfairly, was examined by the standard set <strong>of</strong>personal or employment characteristics as well as by whether respondentswere members <strong>of</strong> a trade union/staff associ<strong>at</strong>ion.How much respondents who were aware <strong>of</strong> the right to a NMW said th<strong>at</strong> theyknew about the detail <strong>of</strong> th<strong>at</strong> right, varied according to the size <strong>of</strong> theiremployer. Those working for employers with 25 to 99 employees were leastlikely to say th<strong>at</strong> they knew a lot or a fair amount about the detail <strong>of</strong> the rightto a NMW (58 per cent knew a lot/a fair amount), compared to 63 per cent <strong>of</strong>those <strong>at</strong> employers with 500 or more employees, 68 per cent <strong>of</strong> those <strong>at</strong>employers with 100 to 499 employees, 72 per cent <strong>of</strong> those <strong>at</strong> employerswith one to nine employees, and 74 per cent <strong>of</strong> those <strong>at</strong> employers with tento 24 employees.The extent to which respondents who were aware <strong>of</strong> the right to a writtenst<strong>at</strong>ement <strong>of</strong> terms and conditions and who said they knew about the detail<strong>of</strong> th<strong>at</strong> right varied by whether they had managerial/supervisoryresponsibilities. Those who had such responsibilities were more likely thanthose who did not to know a lot/a fair amount about the detail <strong>of</strong> a right: 72per cent compared to 63 per cent.How much respondents who were aware <strong>of</strong> the right to a set procedure todeal with a complaint against an employee and who said they knew about thedetail <strong>of</strong> th<strong>at</strong> right, also varied by whether they had managerial/supervisoryresponsibilities. Those with such duties were, again, more likely to knowabout the detail, with 63 per cent knowing a lot/a fair amount, compared to53 per cent <strong>of</strong> those without such responsibilities. Those who hadexperienced a problem in the past to do with their rights <strong>at</strong> work were alsomore likely to know about the detail <strong>of</strong> this right: 60 per cent knowing a lot/afair amount, compared to 55 per cent <strong>of</strong> those who had not had a problem(whether they had experienced a problem in this area is examined in Chapter4).While there were some vari<strong>at</strong>ions between groups in how much respondentssaid they knew about the detail <strong>of</strong> the right to a set procedure to deal with agrievance against an employee, none was st<strong>at</strong>istically significant.How much respondents who were aware <strong>of</strong> the right not to be unfairlydismissed said they knew about the detail <strong>of</strong> th<strong>at</strong> right, again varied bywhether they had managerial/supervisory responsibilities. Sixty-four per cent<strong>of</strong> those with such responsibilities knew a lot/a fair amount, compared to 60per cent <strong>of</strong> those without such responsibilities.2.5.4 Children and dependantsHow much respondents said they knew about the detail <strong>of</strong> the law around thearea <strong>of</strong> children and dependants was examined by whether respondents had38
dependent children, had children under six, or were planning to have a childin the next year. The results are shown below.• Right to request flexible working: How much respondents, who wereaware <strong>of</strong> the right to request flexible working and who said they knew aboutthe detail <strong>of</strong> th<strong>at</strong> right, knew about the detail <strong>of</strong> the law varied by whetherthey had a dependent child and whether they had a child under six. Thosewith a dependent child were understandably more likely to know a lot/a fairamount about the detail <strong>of</strong> this right: 40 per cent, compared to 27 per cent<strong>of</strong> those without dependent children. Those with a child under six wereparticularly likely to know a lot/a fair amount about the detail <strong>of</strong> this right:45 per cent, compared to 30 per cent <strong>of</strong> those without a child under six.• Parental leave: How much respondents, who were aware <strong>of</strong> the right toparental leave and who said they knew about the detail <strong>of</strong> th<strong>at</strong> right, knewabout the detail <strong>of</strong> the law also varied by whether they had a dependentchild and whether they had a child under six. Again, those with a child undersix were more likely to know a lot/a fair amount about the detail <strong>of</strong> thisright: 51 per cent, compared to 26 per cent <strong>of</strong> those without a child in thisage group. Those with a dependent child were also more likely to know alot/a fair amount about this right: 41 per cent, compared to 23 per cent <strong>of</strong>those without dependent children.• Time <strong>of</strong>f for dependants: While there were some vari<strong>at</strong>ions betweengroups in how much respondents said they knew about the detail <strong>of</strong> theright to time <strong>of</strong>f for dependants in an emergency, none was st<strong>at</strong>isticallysignificant.• Ordinary m<strong>at</strong>ernity leave: How much respondents who were aware <strong>of</strong> theright to ordinary m<strong>at</strong>ernity leave and who said they knew about the detail <strong>of</strong>th<strong>at</strong> right knew about the detail <strong>of</strong> the law varied by whether they had adependent child. Those with a dependent child were more likely to know alot/a fair amount about the detail <strong>of</strong> this right: 64 per cent, compared to 50per cent <strong>of</strong> those without dependent children.• Additional m<strong>at</strong>ernity leave: How much respondents who were aware <strong>of</strong>the right to additional m<strong>at</strong>ernity leave and who said they knew about thedetail <strong>of</strong> th<strong>at</strong> right knew about the detail <strong>of</strong> the law again varied by whetherthey had a dependent child. Those with a dependent child were more likelyto know a lot/a fair amount about the detail <strong>of</strong> this right: 55 per cent,compared to 33 per cent <strong>of</strong> those without dependent children.• Paid p<strong>at</strong>ernity leave: How much respondents who were aware <strong>of</strong> the rightto paid p<strong>at</strong>ernity leave and who said they knew about the detail <strong>of</strong> th<strong>at</strong> rightknew about the detail <strong>of</strong> the law varied by whether they had a dependentchild and whether they had a child under six. Those with a dependent childwere more likely to know a lot/a fair amount about the detail <strong>of</strong> this right(47 per cent compared to 41 per cent <strong>of</strong> those without dependent children),as were those with a child under six (57 per cent), compared to 40 per cent<strong>of</strong> those without a child under six.39
2.6 Awareness deficitsRespondents were asked, for each <strong>of</strong> the actual employer oblig<strong>at</strong>ions, howimportant they felt it was for them personally to know about the lawregarding employer responsibilities in th<strong>at</strong> area:‘This next set <strong>of</strong> cards shows things th<strong>at</strong> employers actually have to doaccording to current employment law in the UK. Some <strong>of</strong> these you mayfeel you need to know about – either because <strong>of</strong> your personalcircumstances or your responsibilities <strong>at</strong> work – others you may feel youdon’t need to know about. I’d like you to sort the cards onto this board toshow how important you think it is for you personally to know about thelaw regarding employers’ responsibilities in these areas.’This exercise, together with the exercise on awareness (see Section 2.4) wasused to calcul<strong>at</strong>e an ‘awareness deficit’ for each right: the proportion <strong>of</strong> allrespondents who were unaware th<strong>at</strong> a right was an actual legal oblig<strong>at</strong>ion,but felt th<strong>at</strong> it was very important for them to know about it. Figure 2.4shows the results <strong>of</strong> this analysis.Figure 2.4: Awareness deficitsTime <strong>of</strong>f in an emergencyParental leaveSeriously consider a request for flexible working (for children)Additional m<strong>at</strong>ernity leaveLimit on working hoursPaid p<strong>at</strong>ernity leaveMinimum number <strong>of</strong> weeks paid holiday each yearHave a set disciplinary procedureHave a set grievance procedureProvide written st<strong>at</strong>ement <strong>of</strong> terms and conditionsRest breaks after working a certain number <strong>of</strong> hoursNot dismiss employees without fair reasonOrdinary m<strong>at</strong>ernity leaveDiscrimin<strong>at</strong>ion because <strong>of</strong> religionDiscrimin<strong>at</strong>ion because <strong>of</strong> disabilityPay minimum hourly wageDiscrimin<strong>at</strong>ion because <strong>of</strong> sexual orient<strong>at</strong>ionDiscrimin<strong>at</strong>ion because <strong>of</strong> genderDiscrimin<strong>at</strong>ion because <strong>of</strong> raceNote: Unweighted base. All respondents 1,038.Source: IES/BMRB, 20050 5 10 15 20 25 30per cent40
It is important to note th<strong>at</strong> rights will only have a high awareness deficit ifthere was a low level <strong>of</strong> awareness among respondents <strong>of</strong> the right (seeSection 2.4). Issues th<strong>at</strong> had a high awareness (such as those to do withdiscrimin<strong>at</strong>ion and the NMW), therefore, have a small awareness deficit.It is interesting, however, th<strong>at</strong> for issues where there was a low level <strong>of</strong>awareness, particularly those around children and dependants, a sizeableproportion <strong>of</strong> respondents who were unaware <strong>of</strong> the particular right thoughtth<strong>at</strong> it was very important for them to know about it. These rights, therefore,had some <strong>of</strong> the highest awareness deficits: 28 per cent for time <strong>of</strong>f fordependants in an emergency, 18 per cent for parental leave, 16 per cent forthe right to request flexible working, 15 per cent for additional m<strong>at</strong>ernityleave and 11 per cent for paid p<strong>at</strong>ernity leave. The exception was ordinarym<strong>at</strong>ernity leave, which had high awareness among respondents and so thedeficit was only five per cent.Differences in the awareness deficits for these rights were examined to see ifit was only those who had family responsibilities (respondents who either haddependent children or were planning a child) who showed high awarenessdeficits. In fact, there were no significant vari<strong>at</strong>ions between those withfamily responsibilities and those without in the awareness deficits aroundtime <strong>of</strong>f for dependants, the right to request flexible working, ordinarym<strong>at</strong>ernity leave or additional m<strong>at</strong>ernity leave.There were significant vari<strong>at</strong>ions between those who had familyresponsibilities, and those who did not in the awareness deficit aroundparental leave, where 24 per cent <strong>of</strong> those with family responsibilities showedan awareness deficit, compared to 13 per cent who did not have suchresponsibilities. There was also significant vari<strong>at</strong>ion in the right to paidp<strong>at</strong>ernity leave, where 14 per cent <strong>of</strong> those with family responsibilities citedan awareness deficit, compared to eight per cent who did not have suchresponsibilities. However, these figures also demonstr<strong>at</strong>e th<strong>at</strong> it is not onlythose with family responsibilities who see their low awareness <strong>of</strong> parentalrights as a problem for themselves.Other rights th<strong>at</strong> also had rel<strong>at</strong>ively high awareness deficits were the rightsto: a limit on working hours (13 per cent), paid holidays (ten per cent),having a set disciplinary procedure (ten per cent), having a set grievanceprocedure (ten per cent), and the right to have a written contract (nine percent). These rights may have high awareness deficits, as they have low levels<strong>of</strong> awareness, but are universally relevant rights, which may mean th<strong>at</strong>respondents think th<strong>at</strong> it is very important for them to know about them.2.7 Awareness scoreAn awareness score was developed by giving respondents points in thefollowing cases:• two points if they said th<strong>at</strong> they were very well informed about their rights<strong>at</strong> work, and one point if they said they were well informed, when askedhow well informed they felt about their rights <strong>at</strong> work41
• one point if they said th<strong>at</strong> they knew as much as they needed to know abouttheir rights <strong>at</strong> work• one point if they said th<strong>at</strong> they knew where to find out inform<strong>at</strong>ion abouttheir rights <strong>at</strong> work if they needed to• one point for each time they said th<strong>at</strong> an actual employment right (19 in all)was an actual legal oblig<strong>at</strong>ion <strong>of</strong> employers• one point for each time they said th<strong>at</strong> a provision th<strong>at</strong> was not an actualemployment right (six in all) was something th<strong>at</strong> employers could choose todo.Table 2.5 shows the mean awareness score by key groups, as well as thosescoring 15 or less, and those scoring 24 or more, out <strong>of</strong> a possible 29 points.The cut-<strong>of</strong>f point <strong>of</strong> a score <strong>of</strong> 15 points was chosen as this accounts for,approxim<strong>at</strong>ely, the lowest scoring ten per cent <strong>of</strong> respondents. Those scoring24 or more were also isol<strong>at</strong>ed as, likewise, they accounted for,approxim<strong>at</strong>ely, the top scoring ten per cent <strong>of</strong> respondents.Table 2.5: Awareness scoreAwarenessscoreThose scoring15 or lessThosescoring 24or moreUnweightedbaseMean % %All respondents 19.7 10 11 1,038Age 16-21 17.8 21 6 6022-34 19.9 8 9 26935-44 20.1 10 14 28945-54 20.0 8 11 24955-64 19.4 14 11 170Gender Male 19.5 11 10 472Female 19.9 8 11 566Earnings Under £5,000 19.4 11 5 89£5,000 to £9,999 18.8 13 7 129£10,000 to £14,999 19.4 10 7 194£15,000 to £19,999 20.3 7 15 158£20,000 to £39,999 20.3 5 12 276£40,000 + 20.2 5 13 79Hours worked Full-time 19.8 9 11 781Part-time 19.8 10 10 250Type <strong>of</strong> organis<strong>at</strong>ion Public sector 20.3 8 13 336Priv<strong>at</strong>e sector 19.4 11 9 662Whether hasYes 20.2 8 13 735HR/personnel deptNo 19.1 12 7 25942
Table 2.5: continuedWhether experiencedproblemsManagerial/supervisorydutiesNumber <strong>of</strong> employees inworkplaceWhether member <strong>of</strong>TU/staff assoc.How much known aboutrights <strong>at</strong> workHow well informed aboutrights <strong>at</strong> workWhether signed opt-outagreementWhether work over 48 hrsper weekAwarenessscoreThose scoring15 or lessThosescoring 24 ormoreUnweightedbaseMean % %Yes 19.4 10 7 416No 20.0 10 13 622Yes 20.4 6 15 387No 19.3 12 8 6511 to 9 20.0 7 10 15910 to 24 19.1 14 8 16825 to 99 19.3 13 8 250100 to 499 20.1 4 11 228500+ 20.3 8 18 208Yes 20.2 7 11 329No 19.5 11 10 701As much as need to know 21.1 4 18 464Could know more 18.6 15 5 563Well informed 20.8 4 15 680Not well informed 17.7 20 2 353Yes 19.6 15 13 135No 19.8 9 10 866Yes 19.8 9 13 172No 19.7 10 10 826Note: A higher score shows a higher level <strong>of</strong> awareness.Source: IES/BMRB, 2005Table 2.5 shows th<strong>at</strong> all respondents had a mean score <strong>of</strong> 19.7, with ten percent <strong>of</strong> respondents scoring 15 points or less, and 11 per cent <strong>of</strong> respondentsscoring 24 points or more (out <strong>of</strong> a possible 29 points).Looking first <strong>at</strong> mean scores, respondents aged 16 to 21 were more likely tohave a lower score than respondents in other age groups. Women were morelikely to have a higher score than men and those earning £15,000 or morewere likely to have a higher score than those earning under this. Publicsectorworkers were more likely than priv<strong>at</strong>e-sector workers to have a higherscore, as were those with an HR department compared to those without one.Those who had not experienced a problem <strong>at</strong> work in the past were morelikely than those who had to have a higher score. Those withmanagerial/supervisory duties were more likely than those without suchduties to have a higher score, as were trade union/staff associ<strong>at</strong>ion memberscompared to non-members. Respondents who felt th<strong>at</strong> they knew as much asthey needed to know about rights <strong>at</strong> work were likely to have a higher score43
than those who said th<strong>at</strong> they could do with knowing more. Similarly, thosewho felt well informed about their rights <strong>at</strong> work were more likely than thosewho did not feel well informed to have a higher score. Those in organis<strong>at</strong>ions<strong>of</strong> 500 or more staff were more likely than those in organis<strong>at</strong>ions <strong>of</strong> othersizes to have a higher score.Table 2.5 also shows respondents who scored 15 points or less. Those agedunder 21, or aged 55 and over were more likely to score 15 points or lessthan those aged between 22 and 54. Those without an HR department weremore likely to score 15 points or less than those with an HR department, andthose without managerial/supervisory responsibilities were more likely toscore 15 or less than those with such duties. Non-members <strong>of</strong> tradeunions/staff associ<strong>at</strong>ions were more likely to score 15 points or less thanmembers, and those who had opted-out <strong>of</strong> the working time limit were morelikely to score 15 points or less than those who had not. Those inorganis<strong>at</strong>ions with ten to 24 employees were most likely to score 15 points orless compared to those in organis<strong>at</strong>ions <strong>of</strong> other sizes. Those who said th<strong>at</strong>they could do with knowing more about their rights <strong>at</strong> work were more likelyto score 15 points or less than those who said th<strong>at</strong> they knew as much asthey needed to know. Similarly, those who did not feel well informed abouttheir rights were more likely to score 15 points or less than those who feltwell informed.Finally, Table 2.5 also shows respondents who scored 24 points or more.Those with an HR department were more likely to score 24 points or morecompared to those without one, as were those with managerial/supervisoryduties compared to those without such duties. Those who had notexperienced a problem to do with their rights <strong>at</strong> work in the past were morelikely than those who had experienced a problem to score 24 points or more.Respondents in workplaces with 100 or more staff were more likely to score24 points or more compared to those in other sized workplaces. Those wh<strong>of</strong>elt well informed about their rights <strong>at</strong> work were more likely to score 24 ormore than those who felt not well informed, as were those who felt th<strong>at</strong> theyknew as much as they needed to know about their rights <strong>at</strong> work, comparedto those who said th<strong>at</strong> they could do with knowing more.A ‘vulnerable worker’ is someone working in an environment where the risk<strong>of</strong> adverse tre<strong>at</strong>ment is high, but where their capacity or willingness to takeaction to protect their employment rights is low. This analysis suggests th<strong>at</strong>the groups <strong>of</strong> workers th<strong>at</strong> may be more vulnerable with lower awarenesslevels <strong>of</strong> their rights <strong>at</strong> work do in fact have lower awareness. For example,younger workers, those without an HR department, those who do not havemanagerial/supervisory duties, non-union/staff associ<strong>at</strong>ion members, andthose employed in smaller workplaces. Those who did not feel well informedor felt th<strong>at</strong> they could do with knowing more about their rights <strong>at</strong> work alsohad low awareness levels.44
2.8 Summary2.8.1 How well informed respondents feel about their rights <strong>at</strong> work• 15 per cent <strong>of</strong> respondents feel very well informed about their rights <strong>at</strong>work, with a further 51 per cent feeling well informed, 28 per cent feelingnot very well informed, and six per cent feeling not well informed <strong>at</strong> all.• Having a dependent child (compared to not having one), being a tradeunion/staff associ<strong>at</strong>ion member (compared to not being one), earningbetween £10,000 and £39,999 per year (compared to earning under£10,000 per year), and having a highest qualific<strong>at</strong>ion th<strong>at</strong> is ‘NVQ level 2 orequivalent’, ‘NVQ level 4 or equivalent’ and ‘NVQ level 5 or equivalent’(compared to having no qualific<strong>at</strong>ions), all increase the odds <strong>of</strong> a respondentbeing aware <strong>of</strong> their employment rights.• Having experienced a problem (compared to not having experienced aproblem) decreases the odds <strong>of</strong> a respondent being aware <strong>of</strong> theiremployment rights.2.8.2 Whether respondents know as much as they need to know• 44 per cent <strong>of</strong> all respondents felt th<strong>at</strong> they knew as much as they neededto know, while 55 per cent felt th<strong>at</strong> they could do with knowing more.2.8.3 Whether respondents would know where to find inform<strong>at</strong>ion aboutrights <strong>at</strong> work• Three-quarters <strong>of</strong> all respondents (76 per cent) said th<strong>at</strong> they would knowwhere to find out inform<strong>at</strong>ion about their rights <strong>at</strong> work if they needed to.2.8.4 Awareness <strong>of</strong> employers’ legal oblig<strong>at</strong>ions• <strong>Rights</strong> to do with ensuring employees are not discrimin<strong>at</strong>ed against on thebasis <strong>of</strong> various personal characteristics had higher levels <strong>of</strong> awareness thandid some <strong>of</strong> those rights to do with having children and dependants. Someprovisions th<strong>at</strong> are a legal oblig<strong>at</strong>ion <strong>of</strong> employers only had low levels <strong>of</strong>awareness. In addition, some provisions th<strong>at</strong> are not a legal oblig<strong>at</strong>ion <strong>of</strong>employers was thought by some respondents to be an actual right.Being discrimin<strong>at</strong>ed against• 94 per cent <strong>of</strong> respondents were aware th<strong>at</strong> employers have a legaloblig<strong>at</strong>ion to ensure th<strong>at</strong> employees are not tre<strong>at</strong>ed unfairly because <strong>of</strong> theirrace.• 92 per cent <strong>of</strong> respondents were aware th<strong>at</strong> employers have a legaloblig<strong>at</strong>ion to ensure th<strong>at</strong> employees are not tre<strong>at</strong>ed unfairly because <strong>of</strong> theirdisability.• 91 per cent <strong>of</strong> respondents were aware th<strong>at</strong> employers have a legaloblig<strong>at</strong>ion to ensure th<strong>at</strong> employees are not tre<strong>at</strong>ed unfairly because <strong>of</strong> theirgender.45
• 87 per cent <strong>of</strong> respondents were aware th<strong>at</strong> employers have a legaloblig<strong>at</strong>ion to ensure th<strong>at</strong> employees are not tre<strong>at</strong>ed unfairly because <strong>of</strong> theirsexual orient<strong>at</strong>ion.• 87 per cent <strong>of</strong> respondents were aware th<strong>at</strong> employers have a legaloblig<strong>at</strong>ion to ensure th<strong>at</strong> employees are not tre<strong>at</strong>ed unfairly because <strong>of</strong> theirreligion.• 78 per cent <strong>of</strong> respondents incorrectly thought th<strong>at</strong> employers already havea legal oblig<strong>at</strong>ion to ensure th<strong>at</strong> employees are not tre<strong>at</strong>ed unfairly because<strong>of</strong> their age.<strong>Work</strong>ing time• 81 per cent <strong>of</strong> respondents were aware th<strong>at</strong> employers have a legaloblig<strong>at</strong>ion to let employees take a minimum number <strong>of</strong> weeks’ paid holidayeach year.• 85 per cent <strong>of</strong> respondents were aware th<strong>at</strong> employers have a legaloblig<strong>at</strong>ion to give employees a rest break after working a certain number <strong>of</strong>hours.• 63 per cent <strong>of</strong> respondents were aware th<strong>at</strong> employers have a legaloblig<strong>at</strong>ion not to make employees work more than a given number <strong>of</strong> hourseach week.Pay, contracts, disciplinary and grievance procedures• 93 per cent <strong>of</strong> respondents were aware th<strong>at</strong> employers have a legaloblig<strong>at</strong>ion to pay employees a minimum hourly wage.• 90 per cent <strong>of</strong> respondents were aware th<strong>at</strong> employers must not dismiss anemployee without having a fair reason for doing so.• 84 per cent <strong>of</strong> respondents were aware th<strong>at</strong> employers must provideemployees with a written st<strong>at</strong>ement <strong>of</strong> the terms and conditions <strong>of</strong> their job.• 81 per cent <strong>of</strong> respondents were aware th<strong>at</strong> employers must follow a setprocedure when dealing with a complaint against employees.• 78 per cent <strong>of</strong> respondents were aware th<strong>at</strong> employers must follow a setprocedure when dealing with a grievance or other work-rel<strong>at</strong>ed problemwhich an employer has against employees.Children and dependants• 88 per cent <strong>of</strong> respondents were aware th<strong>at</strong> employers have a legaloblig<strong>at</strong>ion to let women take paid time <strong>of</strong>f when they have a baby.• 55 per cent <strong>of</strong> respondents were aware th<strong>at</strong> employers have a legaloblig<strong>at</strong>ion to let men take paid time <strong>of</strong>f when their partner has a baby.46
• 51 per cent <strong>of</strong> respondents were aware th<strong>at</strong> employers have a legaloblig<strong>at</strong>ion to seriously consider a request for flexible working from parents<strong>of</strong> a young or disabled child.• 49 per cent <strong>of</strong> respondents were aware th<strong>at</strong> employers have a legaloblig<strong>at</strong>ion to let women take additional unpaid time <strong>of</strong>f when they have ababy.• 42 per cent <strong>of</strong> respondents were aware th<strong>at</strong> employers have a legaloblig<strong>at</strong>ion to let employees take time <strong>of</strong>f to look after a dependant in anemergency.• 27 per cent <strong>of</strong> respondents were aware th<strong>at</strong> employers have a legaloblig<strong>at</strong>ion to let parents <strong>of</strong> young children have a set amount <strong>of</strong> unpaid time<strong>of</strong>f work to spend with them.2.8.5 Knowledge <strong>of</strong> the detail <strong>of</strong> the lawThere were a number <strong>of</strong> rights where a high proportion <strong>of</strong> respondents saidth<strong>at</strong> they knew a lot about the detail <strong>of</strong> the law. These were: the right tohave a written st<strong>at</strong>ement <strong>of</strong> terms and conditions (37 per cent knew a lotabout the detail), the right to the NMW (33 per cent knew a lot about thedetail), the right not to be dismissed unfairly (28 per cent knew a lot aboutthe detail), the right to an in-work rest break (27 per cent knew a lot aboutthe detail), and the right not to be discrimin<strong>at</strong>ed against on the grounds <strong>of</strong>race (27 per cent knew a lot about the detail). Other rights to do withdiscrimin<strong>at</strong>ion, working time and pay/contracts/disciplinary and grievanceprocedures also had around a quarter <strong>of</strong> respondents saying th<strong>at</strong> they knew alot about the detail.In contrast to these universally relevant rights, the rights where the highestproportions <strong>of</strong> respondents said th<strong>at</strong> they knew hardly anything about thedetail were in the area <strong>of</strong> children and dependants. Thirty-one per cent saidth<strong>at</strong> they knew hardly anything about the detail <strong>of</strong> the right to requestflexible working, while 30 per cent said th<strong>at</strong> they knew hardly anything aboutthe detail <strong>of</strong> parental leave, 30 per cent said th<strong>at</strong> they knew hardly anythingabout the detail <strong>of</strong> the right to take time <strong>of</strong>f for dependants in an emergency,22 per cent said th<strong>at</strong> they knew hardly anything about the detail <strong>of</strong> additionalm<strong>at</strong>ernity leave, and 21 per cent said th<strong>at</strong> they knew hardly anything aboutthe detail <strong>of</strong> paid p<strong>at</strong>ernity leave (the exception to this was ordinarym<strong>at</strong>ernity leave, where only 15 per cent said th<strong>at</strong> they knew hardly anythingabout the detail).2.8.6 Awareness deficitsAn ‘awareness deficit’ was calcul<strong>at</strong>ed for each right: the proportion <strong>of</strong> allrespondents who were unaware th<strong>at</strong> a right was an actual legal oblig<strong>at</strong>ion,but felt th<strong>at</strong> it was very important for them to know about it.It is important to note th<strong>at</strong> rights will only have a high awareness deficit ifthere was a low level <strong>of</strong> awareness among respondents <strong>of</strong> the right. Issuesth<strong>at</strong> had a high awareness (such as those to do with discrimin<strong>at</strong>ion and the47
NMW), therefore, have a small awareness deficit. It is interesting, however,th<strong>at</strong> for issues where there was a low level <strong>of</strong> awareness, particularly thosearound children and dependants, a sizeable proportion <strong>of</strong> respondents whowere unaware <strong>of</strong> the right think th<strong>at</strong> it is very important for them to knowabout it. These rights, therefore, have some <strong>of</strong> the highest awarenessdeficits: 28 per cent for time <strong>of</strong>f for dependants in an emergency, 18 per centfor parental leave, 16 per cent for the right to request flexible working, 15per cent for additional m<strong>at</strong>ernity leave and 11 per cent for paid p<strong>at</strong>ernityleave (the exception being ordinary m<strong>at</strong>ernity leave <strong>of</strong> which there was highawareness among respondents).Other rights th<strong>at</strong> also had rel<strong>at</strong>ively high awareness deficits were the rightsto: a limit on working hours (13 per cent), paid holidays (ten per cent),having a set disciplinary procedure (ten per cent), having a set grievanceprocedure (ten per cent), and the right to have a written contract (nine percent). These rights may have high awareness deficits, as they have low levels<strong>of</strong> awareness, but are universally relevant rights, which may mean th<strong>at</strong>respondents think th<strong>at</strong> it is very important for them to know about them.2.8.7 Awareness score• An awareness score was developed by giving respondents points for gettingthe answers to awareness questions right and based on issues such as howwell informed they were.• Respondents had an average (mean) score <strong>of</strong> 19.7, with ten per cent <strong>of</strong>respondents scoring 15 points or less, and 11 per cent <strong>of</strong> respondentsscoring 24 points or more (out <strong>of</strong> a possible 29 points). Groups <strong>of</strong>respondents were examined to see which were more likely to have a highermean score, to score 15 points or less, and to score 24 points or more.• This analysis suggests th<strong>at</strong> it is the groups <strong>of</strong> workers th<strong>at</strong> may be morevulnerable and th<strong>at</strong> have low awareness levels <strong>of</strong> their rights <strong>at</strong> work th<strong>at</strong>do in fact have lower awareness. For example, younger workers, thosewithout an HR department, those who do not have managerial/supervisoryduties, non-union/staff associ<strong>at</strong>ion members, and those employed in smallerworkplaces. Those who did not feel well informed, or felt th<strong>at</strong> they could dowith knowing more about their rights <strong>at</strong> work, also had low awarenesslevels.48
3Knowledge <strong>of</strong> specificemployment rightsThis chapter first outlines the approach taken to measuring factual knowledgein the survey. It then looks <strong>at</strong> respondents’ knowledge <strong>of</strong> rights in the areas<strong>of</strong> working time, annual leave and rest breaks, the NMW, and children anddependants. The chapter then examines other key knowledge issues: thepoint <strong>at</strong> which employees are legally entitled to some key rights, the right tobe accompanied to a disciplinary or grievance hearing, and wh<strong>at</strong> employeeshave to do before making a claim to an employment tribunal. This section <strong>of</strong>the report finishes by presenting analysis on the development <strong>of</strong> a knowledgescore, where respondents were given a score based on giving correct answersto key factual questions. Rel<strong>at</strong>ionships are only reported in the text <strong>of</strong> thischapter if they are st<strong>at</strong>istically significant (unless otherwise st<strong>at</strong>ed).3.1 The approach to measuring and analysing factualknowledgeSturgis et al. (2005) have examined the measurement <strong>of</strong> factual knowledgein surveys and concluded th<strong>at</strong> when obtaining survey measures <strong>of</strong> factualknowledge it is best to encourage ‘don’t know’ responses, as there is nostrong evidence to suggest th<strong>at</strong> blind guessing occurs on survey knowledgeitems to any meaningful extent. The approach in this survey was thereforefirst to reassure respondents by saying:‘Please don’t worry if you don’t know the answers – it’s not meant to be <strong>at</strong>est’.‘Don’t know’ responses were included in the knowledge questions, and theneach knowledge question was followed-up by asking how sure the respondentwas <strong>of</strong> their answer. This was done by asking respondents: ‘How sure are youabout the answer to this question?’ with the possible responses: ‘I know it’sright’, ‘I think it’s right’, ‘I’m not sure, it was just a guess’. This enabled adistinction to be made in the analysis between actual knowledge andguesswork.Respondents were told, <strong>at</strong> the start <strong>of</strong> the knowledge section, th<strong>at</strong> theemployment rights th<strong>at</strong> they were being asked specific questions about wereactual legal oblig<strong>at</strong>ions <strong>of</strong> employers. Comparisons between awareness levels<strong>of</strong> specific rights (reported in Chapter 2) and the knowledge <strong>of</strong> the specificrights discussed in this chapter are not made within this chapter. Thesecomparisons are outlined in Chapter 6 which presents a them<strong>at</strong>ic summary <strong>of</strong>the findings by employment right.49
R<strong>at</strong>her than having detailed knowledge <strong>of</strong> all employment rights, wh<strong>at</strong>individuals need is an awareness <strong>of</strong> their rights, plus enough knowledge <strong>of</strong>the coverage <strong>of</strong> those rights to know wh<strong>at</strong> to check if they feel th<strong>at</strong> theiremployer may be contravening their legal entitlements. It is bothunnecessary and unlikely th<strong>at</strong> most individuals will have a detailed knowledge<strong>of</strong> the whole range <strong>of</strong> employment rights before their circumstancesnecessit<strong>at</strong>e this knowledge.3.2 <strong>Work</strong>ing time, annual leave and rest breaksAs discussed in Chapter 2, the WTR came into force in the UK on 1 October1998 and marked the introduction <strong>of</strong> law into wh<strong>at</strong> had previously been alargely unregul<strong>at</strong>ed area in the UK. The WTR introduced average weeklyworking hours limits; placed restrictions on night working; provided forminimum in-work, daily and weekly rest breaks; and introduced a minimumentitlement to paid annual leave. However, the new law also provided theoption for individuals to voluntarily opt out <strong>of</strong> the weekly working hourslimits. In addition, the WTR included a series <strong>of</strong> derog<strong>at</strong>ions which meant th<strong>at</strong>aspects <strong>of</strong> the law could be varied or would not apply in certaincircumstances.<strong>Rights</strong> in the area <strong>of</strong> working time, annual leave and rest breaks wereexamined by the standard set <strong>of</strong> personal or employment characteristics (thestandard breaks), as well as by how well informed a respondent was abouttheir rights, whether they were a member <strong>of</strong> a trade union/staff associ<strong>at</strong>ion,how sure they were <strong>of</strong> their answer to the question, whether they had signedan opt-out agreement, and whether they worked 48 hours a week or more.3.2.1 Estim<strong>at</strong>es <strong>of</strong> the working time limitRespondents were first asked:‘First, for most jobs there is a limit on the average number <strong>of</strong> hours anemployer can make you work per week. How many hours per week do youthink this is?’.Figure 3.1 shows th<strong>at</strong> just over one-quarter (26 per cent) <strong>of</strong> respondentscited the actual working time limit <strong>of</strong> 48 hours. Over half <strong>of</strong> respondents (57per cent) thought th<strong>at</strong> the working time limit was less than 48 hours, 15 percent <strong>of</strong> respondents thought th<strong>at</strong> the limit was more than 48 hours, and fourper cent <strong>of</strong> respondents did not know wh<strong>at</strong> the limit was. The average(mean) number <strong>of</strong> hours cited by respondents was 44.54, while the median 18number was 45.00 hours, both below the actual working time limit. Table 3.1examines in more detail the average number <strong>of</strong> hours cited by respondents,and the group <strong>of</strong> respondents who were correct in citing 48 hours.18 The median is the middle <strong>of</strong> a distribution: half the scores are above the medianand half are below the median. The median is less sensitive to extreme scoresthan the mean and this makes it a better measure than the mean for highlyskewed distributions.50
Figure 3.1: Estim<strong>at</strong>e <strong>of</strong> the weekly working time limit0-3435-3738-4041-4344-4647Citing actual working time limit (48 hours)4950-5960 and overDon’t know0 5 10 15 20 25 30 35per centNote: Base is 1,038 (all respondents). Darker shade in chart indic<strong>at</strong>es incorrect answer.Source: IES/BMRB, 2005Table 3.1: Estim<strong>at</strong>es <strong>of</strong> the weekly working time limitMean no.<strong>of</strong> hoursCiting 48Unweightedhoursbase %UnweightedbaseAll respondents 44.5 995 26 1,038Age 16-24 44.3 107 11 11425-34 44.5 212 21 21535-44 45.1 275 32 28945-54 44.8 239 31 24955-64 43.3 161 31 170Gender Male 45.4 451 34 472Female 43.7 544 16 566Earnings Under £15,000 44.0 391 18 412£15,000 to £24,999 44.5 251 31 260£25,000 to £39,999 45.1 170 31 174£40,000 + 47.1 75 42 79Hours worked Full-time 44.8 531 29 781Part-time 43.8 196 15 250Type <strong>of</strong> organis<strong>at</strong>ion Public sector 44.0 324 23 336Priv<strong>at</strong>e sector 44.8 633 27 662Whether has HR/personnel dept Yes 44.5 708 29 735No 45.1 247 18 25951
Table 3.1: continuedMean no. <strong>of</strong>hoursCiting 48Unweightedhoursbase %UnweightedbaseWhether experienced problems Yes 44.3 403 26 416No 44.7 592 25 622Managerial/supervisory duties Yes 45.7 372 29 387No 43.8 623 23 651Number <strong>of</strong> employees in 1 to 9 45.4 148 21 159workplace10 to 24 46.0 159 20 168Whether member <strong>of</strong> TU/staffassoc.How well informed about rights <strong>at</strong>workWhether signed opt-outagreementWhether work over 48 hrs perweekHow sure are you about theanswer to this questionNote: Base = all respondents.Source: IES/BMRB, 200525 to 99 43.6 240 25 250100 to 499 44.9 221 32 228500+ 43.9 203 26 208Yes 44.4 315 29 329No 44.6 672 24 701Well informed 44.4 464 28 680Not well informed 44.8 265 20 353Yes 45.7 128 44 135No 44.5 833 23 866Yes 45.7 166 34 172No 44.3 793 24 826I know it’s right 45.3 177 71 177I think it’s right 43.3 514 24 514A guess 46.1 304 5 304Looking first <strong>at</strong> the average (mean) number <strong>of</strong> hours cited by respondents,Table 3.1 shows th<strong>at</strong> men are more likely than women to cite a higheraverage number <strong>of</strong> hours (and therefore be closer to the actual working timelimit). The higher the earnings <strong>of</strong> respondents, the more likely they are tocite a higher average number <strong>of</strong> hours (and therefore be closer to the actualworking time limit). The fact th<strong>at</strong> men, and those with higher earnings, arecloser to citing the actual working time limit may reflect their propensity towork longer hours.Respondents who had managerial duties, worked more than 48 hours, hadsigned a working-time opt-out agreement, or worked in organis<strong>at</strong>ionsemploying ten to 24 staff were more likely to cite a higher number <strong>of</strong> hours(and so give a more accur<strong>at</strong>e answer). Those who guessed their answer wereactually more likely than those who said th<strong>at</strong> they knew their answer wasright, or thought it was right, to cite a higher number <strong>of</strong> hours.52
Table 3.1 shows respondents who got the answer correct and cited 48 hoursa week. It shows th<strong>at</strong> those most likely to cite the actual working time limitwere: men, older workers, those earning £40,000 per year, and full-timeworkers. The results may be because these groups have a higher propensityto work longer hours. The level <strong>of</strong> accuracy was also higher amongrespondents in an organis<strong>at</strong>ion with an HR department, and among thosewith managerial/supervisory duties. Respondents who felt well informedabout their rights <strong>at</strong> work were more likely to cite the actual limit, as werethose who were sure th<strong>at</strong> their answer was right. Finally, a higher proportion<strong>of</strong> those in workplaces <strong>of</strong> 100 to 499 employees cited the actual limitcompared to those in workplaces <strong>of</strong> other sizes.Those working more than 48 hours per week were more likely to cite theexact limit than those working 48 hours per week or less, as were those whohad signed an opt-out agreement compared to those who had not signedone. The estim<strong>at</strong>es <strong>of</strong> the working time limit were also analysed by thenumber <strong>of</strong> hours worked by respondents, to see if the more hours arespondent worked per week, the more likely they were to have an accur<strong>at</strong>eestim<strong>at</strong>e <strong>of</strong> the working time limit. However, while there was a distinctdifference between those working more and less than 48 hours, there was nolinear rel<strong>at</strong>ionship between increasing hours worked and increasingknowledge <strong>of</strong> the limit.3.2.2 Opting out <strong>of</strong> the working time limitRespondents were then asked some questions about opting out <strong>of</strong> theworking time limit:‘The law on working hours st<strong>at</strong>es th<strong>at</strong> the limit on the average number <strong>of</strong>hours employers can make employees work per week is 48 hours.‘Do you think an employee can legally opt out <strong>of</strong> this maximum limit byinformally agreeing with their employer to work longer hours?‘Do you think an employee can legally opt out <strong>of</strong> this maximum limit bysigning a written document agreeing to work longer hours?‘Some employers make it a condition <strong>of</strong> employment th<strong>at</strong> workers agree towork more than the weekly limit – th<strong>at</strong> is, they won’t give someone a jobunless they agree to work more than the weekly limit. Do you think thispractice is legal or not?’ 19 .Table 3.2 shows the results <strong>of</strong> these questions.19 As this question st<strong>at</strong>es th<strong>at</strong> some employers do this, some respondents mayconclude th<strong>at</strong> it is legal. The number who got this question wrong may, therefore,be artificially high.53
Table 3.2: Opting out <strong>of</strong> the working time limitIndividualcan opt outinformallyIndividualcan opt outin writingEmployer canmake opt-out acondition <strong>of</strong>employment% % %UnweightedbaseAll respondents 43 66 20 1,038Age 16-24 43 71 27 11425-34 46 71 21 21535-44 39 65 18 28945-54 41 64 18 24955-64 45 61 14 170Gender Male 46 72 22 472Female 38 61 17 566Earnings Under £15,000 42 64 20 412£15,000 to £24,999 45 71 19 260£25,000 to £39,999 40 67 19 174£40,000 + 42 73 19 79Hours worked Full-time 43 68 20 781Part-time 40 62 20 250Type <strong>of</strong> organis<strong>at</strong>ion Public sector 39 58 17 336Priv<strong>at</strong>e sector 44 70 21 662Whether has HR/personnel Yes 42 67 19 735deptNo 43 65 19 259Whether experienced Yes 48 70 19 416problemsNo 39 64 20 622Managerial/supervisory duties Yes 42 70 17 387No 43 64 21 651Number <strong>of</strong> employees in 1 to 9 37 59 21 159workplace10 to 24 47 70 20 168Whether member <strong>of</strong> TU/staffassoc.Whether signed opt-outagreementWhether work over 48 hrs perweek25 to 99 43 70 22 250100 to 499 43 68 15 228500+ 41 68 21 208Yes 42 67 17 329No 43 67 20 701Yes 51 88 19 135No 40 63 20 866Yes 50 79 24 172No 41 64 19 82654
Table 3.2: continuedHow well informed aboutrights <strong>at</strong> workHow sure are you about theanswer to this questionSource: IES/BMRB, 2005Individualcan opt outinformallyIndividualcan opt outin writingEmployer canmake opt-out acondition <strong>of</strong>employment% % %UnweightedbaseWell informed 40 66 20 680Not well informed 47 67 18 353I know it’s right 44 88 16 177I think it’s right 47 71 21 514A guess 44 55 25 304Table 3.2 shows th<strong>at</strong> 43 per cent <strong>of</strong> respondents incorrectly thought th<strong>at</strong> anindividual could opt out informally. Those who had experienced a problem <strong>at</strong>work in the past were more likely to think th<strong>at</strong> an individual could opt outinformally. One in five respondents incorrectly thought th<strong>at</strong> an employercould make opting out a condition <strong>of</strong> employment. While there were somevari<strong>at</strong>ions between groups in terms <strong>of</strong> thinking an employer could make it acondition <strong>of</strong> employment, none was st<strong>at</strong>istically significant.• Two-thirds <strong>of</strong> respondents (66 per cent) were correct in knowing th<strong>at</strong>employees could legally opt out by signing a written document. In contrastto findings in rel<strong>at</strong>ion to many other rights, the younger a respondent was,the more likely they were to know th<strong>at</strong> an employee could opt out bysigning a written document. Men were more likely than women to knowemployees could opt out by signing a written document, as were full-timeworkers compared to part-timers, priv<strong>at</strong>e-sector workers compared topublic-sector workers, and those with managerial/supervisory dutiescompared to those without such duties. These results are similar to resultsfor the proportion citing 48 hours, discussed above. Those who hadexperienced problems <strong>at</strong> work were more likely to know employees couldopt out in this way, compared to those who had not experienced such aproblem.• <strong>Employees</strong> in workplaces with ten to 24 employees, and workplaces with 25to 99 staff were more likely than those in other workplace sizes to know th<strong>at</strong>employees could opt out in writing. Those who had signed an opt-out weremore likely to know about this right than those who had not, as were thoseworking more than 48 hours compared to those working 48 hours or less.Respondents who were sure th<strong>at</strong> their answer was right were also more likelythan respondents who thought their answer was right, or guessed theanswer, to know about this right.3.2.3 Paid holiday entitlementRespondents were asked:55
‘<strong>Work</strong>ers have the right to a minimum number <strong>of</strong> weeks’ <strong>of</strong> paid holidayeach year. How many weeks do you think this is for someone working fulltime?’.Table 3.3: Estim<strong>at</strong>es <strong>of</strong> minimum holiday entitlementMean no. <strong>of</strong>weeksCiting 4Unweightedweeksbase %UnweightedbaseAll respondents 3.9 1,008 61 1,038Age 16-24 3.9 109 58 11425-34 4.2 212 65 21535-44 3.7 276 63 28945-54 3.8 244 65 24955-64 3.7 166 48 170Gender Male 3.9 193 57 472Female 3.9 178 66 566Earnings Under £15,000 3.9 399 64 412£15,000 to £24,999 4.1 255 65 260£25,000 to £39,999 3.5 172 53 174£40,000 + 3.7 73 60 79Hours worked Full-time 3.9 760 61 781Part-time 3.9 243 62 250Type <strong>of</strong> organis<strong>at</strong>ion Public sector 3.9 332 58 336Priv<strong>at</strong>e sector 3.8 638 64 662Whether has HR/personnel dept Yes 3.8 715 61 735No 3.9 253 61 259Whether experienced problems Yes 4.0 406 63 416No 3.8 602 60 622Managerial/supervisory duties Yes 3.7 379 62 387No 4.0 629 61 651Number <strong>of</strong> employees in workplace 1 to 9 3.7 155 64 15910 to 24 4.2 168 63 16825 to 99 3.8 241 61 250100 to 499 3.7 219 63 228500+ 3.9 204 59 208Whether member <strong>of</strong> TU/staff assoc. Yes 3.9 321 58 329No 3.9 680 63 701How well informed about rights <strong>at</strong> work Well informed 3.8 661 59 680Not well informed 4.1 343 65 353How sure are you about the answer to I know it’s right 4.0 212 89 212this questionI think it’s right 3.9 585 61 585Source: IES/BMRB, 2005A guess 3.7 211 39 21156
The median number <strong>of</strong> weeks cited by all respondents, and all sub-groupsshown in Table 3.3, was 4.0. Looking first <strong>at</strong> the mean number <strong>of</strong> weeks citedby respondents, Table 3.3 shows th<strong>at</strong> the mean number for all respondentswas 3.9 weeks, very close to the correct answer <strong>of</strong> four weeks. Perhapssurprisingly, those aged 16 to 24 were more likely than other age groups toget their answer closest to the correct answer <strong>of</strong> four weeks. Those earningless than £25,000 per year were more likely than those earning more to gettheir answer closest to the correct answer <strong>of</strong> four weeks. Those who hadexperienced a problem to do with their rights <strong>at</strong> work in the past were morelikely than those who had not, to cite the correct number <strong>of</strong> weeks, as werethose who did not have managerial/supervisory duties compared to thosewho did have such duties. Those in workplaces <strong>of</strong> 500 or more employeeswere more likely than those in smaller workplaces to get their answer closestto the correct answer <strong>of</strong> four weeks. Those who felt less well informed abouttheir rights <strong>at</strong> work were actually more likely than those who did feelinformed to get their answer closest to the correct answer <strong>of</strong> four weeks.Moving on to examine the proportion <strong>of</strong> respondents who got this answercorrect, citing four weeks, Table 3.3 shows th<strong>at</strong> 61 per cent <strong>of</strong> allrespondents got this correct. A higher proportion <strong>of</strong> respondents aged 25 to34 and aged 45 to 54 got this correct compared to other age groups. Womenwere more likely than men to get this answer correct. Those earning under£25,000 per year were more likely to get this answer correct than thoseearning over £25,000 per year. Respondents who were sure about theiranswer to the question were more likely than those who only thought th<strong>at</strong>their answer was correct, or who had guessed their answer, to get thisanswer correct.Respondents were then asked:‘You said you thought th<strong>at</strong> workers have a right to <strong>at</strong> least [number <strong>of</strong>weeks cited] <strong>of</strong> paid holiday each year. Do you think employees areentitled to public or bank holidays in addition to the [number <strong>of</strong> weekscited] or do you think employers can include public or bank holidays aspart <strong>of</strong> the [number <strong>of</strong> weeks cited]?’.Table 3.4 shows th<strong>at</strong> only just under one-third <strong>of</strong> respondents (32 per cent)knew th<strong>at</strong> employers can include public holidays in the minimum holidayentitlement, with 64 per cent incorrectly thinking th<strong>at</strong> employers cannotinclude public holidays, and four per cent <strong>of</strong> respondents not knowing.Respondents who had had a problem to do with their rights <strong>at</strong> work in thepast were more likely to get the answer right than those who had not hadsuch a problem. Those who had guessed their answer were more likely thanthose who thought th<strong>at</strong> their answer was right, or were sure th<strong>at</strong> it was right,to get the answer right, reinforcing the level <strong>of</strong> uncertainty around thisentitlement.57
Table 3.4: Is there a legal entitlement to public holidays on top <strong>of</strong> theminimum leave entitlement?Public holidaysnot includedPublic holidaysincludedDon’t know% % %UnweightedbaseAll respondents 64 32 4 1,008Age 16-24 55 37 8 10925-34 60 35 5 21235-44 69 30 * 27645-54 65 31 4 24455-64 70 27 * 166Gender Male 65 32 4 456Female 64 33 4 552Earnings Under £15,000 61 34 5 399£15,000 to £24,999 65 31 4 255£25,000 to £39,999 62 36 * 172£40,000 + 72 24 * 73Hours worked Full-time 63 33 4 760Part-time 68 28 5 243Type <strong>of</strong> organis<strong>at</strong>ion Public sector 66 30 4 332Priv<strong>at</strong>e sector 64 33 4 638Whether has HR/personnel Yes 64 32 4 715deptNo 61 35 4 253Whether experienced Yes 60 37 3 406problemsNo 67 28 4 602Managerial/supervisory duties Yes 63 34 3 397No 65 31 4 629Number <strong>of</strong> employees in 1 to 9 58 38 4 155workplace10 to 24 59 35 6 168Whether member <strong>of</strong> TU/staffassoc.How well informed aboutrights <strong>at</strong> workHow sure are you about theanswer to this questionSource: IES/BMRB, 200525 to 99 70 26 4 241100 to 499 65 33 2 219500+ 64 31 5 204Yes 64 32 4 321No 64 32 4 680Well informed 63 32 5 661Not well informed 66 32 2 343I know it’s right 71 29 - 300I think it’s right 68 32 - 536A guess 52 48 - 13658
3.2.4 Days <strong>of</strong>f in a 14-day period and in-work rest breaksRespondents were asked:‘As well as paid holiday, employees in most jobs are legally entitled to havea certain number <strong>of</strong> days <strong>of</strong>f, either <strong>at</strong> the weekend or during the week.How many days <strong>of</strong>f do you think employees are legally entitled to withinany 14-day period?’.Figure 3.2 shows the results <strong>of</strong> this question.Figure 3.2: Entitlement to days <strong>of</strong>f over a 14-day period45403530per cent2520151050One day Two days Three days Four days Five days Don’t knowNote: Base is 1,038. Darker shade in chart indic<strong>at</strong>es incorrect answer.Source: IES/BMRB, 2005Figure 3.2 shows th<strong>at</strong> only one-third <strong>of</strong> respondents (33 per cent) knew th<strong>at</strong>employees were entitled to two days <strong>of</strong>f in a 14-day period. Thirty-nine percent <strong>of</strong> respondents thought th<strong>at</strong> it was four days <strong>of</strong>f, perhaps equ<strong>at</strong>ing it toweekends; while over one in ten respondents (12 per cent) thought it wasone day <strong>of</strong>f, seven per cent thought th<strong>at</strong> it was three days <strong>of</strong>f, two per centthought it was five days <strong>of</strong>f and seven per cent did not know the answer.Respondents were then asked:‘Now thinking about rest breaks <strong>at</strong> work. If you work a certain number <strong>of</strong>hours, you are legally entitled to a rest break <strong>of</strong> <strong>at</strong> least 20 minutes. Howmany hours do you think you have to work to be legally entitled to a restbreak?’.Figure 3.3 shows the results <strong>of</strong> this question.59
Figure 3.3: Number <strong>of</strong> hours before rest break605040per cent3020100More thanoneMore thantwoMore thanthreeMore thanfourMore thanfiveMore thansixMore thansevenMore thaneightDon’t knowNote: Base is 1,038. Darker shade in chart indic<strong>at</strong>es incorrect answer.Source: IES/BMRB, 2005Figure 3.3 shows th<strong>at</strong> fewer than one in ten respondents (nine per cent) knewth<strong>at</strong> employees had to work more than six hours before being legally entitled toa rest break. Almost half <strong>of</strong> respondents (49 per cent) incorrectly thought th<strong>at</strong>they had to work more than four hours before being legally entitled to a restbreak, while 15 per cent thought they had to work more than three hours beforea rest break, and 12 per cent thought they had to work more than five hours.Eight per cent thought they had to work more than two hours, two per centthought they had to work more than eight, one per cent thought they had towork more than one, and one per cent thought they had to work more thanseven. Seven per cent <strong>of</strong> respondents did not know the answer to the question.Table 3.5 examines the results from the above two questions in more detail,by looking <strong>at</strong> the proportion <strong>of</strong> respondents who gave the correct answers tothese questions.Table 3.5: Proportions giving correct responses to days <strong>of</strong>f in 14-dayperiod and rest breaks questionsEntitled to 2 days in14-day periodEntitled to break whenworked more than six hours% citing % citingUnweightedbaseAll respondents 33 9 1,038Age 16-24 33 9 11425-34 36 10 21535-44 32 10 28945-54 37 9 24955-64 19 7 170Gender Male 34 7 472Female 32 12 56660
Table 3.5: continuedEntitled to 2 days in14-day period61Entitled to break whenworked more than six hours% citing % citingUnweightedbaseEarnings Under £15,000 33 11 412£15,000 to £24,999 31 7 260£25,000 to £39,999 36 8 174£40,000 + 35 8 79Hours worked Full-time 32 9 781Part-time 35 10 250Type <strong>of</strong> organis<strong>at</strong>ion Public sector 30 13 336Priv<strong>at</strong>e sector 34 8 662Whether has HR/personnel Yes 32 10 735deptNo 35 8 259Whether experienced Yes 33 9 416problemsNo 33 9 622Managerial/supervisory Yes 35 10 387dutiesNo 31 9 651Number <strong>of</strong> employees in 1 to 9 33 8 159workplace10 to 24 34 11 168Whether member <strong>of</strong> TU/staffassoc.How well informed aboutrights <strong>at</strong> workWhether signed opt-outagreementWhether work over 48 hrs perweekHow sure are you about theanswer to this questionSource: IES/BMRB, 200525 to 99 30 9 250100 to 499 39 10 228500+ 31 9 208Yes 27 9 329No 35 10 701Well informed 34 9 680Not well informed 31 9 353Yes 31 8 135No 33 10 866Yes 39 5 172No 31 10 826I know it’s right 28 17 177I think it’s right 33 6 514A guess 41 10 304Table 3.5 shows th<strong>at</strong> the proportion <strong>of</strong> respondents knowing th<strong>at</strong> employeesare entitled to two days <strong>of</strong>f in a 14-day period varies by age group, withthose aged 45 to 54 being more likely than other age groups to get theanswer right. Those who were not members <strong>of</strong> a trade union/staff associ<strong>at</strong>ionwere actually more likely to get the answer right than those who weremembers, perhaps reflecting an over-estim<strong>at</strong>ion <strong>of</strong> the generosity <strong>of</strong>
employment rights. As with other rights in the area <strong>of</strong> working time, thoseworking more than 48 hours per week were more likely than those working48 hours a week or less to get the answer right. Those who said th<strong>at</strong> theyknew their answer was right, as compared to those who were less sure, wereactually least likely to get the answer right.Table 3.5 also shows th<strong>at</strong> in terms <strong>of</strong> knowing th<strong>at</strong> employees are entitled toa break when they have worked more than six hours, women were morelikely to get the answer right than men, as were those working in the publicsector compared to the priv<strong>at</strong>e sector, and those who were sure about theiranswer compared to those who were not. In this case, those working 48hours a week or less were actually more likely to get the answer right thanthose working more than 48 hours.3.3 N<strong>at</strong>ional Minimum WageAs set out in Chapter 2, a st<strong>at</strong>utory NMW was introduced in April 1999. Theoriginal legisl<strong>at</strong>ion set minimum r<strong>at</strong>es for almost all workers aged 22 andover and those aged 18 to 21. It included some exemptions in cases <strong>of</strong>younger workers on apprenticeship programmes. The two r<strong>at</strong>es have beenincreased each year since the introduction <strong>of</strong> the NMW. Until October 2004,the major provisions <strong>of</strong> the NMW legisl<strong>at</strong>ion remained largely unchanged.October 2004 saw the first major structural change to the law 20 with theintroduction <strong>of</strong> a minimum r<strong>at</strong>e for 16 and 17 year olds over compulsoryschool leaving age but not on apprenticeships. The r<strong>at</strong>es introduced inOctober 2004 were: £3 an hour for 16 and 17 year olds, £4.10 an hour for 18to 21 year olds, and £4.85 an hour for workers aged 22 and over. These werethe r<strong>at</strong>es in place <strong>at</strong> the time <strong>of</strong> the survey.The questions on the right to a NMW were examined by the standard set <strong>of</strong>personal or employment characteristics (the standard breaks), as well as byhow well informed a respondent was about their rights, whether they were amember <strong>of</strong> a trade union/staff associ<strong>at</strong>ion, and how accur<strong>at</strong>e they thoughttheir answer was.3.3.1 Who is eligible for the NMW?A series <strong>of</strong> questions explored respondents’ knowledge <strong>of</strong> the rights rel<strong>at</strong>ingto the NMW. The first question was asked <strong>of</strong> all respondents:‘One right th<strong>at</strong> employees have is the right to a N<strong>at</strong>ional MinimumWage, th<strong>at</strong> is, a minimum r<strong>at</strong>e <strong>of</strong> pay per hour th<strong>at</strong> they work. Which <strong>of</strong>the following age groups do you think are covered by the N<strong>at</strong>ionalMinimum Wage: 14-15 year olds? 16-17 year olds? 18-21 year olds? 22-64year olds? 65s and over?’.Figure 3.4 shows the results <strong>of</strong> this question.20 A series <strong>of</strong> smaller changes have, however, been introduced followingrecommend<strong>at</strong>ions from the Low Pay Commission. For example, in addition to thenew NMW for 16 and 17 year olds, October 2004 also saw new regul<strong>at</strong>ions onpiece r<strong>at</strong>es aimed, in particular, <strong>at</strong> protecting home workers.62
Figure 3.4: Which groups are covered by the NMW?100%90%80%70%60%50%40%30%20%10%0%14-15 yr olds 16-17 yr olds 18-21 yr olds 22-64 yr olds 65s and overNote: Base 1,038. Darker shade in chart indic<strong>at</strong>es incorrect answer.Source: IES/BMRB, 2005Figure 3.4 shows th<strong>at</strong> most people knew th<strong>at</strong> 18 to 64 year olds are coveredby the NMW; and th<strong>at</strong> 14 and 15 year olds are not covered. However, therewas less clarity about the st<strong>at</strong>us <strong>of</strong> 16 and 17 year olds and those aged 65 andover.Almost all respondents (95 per cent) said correctly th<strong>at</strong> 22 to 64 year olds havea right to the NMW; and nearly as many (93 per cent), th<strong>at</strong> workers aged 18 to21 are covered. The large majority (83 per cent) also said th<strong>at</strong> 14 and 15 yearolds do not have minimum wage protection; however, a larger group <strong>of</strong>respondents than for the first two questions gave an incorrect response, withover one in ten (12 per cent) saying th<strong>at</strong> this age group have a right to theNMW.There was less knowledge <strong>of</strong> the law for people aged 65 and older. There isno upper-age limit on NMW entitlement; however, over a quarter (26 percent) <strong>of</strong> survey respondents thought th<strong>at</strong> people above the standardretirement age do not have a right to the NMW. This question was the onewhere there was most uncertainty among respondents: 18 per cent wereunsure <strong>of</strong> their answer to this question.The NMW for 16 and 17 year olds was introduced in October 2004. The factth<strong>at</strong> this was a rel<strong>at</strong>ively recent change to the law may be one <strong>of</strong> the reasonswhy a r<strong>at</strong>her lower proportion <strong>of</strong> respondents knew th<strong>at</strong> this age group hadthe right to the NMW, than was the case for older workers. Just under six inten (58 per cent) thought th<strong>at</strong> 16 and 17 year olds were covered by theNMW, with 38 per cent saying th<strong>at</strong> they were not covered.Table 3.6 examines differences in knowledge for the NMW st<strong>at</strong>us <strong>of</strong> each agegroup in more detail.63
Table 3.6: Which groups are covered by the NMW? (percentagesaying yes)14-15yrs16-17yrs18-21yrs22-64yrs 65 +% % % % %UnweightedbaseAll respondents 12 58 93 95 56 1,038Age 16-21 15 55 92 86 61 6022-34 16 64 95 96 65 26935-44 12 57 94 95 53 28945-54 8 53 90 95 48 24955-64 9 56 94 97 49 170Gender Male 11 60 93 95 53 472Female 14 55 93 95 59 566Earnings Under £5,000 15 52 93 88 60 89£5,000 to £9,999 14 52 90 96 58 129£10,000 to £14,999 11 52 95 96 57 194£15,000 to £19,999 11 57 89 89 53 158£20,000 to £39,999 10 63 95 99 53 276£40,000 + 12 67 94 98 46 79Hours worked Full-time 11 59 94 95 55 781Part-time 15 53 93 96 59 250Type <strong>of</strong> organis<strong>at</strong>ion Public sector 13 59 95 97 58 336Priv<strong>at</strong>e sector 12 57 92 94 55 662Whether has HR/personnel Yes 12 60 93 96 58 735deptNo 13 52 92 94 51 259Whether experienced Yes 14 60 92 94 55 416problemsNo 11 56 94 96 56 622Managerial/supervisory Yes 12 59 92 97 56 387dutiesNo 12 57 94 94 56 651Number <strong>of</strong> employees in 1 to 9 14 57 91 97 52 159workplace10 to 24 12 61 92 95 59 168Whether member <strong>of</strong> TU/staffassoc.How well informed aboutrights <strong>at</strong> workSource: IES/BMRB, 200525 to 99 12 59 95 96 60 250100 to 499 12 56 95 95 57 228500+ 11 56 93 96 50 208Yes 12 58 94 95 53 329No 13 58 93 95 57 701Well informed 13 60 93 96 57 680Not well informed 12 54 93 94 54 35364
Table 3.6 shows th<strong>at</strong>:• A small proportion <strong>of</strong> most groups incorrectly thought th<strong>at</strong> 14 and 15 yearolds had a right to the NMW. Those who had experienced a problem to dowith their rights <strong>at</strong> work in the past were more likely than those who hadnot incorrectly to think th<strong>at</strong> the NMW covered this age group.• Knowledge <strong>of</strong> the minimum wage entitlement <strong>of</strong> 16 and 17 year olds washighest among higher earners: those earning £15,000 per year or morewere more likely than those earning under £15,000 per year to say th<strong>at</strong> 16and 17 year olds were covered by the NMW. Those who thought th<strong>at</strong> theywere well informed about their rights <strong>at</strong> work were more likely than thosewho did not to say th<strong>at</strong> 16 and 17 year olds are covered.• The vast majority <strong>of</strong> most groups knew th<strong>at</strong> 18 to 21 year olds were entitledto the NMW, while those with managerial or supervisory duties were actuallyless likely than those who did not have such duties to know 18 to 21 yearolds are covered by the NMW.• As with knowledge <strong>of</strong> the minimum wage entitlement <strong>of</strong> 18 to 21 year olds,the majority <strong>of</strong> most groups knew th<strong>at</strong> 22 to 64 year olds are entitled to theNMW. Those who had experienced a problem to do with their rights <strong>at</strong> workin the past were less likely to know th<strong>at</strong> 22 to 64 year olds are entitled tothe NMW than those who had not experienced a problem.• Those most likely to know th<strong>at</strong> workers aged 65 and over were covered bythe NMW were respondents aged 22 to 34. The employees least likely toknow <strong>of</strong> the right were those in the age groups who would seem to havemost interest in knowing about it: those aged 45 to 54, and those aged 55to 64. Women were more likely than men to be aware th<strong>at</strong> 65 year olds andabove are covered, while those who had experienced a problem to do withtheir rights <strong>at</strong> work were less likely than those who had not to be aware <strong>of</strong>this right. Those working for small employers (with one to nine employees),and large employers (with 500 or more employees) were least likely toknow th<strong>at</strong> this older age group were covered.3.3.2 Is the NMW the same for all groups?All respondents who had said th<strong>at</strong> <strong>at</strong> least two age groups had rights to theNMW were then asked:‘Do you think the N<strong>at</strong>ional Minimum Wage is the same for all <strong>of</strong> these agegroups?’.Table 3.7 shows the results <strong>of</strong> this question.65
Table 3.7: Is the NMW the same for different age groups?Yes No Don’t knowUnweighted% % % baseAll respondents 33 63 4 998Age 16-21 30 66 4 5622-34 32 65 4 26735-44 35 60 5 27645-54 31 66 3 23255-64 34 60 7 166Gender Male 33 63 4 451Female 32 64 4 547Earnings Under £5,000 26 68 * 84£5,0000 to £9,999 32 68 - 123£10,000 to 14,999 29 67 4 189£15,000 to £19,999 28 65 7 149£20,000 to £39,999 34 63 3 268£40,000 + 42 54 4 77Hours worked Full-time 34 62 4 752Part-time 29 67 3 240Type <strong>of</strong> organis<strong>at</strong>ion Public sector 35 60 5 324Priv<strong>at</strong>e sector 32 64 4 635Whether has HR/personnel dept Yes 35 61 5 709No 29 67 4 247Whether experienced problems Yes 31 66 2 400No 34 61 5 598Managerial/supervisory duties Yes 33 63 4 373No 33 63 4 625Number <strong>of</strong> employees in workplace 1 to 9 25 72 3 15110 to 24 31 67 3 16425 to 99 35 62 3 242100 to 499 34 61 5 222500+ 36 59 5 198Whether member <strong>of</strong> TU/staff assoc. Yes 35 60 6 313No 32 66 3 678How well informed about rights <strong>at</strong> Well informed 32 64 4 655workNot well informed 34 62 4 338Source: IES/BMRB, 2005One-third (33 per cent) <strong>of</strong> all respondents, indic<strong>at</strong>ed th<strong>at</strong> they thought th<strong>at</strong>there was a single r<strong>at</strong>e applying regardless <strong>of</strong> age. Those who had66
experienced a problem in rel<strong>at</strong>ion to their rights in the past were less likelyincorrectly to think there was a single r<strong>at</strong>e. Perhaps surprisingly, tradeunion/staff associ<strong>at</strong>ion members were more likely than non-union membersincorrectly to think th<strong>at</strong> there was a single r<strong>at</strong>e.3.3.3 How much is the NMW?Respondents who thought an age group was covered by the NMW and whothought the NMW varied by age group were then asked:‘How much per hour do you think the minimum wage is for: (each group asapplicable: 14-15 year olds? 16-17 year olds? 18-21 year olds? 22-64 yearolds? 65s and over?) Please give your best guess if you don’t know’.Figure 3.5 shows the results <strong>of</strong> this question.Figure 3.5: How much is the NMW for each age group?£6.00£5.00£4.00£3.00£2.00£1.00£0.0014-15 yr olds (80) 16-17 yr olds (397) 18-21 yr olds (613) 22-64 yr olds (607) 65s and over (342)Mean Actual NMW (October 2004)Note: Bases are all respondents who think th<strong>at</strong> age group is covered by the NMW and th<strong>at</strong> the NMW varies by agegroup. Darker shade in chart indic<strong>at</strong>es incorrect answer.Source: IES/BMRB, 2005Figure 3.5 shows th<strong>at</strong> in all age groups where the NMW applies, respondentsover-estim<strong>at</strong>ed the r<strong>at</strong>e. The average (mean) r<strong>at</strong>e cited was £4.07 for 16 and17 year olds, where the actual r<strong>at</strong>e was £3, and the average r<strong>at</strong>e cited for 18to 21 year olds was £4.61, considerably higher than the actual r<strong>at</strong>e <strong>of</strong> £4.10.For 22 to 64 year olds the average r<strong>at</strong>e cited was £5.08, and the actual r<strong>at</strong>ewas £4.85, while for those aged 65 and over the average r<strong>at</strong>e cited wasslightly less <strong>at</strong> £5.03, compared to the actual r<strong>at</strong>e <strong>of</strong> £4.85.The analysis below looks <strong>at</strong> each age group th<strong>at</strong> is entitled to the NMW in turn.67
Estim<strong>at</strong>es <strong>of</strong> the r<strong>at</strong>e for 16 and 17 year oldsFirstly, Table 3.8 examines how much respondents 21was for this age group.thought th<strong>at</strong> the NMWTable 3.8: How much is the NMW for 16 and 17 year olds?Citing correctMean Median answer (£3.00)Within 10% <strong>of</strong>correct answer£ £ % %All respondents 4.07 4.00 6 6 397Age 16-21 3.80 3.75 * * 2322-34 4.11 4.10 4 6 11835-44 4.13 4.05 6 5 10945-54 4.05 4.00 7 9 8955-64 4.04 4.00 * * 58Gender Male 4.13 4.10 6 5 186Female 4.00 4.00 5 7 211Earnings Under £5,000 3.87 3.75 * * 30£5,000 to £9,999 3.95 4.00 12 * 48£10,000 to £14,999 4.07 4.04 * 7 78£15,000 to £19,999 4.12 4.13 * * 58£20,000 to £39,999 4.14 4.18 * 5 109£40,000 + 4.21 4.00 * * 32Hours worked Full-time 4.14 4.10 4 4 307Part-time 3.80 3.80 10 14 88Type <strong>of</strong> organis<strong>at</strong>ion Public sector 4.11 4.00 * 5 124Priv<strong>at</strong>e sector 4.06 4.00 6 6 254Yes 4.09 4.00 6 6 287Whether hasHR/personnel deptWhether experiencedproblemsManagerial/supervisorydutiesNumber <strong>of</strong> employees inworkplaceUnweightedbaseNo 3.95 3.87 5 8 93Yes 4.06 4.00 5 6 162No 4.08 4.00 6 5 235Yes 4.10 4.06 7 5 148No 4.05 4.00 4 7 2491 to 9 4.07 4.00 * 11 5810 to 24 3.95 4.00 7 * 6825 to 99 4.03 4.00 7 6 97100 to 499 4.21 4.25 6 * 89500+ 4.05 4.00 * * 7721 Respondents who thought 16 and 17 year olds were covered by the NMW andthought the NMW varied by age group.68
Table 3.8: continuedWhether member <strong>of</strong>TU/staff assoc.How well informed aboutrights <strong>at</strong> workHow accur<strong>at</strong>e they thinkanswer wasMean MedianCiting correctanswer (£3.00)Within 10% <strong>of</strong>correct answer£ £ % %UnweightedbaseYes 4.08 4.00 * 7 122No 4.07 4.00 7 6 273Well informed 4.07 4.00 5 7 275Not well informed 4.06 4.00 7 4 120Right or close to right 4.01 4.00 6 7 193Just a guess 4.11 4.00 6 4 154Note: Ten per cent limits defined as £2.70 to £3.30 for 16 and 17 year olds.Source: IES/BMRB, 2005Table 3.8 shows th<strong>at</strong> respondents who thought 16 and 17 year olds werecovered by the NMW and thought the NMW varied by age group, cited £4.07as the average (mean) level <strong>of</strong> the NMW for this group, over £1 more thanthe actual r<strong>at</strong>e <strong>of</strong> £3.00. The median cited by respondents was slightly less,<strong>at</strong> £4.00. Men were more likely than women to cite a higher average (mean)r<strong>at</strong>e (and therefore be further from the actual r<strong>at</strong>e), as were those workingfull-time compared with part-time workers, and those with an HR departmentcompared to those without.Only six per cent <strong>of</strong> respondents cited the correct answer, while another sixper cent cited an answer within ten per cent <strong>of</strong> the correct answer, with theremaining respondents citing an answer th<strong>at</strong> was even less accur<strong>at</strong>e. Whilethere were vari<strong>at</strong>ions between groups in the proportion citing the correctanswer, being within ten per cent <strong>of</strong> the correct answer, or being even lessaccur<strong>at</strong>e, none was st<strong>at</strong>istically significant.These results show th<strong>at</strong> those for whom the NMW may be more relevant, asthey may be lower paid – women, part-timers and those without an HRdepartment – are likely to be more accur<strong>at</strong>e about the r<strong>at</strong>e for this agegroup.Estim<strong>at</strong>es <strong>of</strong> the r<strong>at</strong>e for 18 to 21 year oldsTable 3.9 now goes on to examine how much respondents 22 thought th<strong>at</strong> theNMW was for this age group.22 Respondents who thought 18 to 21 year olds were covered by the NMW andthought the NMW varied by age group.69
Table 3.9: How much is the NMW for 18 to 21 year olds?MeanMedianCiting correctanswer (£4.10)Within 10% <strong>of</strong>correct answer£ £ % %UnweightedbaseAll respondents 4.61 4.65 4 38 613Age 16-21 4.59 4.50 * 45 3422-34 4.64 4.75 6 35 16935-44 4.67 4.80 * 34 16845-54 4.56 4.50 * 49 14855-64 4.52 4.75 * 31 94Gender Male 4.68 4.80 4 31 268Female 4.54 4.50 4 46 345Earnings Under £5,000 4.44 4.35 * 57 50£5,000 to £9,999 4.57 4.50 * 44 79£10,000 to £14,999 4.62 4.54 4 45 129£15,000 to £19,999 4.66 4.75 6 33 91£20,000 to £39,999 4.64 4.75 4 30 166£40,000 + 4.79 4.97 * 28 43Hours worked Full-time 4.66 4.75 4 35 458Part-time 4.47 4.50 4 51 153Type <strong>of</strong> organis<strong>at</strong>ion Public sector 4.65 4.75 3 37 194Priv<strong>at</strong>e sector 4.59 4.57 4 40 391Whether hasHR/personnel deptWhether experiencedproblemsManagerial/supervisorydutiesNumber <strong>of</strong> employees inworkplaceWhether member <strong>of</strong>TU/staff assoc.How well informed aboutrights <strong>at</strong> workHow accur<strong>at</strong>e they thinkanswer wasYes 4.64 4.75 4 37 436No 4.49 4.50 6 44 149Yes 4.66 4.75 5 33 252No 4.57 4.50 4 43 361Yes 4.64 4.75 5 32 234No 4.59 4.55 4 43 3791 to 9 4.51 4.55 9 34 10210 to 24 4.59 4.50 5 40 10225 to 99 4.61 4.71 * 38 145100 to 499 4.65 4.70 * 42 137500+ 4.66 4.75 * 38 117Yes 4.66 4.75 * 35 189No 4.59 4.55 5 40 421Well informed 4.60 4.60 4 41 413Not well informed 4.62 4.70 4 33 198Right or close to right 4.58 4.65 6 38 312Just a guess 4.65 4.60 * 40 225Note: Ten per cent limits defined as £3.69 to £4.51 for 18 to 21 year olds.Source: IES/BMRB, 200570
Table 3.9 shows th<strong>at</strong> respondents who thought 18 to 21 year olds werecovered by the NMW and thought the NMW varied by age group, cited £4.61as the average (mean) level <strong>of</strong> the NMW for this group, considerably higherthan the actual r<strong>at</strong>e <strong>of</strong> £4.10. The median cited by respondents was slightlyhigher, <strong>at</strong> £4.65. As with the r<strong>at</strong>e for 16 and 17 year olds discussed above,men were more likely than women to cite a higher average (mean) r<strong>at</strong>e (andtherefore be further from the actual r<strong>at</strong>e), as were those working full-time,compared with part-time workers, and those with an HR departmentcompared to those without. Those who had experienced a problem were alsomore likely than those who had not to cite a higher average r<strong>at</strong>e for thisgroup.Only four per cent <strong>of</strong> respondents cited the correct answer; however, incontrast to the position for 16 and 17 year olds, over one-third <strong>of</strong>respondents (38 per cent) cited an answer within ten per cent <strong>of</strong> the correctanswer, with the remaining respondents citing an answer th<strong>at</strong> was even lessaccur<strong>at</strong>e. Women were more likely than men to give the correct answer or bewithin ten per cent <strong>of</strong> the correct answer, as were part-time workerscompared to full-timers, those who had not experienced a problem to do withtheir rights <strong>at</strong> work compared to those who had, and those withoutmanagerial/supervisory duties compared to those who had.These results show th<strong>at</strong> those for whom the NMW may be more relevant asthey may be lower paid; women, part-timers, and those without an HRdepartment were likely to be more accur<strong>at</strong>e about the r<strong>at</strong>e for this age group.Those who had experienced a problem are less likely to be accur<strong>at</strong>e, as were,perhaps surprisingly, those with managerial/supervisory duties.Estim<strong>at</strong>es <strong>of</strong> the r<strong>at</strong>e for 22 to 64 year oldsTable 3.10 examines the results for the core age group entitled to the NMW,and explores how much respondents 23 thought th<strong>at</strong> the NMW was for 22 to64 year olds.Table 3.10: How much is the NMW for 22 to 64 year olds?Mean MedianCiting correctanswer (£4.85)Within 10% <strong>of</strong>correct answerUnweighted£ £ % %baseAll respondents 5.08 5.00 11 56 607Age 16-21 5.16 5.00 11 45 3222-34 5.06 5.00 12 57 16535-44 5.11 5.00 12 50 16745-54 5.09 5.00 8 59 14855-64 5.02 5.00 10 66 9523 Respondents who thought 22 to 64 year olds were covered by the NMW andthought the NMW varied by age group.71
Table 3.10: continuedMeanMedianCiting correctanswer (£4.85)Within 10% <strong>of</strong>correct answer£ £ % %UnweightedbaseGender Male 5.12 5.00 10 50 264Female 5.04 5.00 11 62 343Earnings Under £5,000 5.03 5.00 * 67 49£5,000 to £9,999 5.11 4.91 20 54 81£10,000 to £14,999 5.10 5.00 11 54 127£15,000 to £19,999 5.15 5.00 14 54 86£20,000 to £39,999 5.08 5.00 7 54 166£40,000 + 5.13 5.00 * 51 43Hours worked Full-time 5.12 5.00 10 54 452Part-time 4.97 4.94 12 63 153Type <strong>of</strong> organis<strong>at</strong>ion Public sector 5.09 5.00 6 58 193Priv<strong>at</strong>e sector 5.08 5.00 13 54 387Whether hasHR/personnel deptWhether experiencedproblemsManagerial/supervisorydutiesNumber <strong>of</strong> employees inworkplaceWhether member <strong>of</strong>TU/staff assoc.How well informed aboutrights <strong>at</strong> workHow accur<strong>at</strong>e they thinkanswer wasYes 5.06 5.00 10 56 434No 5.07 5.00 14 54 145Yes 5.16 5.00 12 53 249No 5.03 5.00 10 58 358Yes 5.09 5.00 10 53 233No 5.08 5.00 11 58 3741 to 9 5.01 4.90 11 60 10310 to 24 5.07 4.90 13 51 10025 to 99 5.12 5.00 11 53 147100 to 499 5.09 5.00 8 59 130500+ 5.10 5.00 12 57 116Yes 5.10 5.00 6 57 184No 5.08 5.00 12 55 420Well informed 5.05 5.00 10 56 408Not well informed 5.16 5.00 13 55 197Right or close to right 5.03 5.00 15 58 312Just a guess 5.16 5.00 4 52 219Note: Ten per cent limits defined as £4.37 to £5.34 for 22 to 64 year olds.Source: IES/BMRB, 2005Table 3.10 shows th<strong>at</strong> the average (mean) level <strong>of</strong> the NMW for this groupgiven by respondents was £5.08, somewh<strong>at</strong> higher than the actual r<strong>at</strong>e <strong>of</strong>£4.85. The median cited by respondents was slightly lower, <strong>at</strong> £5.00. Fulltimeworkers were more likely than part-timers to cite a higher average(mean) r<strong>at</strong>e (and therefore be further from the actual r<strong>at</strong>e), as were those72
who had experienced a problem compared to those who had not, those wh<strong>of</strong>elt th<strong>at</strong> they were not well informed about their rights <strong>at</strong> work compared tothose who felt well informed, and those who guessed their answer comparedto those who thought th<strong>at</strong> their answer was right or close to right.For this age group, accuracy was much higher than it was for the younger agegroups, with more than one in ten (11 per cent) <strong>of</strong> respondents citing thecorrect answer, and over half (56 per cent) citing an answer within ten per cent<strong>of</strong> the correct answer. Women were more likely than men to cite the correctanswer or be within ten per cent <strong>of</strong> the correct answer, as were part-timeworkers compared to full-timers, and those who thought th<strong>at</strong> their answer wasright, or close to right, compared to those who guessed their answer.Overall, non-union members were more likely to be either correct or within tenper cent than union members, perhaps reflecting the fact th<strong>at</strong> union memberswere likely to think some rights were more generous than they actually were.Public-sector workers were less likely to be correct and more likely to be withinten per cent <strong>of</strong> the correct answer than priv<strong>at</strong>e-sector workers.These results show th<strong>at</strong>, again, women, part-time workers, those who feltwell informed about their rights, and those who thought th<strong>at</strong> their answerwas right were more accur<strong>at</strong>e about the adult r<strong>at</strong>e <strong>of</strong> the NMW.Analysis was also conducted on the average (mean) cited by respondents forthe r<strong>at</strong>e for 22 to 64 year olds, to see if the timing <strong>of</strong> the interview wasassoci<strong>at</strong>ed with the level <strong>of</strong> the NMW cited. This was done to see if knowledgeabout the r<strong>at</strong>e increased over the time-span in which the survey wasconducted, owing to publicity (which began in mid-September) about the newNMW r<strong>at</strong>es to be introduced on 1 October 2005.Figure 3.6: Estim<strong>at</strong>e <strong>of</strong> the average (mean) NMW r<strong>at</strong>e for 22 to 64year olds, by d<strong>at</strong>e <strong>of</strong> interview£5.30£5.20£5.10£5.00£4.90£4.80£4.70£4.60£4.50L<strong>at</strong>e June Early July L<strong>at</strong>e July Early August L<strong>at</strong>e August EarlySeptemberd<strong>at</strong>e <strong>of</strong> interviewpublicityL<strong>at</strong>eSeptemberEarly OctoberNote: Base is respondents who thought 22 to 64 year olds were covered by the NMW and thought the NMW varied byage group. There were 57 weighted respondents interviewed in l<strong>at</strong>e September (16 September onwards) afterthe publicity was introduced. There were only two weighted respondents who were interviewed <strong>at</strong> the beginning<strong>of</strong> October 2005, after the new r<strong>at</strong>es had been introduced.Source: IES/BMRB, 200573
Figure 3.6 shows th<strong>at</strong> responses varied over time, with estim<strong>at</strong>es rising inl<strong>at</strong>e July and again in early September, before dropping to a more accur<strong>at</strong>eestim<strong>at</strong>e <strong>of</strong> the 2004 r<strong>at</strong>e in l<strong>at</strong>e September and early October after publicity<strong>of</strong> the new r<strong>at</strong>es had begun. This would suggest th<strong>at</strong> publicity <strong>of</strong> the newr<strong>at</strong>es did not lead to respondents interviewed l<strong>at</strong>er in the fieldwork periodciting the higher 2005 r<strong>at</strong>es, r<strong>at</strong>her than the 2004 r<strong>at</strong>es (if they had cited thehigher 2005 r<strong>at</strong>es the r<strong>at</strong>e would have risen in l<strong>at</strong>e September and earlyOctober). However, publicity <strong>of</strong> the new r<strong>at</strong>es may also have led to peoplebecoming more aware <strong>of</strong> the old (existing) r<strong>at</strong>es.Estim<strong>at</strong>es <strong>of</strong> the r<strong>at</strong>e for those aged 65 and overTable 3.11 completes this analysis <strong>of</strong> NMW r<strong>at</strong>es by examining the findingson how much respondents 24 thought th<strong>at</strong> the NMW was for people aged 65and over.Table 3.11: How much is the NMW for those aged 65 and over?Mean MedianCiting correctanswer (£4.85)Within 10% <strong>of</strong>correct answer£ £ % %All respondents 5.03 5.00 13 56 342Age 16-21 5.03 4.98 12 35 2222-34 4.95 4.90 13 61 10735-44 5.22 5.00 13 49 9445-54 4.97 4.98 12 60 6955-64 4.99 5.00 14 62 50Gender Male 5.10 5.00 13 48 147Female 4.98 5.00 13 62 195Earnings Under £5,000 5.04 5.00 7 63 25£5,000 to £9,999 4.96 4.86 16 59 50£10,000 to £14,999 5.02 5.00 12 52 71£15,000 to £19,999 5.01 4.90 16 61 50£20,000 to £39,999 5.08 5.00 9 49 85£40,000 + 5.33 5.00 14 43 26Hours worked Full-time 5.07 5.00 12 55 258Part-time 4.94 4.95 15 58 83Type <strong>of</strong> organis<strong>at</strong>ion Public sector 4.99 5.00 8 56 108Priv<strong>at</strong>e sector 5.06 5.00 15 54 221Yes 5.06 5.00 12 54 250Whether hasHR/personnel deptUnweightedbaseNo 4.98 4.90 18 54 7724 Respondents who thought those aged 65 and over were covered by the NMW andthought the NMW varied by age group.74
Table 3.11: continuedWhether experiencedproblemsManagerial/supervisorydutiesNumber <strong>of</strong> employees inworkplaceWhether member <strong>of</strong>TU/staff assoc.How well informedabout rights <strong>at</strong> workHow accur<strong>at</strong>e they thinkanswer wasMeanMedianCiting correctanswer (£4.85)Within 10% <strong>of</strong>correct answer£ £ % %UnweightedbaseYes 5.05 4.98 15 51 134No 5.02 5.00 11 59 208Yes 5.06 5.00 15 50 133No 5.02 5.00 11 59 2091 to 9 4.84 4.85 14 63 5310 to 24 4.99 4.90 15 49 5425 to 99 5.03 5.00 12 54 96100 to 499 5.16 5.00 11 55 75500+ 5.08 5.00 15 57 57Yes 5.05 5.00 12 58 95No 5.03 5.00 13 55 242Well informed 5.00 5.00 13 56 234Not well informed 5.10 5.00 13 55 108Right or close to right 5.05 5.00 18 53 172Just a guess 4.99 5.00 5 58 122Note: Ten per cent limits defined as £4.37 to £5.34 for those aged 65 and over.Source: IES/BMRB, 2005Table 3.11 shows th<strong>at</strong> respondents who thought those aged 65 and overwere covered by the NMW and thought the NMW varied by age group, cited£5.03 as the average (mean) level <strong>of</strong> the NMW for this group, somewh<strong>at</strong>higher than the actual r<strong>at</strong>e <strong>of</strong> £4.85. The median cited by respondents wasslightly lower, <strong>at</strong> £5.00. While there were vari<strong>at</strong>ions between groups in theaverage (mean) level <strong>of</strong> the NMW cited for this group, none was st<strong>at</strong>isticallysignificant.For those aged 65 and over, accuracy was <strong>at</strong> a similar level to th<strong>at</strong> for ther<strong>at</strong>e for 22 to 64 year olds, with more than one in ten (13 per cent) <strong>of</strong>respondents citing the correct answer, and over half (56 per cent) citing ananswer within ten per cent <strong>of</strong> the correct answer, with the remainingrespondents citing an answer th<strong>at</strong> was less accur<strong>at</strong>e. 25 Women were morelikely than men to cite the correct answer or be within ten per cent <strong>of</strong> thecorrect answer, as were those who thought th<strong>at</strong> their answer was right, orclose to right, compared to those who guessed their answer.25 Although the base for this question was smaller, as fewer respondents boththought th<strong>at</strong> this age group was covered by the NMW and thought th<strong>at</strong> the NMWvaried by age group.75
3.4 Children and dependantsAs set out in Chapter 2 (see Section 2.4.4), the right to time <strong>of</strong>f fordependants is contained in section 57A <strong>of</strong> the <strong>Employment</strong> <strong>Rights</strong> Act 1996,as amended by the <strong>Employment</strong> Rel<strong>at</strong>ions Act 1999. The right does notinclude an entitlement to pay. The right to m<strong>at</strong>ernity leave is long establishedand has recently been improved through the <strong>Employment</strong> <strong>Rights</strong> Act 1996, asamended by the <strong>Employment</strong> Rel<strong>at</strong>ions Act 1999 and the <strong>Employment</strong> Act2002. All pregnant employees are entitled to <strong>at</strong> least 26 weeks’ ordinarym<strong>at</strong>ernity leave. <strong>Employees</strong> who have completed 26 weeks’ continuousemployment by the beginning <strong>of</strong> the 14th week before the expected week <strong>of</strong>childbirth have been entitled to 26 weeks’ additional m<strong>at</strong>ernity leave since 6April 2003.<strong>Rights</strong> in the area <strong>of</strong> children and dependants were examined by whetherrespondents had a dependent child, had a child under six years, wereplanning to have a child in the next year, as well as by how well informed arespondent was about their rights, by whether they were a member <strong>of</strong> <strong>at</strong>rade union/staff associ<strong>at</strong>ion, and for time <strong>of</strong>f for dependants, whether theygave support to family/friends.3.4.1 Whether respondents think employees are entitled to be paid ifthey have to take time <strong>of</strong>f to look after a child/dependant in anemergencyRespondents were asked:‘Firstly, if a person has to take time <strong>of</strong>f work to look after their child orother dependant in an emergency, do you think they are legally entitled tobe paid for this time <strong>of</strong>f?’.Table 3.12: Time <strong>of</strong>f for dependants (in an emergency)<strong>Employees</strong> are entitled tobe paid<strong>Employees</strong> are not entitledto be paidAll respondentsDependent childrenChildren aged 0-5Planning to have achild in next yearSupport givento family/friendsYes No Yes No Yes No Yes No YesTrade union/staffassoc. memberNoHow well informedabout rightsWellinformedNot wellinformed% % % % % % % % % % % % %31 31 31 30 31 39 30 34 30 34 29 33 2862 63 61 61 62 53 63 63 62 56 64 60 65Don’t know 7 7 8 9 7 9 7 3 8 10 6 7 7Unweighted base 1,038 426 612 188 850 68 948 164 874 329 701 680 353Source: IES/BMRB, 200576
Table 3.12 shows th<strong>at</strong> 62 per cent <strong>of</strong> respondents knew th<strong>at</strong> employees arenot entitled to be paid for taking time <strong>of</strong>f for a dependant in an emergency.However, <strong>of</strong> those respondents who gave the correct answer (ie knewemployees were not entitled to be paid), only 19 per cent were sure abouttheir answer (saying ‘I know it’s right’).Those who gave support to family/friends were more likely than those whodid not to know th<strong>at</strong> employees are not entitled to be paid for this right, whileinterestingly, trade union/staff associ<strong>at</strong>ion members were actually less likelythan non-union members to know th<strong>at</strong> employees were not entitled to bepaid (thinking the right was more generous than it is or saying th<strong>at</strong> they didnot know).3.4.2 Wh<strong>at</strong> rights respondents think a mother has if she returns to workstraight after her paid m<strong>at</strong>ernity leave endsRespondents were then asked:‘A woman has been employed by the same employer for more than sixmonths. She is pregnant and is legally entitled to six months’ paidm<strong>at</strong>ernity leave. If she returns to work straight after her paid m<strong>at</strong>ernityleave ends and she wishes to return to her previous job, wh<strong>at</strong> do you thinkher rights are?’.Figure 3.7 shows the results <strong>of</strong> this question.Figure 3.7: Wh<strong>at</strong> rights a mother has after ordinary m<strong>at</strong>ernity leave70per cent6050403020100To return to exactlythe same jobTo return to anequivalent job with thesame payTo return to a job <strong>at</strong>the same organis<strong>at</strong>ion,but not necessarily anequivalent job with thesame payHas no legalentitlement to return toworkDon’t knowNote: Base is 1,038. Darker shade in chart indic<strong>at</strong>es incorrect answer.Source: IES/BMRB, 2005Figure 3.7 shows th<strong>at</strong> almost two-thirds <strong>of</strong> respondents (63 per cent) knewth<strong>at</strong> a mother would be entitled to return to exactly the same job afterordinary m<strong>at</strong>ernity leave. Twenty-seven per cent <strong>of</strong> respondents wereincorrect in thinking she only had the right to return to an equivalent job withthe same r<strong>at</strong>e <strong>of</strong> pay, six per cent incorrectly thought th<strong>at</strong> she only had theright to return to a job <strong>at</strong> the same organis<strong>at</strong>ion, but not necessarily anequivalent job with the same pay, while two per cent incorrectly thought th<strong>at</strong>77
she had no legal entitlement to return to work, and two per cent did notknow wh<strong>at</strong> her rights were. Of those respondents who gave the correctanswer, just over one-third (37 per cent) were sure about their answer(saying ‘I know it’s right’).Table 3.13 examines these results by whether respondents had familyresponsibilities, were trade union/staff associ<strong>at</strong>ion members, and by how wellinformed they were about their rights <strong>at</strong> work.Those with dependent children were less likely than those without to knowth<strong>at</strong> a mother is entitled to return to exactly the same job, while those withchildren under six years were more likely to know th<strong>at</strong> a mother is entitled toreturn to exactly the same job.Table 3.13: Wh<strong>at</strong> rights a mother has after ordinary m<strong>at</strong>ernity leave,by respondents’ characteristicsAll respondentsDependent childrenChildren aged 0-5Planning to have achild in next yearTrade union/staffassoc. memberYes No Yes No Yes No Yes NoHow well informedabout rightsWellinformedNot wellinformed% % % % % % % % % % %To return to exactly the same job 63 62 63 70 61 74 62 61 64 61 67To return to an equivalent job withthe same payTo return to a job <strong>at</strong> the sameorganis<strong>at</strong>ion, but not necessarily anequivalent job with the same payShe has no legal entitlement toreturn to work27 29 25 26 27 23 27 30 25 30 216 3 9 * 8 * 7 5 7 6 82 3 * - 2 - 2 2 1 1 2Don’t know 2 3 2 2 2 - 3 2 2 2 2Unweighted base 1,038 426 612 188 850 68 948 329 701 680 353Source: IES/BMRB, 20053.4.3 Wh<strong>at</strong> rights respondents think a mother has if she returns to workafter taking her full entitlement to paid and unpaid m<strong>at</strong>ernityleaveAn employee who returns to work after additional m<strong>at</strong>ernity leave is entitledto return to the same job on the same terms and conditions as if she had notbeen absent, unless a redundancy situ<strong>at</strong>ion has arisen. If, however, there issome reason other than redundancy why it is not reasonably practicable forher employer to take her back in her original job, she is entitled to be <strong>of</strong>feredsuitable altern<strong>at</strong>ive work.78
Respondents were asked about a mother’s rights after additional m<strong>at</strong>ernityleave:‘As well as six months’ paid m<strong>at</strong>ernity leave, the woman is also legallyentitled to take up to six months’ unpaid m<strong>at</strong>ernity leave. If she takes herfull legal entitlement to m<strong>at</strong>ernity leave, both paid and unpaid, and thenwishes to return to her previous job, wh<strong>at</strong> do you think her rights are?’.Figure 3.8 shows the results <strong>of</strong> this question.Figure 3.8: Wh<strong>at</strong> rights a mother has after additional m<strong>at</strong>ernity leaveper cent4035302520151050To return to exactlythe same jobTo return to anequivalent job with thesame payTo return to a job <strong>at</strong>the same organis<strong>at</strong>ion,but not necessarily anequivalent job with thesame payHas no legalentitlement to return toworkDon’t knowNote: Base is 1,038. Darker shade in chart indic<strong>at</strong>es incorrect answer.Source: IES/BMRB, 2005Figure 3.8 shows th<strong>at</strong> 73 per cent <strong>of</strong> respondents thought th<strong>at</strong> a mother wasentitled to return to exactly the same job or to an equivalent job with thesame r<strong>at</strong>e <strong>of</strong> pay. Just over one-third <strong>of</strong> respondents (36 per cent) knew th<strong>at</strong>a mother has the right to return to an equivalent job with the same r<strong>at</strong>e <strong>of</strong>pay. Just over one-third <strong>of</strong> respondents (37 per cent) knew th<strong>at</strong> she wasentitled to return to exactly the same job. Eighteen per cent incorrectlythought th<strong>at</strong> she is only entitled to return to a job <strong>at</strong> the same organis<strong>at</strong>ion,but not necessarily an equivalent job with the same pay, and four per centincorrectly though th<strong>at</strong> she has no legal right to return (five per cent did notknow wh<strong>at</strong> her rights were). Of those respondents who knew employees hadthe right to return to an equivalent job with the same r<strong>at</strong>e <strong>of</strong> pay, only 13 percent were sure about their answer (saying ‘I know it’s right’). Of thoserespondents who knew employees had the right to exactly the same job, 30per cent were sure about their answer (saying ‘I know it’s right’).Table 3.14 examines these results by whether respondents had familyresponsibilities, were trade union/staff associ<strong>at</strong>ion members, and by how wellinformed they were about their rights <strong>at</strong> work.79
Table 3.14: Wh<strong>at</strong> rights a mother has after additional m<strong>at</strong>ernityleave, by respondents’ characteristicsAll respondentsDependent childrenChildren aged 0-5Planning to have achild in next yearTrade union/staffassoc. memberYes No Yes No Yes No Yes NoHow well informedabout rightsWellinformedNot wellinformed% % % % % % % % % % %To return to exactly the same job 37 41 33 43 35 41 36 37 36 39 33To return to an equivalent job withthe same payTo return to a job <strong>at</strong> the sameorganis<strong>at</strong>ion, but not necessarily anequivalent job with the same payShe has no legal entitlement toreturn to work36 39 34 43 35 52 35 44 34 39 3218 12 22 11 19 6 19 12 21 15 224 2 5 - 5 - 4 2 4 3 6Don’t know 5 5 6 3 6 * 6 5 5 5 7Unweighted base 1,038 426 612 188 850 68 948 329 701 680 353Source: IES/BMRB, 2005Table 3.14 shows th<strong>at</strong> respondents with a dependent child were more likelyto get the answer right, as were those with a child under six compared tothose who do not have a child under six, those planning to have a child in thenext year compared to those not planning to have a child, trade union/staffassoci<strong>at</strong>ion members compared to non-union members, and those who feelwell informed about their rights compared to those who feel not wellinformed. It is reassuring th<strong>at</strong> those with a family or planning a family aremore likely to answer this question correctly, and it might be anticip<strong>at</strong>ed th<strong>at</strong>trade union/staff associ<strong>at</strong>ion members and those who feel well informedabout their rights are more likely to get it right. However, even among thosewith families or planning them, the majority <strong>of</strong> respondents gave an incorrectanswer.3.5 Other key knowledge issuesThe point <strong>at</strong> which employees are legally entitled to some key rights, theright to be accompanied to a disciplinary or grievance hearing, and wh<strong>at</strong>employees have to do before making a claim to an employment tribunal,were examined by the standard set <strong>of</strong> personal or employment characteristics(the standard breaks), as well as by how well informed a respondent feltabout their rights, whether they were a member <strong>of</strong> a trade union/staffassoci<strong>at</strong>ion, and for the point <strong>at</strong> which rights came into force, how sure theywere <strong>of</strong> their answer to the question.80
3.5.1 At wh<strong>at</strong> point employees are legally entitled to rightsAll respondents were asked:‘I’m now going to read out some rights th<strong>at</strong> employees have <strong>at</strong> work. Foreach one, please tell me <strong>at</strong> wh<strong>at</strong> point in their employment you thinkemployees are legally entitled to these rights.‘The right to the N<strong>at</strong>ional Minimum Wage. At wh<strong>at</strong> point in theiremployment do you think employees are legally entitled to this right?‘The right to a contract setting out their main terms and conditions <strong>of</strong>employment. At wh<strong>at</strong> point in their employment you think employees arelegally entitled to this right?‘At wh<strong>at</strong> point in their employment you think employees are covered byanti-discrimin<strong>at</strong>ion laws?‘And <strong>at</strong> wh<strong>at</strong> point in their employment you think employees are coveredby unfair dismissal laws?’.For each right, respondents were asked to select an answer from thefollowing list:• from the first day <strong>of</strong> their employment• after they have been with an employer for one month• after they have been with an employer for two months• after they have been with an employer for three months• after they have been with an employer for six months• after they have been with an employer for one year• after they have been with an employer for two years.Table 3.15 shows th<strong>at</strong> over nine in ten respondents knew th<strong>at</strong> the right to theNMW covers employees from the first day <strong>of</strong> their employment. Around half(48 per cent) <strong>of</strong> those who got the answer correct were sure about theiranswer (saying ‘I know it’s right’). Again, over nine in ten respondents (93per cent) knew th<strong>at</strong> the right to be covered by anti-discrimin<strong>at</strong>ion laws coversemployees from the first day <strong>of</strong> their employment. Half <strong>of</strong> those who got theright answer were sure about their answer.Far fewer respondents were sure about the point <strong>at</strong> which the rights to acontract and to be covered by unfair dismissal laws come into force. Only sixper cent <strong>of</strong> respondents knew th<strong>at</strong> the right to be covered by unfair dismissallaws comes into force after they have been with their employer for one year.Of those who did give the correct answer, only around one in five (21 percent) were sure about their answer. Only two per cent <strong>of</strong> respondents knewth<strong>at</strong> the right to a contract comes into force after employees have been with81
their employer for two months. Around one-quarter (24 per cent) <strong>of</strong> thosewho got the answer right were sure about their answer.Table 3.15: The point <strong>at</strong> which employees are legally entitled to rightsThe right to the NMWThe right to a contractThe right to be covered byanti-discrimin<strong>at</strong>ion lawsThe right to be covered byunfair dismissal lawsFrom the first day <strong>of</strong> their employment 93 68 93 58After they have been with an employer for one month 3 12 1 8After they have been with an employer for two months - 2 * 1After they have been with an employer for three months 2 15 1 12After they have been with an employer for six months 2 4 ** 8After they have been with an employer for one year * * ** 6After they have been with an employer for two years * * * 3Don’t know 1 1 4 4Note: Unweighted base 1,038. Bold denotes the correct answer.Source: IES/BMRB, 2005Table 3.16 examines the proportion <strong>of</strong> those getting the correct answers bythe characteristics <strong>of</strong> respondents.Table 3.16: Proportion <strong>of</strong> respondents giving the right answer aboutthe point <strong>at</strong> which employees are legally entitled to rightsNMW:first dayAnti-discrimin<strong>at</strong>ion:first dayUnfair dismissal:one yearContract:two monthsUnweightedbase% % % %All respondents 93 93 6 2 1,038Age 16-24 88 90 4 3 11425-34 95 94 4 * 21535-44 91 94 9 2 28945-54 95 93 6 2 24955-64 93 92 6 * 170Gender Male 92 94 7 2 472Female 93 92 5 2 566Earnings Under £15,000 90 90 4 1 412£15,000 to £24,999 96 94 6 2 260£25,000 to £39,999 95 98 10 * 174£40,000 + 95 98 7 * 7982
Table 3.16: continuedNMW: Anti-discrimin<strong>at</strong>ion: Unfair dismissal: Contract:first day first dayone year two monthsUnweighted% % % % baseHours worked Full-time 93 93 6 2 781Part-time 91 92 4 * 250Type <strong>of</strong> organis<strong>at</strong>ion Public sector 95 96 7 * 336Priv<strong>at</strong>e sector 91 92 6 2 662Whether has Yes 94 94 6 1 735HR/personnel deptNo 91 91 6 4 259Whether experienced Yes 91 92 6 2 416problemsNo 94 94 6 1 622Managerial/supervisory Yes 94 95 10 2 387dutiesNo 93 92 4 2 651Number <strong>of</strong> employees 1 to 9 89 93 6 * 159in workplace10 to 24 91 89 4 4 168How well informedabout rights <strong>at</strong> workMember <strong>of</strong> tradeunion/staff associ<strong>at</strong>ion24 to 99 96 92 8 3 250100 to 499 93 96 6 * 228500+ 93 95 5 * 208Well informed 94 95 7 2 680Not well informed 90 90 4 * 353Yes 96 93 7 * 329No 92 94 6 2 701How sure about answer I know it’s right 99 100 5 1 254I think it’s right 92 96 7 2 577I’m not sure – justa guess74 84 5 3 175Source: IES/BMRB, 2005Table 3.16 shows the vari<strong>at</strong>ions between groups in the proportions citing thecorrect answer to the point <strong>at</strong> which the NMW comes into force; however,none <strong>of</strong> these differences were st<strong>at</strong>istically significant. This was also the casefor the point <strong>at</strong> which the right to anti-discrimin<strong>at</strong>ion legisl<strong>at</strong>ion, and the rightto a contract, come into force.There were significant vari<strong>at</strong>ions between groups in the point <strong>at</strong> whichrespondents thought th<strong>at</strong> the right to be covered by unfair dismissal comesinto force. Those aged 35 to 44 were most likely to get the answer right inrel<strong>at</strong>ion to unfair dismissal compared to other age groups. Those withmanagerial/supervisory responsibilities were also more likely to get theanswer right than those without such responsibilities, perhaps because theyneeded to be aware <strong>of</strong> this right as part <strong>of</strong> their management responsibilities,and those who thought th<strong>at</strong> their answer was right were more likely than83
those who said th<strong>at</strong> they knew it was right, or th<strong>at</strong> it was just a guess, to getthe answer correct.3.5.2 Right to be accompanied<strong>Employees</strong> have a right in the case <strong>of</strong> disciplinary or grievance hearings withthe employer to be accompanied by a work-m<strong>at</strong>e or trade union <strong>of</strong>ficial. Theright to be accompanied in disciplinary and grievance hearings wasintroduced in the <strong>Employment</strong> Rel<strong>at</strong>ions Act 1999 and took effect on 4September 2000. The <strong>Employment</strong> Rel<strong>at</strong>ions Act 2004 clarified the role <strong>of</strong>such companions, making it clear th<strong>at</strong> they can take on a represent<strong>at</strong>ive roleif this is the employee’s wish.All respondents were asked:‘Imagine you had a meeting with your employer about a complaint you hadagainst them or a disciplinary m<strong>at</strong>ter they had raised about you. Do youthink you would be legally entitled to take anyone to the meeting withyou?’.Respondents who thought th<strong>at</strong> they would be entitled to take someone withthem were then asked:‘Which <strong>of</strong> the following do you think you would be able to take to themeeting with you? A work colleague? A solicitor? A friend or rel<strong>at</strong>ive whodoes not work <strong>at</strong> your organis<strong>at</strong>ion? A trade union <strong>of</strong>ficer?’.Figure 3.9 shows the results <strong>of</strong> these two questions.Figure 3.9: Whether respondents have the right to be accompanied todisciplinary or grievance hearings, and who canaccompany employeesper cent1009080706050403020100Take anyone withyou? (1,038)A work colleague(975)A solicitor (975)A friend or rel<strong>at</strong>ivewho does not workwith you (975)A TU <strong>of</strong>ficer (975)Yes No Don’t knowSource: IES/BMRB, 2005Figure 3.9 shows th<strong>at</strong> over nine out <strong>of</strong> ten respondents (93 per cent) werecorrect in thinking th<strong>at</strong> employees have the right to be accompanied todisciplinary or grievance hearings. Whether respondents thought th<strong>at</strong> they84
had the right to be accompanied was examined by the standard set <strong>of</strong>personal and employment characteristics (the standard breaks) and bywhether they were a trade union/staff associ<strong>at</strong>ion member, and by how wellinformed they felt about their rights <strong>at</strong> work. Those with an HR departmentwere more likely than those who did not have one to know th<strong>at</strong> employeeshave the right to be accompanied: 95 per cent compared to 90 per cent.Those who worked for large employers were more likely to be aware th<strong>at</strong>employees have the right to be accompanied: 96 per cent <strong>of</strong> respondents inworkplaces with 500 or more employees and 96 per cent <strong>of</strong> respondents inworkplaces with 100 to 499 employees knew about this right, compared to 94per cent <strong>of</strong> respondents in workplaces with 25 to 99 employees, 90 per cent<strong>of</strong> respondents in workplaces <strong>of</strong> one to nine employees, and 89 per cent <strong>of</strong>respondents in workplaces with ten to 24 employees.When respondents who thought th<strong>at</strong> they would be entitled to take someonewith them were asked who they could take with them, 96 per cent correctlyidentified th<strong>at</strong> employees could take a trade union <strong>of</strong>ficer to such hearings,and 82 per cent correctly said th<strong>at</strong> employees could take a work colleague.However, over two-thirds <strong>of</strong> respondents (68 per cent) incorrectly thoughtemployees could take a solicitor, while just over one-third (37 per cent)incorrectly thought employees could take a friend or rel<strong>at</strong>ive who did notwork with them.Table 3.17 examines only those who got exactly the right answer: th<strong>at</strong> is,knew th<strong>at</strong> they could only take a trade union <strong>of</strong>ficer and a work colleaguewith them.Table 3.17: Proportion <strong>of</strong> respondents getting the right answer aboutwho can accompany employees to disciplinary orgrievance hearings% who knew employeescan only take a TU <strong>of</strong>ficerand work colleagueUnweightedbaseAll respondents 18 1,038Age 16-24 8 11425-34 18 21535-44 19 28945-54 23 24955-64 21 170Gender Male 19 472Female 18 566Earnings Under £15,000 13 412£15,000 to £24,999 23 260£25,000 to £39,999 20 174£40,000 + 26 79Hours worked Full-time 20 781Part-time 12 25085
Table 3.17: continued% who knew employeescan only take a TU <strong>of</strong>ficerand work colleagueUnweightedbaseType <strong>of</strong> organis<strong>at</strong>ion Public sector 11 336Priv<strong>at</strong>e sector 21 662Whether has HR/personnel dept Yes 19 735No 16 259Whether experienced problems Yes 18 416No 18 622Managerial/supervisory duties Yes 20 387No 17 651Number <strong>of</strong> employees in workplace 1 to 9 12 15910 to 24 18 16824 to 99 22 250100 to 499 21 228500+ 15 208How well informed about rights <strong>at</strong> Well informed 18 680workNot well informed 19 353Member <strong>of</strong> trade union/staff Yes 18 329associ<strong>at</strong>ionNo 18 701Source: IES/BMRB, 2005Table 3.17 shows th<strong>at</strong> only 18 per cent got the answer exactly right andknew employees were only entitled to take a trade union <strong>of</strong>ficer and a workcolleague with them. There was significant vari<strong>at</strong>ion by age group in theproportion giving a correct answer, with those aged 45 to 54 most likely toget the answer right. Those earning £40,000 per year or more were morelikely than those earning less to get the answer right. Full-time workers weremore likely than part-time workers to get the answer right, and workers inthe priv<strong>at</strong>e sector were more likely to get the answer right than public-sectorworkers.3.5.3 Making a claim to an employment tribunalThe <strong>Employment</strong> Act 2002 (Dispute Resolution) Regul<strong>at</strong>ions came into forceon 1 October 2004, requiring th<strong>at</strong> employers and employees follow st<strong>at</strong>utoryminimum dispute resolution procedures in the event <strong>of</strong> an employmentdispute. <strong>Employees</strong> are now required to put their complaint in writing to theiremployer before submitting an employment tribunal applic<strong>at</strong>ion.All respondents were asked:‘<strong>Employees</strong> who believe th<strong>at</strong> their employer has tre<strong>at</strong>ed them unfairly canmake a claim to an employment tribunal, which is a special type <strong>of</strong> court86
th<strong>at</strong> deals with employment disputes. Which, if any, <strong>of</strong> the following do youthink you have to do before you can apply to an employment tribunal?’.Figure 3.10: Wh<strong>at</strong> employees have to do before making a claim to anemployment tribunalper cent1009080706050403020100Put your complaint inwritingInform Acas Appoint a solicitor None <strong>of</strong> these Don’t knowNote: Darker shade in chart indic<strong>at</strong>es incorrect answer.Source: IES/BMRB, 2005Figure 3.10 shows th<strong>at</strong> 87 per cent <strong>of</strong> respondents thought th<strong>at</strong> employeeshad to put their complaint in writing before making a claim to an employmenttribunal. When asked if employees had to inform Acas before making a claim,over one-third <strong>of</strong> respondents (38 per cent) incorrectly thought th<strong>at</strong> they did.When asked if employees had to appoint a solicitor, 12 per cent incorrectlythought th<strong>at</strong> this was a requirement. Only three per cent <strong>of</strong> respondentsincorrectly thought when asked th<strong>at</strong> employees did not have to take any <strong>of</strong>these actions before making a claim to an employment tribunal. Three percent <strong>of</strong> respondents said th<strong>at</strong> they did not know wh<strong>at</strong> an employee had to dobefore making a claim to an employment tribunal.Table 3.18 examines those respondents who got the correct answer: th<strong>at</strong> isto say, knew th<strong>at</strong> employees only had to put their complaint in writing. Itshows th<strong>at</strong>, in all, just over half <strong>of</strong> respondents (52 per cent) got the answerto this question exactly right. Of those who gave the correct answer, twothirds(67 per cent) were sure about their answer. Those who were sureabout their answer were more likely to know th<strong>at</strong> employees only had to putit in writing than those who only thought th<strong>at</strong> their answer was right, or saidit was just a guess. Those who felt well informed about their rights <strong>at</strong> workwere more likely than those who did not feel well informed to get the answerright, as were those in the public sector compared with priv<strong>at</strong>e-sectorworkers, and those with managerial/supervisory duties, compared to thosewithout such responsibilities.87
Table 3.18: Proportion <strong>of</strong> respondents getting the right answer aboutwh<strong>at</strong> employees have to do before making a claim to anemployment tribunal% <strong>of</strong> respondents who knewyou only had to put it in writingUnweightedbaseAll respondents 52 1,038Age 16-24 45 11425-34 46 21535-44 53 28945-54 57 24955-64 50 170Gender Male 49 472Female 53 566Earnings Under £15,000 47 412£15,000 to £24,999 50 260£25,000 to £39,999 51 174£40,000 + 63 79Hours worked Full-time 51 781Part-time 50 250Type <strong>of</strong> organis<strong>at</strong>ion Public sector 56 336Priv<strong>at</strong>e sector 48 662Whether has HR/personnel dept Yes 51 735No 48 259Whether experienced problems Yes 48 416No 53 622Managerial/supervisory duties Yes 55 387No 48 651Number <strong>of</strong> employees in workplace 1 to 9 56 15910 to 24 49 16824 to 99 48 250100 to 499 48 228500+ 56 208How well informed about rights <strong>at</strong> Well informed 54 680workNot well informed 45 353Member <strong>of</strong> trade union/staff Yes 52 329associ<strong>at</strong>ionNo 50 701How sure about answer I know it’s right 67 254I think it’s right 48 577I’m not sure – just a guess 44 175Source: IES/BMRB, 200588
3.6 Knowledge scoresPrevious sections <strong>of</strong> this chapter have focused on knowledge <strong>of</strong> specificemployment rights. In this section, an analysis <strong>of</strong> differences in knowledgeacross a range <strong>of</strong> rights is provided. A knowledge score was developed bygiving respondents one point for each answer they got exactly right for somekey knowledge questions th<strong>at</strong> were most universally relevant to respondents.These questions were:• How many hours is the working time limit?• Can employees opt out informally?• Can employees opt out in writing?• Can employers make opting out a condition <strong>of</strong> employment?• How many weeks is the minimum paid holiday entitlement?• Does this paid holiday entitlement include public holidays?• How many days <strong>of</strong>f are employees entitled to in a 14-day period?• How many hours do employees have to work before being entitled to a restbreak?• Are 14 and 15 year olds covered by the NMW?• Are 16 and 17 year olds covered by the NMW?• Are 18 to 21 year olds covered by the NMW?• Are 22 to 64 year olds covered by the NMW?• Are those aged 65 and over covered by the NMW?• At wh<strong>at</strong> point are employees legally covered by the NMW?• At wh<strong>at</strong> point are employees legally covered by the right to a contract?• At wh<strong>at</strong> point are employees legally covered by anti-discrimin<strong>at</strong>ion laws?• At wh<strong>at</strong> point are employees legally covered by unfair dismissal laws?• Who can employees take with them to a disciplinary or grievance hearing?• Wh<strong>at</strong> do employees have to do before making a claim to an employmenttribunal?Table 3.19 shows the mean knowledge score by key groups, as well as thosescoring seven or less, and those scoring 13 or more, out <strong>of</strong> a possible 19points. The cut-<strong>of</strong>f point <strong>of</strong> a score <strong>of</strong> seven points was chosen as thisaccounts for approxim<strong>at</strong>ely the lowest scoring ten per cent <strong>of</strong> respondents.89
Those scoring 13 or higher were also highlighted as, likewise, they accountedfor approxim<strong>at</strong>ely the top scoring ten per cent <strong>of</strong> respondents.Table 3.19: Results <strong>of</strong> the knowledge scoreKnowledgescoreThose scoring7 or lessThose scoring13 or moreMean % %UnweightedbaseAll respondents 10.0 10 10 1,038Age 16-21 9.0 18 * 6022-34 10.2 6 9 26935-44 10.1 9 11 28945-54 10.1 10 15 24955-64 9.6 13 6 170Gender Male 10.1 8 11 472Female 9.9 11 9 566EthnicityWhite 10.1 9 10 89Mixed/Asian/Black/Chinese/Other9.2 19 * 129Earnings Under £5,000 9.3 21 * 194£5,000 to £9,999 9.6 9 * 158£10,000 to £14,999 10.1 11 13 276£15,000 to £19,999 10.1 11 10 79£20,000 to £39,999 10.3 6 11 781£40,000 + 10.4 6 21 250Hours worked Full-time 10.1 8 11 336Part-time 9.7 12 5 662Type <strong>of</strong> organis<strong>at</strong>ion Public sector 10.0 9 12 735Priv<strong>at</strong>e sector 10.0 10 9 259Whether hasYes 10.1 8 11 416HR/personnel deptNo 9.7 14 6 622Whether experienced Yes 10.1 7 9 387problemsNo 10.0 11 11 651Managerial/supervisory Yes 10.3 8 16 159dutiesNo 9.8 11 7 168Number <strong>of</strong> employees 1 to 9 9.9 9 6 250in workplace10 to 24 10.0 12 9 22825 to 99 10.0 9 10 208100 to 499 10.3 6 14 329500+ 9.9 11 11 70190
Table 3.19: continuedWhether member <strong>of</strong>TU/staff assoc.How much knownabout rights <strong>at</strong> workHow well informedabout rights <strong>at</strong> workWhether signed opt-outagreementWhether work over 48hrs per weekSource: IES/BMRB, 2005KnowledgescoreThose scoring7 or lessThose scoring13 or moreMean % %UnweightedbaseYes 10.0 9 10 464No 10.0 9 10 563As much as needto know10.1 7 11 680Could know more 9.9 12 9 353Well informed 10.1 8 12 135Not well informed 9.7 12 6 866Yes 10.5 6 12 172No 9.9 10 10 826Yes 10.2 10 13 192No 9.9 10 9 808Table 3.19 shows th<strong>at</strong> the mean score for all respondents was ten, with tenper cent scoring seven points or less, and ten per cent <strong>of</strong> respondents scoring13 points or more (out <strong>of</strong> a possible 19 points).Looking first <strong>at</strong> mean scores, those aged between 22 and 54 were more likelyto have a higher mean score (and therefore have gre<strong>at</strong>er knowledge <strong>of</strong> theiremployment rights) than those aged under 21, or aged 55 and over. Menwere more likely to have a higher mean score than women, as were full-timeworkers compared to part-time workers, those with an HR departmentcompared to those without, and those with managerial/supervisory dutiescompared with those without such duties. The more a respondent earned, themore likely they were to have a higher score and therefore a betterknowledge <strong>of</strong> their employment rights. Those who felt th<strong>at</strong> they knew asmuch as they needed to know about their rights <strong>at</strong> work were more likely toscore highly than those who felt th<strong>at</strong> they could do with knowing more.Similarly, those who felt well informed about their rights <strong>at</strong> work were morelikely to score higher than those who felt less informed. Those who workedover 48 hours a week were more likely to have scored higher than thoseworking 48 hours or less, and those who had signed an opt-out agreementwere more likely than those who had not to have a higher score.Table 3.19 also shows respondents who scored seven points or less. Again,those aged under 21, or aged 55 and over were more likely to score sevenpoints or less than those aged between 22 and 54. Those earning under£5,000 per year were more likely to score seven points or less than thoseearning £5,000 per year or more. Those who had not experienced a problemto do with their rights <strong>at</strong> work were more likely than those who had to scoreseven points or less. Those who felt th<strong>at</strong> they could do with knowing moreabout their rights <strong>at</strong> work were more likely than those who felt th<strong>at</strong> theyknew as much as they needed to know to score seven points or less.91
Finally, Table 3.19 also shows respondents who scored 13 points or more.The age group most likely to score 13 points or more was those aged 45 to54. Full-time workers were more likely to score 13 points or more than parttimeworkers, as were those with an HR department compared to thosewithout one, and those with managerial/supervisory duties compared tothose without such duties. Those who feel well informed about their rights <strong>at</strong>work were more likely to score 13 or more than those who felt less wellinformed.This analysis shows th<strong>at</strong> the groups <strong>of</strong> workers th<strong>at</strong> may be more vulnerableand to have low knowledge levels <strong>of</strong> their rights <strong>at</strong> work do in fact have lowerknowledge. For example, younger and older workers, part-time workers,those without an HR department, those who do not havemanagerial/supervisory duties, and lower earners. Those who did not feelwell informed or felt th<strong>at</strong> they could do with knowing more about their rights<strong>at</strong> work also had low knowledge levels.3.7 Summary3.7.1 <strong>Work</strong>ing time, annual leave and rest breaks• Just over a quarter (26 per cent) <strong>of</strong> respondents cited the actual workingtime limit <strong>of</strong> 48 hours. Over half <strong>of</strong> respondents (57 per cent) thought th<strong>at</strong>the working time limit was less than 48 hours, 15 per cent <strong>of</strong> respondentsthought th<strong>at</strong> the limit was more than 48 hours, and four per cent <strong>of</strong>respondents did not know wh<strong>at</strong> the limit was. The average (mean) number<strong>of</strong> hours cited by respondents was 44.54, while the median number was45.00 hours, both below the actual working time limit.• 43 per cent <strong>of</strong> respondents incorrectly thought th<strong>at</strong> an individual could optout <strong>of</strong> the working time limit informally, and one in five respondentsincorrectly thought th<strong>at</strong> an employer could make opting out a condition <strong>of</strong>employment.• Two-thirds <strong>of</strong> respondents (66 per cent) were correct in knowing th<strong>at</strong>employees could legally opt out by signing a written document.• When asked the minimum number <strong>of</strong> weeks <strong>of</strong> paid holiday employees areentitled to, 61 per cent <strong>of</strong> respondents knew the entitlement was fourweeks. The average (mean) number cited by respondents was 3.9 weeks.However, only just under one-third <strong>of</strong> respondents (32 per cent) knew th<strong>at</strong>employers can include public holidays in the minimum holiday entitlement.• Only one-third <strong>of</strong> respondents (33 per cent) knew th<strong>at</strong> employees wereentitled to two days <strong>of</strong>f in a 14-day period. Thirty-nine per cent <strong>of</strong>respondents thought th<strong>at</strong> it was four days <strong>of</strong>f, perhaps equ<strong>at</strong>ing it toweekends; while over one in ten respondents (12 per cent) thought it wasone day <strong>of</strong>f, seven per cent thought th<strong>at</strong> it was three days <strong>of</strong>f, two per centthought it was five days <strong>of</strong>f and seven per cent did not know the answer.• Fewer than one in ten respondents (nine per cent) knew th<strong>at</strong> employees hadto work more than six hours before being legally entitled to a rest break.92
Almost half <strong>of</strong> respondents (49 per cent) incorrectly thought th<strong>at</strong> they hadto work more than four hours before being legally entitled to a rest break.3.7.2 N<strong>at</strong>ional Minimum Wage• Almost all respondents (95 per cent) said, correctly, th<strong>at</strong> 22 to 64 year oldshave a right to the NMW; and nearly as many (93 per cent), th<strong>at</strong> workersaged 18 to 21 are covered. The large majority (83 per cent) also said th<strong>at</strong>14 and 15 year olds do not have minimum wage protection. There was lessknowledge <strong>of</strong> the law regarding people aged 65 and over. There is no upperagelimit on NMW entitlement; however, over a quarter (26 per cent) <strong>of</strong>survey respondents thought th<strong>at</strong> people above the standard retirement agedo not have a right to the NMW.• The NMW for 16 and 17 year olds was introduced in October 2004. The factth<strong>at</strong> this was a rel<strong>at</strong>ively recent change to the law may be one <strong>of</strong> thereasons why a r<strong>at</strong>her lower proportion <strong>of</strong> respondents knew th<strong>at</strong> this agegroup had the right to the NMW, than was the case for older workers. Justunder six in ten (58 per cent) thought th<strong>at</strong> 16 and 17 year olds werecovered by the NMW, with 38 per cent saying th<strong>at</strong> they were not covered.• One-third (33 per cent) <strong>of</strong> all respondents, indic<strong>at</strong>ed th<strong>at</strong> they thought th<strong>at</strong>there was a single r<strong>at</strong>e for the NMW th<strong>at</strong> applied regardless <strong>of</strong> age, while 63per cent thought th<strong>at</strong> the r<strong>at</strong>e varied by age.• For all age groups where the NMW applied, respondents over-estim<strong>at</strong>ed ther<strong>at</strong>e. The average (mean) r<strong>at</strong>e cited was £4.07 for 16 and 17 year olds,where the actual r<strong>at</strong>e was £3.00; the average r<strong>at</strong>e cited for 18 to 21 yearolds was £4.61, considerably higher than the actual r<strong>at</strong>e <strong>of</strong> £4.10. For 22 to64 year olds the average r<strong>at</strong>e cited was £5.08, and the actual r<strong>at</strong>e was£4.85, while for those aged 65 and over the average r<strong>at</strong>e cited was slightlyless <strong>at</strong> £5.03 compared to the actual r<strong>at</strong>e <strong>of</strong> £4.85.• For 16 and 17 year olds, the median cited by respondents was slightly lessthan the mean, <strong>at</strong> £4.00. Only six per cent <strong>of</strong> respondents gave the correctanswer, while another six per cent cited an answer within ten per cent <strong>of</strong> thecorrect answer. The remaining respondents cited an answer th<strong>at</strong> was evenless accur<strong>at</strong>e.• For 18 to 21 year olds, the median cited by respondents was slightly higherthan the mean, <strong>at</strong> £4.65. Only four per cent <strong>of</strong> respondents cited the correctanswer, while over one-third (38 per cent) cited an answer within ten percent <strong>of</strong> the correct answer (again, with the remaining respondents citing ananswer th<strong>at</strong> was even less accur<strong>at</strong>e).• For 22 to 64 year olds, the median cited by respondents was slightly lowerthan the mean, <strong>at</strong> £5.00. For this age group, accuracy was much higherthan it was for the younger age groups, with more than one in ten (11 percent) <strong>of</strong> respondents citing the correct answer, and over half (56 per cent)citing an answer within ten per cent <strong>of</strong> the correct answer, with theremaining respondents citing an answer th<strong>at</strong> was less accur<strong>at</strong>e.93
• For those aged 65 and older the median cited by respondents was slightlylower than the mean, <strong>at</strong> £5.00. For this age group, accuracy was a similarlevel to th<strong>at</strong> for the r<strong>at</strong>e for 22 to 64 year olds, with more than one in tenrespondents (13 per cent) citing the correct answer, and over half (56 percent) citing an answer within ten per cent <strong>of</strong> the correct answer. Theremaining respondents cited an answer th<strong>at</strong> was even less accur<strong>at</strong>e.3.7.3 Children and dependants• 62 per cent <strong>of</strong> respondents knew th<strong>at</strong> employees were not entitled to bepaid for taking time <strong>of</strong>f for a dependant in an emergency. However, <strong>of</strong> thoserespondents who gave the correct answer (ie knew employees were notentitled to be paid), only 19 per cent were sure about their answer (saying ‘Iknow it’s right’).• Almost two-thirds <strong>of</strong> respondents (63 per cent) knew th<strong>at</strong> a mother wouldbe entitled to return to exactly the same job after ordinary m<strong>at</strong>ernity leave.Of those respondents who gave the correct answer, just over one-third (37per cent) were sure about their answer (saying ‘I know it’s right’).• 73 per cent <strong>of</strong> respondents thought th<strong>at</strong> a mother was entitled to return toexactly the same job or to an equivalent job with the same r<strong>at</strong>e <strong>of</strong> pay. Ofthose respondents who knew employees had the right to return to anequivalent job with the same r<strong>at</strong>e <strong>of</strong> pay, only 13 per cent were sure abouttheir answer (saying ‘I know it’s right’). Of those respondents who knewemployees had the right to exactly the same job, 30 per cent were sureabout their answer (saying ‘I know it’s right’).3.7.4 Other key issues• Over nine in ten respondents knew th<strong>at</strong> the right to the NMW coversemployees from the first day <strong>of</strong> their employment. Around half (48 per cent)<strong>of</strong> those who got the answer correct were sure about their answer.• Again, over nine in ten respondents (93 per cent) knew th<strong>at</strong> the right to becovered by anti-discrimin<strong>at</strong>ion laws covers employees from the first day <strong>of</strong>their employment. Half <strong>of</strong> those who got the right answer were sure abouttheir answer.• Only six per cent <strong>of</strong> respondents knew th<strong>at</strong> the right to be covered by unfairdismissal laws comes into force after they have been with their employer forone year. Of those who did give the correct answer, only around one in five(21 per cent) were sure about their answer.• Only two per cent <strong>of</strong> respondents knew th<strong>at</strong> the right to a contract cameinto force after employees have been with their employer for two months.Around a quarter (24 per cent) <strong>of</strong> those who got the answer right were sureabout their answer.• Over nine out <strong>of</strong> ten respondents (93 per cent) were correct in thinking th<strong>at</strong>employees have the right to be accompanied to disciplinary or grievancehearings.94
• When asked who could accompany them, only 18 per cent got the answerexactly right and knew employees were only entitled to take a trade union<strong>of</strong>ficer and a work colleague with them.• 87 per cent <strong>of</strong> respondents correctly said th<strong>at</strong> employees had to put theircomplaint in writing before making a claim to an employment tribunal.• Just over half <strong>of</strong> respondents (52 per cent) knew th<strong>at</strong> employees only had toput their complaint in writing before making a claim (and so did not have toinform Acas or appoint a solicitor, or make a claim without doing any <strong>of</strong>these things).3.7.5 Knowledge score• A knowledge score was developed by giving respondents one point for eachanswer they got exactly right for some key knowledge questions.• Respondents had an average (mean) score <strong>of</strong> ten, with ten per cent <strong>of</strong>respondents scoring seven points or less, and ten per cent <strong>of</strong> respondentsscoring 13 points or more (out <strong>of</strong> a possible 19 points). Groups <strong>of</strong>respondents were examined to see which were more likely to have a highermean score, to score seven points or less, and to score 13 points or more.• The analysis suggests th<strong>at</strong> the groups <strong>of</strong> workers th<strong>at</strong> may be morevulnerable and have low knowledge levels <strong>of</strong> their rights <strong>at</strong> work do in facthave lower knowledge. For example, younger and older workers, part-timeworkers, those without an HR department, those who do not havemanagerial/supervisory duties, and lower earners. Those who did not feelwell informed or felt th<strong>at</strong> they could do with knowing more about their rights<strong>at</strong> work also had low knowledge levels.95
4Experience <strong>of</strong> problemsThis chapter reports the prevalence and experiences <strong>of</strong> respondents whonoted th<strong>at</strong> they had experienced a problem <strong>at</strong> work in the previous fiveyears. The chapter begins by setting out the approach to measuring theincidence <strong>of</strong> problems used in this survey. It then examines the extent <strong>of</strong>reported problems, and which groups are more likely to experience aproblem. The chapter moves on to examine the types <strong>of</strong> problemsexperienced and the number <strong>of</strong> separ<strong>at</strong>e problems experienced. Theremainder <strong>of</strong> the analysis then focuses on the most serious problemexperienced by respondents: the type <strong>of</strong> problem th<strong>at</strong> was most serious,whether it was ongoing or over, the advice and inform<strong>at</strong>ion sought byrespondents, the actions taken by respondents, and the resolution <strong>of</strong> theproblem. Finally, the chapter examines findings from the part <strong>of</strong> the surveywhich asked respondents who were working <strong>at</strong> the time <strong>of</strong> the survey howlikely they thought it was th<strong>at</strong> they would have problems to do with theirrights <strong>at</strong> work in the future. It examines the types <strong>of</strong> problems they thoughtthey might have, and if they thought they would be able to solve them.Where appropri<strong>at</strong>e, comparisons are drawn with the LSRC English and WelshCivil and Social Justice <strong>Survey</strong> findings (Pleasence, 2006), although as thesummary in Section 1.2.5 shows, the characteristics <strong>of</strong> the LSRC respondentsvaried considerably from those presented here, which invalid<strong>at</strong>ed many <strong>of</strong> thepossible comparisons. Rel<strong>at</strong>ionships are only reported in the text <strong>of</strong> thischapter if they are st<strong>at</strong>istically significant (unless otherwise st<strong>at</strong>ed).4.1 Measuring the incidence <strong>of</strong> problemsIn this survey, respondents were shown a series <strong>of</strong> cards, each <strong>of</strong> whichnamed one <strong>of</strong> the following potential problem areas:• asking your employer if you could work hours th<strong>at</strong> are more flexible• taking parental leave – th<strong>at</strong> is, taking a set amount <strong>of</strong> unpaid time <strong>of</strong>f workto spend with your children• taking time <strong>of</strong>f to look after a dependent child or rel<strong>at</strong>ive in an emergency• m<strong>at</strong>ernity or p<strong>at</strong>ernity leave/pay• adoption leave or pay• holiday entitlement/holiday pay• taking rest breaks <strong>at</strong> work96
• the number <strong>of</strong> hours or days you were required to work• problems to do with pay• your rights as an agency worker/temp• your rights as a part-time worker• receiving a contract or written st<strong>at</strong>ement <strong>of</strong> the terms and conditions <strong>of</strong> yourjob• being tre<strong>at</strong>ed unfairly because <strong>of</strong> your gender• being tre<strong>at</strong>ed unfairly because <strong>of</strong> your sexual orient<strong>at</strong>ion• being tre<strong>at</strong>ed unfairly because <strong>of</strong> your race• being tre<strong>at</strong>ed unfairly because <strong>of</strong> your religion• being tre<strong>at</strong>ed unfairly because <strong>of</strong> your age• being tre<strong>at</strong>ed unfairly because <strong>of</strong> a disability• your employer not following a set procedure when dealing with a complaintagainst you or a problem with your performance <strong>at</strong> work• your employer not following a set procedure when dealing with a grievanceor other work-rel<strong>at</strong>ed problem which you had• being unfairly dismissed.Respondents were asked to identify any <strong>of</strong> these areas with which they hadhad difficulties <strong>at</strong> work in the previous five years.This prompted different methodology from th<strong>at</strong> used in the 2001 survey,which asked respondents to spontaneously name any problem they had hadin rel<strong>at</strong>ion to their rights <strong>at</strong> work. As such, the prevalence <strong>of</strong> problems withineach <strong>of</strong> the survey samples cannot be directly compared, since promptingrespondents to think about a series <strong>of</strong> problem areas (as has been done inthis survey) will result in a ‘higher’ reporting level than asking for aspontaneous, unprompted response. Prompting respondents with a series <strong>of</strong>potential problem areas not only widens the subject <strong>of</strong> discussion, since itmight include an area th<strong>at</strong> a respondent would not necessarily have thought<strong>of</strong> as being a problem, but it also serves to focus the mind and might helprespondents to recall incidents th<strong>at</strong> they would otherwise not haveremembered.In a similar survey on problems <strong>at</strong> work, Pollert (2004) conducted cognitivetesting on various ways <strong>of</strong> phrasing questions about ‘problems’, andconcluded th<strong>at</strong> respondents ‘needed prompting to recall all the relevantproblems they had experienced’ as this ensured they ‘considered concernsth<strong>at</strong> may not be immedi<strong>at</strong>ely <strong>at</strong> the top <strong>of</strong> the mind’. She also concluded th<strong>at</strong>using the words ‘difficulty, concern or worry’ as a s<strong>of</strong>ter version <strong>of</strong> ‘problem’97
led to the inclusion by respondents <strong>of</strong> vague concerns such as broaddiss<strong>at</strong>isfaction with pay or work colleagues.Because <strong>of</strong> the prompted methodology used in this survey, although <strong>at</strong> firstglance the question appears comparable to th<strong>at</strong> used in the 2001 survey,they should not be compared directly. This is borne out by the d<strong>at</strong>a itself: inthe 2001 survey, 16 per cent <strong>of</strong> the sample spontaneously reported havingexperienced a problem <strong>at</strong> work, compared with 42 per cent <strong>of</strong> this surveywho identified with <strong>at</strong> least one <strong>of</strong> the problem areas shown on the cards.4.2 Experiencing a problemAll respondents in the survey were given a set <strong>of</strong> cards showing problemareas (see list above) and were asked to sort them to identify those where:‘… you personally have had a problem to do with your rights <strong>at</strong> work in any<strong>of</strong> these areas in the last five years. Please only include problems th<strong>at</strong>started between [month <strong>of</strong> interview] 2000 and now, either in your currentjob or in any previous jobs you have had during th<strong>at</strong> time’.Table 4.1 illustr<strong>at</strong>es those who reported experiencing one or more <strong>of</strong> theseproblem areas <strong>at</strong> work in the past five years, broken down by personal andemployment characteristics. Almost three out <strong>of</strong> four respondents (72 percent) were working for their current employer <strong>at</strong> the time <strong>of</strong> the problem.Table 4.1: Percentage reporting a problem <strong>at</strong> work in the past fiveyearsYes NoUnweighted% % baseAll respondents 42 58 1,038Age 16-24 60 40 11425-34 46 54 21535-44 35 65 28945-54 35 65 24955-64 37 63 170Gender Male 42 58 472Female 42 58 566Earnings Under £15,000 50 50 412£15,000 to £24,999 42 58 260£25,000 to £39,999 40 60 174£40,000 + 37 63 79Hours worked Full-time 42 58 781Part-time 41 59 250Type <strong>of</strong> organis<strong>at</strong>ion Public sector 36 64 336Priv<strong>at</strong>e sector 44 56 66298
Table 4.1: continuedYes NoUnweighted% % baseWhether has HR/personnel dept Yes 39 61 735No 48 52 259Managerial/supervisory duties Yes 36 64 387No 45 55 651Number <strong>of</strong> employees in 1 to 9 44 56 159workplace10 to 24 46 54 16824 to 99 45 55 250100 to 499 42 58 228500+ 32 68 208Whether children aged 0-5 yrs Yes 42 58 188No 42 58 850Whether member <strong>of</strong> TU/staff Yes 41 59 329assoc.No 42 58 701Whether has dependent children Yes 39 61 426No 44 56 612Whether planning to have Yes 41 59 68children in next yearNo 42 58 948Whether give support to Yes 53 47 164family/friendsNo 40 60 874Whether has long-term health Yes 50 51 107problems/disabilitiesNo 41 59 929Religion Christian 39 61 784All other religions 43 57 37Whether practising religion Yes 43 57 226No 38 62 594Sexual orient<strong>at</strong>ion Straight/heterosexual 42 58 1,025Gay/lesbian/homosexual * * 7Bisexual/other * - *Ethnicity White 41 59 968Mixed/Asian/Black/Chinese/Other 53 47 69Source: IES/BMRB, 2005Table 4.1 shows th<strong>at</strong> 42 per cent <strong>of</strong> respondents said they had experienced aproblem <strong>at</strong> work in the past five years. Those with lower earnings were morelikely to have experienced a problem than those with higher earnings. Ahigher likelihood <strong>of</strong> having experienced a problem was also found in thepriv<strong>at</strong>e sector (compared with public sector), and within organis<strong>at</strong>ions th<strong>at</strong>lacked an HR department. In rel<strong>at</strong>ion to personal characteristics, individuals99
who did not have managerial or supervisory positions (compared to thosewho did), and those who gave support to family or friends (compared tothose who did not) had a higher likelihood <strong>of</strong> experiencing a problem.Vari<strong>at</strong>ion was also found by age group, with those aged 16 to 24 being morelikely to experience a problem compared to other age groups. Thesecharacteristics are the ones th<strong>at</strong> may make workers more vulnerable toexperiencing a problem <strong>at</strong> work.4.2.1 Regression analysis on experiencing a problemLogistic regression was used to analyse the separ<strong>at</strong>e influences some <strong>of</strong> thefactors (such as age and hours worked) may have on determining whether ornot someone has had a problem <strong>at</strong> work in the past five years, while holdingall the other factors constant. For a detailed account <strong>of</strong> how regressionanalysis on experiencing a problem <strong>at</strong> work was conducted see Appendix 2.Independent variables were selected which might have affected whethersomeone had experienced a problem <strong>at</strong> work in the past five years: whetherthey had ‘had a problem’ or ‘had not had a problem’. These included 16 <strong>of</strong>the variables th<strong>at</strong> were used in the general awareness regression; the onesc<strong>at</strong>egorised as personal characteristics, such as gender and age, and thevariables termed employment characteristics, such as earnings and hoursworked. These are listed in Section 2.1.1. Two additional variables were alsoincluded in this model which were:• a self-assessed measure <strong>of</strong> a respondent’s general awareness <strong>of</strong> theiremployment rights: whether they are ‘aware’ or ‘not aware’• whether there was an HR department <strong>at</strong> the respondent’s workplace.Logistic regression was used to isol<strong>at</strong>e which <strong>of</strong> the factors were significant,ie whether they are likely to affect whether someone had experienced aproblem or not. In total, six variables had co-efficients which were significant.The factors below increased the odds <strong>of</strong> a respondent having experienced aproblem <strong>at</strong> work in the past five years:• having a disability, long-term illness or health problem (compared to nothaving one)• being in the marital st<strong>at</strong>us c<strong>at</strong>egory ‘separ<strong>at</strong>ed/divorced’ (compared tobeing ‘single’)• being in the occup<strong>at</strong>ion c<strong>at</strong>egories ‘sales and customer services’ and‘pr<strong>of</strong>essionals’ (compared to being in the occup<strong>at</strong>ion c<strong>at</strong>egory ‘elementaryoccup<strong>at</strong>ions’)• being a trade union/staff associ<strong>at</strong>ion member (compared to not being one).The factors below decreased the odds <strong>of</strong> a respondent having experienced aproblem <strong>at</strong> work in the past five years:• being ‘aware’ <strong>of</strong> their general employment rights (compared to ‘not beingaware’)100
• being older by one year, ie if someone is 35 years old the odds <strong>of</strong> theirhaving experienced a problem are less than for someone who is 34 yearsold.Being disabled or having a long-term health problem (compared to nothaving one), may perhaps increase the odds <strong>of</strong> having had a problem,because respondents may be more likely to experience discrimin<strong>at</strong>ion in theworkplace as a result <strong>of</strong> their health problem/disability. If a respondent is‘aware’ <strong>of</strong> their employment rights (compared to ‘not being aware’), then itmay be th<strong>at</strong> they are less likely to have experienced a problem because anyissues th<strong>at</strong> arose would have been recognised and addressed by therespondent early on before they became problems. The result th<strong>at</strong> as arespondent’s age increases, the odds <strong>of</strong> their having had a problem decreaseis to some degree supported by the bivari<strong>at</strong>e analysis presented above.Some <strong>of</strong> the other results from this regression are harder to explain, forexample, why being in a ‘sales and customer services’ or ‘pr<strong>of</strong>essional’occup<strong>at</strong>ion (compared to being in an ‘elementary’ occup<strong>at</strong>ion) increases theodds <strong>of</strong> having experienced a problem <strong>at</strong> work in the past five years. It is alsounclear why being a trade union/staff associ<strong>at</strong>ion member (compared to notbeing one) increases the odds <strong>of</strong> having experienced a problem <strong>at</strong> work. Itmight be expected th<strong>at</strong> being a member <strong>of</strong> a trade union/staff associ<strong>at</strong>ionwould reduce the likelihood <strong>of</strong> problems occurring.4.3 Types <strong>of</strong> problems experiencedOf the total sample <strong>of</strong> 1,038 respondents, the majority <strong>of</strong> 58 per cent had notexperienced any problems <strong>at</strong> work. For the remaining respondents, Figure4.1 outlines the most common types <strong>of</strong> problem 26 experienced <strong>at</strong> work.26 Multiple responses were allowed.101
Figure 4.1: Type <strong>of</strong> problem(s) experienced in the past five yearsNo problemsPayReceiving a contractTaking rest breaksHours or days required to workHoliday entitlement/holiday payEmployer not following set procedure re performanceAsking if you could work flexible hoursTime <strong>of</strong>f to look after dependent child/rel<strong>at</strong>iveBeing unfairly dismissed<strong>Rights</strong> as an agency worker/temp<strong>Rights</strong> as a part-time workerTre<strong>at</strong>ed unfairly because <strong>of</strong> ageTre<strong>at</strong>ed unfairly because <strong>of</strong> disabilityTaking parental leaveM<strong>at</strong>ernity/p<strong>at</strong>ernity leave/payTre<strong>at</strong>ed unfairly because <strong>of</strong> genderTre<strong>at</strong>ed unfairly because <strong>of</strong> raceTre<strong>at</strong>ed unfairly because <strong>of</strong> religionAdoption leave or payTre<strong>at</strong>ed unfairly because <strong>of</strong> sexual orient<strong>at</strong>ion0 10 20 30 40 50 60 70per centNote: Base is all respondents 1,038.Source: IES/BMRB, 2005Figure 4.1 shows th<strong>at</strong> the most common problem area reported was pay,which affected 22 per cent <strong>of</strong> respondents. This was followed by problemsassoci<strong>at</strong>ed with receiving a contract or written st<strong>at</strong>ement <strong>of</strong> the terms andconditions <strong>of</strong> the job, taking rest breaks <strong>at</strong> work, and the number <strong>of</strong> hours ordays required to work; all <strong>of</strong> which were reported by 13 per cent <strong>of</strong>respondents.4.4 Number <strong>of</strong> separ<strong>at</strong>e problems experiencedRespondents were asked to focus on the problem areas they had identifiedand to consider whether any <strong>of</strong> these were separ<strong>at</strong>e problems or were in factpart <strong>of</strong> the same larger problem. They were asked:‘In total, how many separ<strong>at</strong>e problems to do with your rights <strong>at</strong> work haveyou personally had <strong>at</strong> work in the last five years?’.102
Table 4.2 isol<strong>at</strong>es all those who have experienced a problem and shows theaverage number <strong>of</strong> separ<strong>at</strong>e problems experienced.Table 4.2: Average number <strong>of</strong> separ<strong>at</strong>e problems experienced in thepast five yearsMean number Unweighted baseAll respondents 2.8 416Age 16-24 3.1 6725-34 3.0 9235-44 2.6 10845-54 2.7 8555-64 2.6 63Gender Male 3.0 187Female 2.6 229Earnings Under £15,000 3.1 189£15,000 to £24,999 3.1 103£25,000 to £39,999 2.0 65£40,000 + 2.4 32Hours worked Full-time 2.8 318Part-time 2.9 95Type <strong>of</strong> organis<strong>at</strong>ion Public sector 2.2 122Priv<strong>at</strong>e sector 3.0 278Whether has HR/personnel dept Yes 2.4 281No 3.7 117Managerial/supervisory duties Yes 2.7 137No 2.9 279Number <strong>of</strong> employees in 1 to 9 3.5 66workplace10 to 24 3.2 6524 to 99 2.6 106100 to 499 2.4 95500+ 2.7 73Whether children aged 0-5 yrs Yes 3.0 76No 2.8 340Whether member <strong>of</strong> TU/staff Yes 2.5 133assoc.No 2.9 281Whether has dependent children Yes 2.9 161No 2.8 255Whether planning to have Yes 3.2 27children in next yearNo 2.8 379103
Table 4.2: continuedWhether give support t<strong>of</strong>amily/friendsWhether has long-term healthproblems/disabilitiesMean numberUnweighted baseYes 3.1 83No 2.8 333Yes 3.5 54No 2.7 361Religion Christian 2.8 299All other religions 3.7 15Whether practising religion Yes 2.8 93No 2.9 222Sexual orient<strong>at</strong>ion Straight/heterosexual 2.8 409Gay/lesbian/homosexual * *Bisexual/other * *EthnicityWhite 2.7 381Mixed/Asian/Black/Chinese/other 4.0 35Source: IES/BMRB, 2005Overall, respondents reported an average <strong>of</strong> 2.8 distinct problems in theprevious five years. As Table 4.2 shows, there is considerable vari<strong>at</strong>ion bysub-groups. Those who were more likely to have a higher average number <strong>of</strong>problems were:• those in the priv<strong>at</strong>e sector (compared to those in the public sector)• those in workplaces without an HR department (compared to those with anHR department)• those with long-term health problems or disabilities (compared to thosewithout health problems/disabilities)• respondents <strong>of</strong> mixed, Asian, Black, Chinese or other ethnic origin(compared to White respondents)• those earning less than £25,000 per year (compared to those earning£25,000 per year or more).Again, these characteristics are wh<strong>at</strong> we might expect to make workers morevulnerable to experiencing problems.4.5 Wh<strong>at</strong> types <strong>of</strong> problems were the most serious?As it is clear th<strong>at</strong> many <strong>of</strong> the respondents had experienced more than oneproblem in the past five years, respondents were asked to identify andsubsequently focus on the problem which they considered to be the mostserious. This problem identified as the most serious is, therefore, the focus <strong>of</strong>the remainder <strong>of</strong> this chapter.104
Figure 4.2 below lists the areas into which respondents’ most serious problemfell.Figure 4.2: Most serious problem experienced in the past five yearsPayReceiving a contractNumber <strong>of</strong> hours/days required to workHoliday entitlement/holiday payTaking rest breaksEmployer not following set procedure re performanceAsking if you could work flexible hoursTime <strong>of</strong>f to look after dependent child/rel<strong>at</strong>iveBeing unfairly dismissed.Tre<strong>at</strong>ed unfairly because <strong>of</strong> ageTre<strong>at</strong>ed unfairly because <strong>of</strong> disabilityTaking parental leave<strong>Rights</strong> as an agency worker/tempOther type <strong>of</strong> problemTre<strong>at</strong>ed unfairly because <strong>of</strong> raceM<strong>at</strong>ernity/p<strong>at</strong>ernity leave/payTre<strong>at</strong>ed unfairly because <strong>of</strong> gender<strong>Rights</strong> as a part-time workerTre<strong>at</strong>ed unfairly because <strong>of</strong> religionAdoption leave or payTre<strong>at</strong>ed unfairly because <strong>of</strong> sexual orient<strong>at</strong>ion0 5 10 15 20 25per centNote: Base is 416 (all those who experienced a problem).Source: IES/BMRB, 2005Figure 4.2 shows th<strong>at</strong>, as with Figure 4.1, the most common area was pay,which accounted for 24 per cent <strong>of</strong> the total response.4.5.1 Whether the most serious problem is ongoing or now overOnce the most serious problem had been identified, respondents were asked:‘And would you say this problem or dispute is now over or is it stillongoing?’.Figure 4.3 shows the results <strong>of</strong> this question.105
Figure 4.3: Whether the most serious problem is now over, or is stillongoing706050per cent403020100Problem(s) now overProblem(s) stillongoingProblem(s) most likelynow overToo early to sayDon’t knowNote: Base is 416 (all those who experienced a problem).Source: IES/BMRB, 2005Figure 4.3 shows th<strong>at</strong> the majority (65 per cent) <strong>of</strong> respondents felt th<strong>at</strong> theirproblem had now been resolved.The elapsed time between the start <strong>of</strong> the problem and its resolution wasasked <strong>of</strong> all those who felt their problem was over, or probably over. Theaverage elapsed time was around six months, although this ranged fromwithin the same month to more than five years. Those th<strong>at</strong> lasted for longerthan two years accounted for eight per cent <strong>of</strong> the total and there was nop<strong>at</strong>tern with any particular type(s) <strong>of</strong> problem(s).4.6 Advice or inform<strong>at</strong>ion sought4.6.1 Was advice or inform<strong>at</strong>ion sought?In rel<strong>at</strong>ion to their most serious problem, respondents were shown a list <strong>of</strong>sources <strong>of</strong> potential advice or inform<strong>at</strong>ion and were asked:‘Did you, or someone acting on your behalf, try to get advice orinform<strong>at</strong>ion to help you resolve this problem from any <strong>of</strong> the sources onthis card?’.Table 4.3 illustr<strong>at</strong>es the p<strong>at</strong>terns in seeking advice or inform<strong>at</strong>ion and showsth<strong>at</strong> just over half the respondents who had faced a problem (53 per cent)did seek advice or inform<strong>at</strong>ion.106
Table 4.3: Whether advice/inform<strong>at</strong>ion was soughtYes NoUnweighted% % baseAll respondents 53 47 416Age 16-24 47 53 6725-34 52 48 9235-44 54 45 10845-54 58 42 8555-64 58 41 63Gender Male 49 51 187Female 57 42 229Earnings Under £15,000 50 49 189£15,000 to £24,999 59 41 103£25,000 to £39,999 44 56 65£40,000 + 69 31 32Hours worked Full-time 52 48 318Part-time 57 43 95Type <strong>of</strong> organis<strong>at</strong>ion Public sector 69 30 122Priv<strong>at</strong>e sector 46 54 278Whether has HR/personnel dept Yes 61 39 281No 35 65 117Managerial/supervisory duties Yes 53 44 137No 52 48 279Number <strong>of</strong> employees in workplace 1 to 9 34 66 6610 to 24 49 51 6524 to 99 49 50 106100 to 499 63 37 95500+ 68 32 73Whether children aged 0-5 yrs Yes 57 43 76No 52 47 340Whether member <strong>of</strong> TU/staff assoc. Yes 73 27 133No 45 55 281Whether has dependent children Yes 57 43 161No 50 49 255Whether planning to have children in Yes 63 37 27next yearNo 53 47 379Whether give support to family/friends Yes 59 41 83No 52 48 333107
Table 4.3: continuedWhether has long-term healthproblems/disabilitiesYes NoUnweighted% % baseYes 53 47 54No 53 47 361Religion Christian 55 44 299All other religions 87 13 15Whether practising religion Yes 68 32 93No 52 48 222Sexual orient<strong>at</strong>ion Straight/heterosexual 53 47 409Gay/lesbian/homosexual * * *Bisexual/other * * *Ethnicity White 53 47 381Mixed/Asian/Black/Chinese/Other 57 43 35Note: Base is all those who experienced a problem.Source: IES/BMRB, 2005Although the seeking <strong>of</strong> advice or inform<strong>at</strong>ion was particularly high within thepublic sector, in organis<strong>at</strong>ions with an HR department and within largerworkforces, these differences were not st<strong>at</strong>istically significant, and neitherwere any <strong>of</strong> the others in Table 4.3.4.6.2 Who or where was consulted?Respondents were asked which source <strong>of</strong> inform<strong>at</strong>ion or advice they turned toinitially, and were then asked to list any other sources consultedsubsequently:‘Who or where did you, or someone acting on your behalf, try to get adviceor inform<strong>at</strong>ion from first?‘And who else did you, or someone acting your behalf, try to get advice orinform<strong>at</strong>ion from to help you resolve this problem?’.Figure 4.4 shows which sources were consulted, both initially andsubsequently. 2727 The first source is a single response, the subsequent sources can be multipleresponses. Only those where first contact is above cell count <strong>of</strong> five are shown.108
Figure 4.4: Advice or inform<strong>at</strong>ion sought (multiple response forsubsequent sources)Manager <strong>at</strong> workTrade union/trade union represent<strong>at</strong>ivePersonnel/HR <strong>of</strong>ficerAnother colleague <strong>at</strong> workSolicitorFriend or rel<strong>at</strong>ive with specialist knowledgeCitizens' Advice BureauA websiteAcas0 5 10 15 20 25 30 35per centFirst contactSubsequent contact(s)Note: Base is those who sought advice (226).Source: IES/BMRB, 2005Figure 4.4 shows th<strong>at</strong> a manager <strong>at</strong> work (cited by 32 per cent <strong>of</strong>respondents) followed by a trade union represent<strong>at</strong>ive (cited by 19 per cent<strong>of</strong> respondents) were the most popular sources <strong>of</strong> advice or inform<strong>at</strong>ion forthe first contact a respondent made. The most popular sources <strong>of</strong> advice forsubsequent contacts were a manager <strong>at</strong> work (cited by 15 per cent <strong>of</strong>respondents) followed by another colleague <strong>at</strong> work (cited by 12 per cent <strong>of</strong>respondents).Those who reported consulting a website were asked to specify which one,and those named included: the Acas website, the <strong>DTI</strong> website, and a tradeunion website.4.6.3 Vari<strong>at</strong>ions in the advice soughtBecause <strong>of</strong> the small number <strong>of</strong> respondents 28 , it was not possible to examineany p<strong>at</strong>terns between the advice or inform<strong>at</strong>ion sources and the type <strong>of</strong>problem experienced. This also limits the analysis <strong>of</strong> differences in the choseninform<strong>at</strong>ion sources according to personal and employment characteristics <strong>of</strong>the respondents. However, the consult<strong>at</strong>ion levels were rel<strong>at</strong>ively high forfour sources: managers <strong>at</strong> work, trade unions, other colleagues <strong>at</strong> work, andHR/Personnel departments, which can be examined in more detail. The d<strong>at</strong>afor the initial contact was combined with th<strong>at</strong> for any subsequent contact andthese top four sources were examined by the personal and employmentcharacteristics with the following results.28 Small base sizes.109
Consult<strong>at</strong>ion with a manager <strong>at</strong> workOverall, more than half (51 per cent) <strong>of</strong> those seeking advice or inform<strong>at</strong>ionturned to a manager <strong>at</strong> work either as a first point <strong>of</strong> contact orsubsequently. Consulting a manager was more likely for:• part-time workers (66 per cent compared with 46 per cent <strong>of</strong> full-timeemployees)• those in a workplace with an HR department (54 per cent compared with 36per cent <strong>of</strong> those whose workplace lacked an HR department)• those who actively practice their religion (54 per cent compared with 46 percent who did not). However, vari<strong>at</strong>ion according to the actual religion wasnot significant.The proportion consulting a manager also varied according to the size <strong>of</strong> theworkforce and varied from 36 per cent in workplaces with one to nineemployees; 39 per cent for ten to 24 employees; 63 per cent for 25 to 99employees; 49 per cent for 100 to 499 employees; to 56 per cent for thelargest workplaces <strong>of</strong> 500 plus.Consult<strong>at</strong>ion with a trade unionOverall, 28 per cent consulted with a trade union or trade unionrepresent<strong>at</strong>ive. This was influenced by being a member <strong>of</strong> a union (or a staffassoci<strong>at</strong>ion) with a consult<strong>at</strong>ion level <strong>of</strong> 54 per cent for members comparedwith 12 per cent <strong>of</strong> non-members. Other significant vari<strong>at</strong>ions were alsoevident for those:• working full-time (34 per cent compared with 13 per cent <strong>of</strong> part-timeemployees)• working in the public sector (39 per cent compared with 25 per cent in thepriv<strong>at</strong>e sector)• who gave support to family or friends (32 per cent compared with 28 percent for others)• with a long-term illness, health problem or disability (52 per cent comparedwith 26 per cent for those without health problems/disabilities).There was also vari<strong>at</strong>ion by age and earnings with the following levels <strong>of</strong>consult<strong>at</strong>ion with a trade union or union represent<strong>at</strong>ive:• four per cent <strong>of</strong> those aged 16 to 24; 26 per cent <strong>of</strong> 15 to 24 year olds; 42per cent <strong>of</strong> 35 to 44 year olds; 37 per cent <strong>of</strong> 45 to 54 year olds; and 39 percent <strong>of</strong> those aged 55 to 64• 21 per cent (for those earning under £15k); 27 per cent (£15k to under£25k); 71 per cent (£25k to under £40k); and two per cent <strong>of</strong> those earning£40k plus.110
Consult<strong>at</strong>ion with a colleague <strong>at</strong> workOverall, 28 per cent said they had consulted with a colleague <strong>at</strong> work (otherthan a manager). There were only two sub-groups <strong>of</strong> respondents where thevari<strong>at</strong>ion was significant.• Those in a workplace with an HR department were a little more likely toconsult with a colleague than those without (28 per cent compared to 22 percent).• Those who actively practiced their religion were slightly more likely toconsult with a colleague (31 per cent compared with 28 per cent <strong>of</strong> thosewho did not practise a religion).Going to the HR/personnel department for advice or inform<strong>at</strong>ionA quarter (25 per cent) <strong>of</strong> respondents who sought some sort <strong>of</strong> advice saidthey would consult with their HR/personnel department. There was asignificant vari<strong>at</strong>ion for the following sub-groups:• 34 per cent <strong>of</strong> those employed in the public sector said they would consulttheir HR/personnel department, compared with 18 per cent <strong>of</strong> those in thepriv<strong>at</strong>e sector.• Consult<strong>at</strong>ion also increased for those in trade unions or staff associ<strong>at</strong>ions(32 per cent <strong>of</strong> those who were members compared with 20 per cent <strong>of</strong>non-members) and for those with support/caring responsibilities (35 percent compared with 23 per cent <strong>of</strong> those without such responsibilities).• Only two per cent <strong>of</strong> those in workplaces without a dedic<strong>at</strong>ed HR/personneldepartment were likely to try and source inform<strong>at</strong>ion there, compared with33 per cent <strong>of</strong> those with an HR/personnel department.4.6.4 Wh<strong>at</strong> was wanted from the advice/inform<strong>at</strong>ionAll those who specified th<strong>at</strong> they had looked for advice or inform<strong>at</strong>ion wereasked:‘When you, or someone acting on your behalf, tried to get advice orinform<strong>at</strong>ion from [the named adviser] which <strong>of</strong> these things were youlooking for?’.Figure 4.5 refers to the desired outcome(s) from the initial source <strong>of</strong> adviceor inform<strong>at</strong>ion.111
Figure 4.5: Wh<strong>at</strong> respondents were looking for when trying to getadvice or inform<strong>at</strong>ion from their initial sourceKnow about procedures/wh<strong>at</strong> to do nextKnow about legal rightsAdvice/info source to act on their behalfOther advice or helpJustice/redressKnow who to contract/where to get helpKnow how much it might cost0 5 10 15 20 25 30 35 40 45 50per centSource: IES/BMRB, 2005Figure 4.5 shows th<strong>at</strong> the main goals were inform<strong>at</strong>ion about how theproblem should be pursued (cited by 47 per cent <strong>of</strong> these respondents), andinform<strong>at</strong>ion about legal rights (cited by 45 per cent <strong>of</strong> these respondents).4.6.5 Getting subsequent inform<strong>at</strong>ionRespondents were then asked:‘And were you able to get the advice or inform<strong>at</strong>ion you needed from [thenamed adviser]?’.Table 4.4 illustr<strong>at</strong>es whether respondents got the inform<strong>at</strong>ion they wantedfrom their first source.Table 4.4: Whether respondents got wh<strong>at</strong> they wanted from the firstsourceUnweighted% baseGot all <strong>of</strong> the advice/info needed 49 226Got some <strong>of</strong> the advice/info needed 37 226Got none <strong>of</strong> the advice/info needed 14 226Note: Base = all those who sought advice/info.Source: IES/BMRB, 2005Table 4.4 shows th<strong>at</strong> 49 per cent said th<strong>at</strong> they were able to get theinform<strong>at</strong>ion and advice they needed.Regardless <strong>of</strong> the level <strong>of</strong> inform<strong>at</strong>ion they had received from their firstsource, respondents were asked whether they had gone on to seek furtheradvice or inform<strong>at</strong>ion from another source.112
• Of those who found all th<strong>at</strong> they needed from their first source, 59 per centwent on to get additional advice/inform<strong>at</strong>ion despite already having foundwh<strong>at</strong> they needed, while the remaining 41 per cent did not pursue additionaladvice/inform<strong>at</strong>ion.• Of those who found only ‘some’ <strong>of</strong> the advice/inform<strong>at</strong>ion they needed, ahigher proportion <strong>of</strong> 75 per cent sought additional inform<strong>at</strong>ion, with 25 percent not pursuing anything further.• Of those who got ‘none’ <strong>of</strong> the advice/inform<strong>at</strong>ion needed, the majorityconsulted a manager <strong>at</strong> work. 29 Although the respondent numbers are toosmall to analyse in more detail, one in three <strong>of</strong> these did not pursueadditional sources despite getting none <strong>of</strong> the inform<strong>at</strong>ion they needed fromtheir first contact. This may suggest a small sub-group <strong>of</strong> respondents whodid not know where to turn for further inform<strong>at</strong>ion.Table 4.5 examines whether the completeness <strong>of</strong> the initial inform<strong>at</strong>iongained varied according to the source consulted.Table 4.5: Whether respondents got wh<strong>at</strong> they wanted from theirfirst source% saying theygot all the infoneededUnweightedbaseSolicitor 100 8Trade union/trade union represent<strong>at</strong>ive 59 50Overall/all sources combined 49 226Personnel/HR manager 42 30Manager <strong>at</strong> work 41 67Another colleague <strong>at</strong> work 39 29Note: Base = all those who sought advice/info overall, and for specific sources.Source: IES/BMRB, 2005Table 4.5 shows th<strong>at</strong> the most positive results were associ<strong>at</strong>ed with makinginitial contact with solicitors or trade unions. 304.7 Actions takenRespondents were then asked whether they had undertaken a range <strong>of</strong>actions, and the results are shown in Figure 4.6.29 Here the numbers are very small so should be tre<strong>at</strong>ed with caution. This refers toan unweighted base <strong>of</strong> 20 out <strong>of</strong> 32 respondents, and consult<strong>at</strong>ion with a manageris the number one source overall.30 Only sources with sufficiently large base sizes are shown.113
Figure 4.6: Actions taken (multiple responses given)Discussed the issue face to face with employer (416)Other steps taken (416)Put concerns in writing to employer (416)Employer wrote to respondent (416)Discussed issue by telephone with employer (416)Discussed issue by email with employer (416)If discussed with employer did you go to a formal meeting?(345)0 10 20 30 40 50 60 70 80per centNote: Bases shown in brackets. Base <strong>of</strong> 416 = all those who experienced a problem. Base <strong>of</strong> 345 = all those whodiscussed the issue with their employer (either face to face, telephone or email).Source: IES/BMRB, 2005Figure 4.6 shows th<strong>at</strong> over three-quarters <strong>of</strong> respondents (77 per cent)discussed the issue face to face with their employer. Almost a quarter <strong>of</strong>respondents (24 per cent) put their concerns in writing to their employer. Ofthose respondents th<strong>at</strong> did discuss the issues with their employer, one in fourwent to a formal meeting with their employer.Of those who did not discuss the issue with their employer, more than half(54 per cent) said they would have liked to have had this opportunity.Other steps th<strong>at</strong> were taken to try and resolve the problem by 26 per cent <strong>of</strong>respondents included:• discussing with senior management• contacting a trade union or staff associ<strong>at</strong>ion• discussion with other colleagues.Those who did not take any further steps to resolve the problem did sobecause 31 :• they did not think it was worth the hassle or aggrav<strong>at</strong>ion (31 per cent)• they did not think it would solve the problem (17 per cent)• the problem was resolved without any action (14 per cent)31 Those named by more than five per cent are listed.114
• the employer was not willing to sort it out (13 per cent)• they were afraid it would affect their future employment prospects (eightper cent)• they were not confident they would be tre<strong>at</strong>ed fairly (seven per cent)• they did not know where, or how, to go about it (seven per cent)• they had no faith in the system (six per cent).This largely agrees with the findings from the LSRC English and Welsh Civiland Social Justice <strong>Survey</strong> (Pleasence, 2006) research, th<strong>at</strong> respondents whodid not believe anything could be done to resolve employment problems wereeither generally unaware <strong>of</strong> their rights, or did not think it would have anyeffect – none <strong>of</strong> their respondents reported th<strong>at</strong> they did not know how topursue the problem.4.8 Resolution4.8.1 Time taken to reach resolutionSection 4.5.1 showed th<strong>at</strong> the average length <strong>of</strong> time taken to resolve aproblem was around six months for problems th<strong>at</strong> had already been, or wereassumed to have been resolved. The average elapsed time was a little higher(around six and a half months) for those who had taken advice on theirproblem, compared with those who had not taken advice (around five and ahalf months), suggesting th<strong>at</strong> advice may have been sought for problems <strong>of</strong> amore complex n<strong>at</strong>ure, or th<strong>at</strong> there may have been a delay in sourcing thenecessary inform<strong>at</strong>ion. In comparison, the LSRC English and Welsh Civil andSocial Justice <strong>Survey</strong> research (Pleasence, 2006) found a mean elapsed time<strong>of</strong> eight months and a median elapsed time <strong>of</strong> three months for employmentproblems (see Section 1.2.5 for more inform<strong>at</strong>ion on the comparabilitybetween the two surveys).In rel<strong>at</strong>ion to the type <strong>of</strong> problems experienced, there was also vari<strong>at</strong>ion inthe elapsed time before resolution. Table 4.6 shows the average length <strong>of</strong>time taken to reach resolution by the type <strong>of</strong> problem. Because <strong>of</strong> the smallnumbers, however, any inferences from the d<strong>at</strong>a presented in Table 4.6should be tre<strong>at</strong>ed with caution. 3232 Only problem areas with 20 or more respondents are shown.115
Table 4.6: Average length <strong>of</strong> time taken to reach resolution, by type<strong>of</strong> problemAverage number<strong>of</strong> monthsUnweightedbaseProblems to do with pay 5 55The number <strong>of</strong> hours or days required to work 12 24Holiday entitlement/holiday pay 2 22Your employer not following a set procedure whendealing with a grievance or other work-rel<strong>at</strong>ed problem5 22Your employer not following a set procedure whendealing with a complaint/problem with yourperformance <strong>at</strong> work3 20Note: Base = all those with a problem th<strong>at</strong> has now been, or is thought to have been, resolved.Source: IES/BMRB, 2005Resolution times <strong>of</strong> more than one year were also reported by individuals, orsmall groups <strong>of</strong> respondents, in the problem areas <strong>of</strong>: being unfairly tre<strong>at</strong>edbecause <strong>of</strong> a disability; or because <strong>of</strong> age; and problems rel<strong>at</strong>ed to part-timeworking; and being an agency worker or a temporary member <strong>of</strong> staff.4.8.2 Those who left their employer as a direct resultOf those who had experienced problems <strong>at</strong> work, the majority (72 per cent)had stayed with the same employer. Those who had subsequently changedemployer were asked whether this decision was a direct result <strong>of</strong> theproblem, and were then asked the way in which they had left their employer.Table 4.7 shows the results <strong>of</strong> these questions.Table 4.7: Leaving an employer as a direct result <strong>of</strong> problemsYesUnweighted% baseDid you leave your employer as a direct result <strong>of</strong> the problem(s)? 53 160*Of those who left: how did you leave?Resigned/left <strong>of</strong> own accord 63 87**Was dismissed 21 87**Was made redundant 11 87**Waited until end <strong>of</strong> contract 4 87**Other 1 87**Note: *Base = all those who are no longer with the same employer. **Base = all those who left their employer as adirect result <strong>of</strong> the problem(s).Source: IES/BMRB, 2005Table 4.7 shows th<strong>at</strong> 53 per cent <strong>of</strong> those who has subsequently changedemployer had done so as a direct result <strong>of</strong> the problem. This is equivalent to20 per cent <strong>of</strong> respondents who experienced a problem <strong>at</strong> work, or eight per116
cent <strong>of</strong> all respondents, leaving their employer as a direct result <strong>of</strong> a problem<strong>at</strong> work. Of those who left their employer as a direct result <strong>of</strong> the problem,almost two-thirds (63 per cent) resigned or left <strong>of</strong> their own accord, which isequivalent to five per cent <strong>of</strong> all respondents.Although it is difficult to compare directly with the LSRC English and WelshCivil and Social Justice <strong>Survey</strong> findings (Pleasence, 2006) (see Section 1.2.5for more inform<strong>at</strong>ion on the comparability <strong>of</strong> the two surveys), their researchfound th<strong>at</strong> 25 per cent <strong>of</strong> those experiencing employment problems had beensacked or made redundant, with a further eight per cent reporting th<strong>at</strong> theyresolved their problem by leaving their employer.4.8.3 Those who did not leave their employer as a direct resultThose who did not leave their employer, and reported th<strong>at</strong> their problem hadsince been resolved, were asked how the resolution had been achieved. Thisis shown in Figure 4.7, and because <strong>of</strong> the small numbers once the n<strong>at</strong>ure <strong>of</strong>the problem is included, it is not possible to make any conclusions about howthis might differ according to the problem area.Figure 4.7: How the problem(s) were resolvedMy employer took action to address the problem(s)/complaintNothing/went on as before/forgotten aboutMy employer and I came to a compromiseI left/resigned/changed jobs (not as a direct result <strong>of</strong> theproblem)I took action to address my employer’s problem/complaintI moved jobs within the organis<strong>at</strong>ionSomeone else resigned/was dismissedOther answer0 5 10 15 20 25 30 35 40 45 50per centNote: Base is 201 – all those whose problems are now resolved and did not leave their employer as a direct result.Source: IES/BMRB, 2005Figure 4.7 shows th<strong>at</strong> <strong>of</strong> those who had not left their employer, and whoseproblem had been resolved, nearly half (47 per cent) said th<strong>at</strong> their employerhad taken action to address the problem, while 22 per cent said th<strong>at</strong> nothinghad happened, they had gone on as before or th<strong>at</strong> they had forgotten aboutthe problem.117
4.8.4 Ongoing problemsA small proportion <strong>of</strong> respondents still had ongoing problems. Theirexpect<strong>at</strong>ion <strong>of</strong> how the problem would be resolved is shown in Figure 4.8.Figure 4.8: How the problem(s) were expected to be resolvedWon’t be resolvedWill be resolved in my favourUncertain – but hope will be sorted out s<strong>at</strong>isfactorilyWill be sorted out eventuallyWill change jobs/find another jobWill be addressed by my employerOngoing/too early to sayWill/might lose my jobCome to a compromiseAccept it or leaveOther answersDon't know0 5 10 15 20 25per centNote: Base is 138 – all those whose problems are ongoing.Source: IES/BMRB, 2005Figure 4.8 shows th<strong>at</strong> just over one in five respondents thought th<strong>at</strong> theproblem would not be resolved, th<strong>at</strong> nothing would happen, th<strong>at</strong> they wouldgo on as normal or th<strong>at</strong> the problem would resurface again. A further sevenpercent said th<strong>at</strong> they would find another job, would either accept theproblem or leave, or th<strong>at</strong> they might lose their job. Taken together, theproportion <strong>of</strong> all respondents who are experiencing a problem which theyexpect not to be resolved, or to be resolved by leaving or losing their job, isapproxim<strong>at</strong>ely four per cent.4.8.5 <strong>Employment</strong> tribunalsOnly three per cent <strong>of</strong> those who experienced a problem reported th<strong>at</strong> theyhad brought an employment tribunal case against their employer as a result<strong>of</strong> the problem(s). Of these 11 (unweighted) respondents:• seven were still awaiting the outcome• three had made a settlement with their employer for money or forsomething else• one went to full tribunal hearing which was decided in the respondent’sfavour.118
4.8.6 Wh<strong>at</strong> respondent wishes they had done differentlyRespondents were asked whether there was any aspect <strong>of</strong> the situ<strong>at</strong>ion th<strong>at</strong>they wished they had handled differently:‘Looking back over the experience <strong>of</strong> trying to sort out the problem/dispute, is there anything about the way in which you handled the situ<strong>at</strong>ionth<strong>at</strong> you wish you had done differently?’The results <strong>of</strong> this question are shown in Table 4.8.Table 4.8: Whether leaving an employer as a direct result <strong>of</strong> problemsYesUnweighted% baseDo you wish you had done anything differently? 30 416*Of those saying yes: wh<strong>at</strong> should you have done differently?Been more assertive/forceful 14 128**Taken things down in writing 12 128**Found out more inform<strong>at</strong>ion about my rights 9 128**Acted sooner 9 128**Seen it through to the end 7 128**Sought legal advice 6 128**Acted more calmly/less emotionally 6 128**Joined a union/gone to the union 5 128**Discussed with senior management 5 128**Contacted/appointed an adviser to act on my behalf 4 128**Gone through formal grievance procedures 4 128**Note: *Base = all those who experienced a problem. **Base = all those who experienced a problem and wished theyhad done something differently.Source: IES/BMRB, 2005Table 4.8 shows th<strong>at</strong> nearly one in three (30 per cent) wished th<strong>at</strong> they haddone something differently. Of these, 14 per cent wished th<strong>at</strong> they had beenmore assertive/forceful, and 12 per cent wished th<strong>at</strong> they had taken thingsdown in writing.4.8.7 Regression analysis on whether a problem was resolveds<strong>at</strong>isfactorilyLogistic regression was carried out to analyse wh<strong>at</strong> factors influencedwhether a problem was resolved s<strong>at</strong>isfactorily. The sample for this regressionconsisted <strong>of</strong> all respondents who had experienced a problem <strong>at</strong> work in thepast five years and whose problem was ‘now over’ or ‘most likely now over’.For a detailed account <strong>of</strong> how regression analysis on whether a problem wasresolved s<strong>at</strong>isfactorily was conducted, see Appendix 2.119
Independent variables were selected which may affect whether a problemwas resolved s<strong>at</strong>isfactorily: whether it was ‘resolved s<strong>at</strong>isfactorily’ or ‘notresolved s<strong>at</strong>isfactorily’. Eight <strong>of</strong> these variables were included in the previoustwo logistic regressions (see Sections 2.1.1 and 4.2.1) and can be grouped asemployment characteristics, personal characteristics, or general awareness <strong>of</strong>employment rights. These are:Personal characteristics• gender• whether the respondent has a long-term illness, disability or health problem• ethnicity• age (in years).<strong>Employment</strong> characteristics• trade union/staff associ<strong>at</strong>ion member• type <strong>of</strong> organis<strong>at</strong>ion worked for (public, priv<strong>at</strong>e or voluntary/charitableorganis<strong>at</strong>ion)• hours worked – full-time or part-time (less than 30 hours).General awareness <strong>of</strong> employment rights• a self-assessed measure <strong>of</strong> general awareness <strong>of</strong> employment rights:whether respondents are ‘aware’ or ‘not aware’.The remaining 14 variables included in this model can be grouped into threec<strong>at</strong>egories: where advice was sought from, steps taken to resolve theproblem, and additional variables. These variables are listed below.Where advice was sought from• Was advice sought from HR/personnel?• Was advice sought from a manager <strong>at</strong> work?• Was advice sought from a trade union?• Was advice sought from another colleague <strong>at</strong> work?• Was advice sought from a friend/rel<strong>at</strong>ive?• Was advice sought from a telephone helpline/website/intranet?• Was advice sought from the CAB?• Was advice sought from a legal source (<strong>Employment</strong> Tribunals Service,solicitor or other legal represent<strong>at</strong>ive)?120
Steps taken to resolve the problem• Whether the respondent wrote to their employer about the problem.• Whether the respondent discussed the problem face to face with theiremployer.• Whether the respondent discussed the problem with their employer bytelephone.• Whether the respondent discussed the problem with their employer byemail.Additional variables• Did the employee seek advice?• Did the employer write to the employee or to someone acting on theirbehalf?Logistic regression was used to isol<strong>at</strong>e which <strong>of</strong> these factors were significant,ie whether they are likely to affect whether a problem was ‘resolveds<strong>at</strong>isfactorily’ or ‘not resolved s<strong>at</strong>isfactorily’. In total, four variables had coefficientswhich were significant. The factors below increase the odds <strong>of</strong> aproblem <strong>at</strong> work being resolved s<strong>at</strong>isfactorily:• being a trade union/staff associ<strong>at</strong>ion member (compared to not being one)• being ‘aware’ in general <strong>of</strong> your employment rights (compared to ‘notaware’)• discussing the problem with your employer face to face (compared to notdiscussing it with your employer face to face).The factor below decreases the odds <strong>of</strong> a problem <strong>at</strong> work being resolveds<strong>at</strong>isfactorily:• seeking advice from the CAB.Being a trade union/staff associ<strong>at</strong>ion member compared to not being one, itcould be suggested, is likely to increase the odds <strong>of</strong> a problem being resolveds<strong>at</strong>isfactorily as it may help to facilit<strong>at</strong>e discussions between an employeeand employer which result in an amicable solution. Being ‘aware’ in general <strong>of</strong>your employment rights compared to ‘not being aware’, may also increasethe odds th<strong>at</strong> a problem is resolved s<strong>at</strong>isfactorily because a respondent ismore likely to understand the procedures involved in resolving a problem <strong>at</strong>work, and wh<strong>at</strong> they can expect from their employer. Further, discussing theproblem with their employer face to face compared to not discussing it faceto face, may result in a more amicable discourse and a better understandingby the employer and employee <strong>of</strong> the issues involved in the problem,resulting in the problem being resolved s<strong>at</strong>isfactorily.121
The reasons why seeking advice from the CAB decreases the odds <strong>of</strong> aproblem being resolved s<strong>at</strong>isfactorily are less clear. One hypothesis is th<strong>at</strong>only respondents with more serious and harder-to-solve problems approachthe CAB, therefore, it is less likely th<strong>at</strong> these problems will be resolveds<strong>at</strong>isfactorily. However, this result must be tre<strong>at</strong>ed with caution as there wereonly six respondents unweighted (eight weighted) who sought advice fromthe CAB out <strong>of</strong> the total sample size <strong>of</strong> 242 unweighted respondents (259weighted).4.9 Likelihood <strong>of</strong> future problemsA section <strong>of</strong> the questionnaire asked respondents who were employed <strong>at</strong> thetime <strong>of</strong> the survey to think about whether they felt th<strong>at</strong> they mightexperience a problem <strong>at</strong> work in the next two years. This section reports onthese hypothetical problems to get a general sense <strong>of</strong> wh<strong>at</strong> problemsrespondents thought they might experience.4.9.1 Types <strong>of</strong> problems respondents’ felt th<strong>at</strong> they were likely to experienceRespondents were asked:‘Which, if any, <strong>of</strong> these problems do you think you are likely to experiencein the next two years?‘Family commitments (eg m<strong>at</strong>ernity or p<strong>at</strong>ernity leave or pay, takingparental leave, taking time <strong>of</strong>f to look after dependants, adoption leave orpay).‘Being able to work more flexible hours.‘<strong>Work</strong>ing hours and taking leave (eg holiday entitlement or pay, takingrest breaks <strong>at</strong> work, the number <strong>of</strong> hours or days you are required towork).‘Your rights as an agency worker/temp.‘Your rights as a part-time worker.‘Pay.‘Your contract (eg not receiving a written st<strong>at</strong>ement <strong>of</strong> your terms andconditions, your contract being changed unlawfully).‘Being discrimin<strong>at</strong>ed against (eg because <strong>of</strong> your gender, race, age,disability, sexual orient<strong>at</strong>ion, religion).‘Disciplinary or grievance issues (eg being unfairly dismissed, youremployer failing to follow proper procedures when dealing with a complaintyou have, a complaint against you or problems with your performance.‘Another type <strong>of</strong> problem to do with your rights <strong>at</strong> work.‘None <strong>of</strong> these.’122
Sixty per cent <strong>of</strong> respondents in employment <strong>at</strong> the time <strong>of</strong> the survey didnot expect to experience a problem <strong>at</strong> work in the next two years. Ofrespondents currently working, 40 per cent felt they were likely to experienceone or more <strong>of</strong> these problems in the next two years. Those who hadexperienced a problem in the past were more likely than those who had notto think th<strong>at</strong> they were likely to experience a problem in the next two years.Sixty per cent <strong>of</strong> those who had experienced a past problem thought th<strong>at</strong>they were likely to experience a future problem, compared to only 27 percent <strong>of</strong> those who had not experienced a past problem.Figure 4.9 shows the types <strong>of</strong> problems respondents felt they were likely toexperience.Figure 4.9: Which problems do you think you are likely to experiencein the next two years? (multiple response)Family commitmentsPayBeing able to work more flexible hours<strong>Work</strong>ing hours and taking leaveContract<strong>Rights</strong> as a part-time workerDisciplinary/grievanceDiscrimin<strong>at</strong>ion<strong>Rights</strong> as agency worker/tempAnother type <strong>of</strong> problem to do with rights <strong>at</strong> work0 2 4 6 8 10 12 14 16per centNote: Base is those currently employed (937). ‘Don’t knows’ not included as only two weighted cases.Source: IES/BMRB, 2005Figure 4.9 shows th<strong>at</strong> the most common type <strong>of</strong> problem respondents feltthey were likely to experience was one to do with family commitments, citedby 14 per cent <strong>of</strong> employed respondents. Thirteen per cent <strong>of</strong> employedrespondents felt they were likely to experience a problem to do with pay,while 13 per cent felt they were likely to experience a problem to do withbeing able to work more flexible hours, and 12 per cent felt they were likelyto experience a problem to do with working hours and taking leave. Justunder one in ten employed respondents (nine per cent) felt they were likelyto experience a problem to do with their contract, while problems to do withtheir rights as part-time workers, disciplinary and grievance issues, and beingdiscrimin<strong>at</strong>ed against were all cited by only four per cent <strong>of</strong> employedrespondents. Problems to do with rights as an agency worker or temporaryworker, and another type <strong>of</strong> problem to do with rights <strong>at</strong> work, were cited byjust one per cent <strong>of</strong> employed respondents.123
4.9.2 Types <strong>of</strong> problems respondents’ felt they were most likely toexperienceWhere respondents had cited more than one problem to do with their rights<strong>at</strong> work, they were then asked:‘Which <strong>of</strong> these problems do you think you are most likely to experience inthe next two years?’.Figure 4.10 shows the type <strong>of</strong> problems th<strong>at</strong> those who thought they werelikely to experience a problem in the next two years, thought th<strong>at</strong> they weremost likely to experience.124
Figure 4.10: Which problem do you think you are most likely toexperience in the next two years?PayTo do with the number <strong>of</strong> hours or days required to workTo do with holiday entitlement/payContractBeing able to work more flexible hoursTo do with taking or getting m<strong>at</strong>ernity/p<strong>at</strong>ernity leave/payRefusing to let you take time <strong>of</strong>f in an emergencyDiscrimin<strong>at</strong>ion because <strong>of</strong> ageTo do with taking rest breaksRefusing to let you take parental leaveOther problems to do with working hours/taking leaveDifficulties taking time <strong>of</strong>f to look after elderly parents (non-emergency)Other to do with family commitmentsYour rights as a part-time workerDisciplinary or grievance issuesDiscrimin<strong>at</strong>ion because <strong>of</strong> disabilityDiscrimin<strong>at</strong>ion because <strong>of</strong> some other reasonAnother type <strong>of</strong> problem to do with rights <strong>at</strong> workTo do with working hours and leave rel<strong>at</strong>ing to family commitments0 2 4 6 8 10 12per centNote: Base is all those who thought they were likely to experience a problem in the next two years – 378.Source: IES/BMRB, 2005Figure 4.10 shows th<strong>at</strong> respondents who thought they were likely toexperience a problem in the next two years, thought th<strong>at</strong> the problem theywere most likely to experience was a problem to do with pay (12 per cent).Just over one in ten (11 per cent) thought they were most likely toexperience a problem to do with the number <strong>of</strong> days or hours they wererequired to work. Nine per cent thought they were most likely to have aproblem with their contract, a further nine per cent thought they were most125
likely to experience a problem to do with their holiday entitlement/pay, whilenine per cent thought they were most likely to experience a problem to dowith being able to work more flexible hours. Other problems th<strong>at</strong> more thanfive per cent thought they were likely to experience were problems to do withtaking m<strong>at</strong>ernity/p<strong>at</strong>ernity leave or getting m<strong>at</strong>ernity/p<strong>at</strong>ernity pay (sevenper cent), and problems with employers refusing to let them take time <strong>of</strong>f inan emergency (six per cent).Respondents were then asked:‘Now thinking generally about the issue <strong>of</strong> [their most likely problem], howconfident are you th<strong>at</strong> your employer currently meets its legal oblig<strong>at</strong>ionsto its employees in this area?’.Table 4.9 shows the results <strong>of</strong> this question.Table 4.9: How confident respondents are th<strong>at</strong> their employer meetsits legal oblig<strong>at</strong>ion to its employees in the area <strong>of</strong> therespondents’ most likely problemRespondents who feel likely to experience aproblem in the next two yearsVeryconfidentFairlyconfidentNot veryconfidentNot <strong>at</strong> allconfident% % % %Unweightedbase29 43 19 6 378Age 16-24 24 55 9 7 5025-34 34 41 17 5 8635-44 27 47 24 3 10845-54 28 37 26 8 8755-64 36 33 17 6 46Gender Male 35 39 19 5 168Female 24 48 20 6 210Earnings Under £15,000 23 47 22 7 158£15,000 to £24,999 28 41 22 5 91£25,000 to £39,999 42 35 17 3 73£40,000 + 42 42 8 8 31Hours worked Full-time 31 42 18 6 293Part-time 22 49 22 4 83Type <strong>of</strong> organis<strong>at</strong>ion Public sector 38 44 13 3 130Priv<strong>at</strong>e sector 25 43 23 7 233Whether has HR/personnel Yes 31 48 15 4 266deptNo 23 32 30 12 98Whether experienced problems Yes 23 40 26 8 224No 38 49 9 1 154Managerial/supervisory duties Yes 35 42 13 9 134No 26 44 23 3 244126
Table 4.9: continuedNumber <strong>of</strong> employees inworkplaceVeryconfidentFairlyconfidentNot veryconfidentNot <strong>at</strong> allconfident% % % %Unweightedbase1 to 9 21 50 20 6 6110 to 24 22 42 24 10 6224 to 99 37 41 12 9 82100 to 499 27 44 24 2 72500+ 37 43 18 3 86Note: ‘Don’t knows’ not reported as only three per cent, or ten weighted cases.Source: IES/BMRB, 2005Table 4.9 shows th<strong>at</strong> 29 per cent <strong>of</strong> respondents who thought they werelikely to experience a problem in the next two years were very confident th<strong>at</strong>their employers met their legal oblig<strong>at</strong>ion to employees in the area <strong>of</strong> therespondents’ most likely problem. A further 43 per cent <strong>of</strong> respondents werefairly confident. In total therefore, 73 per cent were either very confident orfairly confident. One-fifth <strong>of</strong> respondents were either not very confident (19per cent) or not <strong>at</strong> all confident (six per cent) th<strong>at</strong> their employers weremeeting their legal oblig<strong>at</strong>ions.Public-sector workers were more likely than priv<strong>at</strong>e-sector workers to beconfident th<strong>at</strong> their employer met their oblig<strong>at</strong>ions, as were respondents withan HR department, and those with managerial or supervisory duties. Thosewho had experienced a problem to do with their rights <strong>at</strong> work in the pastwere less likely than those who had not had a problem to be confident th<strong>at</strong>their employer met its oblig<strong>at</strong>ions.Respondents were finally asked:‘Overall, if you had a problem to do with [their most likely problem], howconfident are you th<strong>at</strong> you would be able to deal with this problem?’Table 4.10 shows th<strong>at</strong> 24 per cent <strong>of</strong> respondents who feel likely toexperience a problem in the next two years are very confident th<strong>at</strong> theywould be able to deal with their most likely problem. A further 49 per cent <strong>of</strong>respondents are fairly confident, while 20 per cent <strong>of</strong> respondents are notvery confident and five per cent are not <strong>at</strong> all confident. Those who haveexperienced a problem in the past to do with their rights <strong>at</strong> work are lesslikely than those who have not to feel confident th<strong>at</strong> they would be able todeal with the problem.127
Table 4.10: How confident respondents are th<strong>at</strong> they would be able todeal with their most likely problem themselvesRespondents who feel likely to experience aproblem in the next two yearsVeryconfidentFairlyconfidentNot veryconfidentNot <strong>at</strong> allconfident% % % %Unweightedbase24 49 20 5 378Age 16-24 29 52 14 * 5025-34 29 50 16 * 8635-44 21 47 28 * 10845-54 20 50 23 7 8755-64 16 51 12 * 46Gender Male 27 48 18 6 168Female 21 51 22 4 210Earnings Under £15,000 23 50 22 4 158£15,000 to £24,999 19 56 19 * 91£25,000 to £39,999 31 39 20 7 73£40,000 + 16 55 20 * 31Hours worked Full-time 26 49 19 4 293Part-time 19 54 19 7 83Type <strong>of</strong> organis<strong>at</strong>ion Public sector 32 49 14 * 130Priv<strong>at</strong>e sector 21 50 22 6 233Whether hasYes 29 50 16 4 266HR/personnel deptNo 16 45 29 9 98Whether experienced Yes 19 49 24 6 224problemsNo 31 49 13 4 154Managerial/supervisory Yes 27 47 17 7 134dutiesNo 22 51 22 4 244Number <strong>of</strong> employees 1 to 9 21 45 26 7 61in workplace10 to 24 26 51 21 - 62How much know aboutrights <strong>at</strong> workHow well informedabout rights <strong>at</strong> work24 to 99 22 45 20 11 82100 to 499 23 49 22 * 72500+ 28 62 7 * 86As much as need to know 35 51 13 * 126No more 19 49 23 7 250Well informed 32 50 14 3 229Not well informed 13 49 29 8 147Note: ‘Don’t knows’ not included as only two per cent, or six weighted cases.Source: IES/BMRB, 2005128
4.10 Summary4.10.1 Experiencing a problem• In all, 42 per cent <strong>of</strong> respondents had experienced a problem <strong>at</strong> work in thepast five years. Those with lower earnings were more likely to haveexperienced a problem than those with higher earnings. Priv<strong>at</strong>e-sectorworkers were more likely to have experienced a problem than public-sectorworkers, as were those within organis<strong>at</strong>ions th<strong>at</strong> lacked an HR department,compared to those in organis<strong>at</strong>ions with one. Individuals who did not havemanagerial or supervisory positions were more likely to experience aproblem than those who did, and those who gave support to family orfriends had a higher likelihood <strong>of</strong> experiencing a problem than those who didnot. Those aged 16 to 24 were more likely to experience a problemcompared to other age groups.• Regression analysis shows th<strong>at</strong> having a long-term health problem ordisability (compared to not having one) increased the odds <strong>of</strong> having had aproblem, as did being ‘separ<strong>at</strong>ed/divorced’ compared to ‘single’, being in a‘sales and customer services’ or ‘pr<strong>of</strong>essional’ occup<strong>at</strong>ion (compared tobeing in an ‘elementary’ occup<strong>at</strong>ion), and being a trade union/staffassoci<strong>at</strong>ion member (compared to not being one). Being ‘aware’ <strong>of</strong> theiremployment rights compared to ‘not being aware’ decreased the odds <strong>of</strong>having experienced a problem. As a respondent’s age increased by oneyear, the odds <strong>of</strong> their having had a problem decreased.4.10.2 Types <strong>of</strong> problems experienced• Of those respondents th<strong>at</strong> had experienced a problem, the most commonproblem reported was a pay issue, which affected 22 per cent <strong>of</strong>respondents. This was followed by problems associ<strong>at</strong>ed with receiving acontract or written st<strong>at</strong>ement <strong>of</strong> the terms and conditions <strong>of</strong> the job, takingrest breaks <strong>at</strong> work, and the number <strong>of</strong> hours or days required to work; all<strong>of</strong> which were reported by 13 per cent <strong>of</strong> respondents.4.10.3 Number <strong>of</strong> separ<strong>at</strong>e problems experienced• Overall, respondents who had a problem reported an average <strong>of</strong> 2.8 distinctproblems in the previous five years. Those which have a significantly higheraverage number <strong>of</strong> problems were: those in the priv<strong>at</strong>e sector (compared tothose in the public sector), those in workplaces without an HR department(compared to those with an HR department), those with long-term healthproblems or disabilities (compared to those without healthproblems/disabilities), respondents <strong>of</strong> mixed, Asian, Black, Chinese or otherethnic origin (compared to White respondents), and those earning less than£25,000 per year (compared to those earning £25,000 per year or more).4.10.4 Wh<strong>at</strong> types <strong>of</strong> problems are the most serious?• The most common area was, again, pay, which accounted for 24 per cent <strong>of</strong>the total response. Just under two-thirds (65 per cent) felt th<strong>at</strong> their mostserious problem had now been resolved.129
• Those who felt their problem was over, or probably over, were asked to givethe elapsed time between the start <strong>of</strong> their most serious problem and itsresolution. The average elapsed time was around six months, although thisranged from within the same month to more than five years. Those th<strong>at</strong>lasted for longer than two years accounted for only eight per cent <strong>of</strong> thetotal and there was no p<strong>at</strong>tern with any particular type <strong>of</strong> problem.4.10.5 Advice or inform<strong>at</strong>ion sought• Just over half <strong>of</strong> respondents (53 per cent) reporting a problem soughtadvice about their most serious problem.• The most popular sources <strong>of</strong> advice or inform<strong>at</strong>ion for the first contact arespondent made were a manager <strong>at</strong> work (cited by 32 per cent <strong>of</strong>respondents) followed by a trade union represent<strong>at</strong>ive (cited by 19 per cent<strong>of</strong> respondents). The most popular sources <strong>of</strong> advice for subsequentcontacts were a manager <strong>at</strong> work (cited by 15 per cent <strong>of</strong> respondents)followed by another colleague <strong>at</strong> work (cited by 12 per cent <strong>of</strong> respondents).• The main goals <strong>of</strong> respondents were to get inform<strong>at</strong>ion about how theproblem should be pursued (cited by 47 per cent <strong>of</strong> these respondents), andto get inform<strong>at</strong>ion about their legal rights (cited by 45 per cent <strong>of</strong> theserespondents) from the initial source <strong>of</strong> advice or inform<strong>at</strong>ion.• Just under half (49 per cent) <strong>of</strong> these respondents were s<strong>at</strong>isfied th<strong>at</strong> theyhad received everything th<strong>at</strong> they required from their first source <strong>of</strong>inform<strong>at</strong>ion/advice. Those who made initial contact with solicitors or tradeunions were the most s<strong>at</strong>isfied th<strong>at</strong> they had got all <strong>of</strong> the inform<strong>at</strong>ion theyneeded.4.10.6 Actions taken• Over three-quarters <strong>of</strong> respondents (77 per cent) discussed the issue face t<strong>of</strong>ace with their employer. Almost a quarter <strong>of</strong> respondents (24 per cent) puttheir concerns in writing to their employer. Of those respondents th<strong>at</strong> diddiscuss the issues with their employer, one in four went to a formal meetingwith their employer. Of those who did not discuss the issue with theiremployer, more than half (54 per cent) said they would have liked to havehad this opportunity.4.10.7 Resolution• The average length <strong>of</strong> time taken to resolve a problem was a little higher(around six and half months) for those who had taken advice on theirproblem, compared with those who had not taken advice (around five andhalf months), suggesting th<strong>at</strong> advice may have been sought for problems <strong>of</strong>a more complex n<strong>at</strong>ure, or th<strong>at</strong> there may have been a delay in sourcing thenecessary inform<strong>at</strong>ion.• Of those who had experienced problems <strong>at</strong> work, a majority <strong>of</strong> 72 per centhad stayed with the same employer. Fifty-three per cent <strong>of</strong> those who hadsubsequently changed employer had done so as a direct result <strong>of</strong> the130
problem. Almost two-thirds (63 per cent) had resigned or left <strong>of</strong> their ownaccord.• Of those who had not left their employer, and whose problem had beenresolved, 47 per cent said th<strong>at</strong> their employer had taken action to addressthe problem, while 22 per cent said th<strong>at</strong> nothing had happened, they hadgone on as before, or had forgotten about the problem.• Of those who had an ongoing problem, one in five thought th<strong>at</strong> the problemwould not be resolved, th<strong>at</strong> nothing would happen, or th<strong>at</strong> they would go onas normal.• Only three per cent <strong>of</strong> those who experienced a problem reported th<strong>at</strong> theyhad brought an employment tribunal case against their employer as a result<strong>of</strong> the problem(s).• Nearly one in three (30 per cent) wished th<strong>at</strong> they had done somethingdifferently. Of these, 14 per cent wished th<strong>at</strong> they had been moreassertive/forceful, and 12 per cent wished th<strong>at</strong> they had taken things downin writing.• Regression analysis showed th<strong>at</strong> the following factors increased the odds <strong>of</strong>a problem <strong>at</strong> work being resolved s<strong>at</strong>isfactorily: being a trade union/staffassoci<strong>at</strong>ion member (compared to not being one), being ‘aware’ in general<strong>of</strong> their employment rights (compared to ‘not being aware’), and discussingthe problem with their employer face to face (compared to not discussing itface to face). Seeking advice from the CAB decreased the odds <strong>of</strong> a problem<strong>at</strong> work being resolved s<strong>at</strong>isfactorily, although very small numbers soughtadvice from the CAB, so this result must be tre<strong>at</strong>ed with caution.4.10.8 Likelihood <strong>of</strong> future problems• The most common type <strong>of</strong> problem respondents felt they were likely toexperience was one to do with family commitments, cited by 14 per cent <strong>of</strong>employed respondents. Thirteen per cent <strong>of</strong> employed respondents felt theywere likely to experience a problem to do with pay, while 13 per cent feltthey were likely to experience a problem to do with being able to work moreflexible hours, and 12 per cent felt they were likely to experience a problemto do with working hours and taking leave.• Employed respondents who thought they were likely to experience aproblem in the next two years, thought th<strong>at</strong> the problem they were mostlikely to experience was one to do with pay (12 per cent). Just over one inten (11 per cent) thought they were most likely to experience a problem todo with the number <strong>of</strong> days or hours they were required to work. Nine percent thought they were most likely to have a problem with their contract, afurther nine per cent thought they were most likely to experience a problemto do with their holiday entitlement/pay, while nine per cent thought theywere most likely to experience a problem to do with being able to workmore flexible hours.• 29 per cent <strong>of</strong> respondents who felt it was likely they would experience aproblem in the next two years were very confident th<strong>at</strong> their employers131
would meet their legal oblig<strong>at</strong>ion to employees in the area <strong>of</strong> therespondents’ most likely problem. A further 43 per cent <strong>of</strong> respondents werefairly confident, while 19 per cent <strong>of</strong> respondents were not very confident,and six per cent were not <strong>at</strong> all confident.• Around a quarter (24 per cent) <strong>of</strong> respondents who felt it was likely theywould experience a problem in the next two years were very confident th<strong>at</strong>they would be able to deal with their most likely problem themselves. Afurther 49 per cent <strong>of</strong> respondents were fairly confident, while 20 per cent <strong>of</strong>respondents were not very confident and five per cent not <strong>at</strong> all confident.Those who experienced a problem in the past to do with their rights <strong>at</strong> workare less likely than those who did not to feel confident th<strong>at</strong> they would beable to deal with the problem.132
5Finding inform<strong>at</strong>ion andadviceThis chapter examines how respondents would go about finding inform<strong>at</strong>ionor advice about their rights <strong>at</strong> work, if they needed to. It firstly examineswhere respondents would go to find out general inform<strong>at</strong>ion about their rights<strong>at</strong> work, and moves on to examine who respondents think is responsible forensuring employees are aware <strong>of</strong> their rights <strong>at</strong> work. The chapter thenexplores how useful respondents think different inform<strong>at</strong>ion services wouldbe, and which inform<strong>at</strong>ion service respondents would find most useful. Itfinally moves on to examine whether respondents would try to getinform<strong>at</strong>ion or advice about hypothetical future problems which they thoughtthey might experience, and where they would seek inform<strong>at</strong>ion and advicefrom for these hypothetical problems. Rel<strong>at</strong>ionships are only reported in thetext <strong>of</strong> this chapter if they are st<strong>at</strong>istically significant (unless otherwisest<strong>at</strong>ed).5.1 Where respondent would go to find out generalinform<strong>at</strong>ion about their rights <strong>at</strong> workIt is important th<strong>at</strong> individuals know where to go to find out generalinform<strong>at</strong>ion about their rights <strong>at</strong> work, to enable them to exercise their rightsif necessary. All respondents were, therefore, asked:‘Imagine you did not have a particular employment problem, but justwanted to find out some general inform<strong>at</strong>ion about your rights <strong>at</strong> work.Who or where would you go to first in order to get this inform<strong>at</strong>ion?’.and those who knew where they would go first were then asked:‘And assuming you couldn’t get the inform<strong>at</strong>ion you wanted from [sourcecited in previous question], how else do you think you might try to getgeneral inform<strong>at</strong>ion about your rights <strong>at</strong> work?’.Table 5.1 shows the results from these questions, showing whererespondents would go first, and where else they would go if they had not gotthe inform<strong>at</strong>ion they wanted from the first source.133
Table 5.1: Where respondents would go to find out generalinform<strong>at</strong>ion about their rights <strong>at</strong> work (per cent)Where respondentswould go first to getgeneral inform<strong>at</strong>ionWhere else they would seekadvice if they had not got theinform<strong>at</strong>ion they wantedWhere respondents would seekadvice (first and subsequentsources combined)Personnel/HR <strong>of</strong>ficer 21 19 38Citizens’ Advice Bureau 14 22 36A website/the Internet 16 16 31Manager <strong>at</strong> work 18 13 30A trade union 11 13 23Other colleagues <strong>at</strong> work 4 9 12Other sources <strong>of</strong>inform<strong>at</strong>ion <strong>at</strong> work3 5 7Friend or rel<strong>at</strong>ive withspecialist knowledge2 4 6Solicitor * 5 5Jobcentre or JobcentrePlus2 3 5Acas 1 4 5Library 1 4 5<strong>DTI</strong> 1 3 4Friend or rel<strong>at</strong>ive withoutspecialist knowledge1 2 3A telephone helpline 1 1 2Another legalrepresent<strong>at</strong>ive* 1 1Other answers 1 4 2Don’t know 4 9 12Unweighted base 1,038 1,000 1,038Note: Bases are: all respondents in column A, and all respondents who know who they would contact first for generalinform<strong>at</strong>ion about rights to work in column B. Column C is multiple response.Source: IES/BMRB, 2005Just over one in five respondents (21 per cent) said they would go first toPersonnel or an HR <strong>of</strong>ficer, while 18 per cent would go first to a manager <strong>at</strong>work, 16 per cent would first use a website/the Internet, 14 per cent wouldfirst use a CAB, and just over one in ten (11 per cent) would first go to <strong>at</strong>rade union. Much smaller proportions <strong>of</strong> respondents cited a range <strong>of</strong> othersources shown in the table. The three per cent 33 who said they would go toanother source <strong>of</strong> inform<strong>at</strong>ion <strong>at</strong> work, primarily said they would use a staffhandbook or an intranet. In all, 42 per cent would go first to personnel/HR, amanager or another source <strong>of</strong> inform<strong>at</strong>ion <strong>at</strong> work.33 an unweighted base <strong>of</strong> 27134
When examining where respondents would then go if they had not got theinform<strong>at</strong>ion they had wanted, an interesting shift occurs, so th<strong>at</strong> over one infive (22 per cent) would then go to a CAB, while just under one in ten (19 percent) would then go to a personnel or HR <strong>of</strong>ficer. Sixteen per cent would usea website/the Internet if they had not got the inform<strong>at</strong>ion they wanted, while13 per cent would then go to a manager <strong>at</strong> work and 13 per cent to a tradeunion. Of the five per cent 34 who said th<strong>at</strong> if they had not got the inform<strong>at</strong>ionthey wanted from the first source they would then go to another source <strong>of</strong>inform<strong>at</strong>ion <strong>at</strong> work, the majority either said th<strong>at</strong> they would use theintranet, or an adviser <strong>at</strong> work, or notices or noticeboards.Where respondents would go first to get general inform<strong>at</strong>ion, and where elsethey would go if they had not got this inform<strong>at</strong>ion from their first source,were combined to see whether certain advice sources were used byrespondents with particular characteristics. The top six sources <strong>of</strong> generalinform<strong>at</strong>ion about rights <strong>at</strong> work were then examined by the standard set <strong>of</strong>personal or employment characteristics (the standard breaks) and whether arespondent was a member <strong>of</strong> a trade union/staff associ<strong>at</strong>ion. The results arepresented in the sections below.5.1.1 Going to a personnel/HR <strong>of</strong>ficer to get general inform<strong>at</strong>ionIn all, 38 per cent <strong>of</strong> all respondents said they would go to a personnel/HR<strong>of</strong>ficer as a first or subsequent source <strong>of</strong> general inform<strong>at</strong>ion about theirrights <strong>at</strong> work.The higher the earnings <strong>of</strong> a respondent, the more likely they were to sayth<strong>at</strong> they would go to a personnel/HR <strong>of</strong>ficer. Only 25 per cent <strong>of</strong> those withearnings <strong>of</strong> less than £15,000 per year would use this as a source <strong>of</strong> generalinform<strong>at</strong>ion, rising to 44 per cent <strong>of</strong> those with earnings <strong>of</strong> £15,000 to£24,999 per year, 46 per cent <strong>of</strong> those with earnings <strong>of</strong> £25,000 to £39,999per year, and 55 per cent <strong>of</strong> those with earnings over £40,000 per year. Parttimeworkers were more likely to say they would use a personnel/HR <strong>of</strong>ficer(71 per cent) than full-time workers (59 per cent), and public-sector workerswere more likely to say they would use a personnel/HR <strong>of</strong>ficer (50 per cent)than workers in the priv<strong>at</strong>e sector (32 per cent).Respondents with an HR department were more likely to say they would usea personnel/HR <strong>of</strong>ficer than those without: 51 per cent compared to sevenper cent. Those who had managerial/supervisory duties were more likely tosay they would use a personnel/HR <strong>of</strong>ficer than those without such duties: 46per cent compared to 33 per cent. Interestingly, those who had experienceda problem to do with their rights <strong>at</strong> work in the past were less likely to saythey would use a personnel/HR <strong>of</strong>ficer than those who had not. Thirty percent <strong>of</strong> those who had experienced a problem would use personnel/HRcompared to 44 per cent <strong>of</strong> those who had not.34 an unweighted base <strong>of</strong> 38135
5.1.2 Going to a CAB to get general inform<strong>at</strong>ionIn all, 36 per cent <strong>of</strong> all respondents said they would go to the CAB as a firstor subsequent source <strong>of</strong> general inform<strong>at</strong>ion about their rights <strong>at</strong> work.Older respondents were more likely to say they would go to the CAB thanyounger respondents: 24 per cent <strong>of</strong> those aged 16 to 24 would go to theCAB compared to 38 per cent <strong>of</strong> those aged 25 to 34, 35 to 44, and 45 to 54,and 40 per cent <strong>of</strong> those aged 55 to 64. Those working in the priv<strong>at</strong>e sectorwere more likely to say they would use a CAB: 41 per cent <strong>of</strong> workers in thepriv<strong>at</strong>e sector, compared to 24 per cent <strong>of</strong> public-sector workers. Thosewithout an HR department were more likely to use a CAB (52 per cent), thanthose who had an HR department (30 per cent).Those who were not trade union/staff associ<strong>at</strong>ion members were also morelikely than trade union/staff associ<strong>at</strong>ion members to say they would use aCAB: 41 per cent <strong>of</strong> non-union members said th<strong>at</strong> they would use a CABcompared to 24 per cent <strong>of</strong> union members. The likelihood <strong>of</strong> saying th<strong>at</strong>they would use a CAB also decreased as the size <strong>of</strong> the organis<strong>at</strong>ion whererespondents worked got bigger, possibly as respondents in largerorganis<strong>at</strong>ions felt th<strong>at</strong> they had more opportunity to get advice within theorganis<strong>at</strong>ion. Forty-five per cent <strong>of</strong> respondents working for small employerswith one to nine employees said they would use a CAB, 43 per cent <strong>of</strong> thoseworking <strong>at</strong> employers with ten to 24 employees would use a CAB, falling to40 per cent <strong>of</strong> those working <strong>at</strong> employers with 25 to 99 employees, 34 percent <strong>of</strong> those working <strong>at</strong> employers with 100 to 499 employees, and 21 percent <strong>of</strong> those working <strong>at</strong> employers with more than 500 employees.5.1.3 Going to a website/the Internet to get general inform<strong>at</strong>ionIn all, 31 per cent <strong>of</strong> all respondents said they would go to a website/theInternet as a first or subsequent source <strong>of</strong> general inform<strong>at</strong>ion about theirrights <strong>at</strong> work.Whether respondents would use a website/the Internet varied by age, withthose aged 35 to 44 most likely to say th<strong>at</strong> they would (38 per cent),followed by those aged 25 to 34 (35 per cent), those aged 45 to 54 (28 percent), those aged 16 to 24 (27 per cent); while only one in ten <strong>of</strong> those aged55 to 64 said they would use a website/the Internet. The higher arespondent’s earnings, the more likely they were to say they would use awebsite/the Internet, perhaps as respondents with higher earnings may havebetter access to computers with Internet access. A quarter <strong>of</strong> those withearnings <strong>of</strong> less than £15,000 per year said th<strong>at</strong> they would, compared to 30per cent <strong>of</strong> those with earnings <strong>of</strong> £15,000 to £24,999 per year, 41 per cent<strong>of</strong> those with earnings <strong>of</strong> £25,000 to £39,999 per year, and 44 per cent <strong>of</strong>those with earnings <strong>of</strong> £40,000 per year or more.Priv<strong>at</strong>e-sector workers were more likely to say they would use a website/theInternet than public-sector workers: 33 per cent compared to 27 per cent.Those with managerial/supervisory responsibilities were also more likely thanthose who did not have such responsibilities to say th<strong>at</strong> they would use awebsite/the Internet: 41 per cent compared to 26 per cent. Those who were136
not trade union/staff associ<strong>at</strong>ion members were more likely to say th<strong>at</strong> theywould use a website/the Internet than trade union/staff associ<strong>at</strong>ionmembers: 34 per cent <strong>of</strong> non-members compared to 26 per cent <strong>of</strong>members.5.1.4 Going to a manager <strong>at</strong> work to get general inform<strong>at</strong>ionIn all, 30 per cent <strong>of</strong> all respondents said th<strong>at</strong> they would go to a manager <strong>at</strong>work as a first or subsequent source <strong>of</strong> general inform<strong>at</strong>ion about their rights<strong>at</strong> work.The younger respondents were, the more likely they were to say th<strong>at</strong> theywould go to a manager <strong>at</strong> work to get general inform<strong>at</strong>ion about their rights<strong>at</strong> work. Thirty-nine per cent <strong>of</strong> those aged 16 to 24 said they would go to amanager, compared to 36 per cent <strong>of</strong> those aged 25 to 34, 28 per cent <strong>of</strong>those aged 35 to 44, 23 per cent <strong>of</strong> those aged 45 to 54 and those aged 55to 64. The lower a respondent’s earnings, the more likely they were to saythey would go to a manager <strong>at</strong> work. Thirty-four per cent <strong>of</strong> those withearnings <strong>of</strong> less than £15,000 per year would go to a manager <strong>at</strong> work,compared to 26 per cent <strong>of</strong> those with earnings <strong>of</strong> £15,000 to £24,999 peryear, 23 per cent <strong>of</strong> those with earnings <strong>of</strong> £25,000 to £39,999 per year, and17 per cent <strong>of</strong> those with earnings <strong>of</strong> £40,000 per year or above.Part-time workers were also more likely to say they would go to a manager<strong>at</strong> work than full-time workers: 38 per cent <strong>of</strong> part-time workers compared to28 per cent <strong>of</strong> full-time workers. Public-sector workers were also more likelyto go to a manager <strong>at</strong> work than workers in the priv<strong>at</strong>e sector: 36 per cent <strong>of</strong>public-sector workers compared to 27 per cent <strong>of</strong> priv<strong>at</strong>e-sector workerswould go to a manager. Those with an HR department were also more likelyto say th<strong>at</strong> they would go to a manager <strong>at</strong> work than those who did not havean HR department: 31 per cent <strong>of</strong> those with an HR department compared to25 per cent <strong>of</strong> those without. Those who had managerial/supervisory dutiesthemselves were less likely to go to a manager <strong>at</strong> work than those who didnot have such duties, perhaps because they were more aware <strong>of</strong> othersources <strong>of</strong> inform<strong>at</strong>ion about rights <strong>at</strong> work they needed to use as part <strong>of</strong>their own managerial role. Twenty-two per cent <strong>of</strong> those withmanagerial/supervisory duties would go to a manager <strong>at</strong> work compared to35 per cent <strong>of</strong> those without managerial/supervisory duties. Interestingly,those who had experienced a problem to do with their rights <strong>at</strong> work wereless likely than those who had not, to go to a manager <strong>at</strong> work: 26 per cent<strong>of</strong> those who had experienced a problem before would go to a managercompared to 33 per cent who had not.5.1.5 Going to a trade union to get general inform<strong>at</strong>ionIn all, 23 per cent <strong>of</strong> all respondents said they would go to a trade union as afirst or subsequent source <strong>of</strong> general inform<strong>at</strong>ion about their rights <strong>at</strong> work.The older respondents were, the more likely they were to say they would goto a trade union. Only nine per cent <strong>of</strong> those aged 16 to 24 would go to <strong>at</strong>rade union, compared to 19 per cent <strong>of</strong> those aged 25 to 34, 23 per cent <strong>of</strong>those aged 35 to 44, 31 per cent <strong>of</strong> those aged 45 to 54, and 32 per cent <strong>of</strong>137
those aged 55 to 64. As larger workplaces are more likely to be unionised,the finding th<strong>at</strong> the larger the respondents’ employer, the more likely theywere to say they would go to a trade union may be owing to a higher r<strong>at</strong>e <strong>of</strong>unionis<strong>at</strong>ion in larger workplaces. Only 11 per cent <strong>of</strong> those <strong>at</strong> an employerwith one to nine employees would go to a trade union, compared to 13 percent <strong>at</strong> employers with ten to 24 employees, 21 per cent <strong>at</strong> employers with25 to 99 employees, 27 per cent <strong>at</strong> employers with 100 to 499 employees,and 35 per cent <strong>at</strong> employers with 500 or more employees.Whether a respondent would go to a trade union also varied by earnings.Thirty-seven per cent <strong>of</strong> those with earnings <strong>of</strong> £25,000 to £39,999 per yearsaid they would go to a trade union, compared to a quarter <strong>of</strong> those withearnings <strong>of</strong> £15,000 to £24,999 per year, one in ten <strong>of</strong> those with earnings <strong>of</strong>£40,000 per year or more, and 17 per cent <strong>of</strong> those with earnings <strong>of</strong> lessthan £15,000 per year. Full-time workers were more likely than part-timeworkers to say they would go to a trade union: 24 per cent <strong>of</strong> full-timers saidthey would go to a trade union compared to 17 per cent <strong>of</strong> part-timers.Public-sector workers were also more likely than priv<strong>at</strong>e-sector workers to goto a trade union: 39 per cent <strong>of</strong> public-sector workers said they would go to aunion compared to 15 per cent <strong>of</strong> priv<strong>at</strong>e-sector workers. Those with an HRdepartment were more likely to say they would go to a trade union thanthose who did not have an HR department: 26 per cent compared to 14 percent. Those who were trade union/staff associ<strong>at</strong>ion members were morelikely to say they would go to a union than those who were not: 58 per cent<strong>of</strong> union/staff associ<strong>at</strong>ion members said th<strong>at</strong> they would go to a trade unioncompared to only eight per cent <strong>of</strong> non-union/staff associ<strong>at</strong>ion members.5.1.6 Going to other colleagues <strong>at</strong> work to get general inform<strong>at</strong>ionIn all, 12 per cent <strong>of</strong> all respondents said they would go to other colleagues<strong>at</strong> work as a first or subsequent source <strong>of</strong> general inform<strong>at</strong>ion about theirrights <strong>at</strong> work. This varied by age and earnings. Those aged 25 to 34 weremost likely to say they would go to other colleagues <strong>at</strong> work (18 per cent),compared to 16 per cent <strong>of</strong> those aged 16 to 24, 12 per cent <strong>of</strong> those aged35 to 44, nine per cent <strong>of</strong> those aged 55 to 64, and six per cent <strong>of</strong> those aged45 to 54. Those with earnings <strong>of</strong> under £15,000 per year were most likely tosay they would go to other colleagues <strong>at</strong> work (16 per cent), compared to 12per cent with earnings <strong>of</strong> £25,000 to £39,999 per year, eight per cent withearnings <strong>of</strong> £15,000 to £24,999 per year, and only three per cent withearnings <strong>of</strong> £40,000 per year or more.5.2 Who is responsible for ensuring employees are aware <strong>of</strong>their rights <strong>at</strong> work?Respondents were asked:‘Whose responsibility do you think it is to make sure th<strong>at</strong> employees areaware <strong>of</strong> their rights <strong>at</strong> work?’and if they gave more than one response to the above question, were alsoasked:138
‘And who do you think should be mainly responsible for making sure th<strong>at</strong>people are aware <strong>of</strong> their rights <strong>at</strong> work?’.Responses were combined from those who gave only one response to the firstquestion, with responses from the subsequent question, so it was possible tosee for all respondents who they felt was mainly responsible for informingemployees <strong>of</strong> their rights <strong>at</strong> work. The results are shown in Table 5.2.Table 5.2: Who respondents think is mainly responsible for informingemployees <strong>of</strong> their rights <strong>at</strong> work<strong>Employees</strong> The TradeEmployers themselves Government unions% % % %UnweightedbaseAll respondents 61 27 9 2 1,038Age 16-24 67 24 7 * 11425-34 57 33 8 * 21535-44 62 25 11 * 28945-54 60 28 8 * 24955-64 63 24 9 * 170Gender Male 61 27 9 2 472Female 61 28 9 2 566Earnings Under £15,000 62 27 8 2 412£15,000 to £24,999 61 27 10 * 260£25,000 to £39,999 66 22 7 * 174£40,000 + 68 22 10 - 79Hours worked Full-time 62 27 9 2 781Part-time 59 29 9 * 250Type <strong>of</strong> organis<strong>at</strong>ion Public sector 60 28 8 3 336Priv<strong>at</strong>e sector 61 27 9 1 662Whether has HR/personnel Yes 61 28 8 2 735deptNo 60 27 11 2 259Whether experienced problems Yes 60 27 11 * 416No 62 28 7 3 622Managerial/supervisory duties Yes 66 26 7 * 387No 58 28 10 3 651Number <strong>of</strong> employees in 1 to 9 71 22 6 * 159workplace10 to 24 59 28 11 * 168Whether member <strong>of</strong> TU/staffassoc.24 to 99 64 27 8 * 250100 to 499 58 29 10 2 228500+ 57 29 7 4 208Yes 58 28 10 3 329No 64 27 8 1 701Note: ‘Don’t Knows’ are not included in the table as they amount to only one per cent <strong>of</strong> all respondents (11 weighted cases).Source: IES/BMRB, 2005139
Sixty-one per cent <strong>of</strong> respondents thought th<strong>at</strong> employers were mainlyresponsible for informing employees about their rights <strong>at</strong> work. Twenty-sevenper cent <strong>of</strong> respondents thought th<strong>at</strong> employees were responsible forinforming themselves about their rights <strong>at</strong> work, while nine per cent thoughtth<strong>at</strong> it was the responsibility <strong>of</strong> government, two per cent thought th<strong>at</strong> it wasthe responsibility <strong>of</strong> trade unions, and one per cent <strong>of</strong> respondents did notknow who they thought was responsible. While there are vari<strong>at</strong>ions betweensome groups within Table 5.2, none are st<strong>at</strong>istically significant.5.3 How useful respondents think different inform<strong>at</strong>ionservices would beRespondents were asked:‘How useful do you think the following services would be to you personallyif you needed inform<strong>at</strong>ion about your rights <strong>at</strong> work? A dedic<strong>at</strong>ed websiteon rights <strong>at</strong> work? A helpline, similar to NHS direct, which would tell youabout your rights <strong>at</strong> work and help you resolve problems? A booklet givento all employees, giving inform<strong>at</strong>ion about employment rights?’.Figure 5.1 shows the results <strong>of</strong> these questions.Figure 5.1: How useful respondents thought different inform<strong>at</strong>ionservices would be706050per cent403020100A dedic<strong>at</strong>ed website on rights <strong>at</strong> work A helpline, similar to NHS Direct A booklet given to all employeesVery useful Fairly useful Not very useful Not <strong>at</strong> all usefulNote: Base is 1,038Source: IES/BMRB, 2005Figure 5.1 shows th<strong>at</strong> respondents had similar views on how helpful each <strong>of</strong>the suggested inform<strong>at</strong>ion services would be. Sixty-three per cent <strong>of</strong>respondents felt th<strong>at</strong> a dedic<strong>at</strong>ed website on rights <strong>at</strong> work would be veryuseful, compared to 57 per cent <strong>of</strong> respondents who felt th<strong>at</strong> a helplinesimilar to NHS Direct would be very useful, and 62 per cent who felt th<strong>at</strong> abooklet given to all employees would be very useful. Each <strong>of</strong> the suggestedinform<strong>at</strong>ion services was examined by the standard set <strong>of</strong> personal oremployment characteristics (the standard breaks) to see whether certain140
inform<strong>at</strong>ion services were thought to be more useful among respondents withparticular characteristics. The results are shown below.5.3.1 A dedic<strong>at</strong>ed website on rights <strong>at</strong> workThe extent to which respondents thought th<strong>at</strong> a dedic<strong>at</strong>ed website on rights<strong>at</strong> work would be useful varied by whether they had previously experienced aproblem to do with their rights <strong>at</strong> work, with those who had experienced aproblem being more likely to say th<strong>at</strong> a website would be useful. Amongthose who had experienced a problem, 70 per cent thought th<strong>at</strong> a websitewould be very useful, 19 per cent thought th<strong>at</strong> it would be fairly useful, sixper cent felt th<strong>at</strong> it would not be very useful, and four per cent thought th<strong>at</strong> itwould not be <strong>at</strong> all useful. This compared to 59 per cent <strong>of</strong> those who had notexperienced a problem thinking th<strong>at</strong> it would be very useful, 28 per centthinking th<strong>at</strong> it would be fairly useful, six per cent thinking th<strong>at</strong> it would notbe very useful, and eight per cent thinking it would not be <strong>at</strong> all useful.The extent to which respondents thought th<strong>at</strong> a dedic<strong>at</strong>ed website on rights<strong>at</strong> work would be useful also varied by whether they had managerial orsupervisory duties, with those with managerial/supervisory duties being morelikely to think a website would be very useful, and less likely to think it wouldbe not <strong>at</strong> all useful. Of those who were managers/supervisors, 67 per centthought a website would be very useful, 25 per cent thought th<strong>at</strong> it would befairly useful, five per cent felt th<strong>at</strong> it would not be very useful, and three percent thought th<strong>at</strong> it would be not <strong>at</strong> all useful. This compared to 62 per cent<strong>of</strong> those without managerial/supervisory duties thinking th<strong>at</strong> it would be veryuseful, 23 per cent thinking th<strong>at</strong> it would be fairly useful, six per cent thinkingth<strong>at</strong> it would be not very useful, and nine per cent thinking it would be not <strong>at</strong>all useful.5.3.2 A helpline, similar to NHS DirectWhile there were vari<strong>at</strong>ions between groups in how useful they thought ahelpline would be, none was st<strong>at</strong>istically significant.5.3.3 A booklet given to all employeesThe extent to which respondents thought th<strong>at</strong> a booklet given to allemployees would be useful varied by whether they had managerial orsupervisory duties, with those with managerial/supervisory duties being lesslikely to think a booklet would be very useful. Of those who weremanagers/supervisors, 58 per cent thought a booklet would be very useful,30 per cent thought th<strong>at</strong> it would be fairly useful, 11 per cent felt th<strong>at</strong> itwould not be very useful, and two per cent thought th<strong>at</strong> it would not be <strong>at</strong> alluseful. This compared to 64 per cent <strong>of</strong> those without managerial/supervisoryduties thinking th<strong>at</strong> it would be very useful, 27 per cent thinking th<strong>at</strong> it wouldbe fairly useful, six per cent thinking th<strong>at</strong> it would not be very useful, andthree per cent thinking it would not be <strong>at</strong> all useful.141
5.4 Which inform<strong>at</strong>ion service respondents would find mostusefulRespondents were then asked:‘And which would you find most useful?’.The results <strong>of</strong> this question are shown in Table 5.3.Table 5.3: Which inform<strong>at</strong>ion service respondents would find mostusefulThe website The helpline The bookletUnweighted% % %baseAll respondents 34 31 34 1,038Age 16-24 31 32 36 11425-34 41 30 29 21535-44 37 32 30 28945-54 28 33 38 24955-64 29 27 42 170Gender Male 35 33 31 472Female 33 29 37 566Earnings Under £15,000 31 31 38 412£15,000 to £24,999 35 33 32 260£25,000 to £39,999 34 35 30 174£40,000 + 40 25 34 79Hours worked Full-time 33 34 33 781Part-time 39 23 38 250Type <strong>of</strong> organis<strong>at</strong>ion Public sector 36 28 36 336Priv<strong>at</strong>e sector 32 33 34 662Whether has HR/personnel dept Yes 31 31 34 735No 32 32 35 259Whether experienced problems Yes 35 34 31 416No 34 29 36 622Managerial/supervisory duties Yes 35 31 34 387No 34 32 34 651Number <strong>of</strong> employees in workplace 1 to 9 35 31 33 15910 to 24 30 39 32 16824 to 99 35 27 37 250100 to 499 30 36 34 228500+ 39 29 31 208Note: ‘Don’t Knows’ are not included in the table as they amount to only one per cent <strong>of</strong> all respondents (sevenweighted cases).Source: IES/BMRB, 2005142
Respondents were very evenly divided between wh<strong>at</strong> they thought the mostuseful inform<strong>at</strong>ion service would be. Thirty-four per cent <strong>of</strong> respondentsthought th<strong>at</strong> a website would be most useful, 31 per cent <strong>of</strong> respondentsthought th<strong>at</strong> a helpline would be most useful, and 34 per cent thought th<strong>at</strong> abooklet would be most useful. While there are vari<strong>at</strong>ions between somegroups within Table 5.3, none are st<strong>at</strong>istically significant.5.5 Getting inform<strong>at</strong>ion or advice about hypothetical futureproblemsSection 4.9 presents results on problems <strong>at</strong> work th<strong>at</strong> those employed <strong>at</strong> thetime <strong>of</strong> the survey thought th<strong>at</strong> they might experience. Those respondentswho thought th<strong>at</strong> they were likely to experience a problem were asked wh<strong>at</strong>type <strong>of</strong> problems they might experience, and wh<strong>at</strong> problem they thought th<strong>at</strong>they were most likely to experience. For this most likely problem,respondents were asked:‘If you had a problem to do with [respondents’ most likely problem], doyou think you would try to get some inform<strong>at</strong>ion or advice about yourrights in rel<strong>at</strong>ion to the problem?’.Eighty-one per cent <strong>of</strong> those who thought they were likely to experience aproblem in the next two years 35 would try to get advice. Whetherrespondents would seek advice if they had a problem was examined by thestandard set <strong>of</strong> personal or employment characteristics (the standardbreaks). Whether or not respondents would seek advice was st<strong>at</strong>isticallysignificant between those who had managerial/supervisory responsibilitiesand those who did not (however, 81 per cent both <strong>of</strong> those withmanagerial/supervisory duties and <strong>of</strong> those without such duties said theywould seek advice). (Nineteen per cent <strong>of</strong> those with managerial/supervisoryduties and 15 per cent <strong>of</strong> those without managerial/supervisory duties saidth<strong>at</strong> they would not seek advice.)Of the 17 per cent <strong>of</strong> respondents 36 who would not seek advice, the mainreason for this was th<strong>at</strong> ‘it was not worth the hassle’ (cited by ten per cent),and th<strong>at</strong> ‘my employers are fair/trust them’ (eight per cent <strong>of</strong> relevantrespondents). These reasons were followed by others cited by less than fiverespondents.Those respondents who said they would try to get advice, or did not knowwhether they would or not, were then asked:‘[If you did decide to try to get some inform<strong>at</strong>ion or advice about yourrights in rel<strong>at</strong>ion to this problem], where would you try to get thisinform<strong>at</strong>ion or advice from?’.The results <strong>of</strong> this question are shown in Figure 5.2.35 unweighted base <strong>of</strong> 37836 63 weighted respondents143
Figure 5.2: Where respondents would seek inform<strong>at</strong>ion or advice(multiple response)A trade union/TU repCitizens' Advice BureauPersonnel/HR <strong>of</strong>ficerManagerA websiteAnother colleagueAnother source <strong>of</strong> inform<strong>at</strong>ion <strong>at</strong> workSolicitorFriend/rel<strong>at</strong>ive with specialist knowledgeAcas<strong>DTI</strong>Friend/rel<strong>at</strong>ive without specialist knowledgeOther sourceDon’t know0 5 10 15 20 25 30per centNote: Base is 316. (All respondents who would try to get advice or don’t know if they would or not.)Source: IES/BMRB, 2005Figure 5.2 shows th<strong>at</strong> the inform<strong>at</strong>ion or advice source cited by most <strong>of</strong> thoserespondents who would try to get advice, or who do not know whether theywould or not, is a trade union/a trade union represent<strong>at</strong>ive (cited by 27 percent). Other popular sources <strong>of</strong> inform<strong>at</strong>ion or advice were CABs (cited by 24per cent), a Personnel/HR <strong>of</strong>ficer (cited by 19 per cent) and a manager <strong>at</strong>work (cited by 18 per cent). Eight per cent said they would go to a website.Of the five per cent who used another source <strong>of</strong> inform<strong>at</strong>ion or advice <strong>at</strong>work, most used an intranet or a staff handbook.5.6 Summary5.6.1 Where respondents would go to find out general inform<strong>at</strong>ionabout their rights <strong>at</strong> work• In terms <strong>of</strong> where respondents would go first, just over one in fiverespondents (21 per cent) said they would go to Personnel or an HR <strong>of</strong>ficer,while 18 per cent would go to a manager <strong>at</strong> work, 16 per cent would use a144
website/the Internet, 14 per cent would use a CAB and just over one in ten(11 per cent) would go to a trade union.• In terms <strong>of</strong> where respondents would then go if they had not got theinform<strong>at</strong>ion they had wanted, an interesting shift occurs, so th<strong>at</strong> over one infive (22 per cent) would then go to a CAB, while just under one in ten (19per cent) would then go to a Personnel or HR <strong>of</strong>ficer. Sixteen per cent woulduse a website/the Internet if they had not got the inform<strong>at</strong>ion they wanted,while 13 per cent would then go to a manager <strong>at</strong> work, and 13 per cent to <strong>at</strong>rade union.• Those who were more likely to say they would use a Personnel/HR <strong>of</strong>ficer asa first or subsequent inform<strong>at</strong>ion source were: respondents with highearnings, part-time workers, public-sector workers, respondents with an HRdepartment, those who had managerial/supervisory duties, and those whohad not experienced a problem to do with their rights <strong>at</strong> work in the past.• Those who were more likely to say th<strong>at</strong> they would use a CAB as a first orsubsequent inform<strong>at</strong>ion source were: older respondents, priv<strong>at</strong>e-sectorworkers, those without an HR department, non-union members, and thoseworking for smaller employers.• Those who were more likely to say they would use a website/the Internet asa first or subsequent inform<strong>at</strong>ion source were: those aged 35 to 44,respondents with high earnings, priv<strong>at</strong>e-sector workers, those who hadmanagerial/supervisory duties, and non-union members.• Those who were more likely to say they would go to a manager as a first orsubsequent inform<strong>at</strong>ion source were: younger respondents, respondentswith low earnings, part-time workers, public-sector workers, respondentswith an HR department, those who did not have managerial/supervisoryduties, and those who had not experienced a problem to do with their rights<strong>at</strong> work in the past.• Those who were more likely to say they would go to a trade union as a firstor subsequent inform<strong>at</strong>ion source were: older respondents, those workingfor larger employers, those with earnings <strong>of</strong> £25,000 to £39,999 per year,full-time workers, public-sector workers, respondents with an HRdepartment, and those who were trade union/staff associ<strong>at</strong>ion members.• Those who were more likely to say they would go to other colleagues <strong>at</strong>work as a first or subsequent inform<strong>at</strong>ion source were: those aged 25 to 34,and those with earnings <strong>of</strong> under £15,000 per year.5.6.2 Who is responsible for ensuring employees are aware <strong>of</strong> theirrights <strong>at</strong> work?• In all, 61 per cent <strong>of</strong> respondents thought th<strong>at</strong> employers were mainlyresponsible for informing employees about their rights <strong>at</strong> work, 27 per cent<strong>of</strong> respondents thought th<strong>at</strong> employees were responsible for informingthemselves about their rights <strong>at</strong> work, while nine per cent thought th<strong>at</strong> it145
was the responsibility <strong>of</strong> government, and two per cent thought th<strong>at</strong> it wasthe responsibility <strong>of</strong> trade unions.5.6.3 How useful respondents’ think different inform<strong>at</strong>ion sources wouldbe• 63 per cent <strong>of</strong> respondents felt th<strong>at</strong> a dedic<strong>at</strong>ed website on rights <strong>at</strong> workwould be very useful, compared to 57 per cent <strong>of</strong> respondents who felt th<strong>at</strong>a helpline similar to NHS Direct would be very useful, and 62 per cent wh<strong>of</strong>elt th<strong>at</strong> a booklet given to all employees would be very useful.• Those who were more likely to think th<strong>at</strong> a dedic<strong>at</strong>ed website on rights <strong>at</strong>work would be useful were: those who had experienced a problem to dowith their rights <strong>at</strong> work in the past, and those with managerial/supervisoryduties.• Those who were more likely to think th<strong>at</strong> a dedic<strong>at</strong>ed booklet on rights <strong>at</strong>work given to all employees would be useful were those withoutmanagerial/supervisory duties.• Respondents were very evenly divided over wh<strong>at</strong> they thought the mostuseful inform<strong>at</strong>ion service would be. Thirty-four per cent <strong>of</strong> respondentsthought th<strong>at</strong> a website would be most useful, 31 per cent <strong>of</strong> respondentsthought th<strong>at</strong> a helpline would be most useful, and 34 per cent thought th<strong>at</strong>a booklet would be most useful.5.6.4 Getting inform<strong>at</strong>ion or advice about future problems• 81 per cent <strong>of</strong> those who feel likely to experience a problems in the next twoyears would try to get advice. Of the 17 per cent <strong>of</strong> respondents who wouldnot seek advice, the main reason for this was th<strong>at</strong> it was not worth thehassle (cited by ten per cent <strong>of</strong> these), and th<strong>at</strong> ‘my employers are fair/trustthem’ (eight per cent <strong>of</strong> these).• The inform<strong>at</strong>ion or advice source cited by most <strong>of</strong> those respondents whowould try to get advice, or do not know whether they would or not, is <strong>at</strong>rade union/a trade union represent<strong>at</strong>ive (cited by 27 per cent). Otherpopular sources <strong>of</strong> inform<strong>at</strong>ion or advice were CABs (cited by 24 per cent), aPersonnel/HR <strong>of</strong>ficer (cited by 19 per cent) and a manager <strong>at</strong> work (cited by18 per cent). Eight per cent said th<strong>at</strong> they would go to a website. Of the fiveper cent who used another source <strong>of</strong> inform<strong>at</strong>ion or advice <strong>at</strong> work, mostused an intranet or a staff handbook.146
6Key findings byemployment rightThis chapter draws together the key survey findings rel<strong>at</strong>ing to eachemployment right covered in the survey. It is designed so th<strong>at</strong> readers caneasily loc<strong>at</strong>e inform<strong>at</strong>ion rel<strong>at</strong>ed to a particular right th<strong>at</strong> they are interestedin, r<strong>at</strong>her than to be read as a chapter in full.6.1 Children and dependants6.1.1 The right to request flexible working by parents <strong>of</strong> a young ordisabled child• Just over half <strong>of</strong> respondents (51 per cent) were aware th<strong>at</strong> employers hada legal oblig<strong>at</strong>ion to seriously consider a request for flexible working fromparents <strong>of</strong> a young or disabled child. Respondents with a child under sixwere more likely to be aware <strong>of</strong> this right than those without children undersix. See Section 2.4.4 for more inform<strong>at</strong>ion.• 31 per cent <strong>of</strong> respondents said they knew hardly anything about the detail<strong>of</strong> the right to request flexible working. How much respondents who wereaware <strong>of</strong> the right to request flexible working knew about the detail <strong>of</strong> th<strong>at</strong>right, varied by whether they had a dependent child and whether they had achild under six. Those with a dependent child were understandably morelikely to know a lot/a fair amount about the detail <strong>of</strong> this right: 40 per cent,compared to 27 per cent <strong>of</strong> those without dependent children. Those with achild under six were also more likely to know a lot/a fair amount about thedetail <strong>of</strong> this right: 45 per cent, compared to 30 per cent <strong>of</strong> those without achild under six. See Section 2.5.4 for more inform<strong>at</strong>ion.• An ‘awareness deficit’ was calcul<strong>at</strong>ed for each right: the proportion <strong>of</strong> allrespondents who were unaware th<strong>at</strong> a right was an actual legal oblig<strong>at</strong>ion,but felt th<strong>at</strong> it was very important for them to know about it. The right torequest flexible working had an awareness deficit <strong>of</strong> 16 per cent <strong>of</strong>respondents. See Section 2.6 for more inform<strong>at</strong>ion.• Eight per cent <strong>of</strong> respondents had experienced a problem in the past fiveyears with asking if they could work flexible hours (these respondentsincluded parents and non-parents). See Section 4.3 for more inform<strong>at</strong>ion.• Six per cent <strong>of</strong> respondents said th<strong>at</strong> their most serious problem <strong>at</strong> work inthe past five years had been to do with asking if they could work flexible147
hours (these respondents included parents and non-parents). See Section4.5 for more inform<strong>at</strong>ion.• 13 per cent <strong>of</strong> respondents who were employed <strong>at</strong> the time <strong>of</strong> the surveyfelt th<strong>at</strong> they were likely to experience a problem to do with being able towork more flexible hours in the next two years (these respondents includedparents and non-parents). Nine per cent <strong>of</strong> respondents who thought theywere likely to experience a problem in the next two years, thought th<strong>at</strong> theproblem they were most likely to experience in the next two years was oneto do with being able to work more flexible hours (these respondentsincluded parents and non-parents). See Section 4.9 for more inform<strong>at</strong>ion.6.1.2 Parental leave• Only 27 per cent <strong>of</strong> respondents were aware th<strong>at</strong> parental leave was a right.Respondents with a child under six were more likely to be aware <strong>of</strong> this rightthan those without children under six. See Section 2.4.4 for moreinform<strong>at</strong>ion.• 30 per cent <strong>of</strong> respondents knew hardly anything about the detail <strong>of</strong>parental leave. Those with a dependent child were more likely to know alot/a fair amount about the detail <strong>of</strong> this right: 41 per cent, compared to 23per cent <strong>of</strong> those without dependent children. Those with a child under sixwere most likely to know a lot/a fair amount about the detail <strong>of</strong> this right:51 per cent, compared to 26 per cent <strong>of</strong> those without a child under six. SeeSection 2.5.4 for more inform<strong>at</strong>ion.• An ‘awareness deficit’ was calcul<strong>at</strong>ed for each right: the proportion <strong>of</strong> allrespondents who were unaware th<strong>at</strong> a right was an actual legal oblig<strong>at</strong>ion,but felt th<strong>at</strong> it was very important for them to know about it. The right totake parental leave had an awareness deficit <strong>of</strong> 18 per cent <strong>of</strong> respondents.See Section 2.6 for more inform<strong>at</strong>ion.• Only two per cent <strong>of</strong> respondents had experienced a problem in the past fiveyears with taking parental leave. See Section 4.3 for more inform<strong>at</strong>ion.• Two per cent <strong>of</strong> respondents said th<strong>at</strong> their most serious problem <strong>at</strong> work inthe past five years had been to do with taking parental leave. See Section4.5 for more inform<strong>at</strong>ion.• Four per cent <strong>of</strong> respondents who thought th<strong>at</strong> they were likely toexperience a problem in the next two years, thought th<strong>at</strong> the problem theywere most likely to experience was one to do with taking parental leave.See Section 4.9 for more inform<strong>at</strong>ion.6.1.3 Time <strong>of</strong>f for dependants in an emergency• 42 per cent <strong>of</strong> respondents were aware th<strong>at</strong> employers have a legaloblig<strong>at</strong>ion to let employees take time <strong>of</strong>f to look after a dependant in anemergency. See Section 2.4.4 for more inform<strong>at</strong>ion.148
• 30 per cent knew hardly anything about the detail <strong>of</strong> the right to take time<strong>of</strong>f for dependants in an emergency. See Section 2.5.4 for moreinform<strong>at</strong>ion.• An ‘awareness deficit’ was calcul<strong>at</strong>ed for each right: the proportion <strong>of</strong> allrespondents who were unaware th<strong>at</strong> a right was an actual legal oblig<strong>at</strong>ion,but felt th<strong>at</strong> it was very important for them to know about it. The right totake time <strong>of</strong>f for dependants in an emergency had an awareness deficit <strong>of</strong>28 per cent <strong>of</strong> respondents. See Section 2.6 for more inform<strong>at</strong>ion.• When told th<strong>at</strong> time <strong>of</strong>f for dependants was a right, 62 per cent <strong>of</strong>respondents knew th<strong>at</strong> employees were not entitled to be paid for takingtime <strong>of</strong>f for a dependant in an emergency. However, <strong>of</strong> those respondentswho gave the correct answer, only 19 per cent were sure about theiranswer. Those who gave support to family/friends were more likely thanthose who did not do so to know th<strong>at</strong> employees are not entitled to be paidfor this right, while interestingly, trade union members were actually lesslikely than non-union members to know th<strong>at</strong> employees were not entitled tobe paid (thinking the right was more generous than it is or saying th<strong>at</strong> theydid not know). See Section 3.4.1 for more inform<strong>at</strong>ion.• Only five per cent <strong>of</strong> respondents had experienced a problem in the past fiveyears with taking time <strong>of</strong>f for dependants in an emergency. See Section 4.3for more inform<strong>at</strong>ion.• Five per cent <strong>of</strong> respondents said th<strong>at</strong> their most serious problem <strong>at</strong> work inthe past five years had been to do with taking time <strong>of</strong>f for dependants in anemergency. See Section 4.5 for more inform<strong>at</strong>ion.• Six per cent <strong>of</strong> respondents who thought they were likely to experience aproblem in the next two years, thought th<strong>at</strong> the problem they were mostlikely to experience was one to do with taking time <strong>of</strong>f for dependants in anemergency. See Section 4.9 for more inform<strong>at</strong>ion.6.1.4 Ordinary m<strong>at</strong>ernity leave• 88 per cent <strong>of</strong> respondents were aware th<strong>at</strong> employers had a legaloblig<strong>at</strong>ion to let women take paid time <strong>of</strong>f when they have a baby. SeeSection 2.4.4 for more inform<strong>at</strong>ion.• 15 per cent <strong>of</strong> respondents described themselves as knowing ‘hardlyanything’ about the detail <strong>of</strong> ordinary m<strong>at</strong>ernity leave. How muchrespondents who were aware <strong>of</strong> the right to ordinary m<strong>at</strong>ernity leave knewabout the detail <strong>of</strong> th<strong>at</strong> right, varied by whether they had a dependent child.Those with a dependent child were more likely to know a lot/a fair amountabout the detail <strong>of</strong> this right: 64 per cent, compared to 50 per cent <strong>of</strong> thosewithout dependent children. See Section 2.5.4 for more inform<strong>at</strong>ion.• An ‘awareness deficit’ was calcul<strong>at</strong>ed for each right: the proportion <strong>of</strong> allrespondents who were unaware th<strong>at</strong> a right was an actual legal oblig<strong>at</strong>ion,but felt th<strong>at</strong> it was very important for them to know about it. The right toordinary m<strong>at</strong>ernity leave had an awareness deficit <strong>of</strong> five per cent <strong>of</strong>respondents. See Section 2.6 for more inform<strong>at</strong>ion.149
• When told th<strong>at</strong> ordinary m<strong>at</strong>ernity leave was a right, almost two-thirds <strong>of</strong>respondents (63 per cent) knew th<strong>at</strong> a mother would be entitled to return toexactly the same job after ordinary m<strong>at</strong>ernity leave. Twenty-seven per cent<strong>of</strong> respondents were incorrect in thinking she only had the right to return toan equivalent job with the same r<strong>at</strong>e <strong>of</strong> pay, six per cent incorrectly thoughtth<strong>at</strong> she only had the right to return to a job <strong>at</strong> the same organis<strong>at</strong>ion, butnot necessarily an equivalent job with the same pay, while two per centincorrectly thought th<strong>at</strong> she had no legal entitlement to return to work, andtwo per cent did not know wh<strong>at</strong> her rights were. Of those respondents whogave the correct answer, just over one-third (37 per cent) were sure abouttheir answer. See Section 3.4.1 for more inform<strong>at</strong>ion.• Only two per cent <strong>of</strong> respondents had experienced a problem in the past fiveyears with m<strong>at</strong>ernity or p<strong>at</strong>ernity leave or pay. See Section 4.3 for moreinform<strong>at</strong>ion.• Seven per cent <strong>of</strong> respondents who thought they were likely to experience aproblem in the next two years, felt th<strong>at</strong> the problem they were most likelyto experience was one to do with taking m<strong>at</strong>ernity/p<strong>at</strong>ernity leave or gettingm<strong>at</strong>ernity/p<strong>at</strong>ernity pay. See Section 4.9 for more inform<strong>at</strong>ion.6.1.5 Additional m<strong>at</strong>ernity leave• 49 per cent <strong>of</strong> respondents were aware th<strong>at</strong> employers had a legaloblig<strong>at</strong>ion to let women take additional unpaid time <strong>of</strong>f when they have ababy. See Section 2.4.4 for more inform<strong>at</strong>ion.• 22 per cent knew hardly anything about the detail <strong>of</strong> additional m<strong>at</strong>ernityleave. How much respondents who were aware <strong>of</strong> it knew about the detail <strong>of</strong>the right to additional m<strong>at</strong>ernity leave, again, varied by whether they had adependent child. Those with a dependent child were more likely to know alot/a fair amount about the detail <strong>of</strong> this right: 55 per cent, compared to 33per cent <strong>of</strong> those without dependent children. See Section 2.5.4 for moreinform<strong>at</strong>ion.• An ‘awareness deficit’ was calcul<strong>at</strong>ed for each right: the proportion <strong>of</strong> allrespondents who were unaware th<strong>at</strong> a right was an actual legal oblig<strong>at</strong>ion,but felt th<strong>at</strong> it was very important for them to know about it. The right toadditional m<strong>at</strong>ernity leave had an awareness deficit <strong>of</strong> 15 per cent <strong>of</strong>respondents. See Section 2.6 for more inform<strong>at</strong>ion.• When told th<strong>at</strong> additional m<strong>at</strong>ernity leave was a right, only just over onethird<strong>of</strong> respondents (36 per cent) knew th<strong>at</strong> a mother has the right toreturn to an equivalent job with the same r<strong>at</strong>e <strong>of</strong> pay. Just over one-third <strong>of</strong>respondents (37 per cent) incorrectly thought th<strong>at</strong> she was entitled to returnto exactly the same job, while 18 per cent incorrectly thought th<strong>at</strong> she isonly entitled to return to a job <strong>at</strong> the same organis<strong>at</strong>ion, but not necessarilyan equivalent job with the same pay, and four per cent incorrectly thoughtth<strong>at</strong> she had no legal right to return (five per cent did not know wh<strong>at</strong> herrights were). Of those respondents who gave the correct answer, only 13per cent were sure about their answer. See Section 3.4.1 for moreinform<strong>at</strong>ion.150
• Only two per cent <strong>of</strong> respondents had experienced a problem in the past fiveyears with m<strong>at</strong>ernity or p<strong>at</strong>ernity leave or pay. See Section 4.3 for moreinform<strong>at</strong>ion.• Seven per cent <strong>of</strong> respondents who thought they were likely to experience aproblem in the next two years, felt th<strong>at</strong> the problem they were most likelyto experience was a problem to do with taking m<strong>at</strong>ernity/p<strong>at</strong>ernity leave orgetting m<strong>at</strong>ernity/p<strong>at</strong>ernity pay in the next two years. See Section 4.9 formore inform<strong>at</strong>ion.6.1.6 Paid p<strong>at</strong>ernity leave• 55 per cent <strong>of</strong> respondents were aware th<strong>at</strong> employers have a legaloblig<strong>at</strong>ion to let men take paid time <strong>of</strong>f when their partner has a baby. SeeSection 2.4.4 for more inform<strong>at</strong>ion.• 21 per cent <strong>of</strong> respondents knew hardly anything about the detail <strong>of</strong> paidp<strong>at</strong>ernity leave. How much respondents who were aware <strong>of</strong> the right to paidp<strong>at</strong>ernity leave felt they knew about the detail <strong>of</strong> th<strong>at</strong> right, varied bywhether they had a dependent child and whether they had a child under six.Those with a dependent child were more likely to know a lot/a fair amountabout the detail <strong>of</strong> this right (47 per cent, compared to 41 per cent <strong>of</strong> thosewithout dependent children), as were those with a child under six (57 percent), compared to 40 per cent <strong>of</strong> those without a child under six. SeeSection 2.5.4 for more inform<strong>at</strong>ion.• An ‘awareness deficit’ was calcul<strong>at</strong>ed for each right: the proportion <strong>of</strong> allrespondents who were unaware th<strong>at</strong> a right was an actual legal oblig<strong>at</strong>ion,but felt th<strong>at</strong> it was very important for them to know about it. The right topaid p<strong>at</strong>ernity leave had an awareness deficit <strong>of</strong> 11 per cent <strong>of</strong> respondents.See Section 2.6 for more inform<strong>at</strong>ion.• Only two per cent <strong>of</strong> respondents had experienced a problem in the past fiveyears with m<strong>at</strong>ernity or p<strong>at</strong>ernity leave or pay. See Section 4.3 for moreinform<strong>at</strong>ion.• Seven per cent <strong>of</strong> respondents who thought th<strong>at</strong> they were likely toexperience a problem in the next two years, felt th<strong>at</strong> the problem they weremost likely to experience was one to do with taking m<strong>at</strong>ernity/p<strong>at</strong>ernityleave or getting m<strong>at</strong>ernity/p<strong>at</strong>ernity pay in the next two years. See Section4.9 for more inform<strong>at</strong>ion.6.2 <strong>Work</strong>ing time, annual leave and rest breaks6.2.1 Minimum holiday entitlement• 81 per cent <strong>of</strong> respondents were aware th<strong>at</strong> employers had a legaloblig<strong>at</strong>ion to let employees take a minimum number <strong>of</strong> weeks’ paid holidayeach year. See Section 2.4.2 for more inform<strong>at</strong>ion.• A quarter <strong>of</strong> respondents said they knew a lot about the detail <strong>of</strong> the right toa minimum number <strong>of</strong> paid holidays each year. See Section 2.5.2 for moreinform<strong>at</strong>ion.151
• An ‘awareness deficit’ was calcul<strong>at</strong>ed for each right: the proportion <strong>of</strong> allrespondents who were unaware th<strong>at</strong> a right was an actual legal oblig<strong>at</strong>ion,but felt th<strong>at</strong> it was very important for them to know about it. The right to aminimum number <strong>of</strong> weeks <strong>of</strong> paid holiday a year had an awareness deficit<strong>of</strong> ten per cent <strong>of</strong> respondents. See Section 2.6 for more inform<strong>at</strong>ion.• When asked the minimum number <strong>of</strong> weeks <strong>of</strong> paid holiday to whichemployees are entitled, 61 per cent <strong>of</strong> respondents knew the entitlementwas four weeks. The average (mean) number cited by respondents was 3.9weeks. However, only just under one-third <strong>of</strong> respondents (32 per cent)knew th<strong>at</strong> employers could include public holidays in the minimum holidayentitlement. See Section 3.2.3 for more inform<strong>at</strong>ion.• One in ten respondents had experienced a problem in the past five years todo with holiday entitlement/holiday pay. See Section 4.3 for moreinform<strong>at</strong>ion.• Nine per cent <strong>of</strong> respondents said th<strong>at</strong> their most serious problem <strong>at</strong> work inthe past five years had been to do with holiday entitlement/holiday pay. SeeSection 4.5 for more inform<strong>at</strong>ion.• 12 per cent <strong>of</strong> respondents who were employed <strong>at</strong> the time <strong>of</strong> the surveyfelt th<strong>at</strong> they were likely to experience a problem to do with working hoursand taking leave. Nine per cent <strong>of</strong> respondents who thought th<strong>at</strong> they werelikely to experience a problem in the next two years, thought th<strong>at</strong> theproblem they were most likely to experience was a problem to do withholiday entitlement/pay. See Section 4.9 for more inform<strong>at</strong>ion.6.2.2 In-work rest breaks• 85 per cent <strong>of</strong> respondents were aware th<strong>at</strong> employers had a legaloblig<strong>at</strong>ion to give employees a rest break after working a certain number <strong>of</strong>hours. See Section 2.4.2 for more inform<strong>at</strong>ion.• 27 per cent <strong>of</strong> respondents said they knew a lot about the detail <strong>of</strong> the rightto in-work rest breaks. See Section 2.5.2 for more inform<strong>at</strong>ion.• An ‘awareness deficit’ was calcul<strong>at</strong>ed for each right: the proportion <strong>of</strong> allrespondents who were unaware th<strong>at</strong> a right was an actual legal oblig<strong>at</strong>ion,but felt th<strong>at</strong> it was very important for them to know about it. The right to inworkrest breaks had an awareness deficit <strong>of</strong> six per cent <strong>of</strong> respondents.See Section 2.6 for more inform<strong>at</strong>ion.• Fewer than one in ten respondents (nine per cent) knew th<strong>at</strong> employees hadto work more than six hours before being legally entitled to a rest break.Almost half <strong>of</strong> respondents (49 per cent) incorrectly thought th<strong>at</strong> they hadto work more than four hours before being legally entitled to a rest break.See Section 3.2.4 for more inform<strong>at</strong>ion.• 13 per cent <strong>of</strong> respondents had experienced a problem in the past five yearswith taking rest breaks <strong>at</strong> work. See Section 4.3 for more inform<strong>at</strong>ion.152
• Eight per cent <strong>of</strong> respondents said th<strong>at</strong> their most serious problem <strong>at</strong> workin the past five years had been with taking rest breaks. See Section 4.5 formore inform<strong>at</strong>ion.• 12 per cent <strong>of</strong> respondents who were employed <strong>at</strong> the time <strong>of</strong> the surveyfelt th<strong>at</strong> they were likely to experience a problem to do with working hoursand taking leave. Four per cent <strong>of</strong> respondents who thought they were likelyto experience a problem in the next two years, thought th<strong>at</strong> the problemthey were most likely to experience was one to do with taking rest breaks.See Section 4.9 for more inform<strong>at</strong>ion.6.2.3 <strong>Work</strong>ing time limit• 63 per cent <strong>of</strong> respondents were aware th<strong>at</strong> employers had a legaloblig<strong>at</strong>ion not to make employees work more than a given number <strong>of</strong> hourseach week. See Section 2.4.2 for more inform<strong>at</strong>ion.• Just under a quarter <strong>of</strong> respondents (24 per cent) said th<strong>at</strong> they knew a lotabout the detail <strong>of</strong> the right to a limit on working hours. See Section 2.5.2for more inform<strong>at</strong>ion.• An ‘awareness deficit’ was calcul<strong>at</strong>ed for each right: the proportion <strong>of</strong> allrespondents who were unaware th<strong>at</strong> a right was an actual legal oblig<strong>at</strong>ion,but felt th<strong>at</strong> it was very important for them to know about it. The right to alimit on working hours had an awareness deficit <strong>of</strong> 13 per cent <strong>of</strong>respondents. See Section 2.6 for more inform<strong>at</strong>ion.• Just over a quarter (26 per cent) <strong>of</strong> respondents cited the actual workingtime limit <strong>of</strong> 48 hours. Over half <strong>of</strong> respondents (57 per cent) thought th<strong>at</strong>the working time limit was less than 48 hours, 15 per cent <strong>of</strong> respondentsthought th<strong>at</strong> the limit was more than 48 hours, and four per cent <strong>of</strong>respondents did not know wh<strong>at</strong> the limit was. The average (mean) number<strong>of</strong> hours cited by respondents was 44.54, while the median number was45.00 hours, both below the actual working time limit. See Section 3.2.1 formore inform<strong>at</strong>ion.• 43 per cent <strong>of</strong> respondents incorrectly thought th<strong>at</strong> an individual could optout <strong>of</strong> the working time limit informally. One in five respondents incorrectlythought th<strong>at</strong> an employer could make opting out a condition <strong>of</strong> employment.Two-thirds <strong>of</strong> respondents (66 per cent) were correct in knowing th<strong>at</strong>employees could legally opt out by signing a written document. See Section3.2.2 for more inform<strong>at</strong>ion.• 13 per cent <strong>of</strong> respondents had experienced a problem in the past five yearsto do with the number <strong>of</strong> hours or days they were required to work. SeeSection 4.3 for more inform<strong>at</strong>ion.• One in ten respondents said th<strong>at</strong> their most serious problem <strong>at</strong> work in thepast five years had been with the number <strong>of</strong> hours or days they wererequired to work. See Section 4.5 for more inform<strong>at</strong>ion.• 12 per cent <strong>of</strong> respondents who were employed <strong>at</strong> the time <strong>of</strong> the surveyfelt they were likely to experience a problem to do with working hours and153
taking leave. Eleven per cent <strong>of</strong> respondents who thought they were likelyto experience a problem in the next two years, thought th<strong>at</strong> the problemthey were most likely to experience was a problem to do with the number <strong>of</strong>hours or days they were required to work. See Section 4.9 for moreinform<strong>at</strong>ion.6.2.4 Entitlement to days <strong>of</strong>f in a 14-day period• Only one-third <strong>of</strong> respondents (33 per cent) knew th<strong>at</strong> employees wereentitled to two days <strong>of</strong>f in a 14-day period. Thirty-nine per cent <strong>of</strong>respondents thought th<strong>at</strong> it was four days <strong>of</strong>f, perhaps equ<strong>at</strong>ing it toweekends; while over one in ten respondents (12 per cent) thought it wasone day <strong>of</strong>f, seven per cent thought th<strong>at</strong> it was three days <strong>of</strong>f, two per centthought it was five days <strong>of</strong>f and seven per cent did not know the answer.See Section 3.2.4 for more inform<strong>at</strong>ion.• 13 per cent <strong>of</strong> respondents had experienced a problem in the past five yearsto do with the number <strong>of</strong> hours or days they were required to work. SeeSection 4.3 for more inform<strong>at</strong>ion.• One in ten respondents said th<strong>at</strong> their most serious problem <strong>at</strong> work in thepast five years had been with the number <strong>of</strong> hours or days they wererequired to work. See Section 4.5 for more inform<strong>at</strong>ion.• 12 per cent <strong>of</strong> respondents who were employed <strong>at</strong> the time <strong>of</strong> the surveyfelt they were likely to experience a problem to do with working hours andtaking leave. Eleven per cent <strong>of</strong> respondents who thought they were likelyto experience a problem in the next two years, thought th<strong>at</strong> the problemthey were most likely to experience was a problem to do with the number <strong>of</strong>hours or days they were required to work. See Section 4.9 for moreinform<strong>at</strong>ion.6.3 Pay, contracts, disciplinary and grievance procedures, andemployment tribunals6.3.1 N<strong>at</strong>ional Minimum Wage• 93 per cent <strong>of</strong> respondents identified the payment <strong>of</strong> a minimum wage as alegal oblig<strong>at</strong>ion on employers. See Section 2.4.3 for more inform<strong>at</strong>ion.• One-third <strong>of</strong> respondents said th<strong>at</strong> they knew a lot about the detail <strong>of</strong> a rightto the NMW. How much respondents who were aware <strong>of</strong> the right to a NMWknew about the detail <strong>of</strong> th<strong>at</strong> right, varied according to the size <strong>of</strong> theiremployer. Those working for employers with 25 to 99 employees were leastlikely to say th<strong>at</strong> they knew a lot or a fair amount about the detail <strong>of</strong> theright to a NMW (58 per cent knew a lot/a fair amount), compared to 63 percent <strong>of</strong> those <strong>at</strong> employers with 500 or more employees, 68 per cent <strong>of</strong>those <strong>at</strong> employers with 100 to 499 employees, 72 per cent <strong>of</strong> those <strong>at</strong>employers with one to nine employees and 74 per cent <strong>of</strong> those <strong>at</strong>employers with ten to 24 employees. See Section 2.5.3 for moreinform<strong>at</strong>ion.154
• An ‘awareness deficit’ was calcul<strong>at</strong>ed for each right: the proportion <strong>of</strong> allrespondents who were unaware th<strong>at</strong> a right was an actual legal oblig<strong>at</strong>ion,but felt th<strong>at</strong> it was very important for them to know about it. The right to aNMW had an awareness deficit <strong>of</strong> only four per cent <strong>of</strong> respondents. SeeSection 2.6 for more inform<strong>at</strong>ion.• Almost all respondents (95 per cent) said, correctly, th<strong>at</strong> 22 to 64 year oldshave a right to the NMW; and nearly as many (93 per cent), th<strong>at</strong> workersaged 18 to 21 are covered. The large majority (83 per cent) also said th<strong>at</strong>14 to 15 year olds do not have minimum wage protection. There was lessknowledge <strong>of</strong> the law regarding people aged 65 and over, with a quarter (26per cent) <strong>of</strong> survey respondents thinking th<strong>at</strong> people above the standardretirement age do not have a right to the NMW. Just under six in ten (58 percent) thought th<strong>at</strong> 16 and 17 year olds are covered by the NMW. SeeSection 3.3.1 for more inform<strong>at</strong>ion.• One-third (33 per cent) <strong>of</strong> all respondents, indic<strong>at</strong>ed th<strong>at</strong> they thought therewas a single r<strong>at</strong>e applying regardless <strong>of</strong> age. See Section 3.3.2 for moreinform<strong>at</strong>ion.• In all age groups where the NMW applies, respondents over-estim<strong>at</strong>ed ther<strong>at</strong>e. The average (mean) r<strong>at</strong>e cited was £4.07 for 16 and 17 year olds,where the actual r<strong>at</strong>e was £3.00, and the average r<strong>at</strong>e cited for 18 to 21year olds was £4.61, considerably higher than the actual r<strong>at</strong>e <strong>of</strong> £4.10. For22 to 64 year olds the average r<strong>at</strong>e cited was £5.08, with the actual r<strong>at</strong>ebeing £4.85, while for those aged 65 and over the average r<strong>at</strong>e cited wasslightly less <strong>at</strong> £5.03 compared to the actual r<strong>at</strong>e <strong>of</strong> £4.85. See Section3.3.3 for more inform<strong>at</strong>ion.• For 16 and 17 year olds, the median cited by respondents was slightly lessthan the mean, <strong>at</strong> £4.00. Only six per cent <strong>of</strong> respondents cited the correctanswer, while another six per cent cited an answer within ten per cent <strong>of</strong> thecorrect answer, with the remaining respondents citing an answer th<strong>at</strong> waseven less accur<strong>at</strong>e. See Section 3.3.3 for more inform<strong>at</strong>ion.• For 18 to 21 year olds, the median cited by respondents was slightly higherthan the mean, <strong>at</strong> £4.65. Only four per cent <strong>of</strong> respondents cited the correctanswer, while over one-third (38 per cent) cited an answer within ten percent <strong>of</strong> the correct answer, with the remaining respondents citing an answerth<strong>at</strong> was even less accur<strong>at</strong>e. See Section 3.3.3 for more inform<strong>at</strong>ion.• For 22 to 64 year olds, the median cited by respondents was slightly lowerthan the mean, <strong>at</strong> £5.00. For this age group, accuracy was much higherthan it was for the younger age groups, with more than one in ten (11 percent) <strong>of</strong> respondents citing the correct answer, and over half (56 per cent)citing an answer within ten per cent <strong>of</strong> the correct answer, with theremaining respondents citing an answer th<strong>at</strong> was less accur<strong>at</strong>e. See Section3.3.3 for more inform<strong>at</strong>ion.• For those aged 65 and older, the median cited by respondents was slightlylower than the mean, <strong>at</strong> £5.00. For this age group, accuracy was <strong>at</strong> a similarlevel to th<strong>at</strong> for the r<strong>at</strong>e for 22 to 64 year olds, with more than one in ten155
(13 per cent) respondents citing the correct answer, and over half (56 percent) citing an answer within ten per cent <strong>of</strong> the correct answer, with theremaining respondents citing an answer th<strong>at</strong> was even less accur<strong>at</strong>e. SeeSection 3.3.3 for more inform<strong>at</strong>ion.• Over nine in ten respondents knew th<strong>at</strong> the right to the NMW coversemployees from the first day <strong>of</strong> their employment. Around half (48 per cent)<strong>of</strong> those who gave the correct answer were sure about th<strong>at</strong> answer. SeeSection 3.5.1 for more inform<strong>at</strong>ion.6.3.2 A written st<strong>at</strong>ement <strong>of</strong> terms and conditions• 84 per cent <strong>of</strong> respondents were aware th<strong>at</strong> employers must provideemployees with a written st<strong>at</strong>ement <strong>of</strong> the terms and conditions <strong>of</strong> their job.See Section 2.4.3 for more inform<strong>at</strong>ion.• 37 per cent <strong>of</strong> respondents said th<strong>at</strong> they knew a lot about the detail <strong>of</strong> theright to have a written st<strong>at</strong>ement <strong>of</strong> terms and conditions. How muchrespondents who were aware <strong>of</strong> the right to a written st<strong>at</strong>ement <strong>of</strong> termsand conditions knew about the detail <strong>of</strong> th<strong>at</strong> right, varied by whether theyhad managerial/supervisory responsibilities. Those who had suchresponsibilities were more likely than those who did not to know a lot/a fairamount about the detail <strong>of</strong> a right: 72 per cent compared to 63 per cent.See Section 2.5.3 for more inform<strong>at</strong>ion.• An ‘awareness deficit’ was calcul<strong>at</strong>ed for each right: the proportion <strong>of</strong> allrespondents who were unaware th<strong>at</strong> a right was an actual legal oblig<strong>at</strong>ion,but felt th<strong>at</strong> it was very important for them to know about it. The right to awritten st<strong>at</strong>ement <strong>of</strong> terms and conditions had an awareness deficit <strong>of</strong> tenper cent <strong>of</strong> respondents. See Section 2.6 for more inform<strong>at</strong>ion.• Two per cent <strong>of</strong> respondents knew th<strong>at</strong> the right to a contract comes int<strong>of</strong>orce after employees have been with their employer for two months.Around a quarter (24 per cent) <strong>of</strong> those who got the answer right were sureabout their answer. See Section 3.5.1 for more inform<strong>at</strong>ion.• 13 per cent <strong>of</strong> respondents had experienced a problem in the past five yearsto do with receiving a contract or written st<strong>at</strong>ement <strong>of</strong> terms and conditions<strong>of</strong> their job. See Section 4.3 for more inform<strong>at</strong>ion.• One in ten respondents said th<strong>at</strong> their most serious problem <strong>at</strong> work in thepast five years was to do with receiving a contract or written st<strong>at</strong>ement <strong>of</strong>terms and conditions <strong>of</strong> their job. See Section 4.5 for more inform<strong>at</strong>ion.6.3.3 Complaints procedures• 81 per cent <strong>of</strong> respondents were aware th<strong>at</strong> employers had to follow a setprocedure when dealing with a complaint against employees. See Section2.4.3 for more inform<strong>at</strong>ion.• Just over a quarter <strong>of</strong> respondents (26 per cent) said they knew a lot aboutthe right to have a set disciplinary procedure. How much respondents whowere aware <strong>of</strong> the right to a set procedure to deal with a complaint against156
an employee knew about the detail <strong>of</strong> th<strong>at</strong> right, also varied by whetherthey had managerial/supervisory responsibilities. Those with such dutieswere, again, more likely to know about the detail, with 63 per cent knowinga lot/a fair amount, compared to 53 per cent <strong>of</strong> those without suchresponsibilities. Those who had experienced a problem in the past to do withtheir rights <strong>at</strong> work were also more likely to know about the detail <strong>of</strong> thisright: 60 per cent knowing a lot/a fair amount, compared to 55 per cent <strong>of</strong>those who had not had a problem. See Section 2.5.3 for more inform<strong>at</strong>ion.• An ‘awareness deficit’ was calcul<strong>at</strong>ed for each right: the proportion <strong>of</strong> allrespondents who were unaware th<strong>at</strong> a right was an actual legal oblig<strong>at</strong>ion,but felt th<strong>at</strong> it was very important for them to know about it. The right to aset disciplinary procedure had an awareness deficit <strong>of</strong> only one in tenrespondents. See Section 2.6 for more inform<strong>at</strong>ion.• Over nine out <strong>of</strong> ten respondents (93 per cent) were correct in thinking th<strong>at</strong>employees have the right to be accompanied to disciplinary or grievancehearings. When respondents who thought they would be entitled to takesomeone with them were asked who they could take with them, 96 per centcorrectly identified th<strong>at</strong> employees could take a trade union <strong>of</strong>ficer to suchhearings, and 82 per cent correctly identified th<strong>at</strong> employees could take awork colleague. However, over two-thirds <strong>of</strong> respondents (68 per cent)thought employees could take a solicitor, while just over one-third (37 percent) thought employees could take a friend or rel<strong>at</strong>ive who did not workwith them. Eighteen per cent got the answer exactly right and knewemployees were only entitled to take a trade union <strong>of</strong>ficer or a workcolleague with them. See Section 3.5.2 for more inform<strong>at</strong>ion.• Nine per cent <strong>of</strong> respondents had experienced a problem in the past fiveyears with their employer not following a set procedure when dealing with acomplaint against them or a problem with their performance <strong>at</strong> work. SeeSection 4.3 for more inform<strong>at</strong>ion.• Seven per cent <strong>of</strong> respondents said th<strong>at</strong> their most serious problem <strong>at</strong> workin the past five years had been to do with their employer not following a setprocedure when dealing with a complaint against them or a problem withtheir performance <strong>at</strong> work. See Section 4.5 for more inform<strong>at</strong>ion.• Four per cent <strong>of</strong> respondents who were employed <strong>at</strong> the time <strong>of</strong> the surveyfelt th<strong>at</strong> they were likely to experience a problem to do with disciplinary orgrievance issues in the next two years. Three per cent <strong>of</strong> respondents whothought they were likely to experience a problem in the next two years,thought th<strong>at</strong> the problem they were most likely to experience in the nexttwo years was one to do with disciplinary or grievance issues. See Section4.9 for more inform<strong>at</strong>ion.6.3.4 Grievance procedures• 78 per cent <strong>of</strong> respondents were aware th<strong>at</strong> employers had to follow a setprocedure when dealing with a grievance or other work-rel<strong>at</strong>ed problemswhich an employee has against the employer. See Section 2.4.3 for moreinform<strong>at</strong>ion.157
• A quarter <strong>of</strong> respondents said they knew a lot about the detail <strong>of</strong> the right tohave a set grievance procedure. See Section 2.5.3 for more inform<strong>at</strong>ion.• An ‘awareness deficit’ was calcul<strong>at</strong>ed for each right: the proportion <strong>of</strong> allrespondents who were unaware th<strong>at</strong> a right was an actual legal oblig<strong>at</strong>ion,but felt th<strong>at</strong> it was very important for them to know about it. The right to aset grievance procedure had an awareness deficit <strong>of</strong> one in ten respondents.See Section 2.6 for more inform<strong>at</strong>ion.• Over nine out <strong>of</strong> ten respondents (93 per cent) were correct in thinking th<strong>at</strong>employees have the right to be accompanied to disciplinary or grievancehearings. When respondents who thought they would be entitled to takesomeone with them were asked who they could take with them, 96 per centcorrectly identified th<strong>at</strong> employees could take a trade union <strong>of</strong>ficer to suchhearings, and 82 per cent correctly identified th<strong>at</strong> employees could take awork colleague. However, over two-thirds <strong>of</strong> respondents (68 per cent)thought employees could take a solicitor, while just over one-third (37 percent) thought employees could take a friend or rel<strong>at</strong>ive who did not workwith them. Eighteen per cent got the answer exactly right and knewemployees were only entitled to take a trade union <strong>of</strong>ficer or a workcolleague with them. See Section 3.5.2 for more inform<strong>at</strong>ion.• Nine per cent <strong>of</strong> respondents had experienced a problem in the past fiveyears, with their employer not following a set procedure when dealing with acomplaint against them or a problem with their performance <strong>at</strong> work. SeeSection 4.3 for more inform<strong>at</strong>ion.• Seven per cent <strong>of</strong> respondents said th<strong>at</strong> their most serious problem <strong>at</strong> workin the past five years had been to do with their employer not following a setprocedure when dealing with a complaint against them or a problem withtheir performance <strong>at</strong> work. See Section 4.5 for more inform<strong>at</strong>ion.• Four per cent <strong>of</strong> respondents who were employed <strong>at</strong> the time <strong>of</strong> the surveyfelt th<strong>at</strong> they were likely to experience a problem to do with disciplinary orgrievance issues in the next two years. Three per cent <strong>of</strong> respondents whothought they were likely to experience a problem in the next two years,thought th<strong>at</strong> the problem they were most likely to experience was one to dowith disciplinary or grievance issues. See Section 4.9 for more inform<strong>at</strong>ion.6.3.5 Unfair dismissal• 90 per cent <strong>of</strong> respondents were aware th<strong>at</strong> employers should not dismissan employee without having a fair reason for doing so. See Section 2.4.3 formore inform<strong>at</strong>ion.• 28 per cent <strong>of</strong> respondents said th<strong>at</strong> they knew a lot about the detail <strong>of</strong> theright not to be dismissed unfairly. How much respondents who were aware<strong>of</strong> the right not to be unfairly dismissed knew about the detail <strong>of</strong> th<strong>at</strong> right,again varied by whether they had managerial/supervisory responsibilities.Sixty-four per cent <strong>of</strong> those with such responsibilities knew a lot/a fairamount, compared to 60 per cent <strong>of</strong> those without such responsibilities. SeeSection 2.5.3 for more inform<strong>at</strong>ion.158
• An ‘awareness deficit’ was calcul<strong>at</strong>ed for each right: the proportion <strong>of</strong> allrespondents who were unaware th<strong>at</strong> a right was an actual legal oblig<strong>at</strong>ion,but felt th<strong>at</strong> it was very important for them to know about it. The right to aset disciplinary procedure had an awareness deficit <strong>of</strong> only six per cent <strong>of</strong>respondents. See Section 2.6 for more inform<strong>at</strong>ion.• Only six per cent <strong>of</strong> respondents knew th<strong>at</strong> the right to be covered by unfairdismissal laws comes into force after they have been with their employer forone year. Of those who did give the correct answer, only around one in five(21 per cent) were sure about their answer. Those aged 35 to 44 were mostlikely to get the answer right in rel<strong>at</strong>ion to unfair dismissal compared toother age groups. Those with managerial/supervisory responsibilities werealso more likely to get the answer right than those without suchresponsibilities, and those who thought th<strong>at</strong> their answer was right weremore likely than those who said they knew it was right, or th<strong>at</strong> it was just aguess, to get the answer correct. See Section 3.5.1 for more inform<strong>at</strong>ion.• Four per cent <strong>of</strong> respondents had experienced a problem in the past fiveyears to do with being unfairly dismissed. See Section 4.3 for moreinform<strong>at</strong>ion.• Four per cent <strong>of</strong> respondents said th<strong>at</strong> their most serious problem <strong>at</strong> work inthe past five years had been to do with being unfairly dismissed. SeeSection 4.5 for more inform<strong>at</strong>ion.6.3.6 Making a claim to an employment tribunal• 87 per cent <strong>of</strong> respondents thought th<strong>at</strong> employees had to put theircomplaint in writing before making a claim to an employment tribunal.When asked if employees had to inform Acas before making a claim, overone-third <strong>of</strong> respondents (38 per cent) incorrectly thought th<strong>at</strong> they didhave to do so. When asked if employees had to appoint a solicitor, 12 percent incorrectly thought th<strong>at</strong> they did. Only three per cent <strong>of</strong> respondentsincorrectly thought, when asked, th<strong>at</strong> employees did not need to take any <strong>of</strong>these actions before making a claim to an employment tribunal. Three percent <strong>of</strong> respondents said they did not know wh<strong>at</strong> an employee had to dobefore making a claim to an employment tribunal. See Section 3.5.3 formore inform<strong>at</strong>ion.• In all, just over half <strong>of</strong> respondents (52 per cent) knew th<strong>at</strong> employees onlyhad to put their claim in writing. Of those who got the answer right, twothirds(67 per cent) were sure about their answer. Those who were sureabout their answer were more likely to give the correct answer than thosewho only thought th<strong>at</strong> their response was right, or said it was just a guess.Those who felt well informed about their rights <strong>at</strong> work were more likelythan those who did not feel well informed to get the answer right, as werethose in the public sector compared with priv<strong>at</strong>e-sector workers, and thosewith managerial/supervisory duties, compared to those without suchresponsibilities. See Section 3.5.3 for more inform<strong>at</strong>ion.159
6.4 Discrimin<strong>at</strong>ion6.4.1 Sex discrimin<strong>at</strong>ion• 91 per cent <strong>of</strong> respondents were aware th<strong>at</strong> employers had a legaloblig<strong>at</strong>ion to ensure th<strong>at</strong> employees are not tre<strong>at</strong>ed unfairly because <strong>of</strong> theirsex. See Section 2.4.1 for more inform<strong>at</strong>ion.• 16 per cent <strong>of</strong> respondents knew hardly anything about the detail <strong>of</strong> theright not to be discrimin<strong>at</strong>ed against on the grounds <strong>of</strong> sex. See Section 2.5for more inform<strong>at</strong>ion.• An ‘awareness deficit’ was calcul<strong>at</strong>ed for each right: the proportion <strong>of</strong> allrespondents who were unaware th<strong>at</strong> a right was an actual legal oblig<strong>at</strong>ion,but felt th<strong>at</strong> it was very important for them to know about it. The right notto be discrimin<strong>at</strong>ed against on the grounds <strong>of</strong> sex had an awareness deficit<strong>of</strong> three per cent <strong>of</strong> respondents. See Section 2.6 for more inform<strong>at</strong>ion.• Over nine in ten respondents (93 per cent) knew th<strong>at</strong> the right to becovered by anti-discrimin<strong>at</strong>ion laws covers employees from the first day <strong>of</strong>their employment. See Section 3.5.1 for more inform<strong>at</strong>ion.• Two per cent <strong>of</strong> respondents had experienced a problem in the past fiveyears owing to being tre<strong>at</strong>ed unfairly because <strong>of</strong> their sex. See Section 4.3for more inform<strong>at</strong>ion.• Four per cent <strong>of</strong> respondents who were employed <strong>at</strong> the time <strong>of</strong> the surveyfelt they were likely to experience a problem to do with discrimin<strong>at</strong>ion in thenext two years. See Section 4.9 for more inform<strong>at</strong>ion.6.4.2 Race discrimin<strong>at</strong>ion• 94 per cent <strong>of</strong> respondents were aware th<strong>at</strong> employers had a legaloblig<strong>at</strong>ion to ensure th<strong>at</strong> employees are not tre<strong>at</strong>ed unfairly because <strong>of</strong> theirrace. See Section 2.4.1 for more inform<strong>at</strong>ion.• 17 per cent <strong>of</strong> respondents knew hardly anything about the detail <strong>of</strong> theright not to be discrimin<strong>at</strong>ed against on the grounds <strong>of</strong> race. See Section 2.5for more inform<strong>at</strong>ion.• An ‘awareness deficit’ was calcul<strong>at</strong>ed for each right: the proportion <strong>of</strong> allrespondents who were unaware th<strong>at</strong> a right was an actual legal oblig<strong>at</strong>ion,but felt th<strong>at</strong> it was very important for them to know about it. The right notto be discrimin<strong>at</strong>ed against on the grounds <strong>of</strong> race had an awareness deficit<strong>of</strong> two per cent <strong>of</strong> respondents. See Section 2.6 for more inform<strong>at</strong>ion.• Over nine in ten respondents (93 per cent) knew th<strong>at</strong> the right to becovered by anti-discrimin<strong>at</strong>ion laws covers employees from the first day <strong>of</strong>their employment. See Section 3.5.1 for more inform<strong>at</strong>ion.• Two per cent <strong>of</strong> respondents had experienced a problem in the past fiveyears owing to unfair tre<strong>at</strong>ment because <strong>of</strong> their race. See Section 4.3 formore inform<strong>at</strong>ion.160
• One per cent <strong>of</strong> respondents said th<strong>at</strong> their most serious problem <strong>at</strong> work inthe past five years had been to do with being tre<strong>at</strong>ed unfairly because <strong>of</strong>their race. See Section 4.5 for more inform<strong>at</strong>ion.• Four per cent <strong>of</strong> respondents who were employed <strong>at</strong> the time <strong>of</strong> the surveyfelt th<strong>at</strong> they were likely to experience a problem to do with discrimin<strong>at</strong>ionin the next two years. See Section 4.9 for more inform<strong>at</strong>ion.6.4.3 Disability discrimin<strong>at</strong>ion• 92 per cent <strong>of</strong> respondents were aware th<strong>at</strong> employers had a legaloblig<strong>at</strong>ion to ensure th<strong>at</strong> employees are not tre<strong>at</strong>ed unfairly because <strong>of</strong> theirdisability. See Section 2.4.1 for more inform<strong>at</strong>ion.• 16 per cent <strong>of</strong> respondents knew hardly anything about the detail <strong>of</strong> theright not to be discrimin<strong>at</strong>ed against on the grounds <strong>of</strong> disability. SeeSection 2.5 for more inform<strong>at</strong>ion.• An ‘awareness deficit’ was calcul<strong>at</strong>ed for each right: the proportion <strong>of</strong> allrespondents who were unaware th<strong>at</strong> a right was an actual legal oblig<strong>at</strong>ion,but felt th<strong>at</strong> it was very important for them to know about it. The right notto be discrimin<strong>at</strong>ed against on the grounds <strong>of</strong> disability had an awarenessdeficit <strong>of</strong> four per cent <strong>of</strong> respondents. See Section 2.6 for moreinform<strong>at</strong>ion.• Over nine in ten respondents (93 per cent) knew th<strong>at</strong> the right to becovered by anti-discrimin<strong>at</strong>ion laws covers employees from the first day <strong>of</strong>their employment. See Section 3.5.1 for more inform<strong>at</strong>ion.• Three per cent <strong>of</strong> respondents had experienced a problem in the last fiveyears owing to being tre<strong>at</strong>ed unfairly because <strong>of</strong> their disability. See Section4.3 for more inform<strong>at</strong>ion.• Two per cent <strong>of</strong> respondents said th<strong>at</strong> their most serious problem <strong>at</strong> work inthe past five years had been to do with being tre<strong>at</strong>ed unfairly because <strong>of</strong>their disability. See Section 4.5 for more inform<strong>at</strong>ion.• Four per cent <strong>of</strong> respondents who were employed <strong>at</strong> the time <strong>of</strong> the surveyfelt th<strong>at</strong> they were likely to experience a problem to do with discrimin<strong>at</strong>ionin the next two years. Two per cent <strong>of</strong> respondents who thought th<strong>at</strong> theywere likely to experience a problem in the next two years, thought th<strong>at</strong> theproblem they were most likely to experience in the next two years was oneto do with being discrimin<strong>at</strong>ed against on the grounds <strong>of</strong> disability. SeeSection 4.9 for more inform<strong>at</strong>ion.6.4.4 Discrimin<strong>at</strong>ion on the grounds <strong>of</strong> sexual orient<strong>at</strong>ion• 87 per cent <strong>of</strong> respondents were aware th<strong>at</strong> employers had a legaloblig<strong>at</strong>ion to ensure th<strong>at</strong> employees are not tre<strong>at</strong>ed unfairly because <strong>of</strong> theirsexual orient<strong>at</strong>ion. See Section 2.4.1 for more inform<strong>at</strong>ion.161
• 20 per cent <strong>of</strong> respondents knew hardly anything about the detail <strong>of</strong> theright not to be discrimin<strong>at</strong>ed against on the grounds <strong>of</strong> sexual orient<strong>at</strong>ion.See Section 2.5 for more inform<strong>at</strong>ion.• An ‘awareness deficit’ was calcul<strong>at</strong>ed for each right: the proportion <strong>of</strong> allrespondents who were unaware th<strong>at</strong> a right was an actual legal oblig<strong>at</strong>ion,but felt th<strong>at</strong> it was very important for them to know about it. The right notto be discrimin<strong>at</strong>ed against on the grounds <strong>of</strong> sexual orient<strong>at</strong>ion had anawareness deficit <strong>of</strong> four per cent <strong>of</strong> respondents. See Section 2.6 for moreinform<strong>at</strong>ion.• Over nine in ten respondents (93 per cent) knew th<strong>at</strong> the right to becovered by anti-discrimin<strong>at</strong>ion laws covers employees from the first day <strong>of</strong>their employment. See Section 3.5.1 for more inform<strong>at</strong>ion.• Four per cent <strong>of</strong> respondents who were employed <strong>at</strong> the time <strong>of</strong> the surveyfelt th<strong>at</strong> they were likely to experience a problem to do with discrimin<strong>at</strong>ionin the next two years. See Section 4.9 for more inform<strong>at</strong>ion.6.4.5 Discrimin<strong>at</strong>ion on the grounds <strong>of</strong> religion• 87 per cent <strong>of</strong> respondents were aware th<strong>at</strong> employers had a legaloblig<strong>at</strong>ion to ensure th<strong>at</strong> employees are not tre<strong>at</strong>ed unfairly because <strong>of</strong> theirreligion. See Section 2.4.1 for more inform<strong>at</strong>ion.• 19 per cent <strong>of</strong> respondents knew hardly anything about the detail <strong>of</strong> theright not to be discrimin<strong>at</strong>ed against on the grounds <strong>of</strong> religion. See Section2.5 for more inform<strong>at</strong>ion.• An ‘awareness deficit’ was calcul<strong>at</strong>ed for each right: the proportion <strong>of</strong> allrespondents who were unaware th<strong>at</strong> a right was an actual legal oblig<strong>at</strong>ion,but felt th<strong>at</strong> it was very important for them to know about it. The right notto be discrimin<strong>at</strong>ed against on the grounds <strong>of</strong> religion had an awarenessdeficit <strong>of</strong> four per cent <strong>of</strong> respondents. See Section 2.6 for moreinform<strong>at</strong>ion.• Over nine in ten respondents (93 per cent) knew th<strong>at</strong> the right to becovered by anti-discrimin<strong>at</strong>ion laws covers employees from the first day <strong>of</strong>their employment. See Section 3.5.1 for more inform<strong>at</strong>ion.• One per cent <strong>of</strong> respondents had experienced a problem in the past fiveyears owing to being tre<strong>at</strong>ed unfairly because <strong>of</strong> their religion. See Section4.3 for more inform<strong>at</strong>ion.• Four per cent <strong>of</strong> respondents who were employed <strong>at</strong> the time <strong>of</strong> the surveyfelt th<strong>at</strong> they were likely to experience a problem to do with discrimin<strong>at</strong>ionin the next two years. See Section 4.9 for more inform<strong>at</strong>ion.162
6.4.6 Age discrimin<strong>at</strong>ion (legisl<strong>at</strong>ion due to come into force in October2006)• 78 per cent <strong>of</strong> respondents incorrectly thought th<strong>at</strong> employers already had alegal oblig<strong>at</strong>ion to ensure th<strong>at</strong> employees are not tre<strong>at</strong>ed unfairly because <strong>of</strong>their age. See Section 2.4.1 for more inform<strong>at</strong>ion.• 19 per cent <strong>of</strong> respondents knew hardly anything about the detail <strong>of</strong> theright not to be discrimin<strong>at</strong>ed against on the grounds <strong>of</strong> age. See Section 2.5for more inform<strong>at</strong>ion.• Over nine in ten respondents (93 per cent) knew th<strong>at</strong> the right to becovered by anti-discrimin<strong>at</strong>ion laws covers employees from the first day <strong>of</strong>their employment. See Section 3.5.1 for more inform<strong>at</strong>ion.• Three per cent <strong>of</strong> respondents had experienced a problem in the past fiveyears owing to being tre<strong>at</strong>ed unfairly because <strong>of</strong> their age. See Section 4.3for more inform<strong>at</strong>ion.• Three per cent <strong>of</strong> respondents said th<strong>at</strong> their most serious problem <strong>at</strong> workin the past five years had been to do with being tre<strong>at</strong>ed unfairly because <strong>of</strong>their age. See Section 4.5 for more inform<strong>at</strong>ion.• Four per cent <strong>of</strong> respondents who were employed <strong>at</strong> the time <strong>of</strong> the surveyfelt th<strong>at</strong> they were likely to experience a problem to do with discrimin<strong>at</strong>ionin the next two years. Five per cent <strong>of</strong> respondents who thought th<strong>at</strong> theywere likely to experience a problem in the next two years, thought th<strong>at</strong> theproblem they were most likely to experience in the next two years was oneto do with being discrimin<strong>at</strong>ed against on the grounds <strong>of</strong> age. See Section4.9 for more inform<strong>at</strong>ion.163
7Concluding remarksThis study has covered a wide range <strong>of</strong> employment rights, with a complexresearch instrument, utilising a variety <strong>of</strong> measures <strong>of</strong> awareness, knowledgeand experience <strong>of</strong> employment rights. The main findings <strong>of</strong> the study havealready been presented in detail in the Executive summary, while Chapter 6presented findings by each employment right, so it is not the intention torepe<strong>at</strong> the findings again here. Instead, it is more useful to examine wh<strong>at</strong> canbe learned from the study in general terms about questions such as:• Which rights and entitlements are people most (and least) aware <strong>of</strong>?• Which groups in the economically active popul<strong>at</strong>ion are most (and least)aware and knowledgeable about their rights?• Who experiences problems <strong>at</strong> work and who resolves them?• Which sources <strong>of</strong> inform<strong>at</strong>ion and advice are most commonly used and aremost useful?Presented below are some preliminary interpret<strong>at</strong>ions <strong>of</strong> how some <strong>of</strong> the keyfindings address these issues.7.1 Which rights are people most (and least) aware <strong>of</strong>, orknowledgeable about?7.1.1 AwarenessSome areas <strong>of</strong> rights had higher levels <strong>of</strong> awareness in general terms thandid other areas, for example, rights to do with ensuring employees are notdiscrimin<strong>at</strong>ed against had higher levels <strong>of</strong> awareness than did most rights todo with having children and dependants. However, there was also vari<strong>at</strong>ionwithin areas <strong>of</strong> rights, with some rights having very high awareness levelsand some having much lower awareness levels. A key case <strong>of</strong> this was withrights to do with children and dependants, where the high level <strong>of</strong> awareness<strong>of</strong> ordinary m<strong>at</strong>ernity leave was in sharp contrast to the low level <strong>of</strong>awareness <strong>of</strong> parental leave. The rights which eight out <strong>of</strong> ten or morerespondents were aware <strong>of</strong> (in order <strong>of</strong> those with the highest levels <strong>of</strong>awareness first) were:• race discrimin<strong>at</strong>ion law• the NMW• disability discrimin<strong>at</strong>ion law164
• sex discrimin<strong>at</strong>ion law• unfair dismissal• ordinary m<strong>at</strong>ernity leave• sexual-orient<strong>at</strong>ion discrimin<strong>at</strong>ion law• religious discrimin<strong>at</strong>ion law• in-work rest breaks• right to a written st<strong>at</strong>ement <strong>of</strong> terms and conditions• paid holiday• set disciplinary procedure.These rights are a combin<strong>at</strong>ion <strong>of</strong> the longest standing (such as legisl<strong>at</strong>ionagainst gender and race discrimin<strong>at</strong>ion, and ordinary m<strong>at</strong>ernity leave), themore universally relevant (such as unfair dismissal, in-work rest breaks, theright to a contract, the right to paid holiday, and the right to have setdisciplinary procedure), and rights th<strong>at</strong> have had very recent publicity (suchas newer rights concerning discrimin<strong>at</strong>ion on the grounds <strong>of</strong> sexualorient<strong>at</strong>ion and religion). Other rights such as the NMW and legisl<strong>at</strong>ionagainst disability discrimin<strong>at</strong>ion are ones th<strong>at</strong> have had high levels <strong>of</strong>publicity since their introduction in the mid to l<strong>at</strong>e 1990s.There were only two rights th<strong>at</strong> less than half <strong>of</strong> respondents were aware <strong>of</strong>(in order <strong>of</strong> those with higher levels <strong>of</strong> awareness first):• time <strong>of</strong>f for dependants in an emergency• parental leave.Both <strong>of</strong> these rights will only be directly relevant to those with children anddependants, which may explain their low levels <strong>of</strong> awareness compared tomore universally relevant rights. However, these are the rights th<strong>at</strong> also havesome <strong>of</strong> the highest ‘awareness deficits’: where a sizeable proportion <strong>of</strong>respondents who were unaware <strong>of</strong> the right think th<strong>at</strong> it is very important forthem to know about it. Analysis shows th<strong>at</strong> it is not only those with currentfamily responsibilities, or who are planning a family soon, who see their lowawareness <strong>of</strong> these rights as a problem for them personally.7.1.2 KnowledgeAnalysis <strong>of</strong> the knowledge questions asked shows th<strong>at</strong> it is not the case th<strong>at</strong>substantive knowledge is high in particular areas <strong>of</strong> rights compared toothers, instead, within an area <strong>of</strong> rights (such as the NMW) substantiveknowledge is high for some specific questions, and low for others. This isbecause substantive knowledge depends on the type, and <strong>of</strong>ten specificity, <strong>of</strong>the question asked, as well as on a good general knowledge <strong>of</strong> the right inquestion. Where respondents were asked questions th<strong>at</strong> made it necessary165
for them to provide an exact r<strong>at</strong>e (for the NMW), an exact number <strong>of</strong> hours(for rest breaks and the working time limit), or an exact number <strong>of</strong> days (forentitlements to days <strong>of</strong>f in a 14-day period), substantive knowledge (thosegetting the answer exactly right) is perhaps understandably lower than it isfor other types <strong>of</strong> knowledge questions. For most respondents this may beunproblem<strong>at</strong>ic as it can be seen as more useful and practical for the majority<strong>of</strong> employees to have a broad general knowledge <strong>of</strong> their employment rightsand where to find out more about them r<strong>at</strong>her than to have a very detailedknowledge <strong>of</strong> specific areas <strong>of</strong> entitlement. Arguably, the need for a moredetailed understanding comes <strong>at</strong> the point <strong>at</strong> which an individual’s rights areunder thre<strong>at</strong>. Therefore, workers who are most vulnerable to exploit<strong>at</strong>ion <strong>at</strong>work have a gre<strong>at</strong>er need for this detailed level <strong>of</strong> knowledge. However, aswe discuss below, it is such workers who are <strong>at</strong> gre<strong>at</strong>est risk <strong>of</strong> having thelow levels <strong>of</strong> knowledge <strong>of</strong> key employment rights.Questions where the level <strong>of</strong> substantive knowledge was high, with morethan nine out <strong>of</strong> ten <strong>of</strong> respondents getting the answer to a knowledgequestion exactly right (in order <strong>of</strong> those with higher levels <strong>of</strong> knowledge first)were:• whether 22 to 64 year olds are covered by the NMW• the point <strong>at</strong> which being covered by the NMW comes into force• whether 18 to 21 year olds are covered by the NMW• whether employees have the right to be accompanied to disciplinary orgrievance proceedings• the point <strong>at</strong> which anti-discrimin<strong>at</strong>ion legisl<strong>at</strong>ion comes into force.There were also questions where the level <strong>of</strong> substantive knowledge was low,with fewer than one in ten respondents getting the answer to a knowledgequestion exactly right (in order <strong>of</strong> those with higher levels <strong>of</strong> knowledgefirst):• how many hours employees had to work before being entitled to in-workrest breaks• the NMW r<strong>at</strong>e for 16 and 17 year olds• the point <strong>at</strong> which being covered by unfair dismissal laws comes into force• the NMW r<strong>at</strong>e for 18 to 21 year olds• the point <strong>at</strong> which the right to a contract comes into force.A key fe<strong>at</strong>ure which emerges from comparisons <strong>of</strong> awareness and knowledge,is th<strong>at</strong> high levels <strong>of</strong> awareness <strong>of</strong> the existence <strong>of</strong> a right do not alwaystransl<strong>at</strong>e into substantive knowledge <strong>of</strong> its provisions. This is particularlyclear in the case <strong>of</strong> the right to a written contract, where awareness wasrel<strong>at</strong>ively high, and knowledge <strong>of</strong> when the right came into force rel<strong>at</strong>ivelylow.166
7.2 Which groups are most (and least) aware <strong>of</strong>, orknowledgeable about, their rights?There is no conclusive evidence, either from the detailed analysis <strong>of</strong>awareness and knowledge <strong>of</strong> individual rights, or from the aggreg<strong>at</strong>e analysis<strong>of</strong> general awareness, th<strong>at</strong> specific personal or employment characteristics,or experience <strong>of</strong> problems, are unambiguously associ<strong>at</strong>ed with higher orlower levels <strong>of</strong> awareness and/or knowledge <strong>of</strong> employment rights. Theregression analysis conducted on general awareness confirms th<strong>at</strong> there arefew personal or employment characteristics which consistently andsignificantly influence awareness in a given direction. This is furthercomplic<strong>at</strong>ed by apparent inconsistencies in some <strong>of</strong> the d<strong>at</strong>a: in some places,a given characteristic is associ<strong>at</strong>ed with higher levels <strong>of</strong> awareness orknowledge, while in others it is associ<strong>at</strong>ed with lower levels.The most th<strong>at</strong> can be done here, is therefore to highlight factors th<strong>at</strong> appearto be important more <strong>of</strong>ten than others in influencing awareness andknowledge, particularly by focusing on the regression analysis conducted ongeneral awareness, and the development <strong>of</strong> an awareness score andknowledge score.Higher levels <strong>of</strong> awareness and knowledge were not consistently associ<strong>at</strong>edwith groups th<strong>at</strong> the right in question may be most relevant for. It shouldalso be noted th<strong>at</strong> those with experience <strong>of</strong> problems, fairly consistentlythroughout the survey, were likely to have lower levels <strong>of</strong> awareness orknowledge than those who had not experienced such problems. This may bebecause having had a problem <strong>at</strong> work made them more aware <strong>of</strong> the limitsto their awareness and knowledge <strong>of</strong> employment rights than otherrespondents.7.2.1 Those who may be more likely to have higherawareness/knowledge levelsGroups emerge from the bivari<strong>at</strong>e analysis on the development <strong>of</strong> anawareness score as being more likely to score in the top ten per cent <strong>of</strong>respondents and, therefore, have a gre<strong>at</strong>er awareness <strong>of</strong> their rights. Thesewere those:• in an organis<strong>at</strong>ion with an HR department• with managerial/supervisory duties• who had not experienced a problem to do with their rights <strong>at</strong> work in thepast• in workplaces with 100 or more staff• who felt well informed about their rights <strong>at</strong> work• who felt th<strong>at</strong> they knew as much as they needed to know about their rights<strong>at</strong> work.167
Groups emerge from the bivari<strong>at</strong>e analysis on the development <strong>of</strong> aknowledge score as being more likely to score in the top ten per cent <strong>of</strong>respondents and, therefore, have a gre<strong>at</strong>er knowledge <strong>of</strong> their rights. Thesewere those:• aged 45 to 54• who worked full-time• with an HR department• with managerial/supervisory duties• who felt well informed about their rights <strong>at</strong> work.Regression analysis showed th<strong>at</strong> the following factors all increased the odds<strong>of</strong> someone being generally aware <strong>of</strong> their employment rights:• having a dependent child• being a trade union/staff associ<strong>at</strong>ion member• earning between £10,000 and £39,999 per year• having ‘higher’ qualific<strong>at</strong>ions (specifically, having a highest qualific<strong>at</strong>ion levelth<strong>at</strong> is NVQ2 or equivalent, NVQ4 or equivalent, or NVQ5 or equivalent).This analysis together suggests th<strong>at</strong> it is the groups th<strong>at</strong> may be lessvulnerable with higher awareness and knowledge levels <strong>of</strong> their rights <strong>at</strong> workth<strong>at</strong> do in fact seem to have higher awareness and knowledge.7.2.2 Those who may be less likely to have higherawareness/knowledge levelsGroups emerge from the bivari<strong>at</strong>e analysis on the development <strong>of</strong> anawareness score as being more likely to score in the bottom ten per cent <strong>of</strong>respondents and, therefore, have a lower awareness <strong>of</strong> their rights. Thesewere those:• aged under 21, or aged 55 and over• without an HR department• without managerial/supervisory responsibilities• who are non-members <strong>of</strong> trade unions/staff associ<strong>at</strong>ions• who had opted-out <strong>of</strong> the working time limit• in organis<strong>at</strong>ions with ten to 24 employees• who said th<strong>at</strong> they could do with knowing more about their rights <strong>at</strong> work• who did not feel well informed about their rights.168
Groups emerge from the bivari<strong>at</strong>e analysis on the development <strong>of</strong> aknowledge score as being more likely to score in the bottom ten per cent <strong>of</strong>respondents and, therefore, have a lower-level knowledge <strong>of</strong> their rights.These were those:• aged under 21, or aged 55 and over• earning under £5,000 per year• who had not experienced a problem to do with their rights <strong>at</strong> work• who felt th<strong>at</strong> they could do with knowing more about their rights <strong>at</strong> work.Regression analysis showed th<strong>at</strong> the following factor decreased the odds <strong>of</strong>someone being generally aware <strong>of</strong> their employment rights:• having experienced a problem <strong>at</strong> work in the past five years.This analysis suggests th<strong>at</strong> it is the groups <strong>of</strong> workers th<strong>at</strong> may be morevulnerable and have low awareness and knowledge levels <strong>of</strong> their rights <strong>at</strong>work th<strong>at</strong> do in fact seem to have lower awareness and knowledge.7.3 Which sources <strong>of</strong> inform<strong>at</strong>ion and advice are mostcommonly used and most useful?Managers <strong>at</strong> work, trade-union represent<strong>at</strong>ives, Personnel/HR <strong>of</strong>ficers andother colleagues <strong>at</strong> work seem to be the main sources <strong>of</strong> advice used byrespondents who had had a problem <strong>at</strong> work. This highlights the fact th<strong>at</strong>most respondents look within the workplace to get inform<strong>at</strong>ion and advicewhen faced with a problem. Those respondents who had a problem andsought advice found solicitors and trade-union represent<strong>at</strong>ives to be the mostuseful source <strong>of</strong> advice.Respondents were asked about future problems th<strong>at</strong> they felt likely toexperience. In this case they said th<strong>at</strong> they would mainly seek advice fromtrade-union represent<strong>at</strong>ives, the CAB, a Personnel/HR <strong>of</strong>ficer, or a manager.When asked where they would go in the future to get general inform<strong>at</strong>ionabout rights <strong>at</strong> work, respondents would first turn to a Personnel/HR <strong>of</strong>ficer,a manager <strong>at</strong> work, the Internet, the CAB or a trade union. If they did notget the inform<strong>at</strong>ion th<strong>at</strong> they wanted from the first source, their next port <strong>of</strong>call would be the CAB. This shows th<strong>at</strong> for possible future problems, orgenerally needing inform<strong>at</strong>ion, respondents are more likely to say they woulduse a mixture <strong>of</strong> sources from both inside and outside the workplace thanrestricting themselves to within the workplace.Respondents were very evenly divided over wh<strong>at</strong> they thought the mostuseful inform<strong>at</strong>ion service would be to them personally if they neededinform<strong>at</strong>ion about their rights <strong>at</strong> work; between a dedic<strong>at</strong>ed website, ahelpline similar to NHS Direct, or a booklet given to all employees.169
7.4 Who experiences problems <strong>at</strong> work and who resolvesthem?Regression analysis showed th<strong>at</strong> the following factors increased the odds <strong>of</strong>having had a problem <strong>at</strong> work:• having a long-term health problem or disability• being ‘separ<strong>at</strong>ed/divorced’• being in a ‘sales and customer services’ or ‘pr<strong>of</strong>essional’ occup<strong>at</strong>ion(compared to being in an ‘elementary’ occup<strong>at</strong>ion)• being a trade union/staff associ<strong>at</strong>ion member.The following factors decreased the odds <strong>of</strong> having had a problem <strong>at</strong> work:• being ‘aware’ <strong>of</strong> their employment rights• an increase in age by one year.Regression analysis was also conducted to examine wh<strong>at</strong> factors influencedthe odds <strong>of</strong> a problem <strong>at</strong> work being resolved s<strong>at</strong>isfactorily. The followingfactors increased the odds <strong>of</strong> resolving a problem s<strong>at</strong>isfactorily:• being a trade union/staff associ<strong>at</strong>ion member• being ‘aware’ in general <strong>of</strong> their employment rights• discussing the problem with their employer face to face.This analysis suggests th<strong>at</strong> being a trade union member and being aware <strong>of</strong>their employment rights, may, to some extent, protect employees fromhaving problems in the first place, and then help them resolve them.Further analysis <strong>of</strong> the themes developed in this report is needed in order todetermine whether there is a link between detailed knowledge <strong>of</strong> specificemployment rights (r<strong>at</strong>her than simply general awareness) and the likelihoodth<strong>at</strong> an individual will avoid or resolve problems <strong>at</strong> work.170
8Appendix 1:Description <strong>of</strong> sampleIn this appendix some <strong>of</strong> the key characteristics <strong>of</strong> the survey <strong>of</strong> respondentsare summarised, distinguishing between:• personal characteristics• family and household characteristics• characteristics <strong>of</strong> respondent’s employer• characteristics <strong>of</strong> respondent’s job• details <strong>of</strong> respondent’s employment.171
Table A1.1: Personal characteristics%Age 16-24 15.925-34 23.535-44 26.545-54 22.055-64 12.0No answer 0.0Gender Male 51.6Female 48.4Whether has long-term health Yes 9.1problems/disabilitiesNo 90.7No answer 0.2Religion Christian 72.5Hindu 0.5Jewish 0.2Muslim 1.4Sikh 0.7Other 0.5No religion 24.1Sexual orient<strong>at</strong>ion* Straight/heterosexual 98.9Gay/lesbian/homosexual* 0.6Bisexual/other* 0.3No answer 0.2Ethnic origin White 93.2non-White 6.8No answer 0.1Highest qualific<strong>at</strong>ion No qualific<strong>at</strong>ions 12.8NVQ 1 7.2NVQ 2 18.1NVQ 3 23.4NVQ 4 28.0NVQ 5 8.0No answer 2.5Note: Unweighted base = 1,038. *There were seven unweighted cases (seven weighted cases) <strong>of</strong> gay/lesbian/homosexual in the sample and four unweighted cases (three weighted cases) <strong>of</strong> bisexual/other. ‘No answer’includes those who don’t know, refused to answer and whose answers are missing.Source: IES/BMRB, 2005172
Table A1.2: Family and household characteristics%Whether has dependent children Yes 40.9No 59.1Whether children aged 0-5 yrs Yes 19.2No 80.8Language spoken <strong>at</strong> home English 95.7Not English 4.3Caring/ support responsibilities Yes 13.4for family or friendsNo 86.6Marital st<strong>at</strong>us Single 24.2Married or cohabiting 66.2Separ<strong>at</strong>ed or divorced 8.8Widowed 0.8Housing Tenure Owned outright 14.9Buying with the help <strong>of</strong> a mortgage or loan 56.6Pay part rent and part mortgage 0.4Rent from local council, housingassoci<strong>at</strong>ion or registered landlord8.5Rent from priv<strong>at</strong>e landlord 10.4Live rent free 8.0Pay rent to parents/a rel<strong>at</strong>ive 0.6Other answer 0.2No answer 0.5Note: Unweighted base = 1,038. ‘No answer’ includes those who don’t know, refused to answer and whose answersare missing.Source: IES/BMRB, 2005173
Table A1.3: Characteristics <strong>of</strong> employer%Sector Primary & extractive 1.2Manufacturing, utilities & construction 16.3Distribution, c<strong>at</strong>ering, transport etc. 25.4Business and financial services 13.6Public admin, educ<strong>at</strong>ion & health 31.5Other services 3.3No answer 8.7Type <strong>of</strong> organis<strong>at</strong>ion Public sector 30.1Priv<strong>at</strong>e sector 66.3Voluntary or charitable 3.3No answer 0.2Number <strong>of</strong> employees inworkplaceTrade union presence in theworkplace?Whether has HR/ personneldepartment?Whether has equalopportunities policyWhether has a writtendisciplinary procedureWhether has a writtengrievance procedure1 to 9 14.510 to 24 16.525 to 99 24.5100 to 499 22.6500+ 19.8No answer 2.2Yes 48.2No 44.8No answer 7.0Yes 69.9No 25.4No answer 4.7Yes 74.8No 9.8No answer 15.4Yes 80.9No 10.5No answer 8.6Yes 76.4No 12.0No answer 11.6Note: Unweighted base = 1,038. ‘No answer’ includes those who don’t know, refused to answer and whose answersare missing.Source: IES/BMRB, 2005174
Table A1.4: Characteristics <strong>of</strong> respondent’s job%Occup<strong>at</strong>ion Elementary occup<strong>at</strong>ions 12.9Process, plant and machine opps 6.7Sales and customer services 8.8Personal services 8.9Skilled trades 9.5Admin and secretarial 13.3Associ<strong>at</strong>e pr<strong>of</strong>essional and technical 14.6Pr<strong>of</strong>essionals 1.6Managers and senior <strong>of</strong>ficials 13.8No answer 9.8Managerial/supervisory duties Yes 37.6No 62.4Note: Unweighted base = 1,038. ‘No answer’ includes those who don’t know, refused to answer and whose answersare missing.Source: IES/BMRB, 2005175
Table A1.5: Details <strong>of</strong> respondent’s employment%Earnings per year Under £15,000 38.8£15,000 to £24,999 25.6£25,000 to £39,999 17.1£40,000 + 7.5No answer 11.0Hours worked Full-time 77.5Part-time 21.9Varies 0.6<strong>Employment</strong> st<strong>at</strong>us Permanent 94.2Not permanent 5.6<strong>of</strong> which:Seasonal work 0.6Contracted for fixed period or task 1.7Agency temping 1.2Casual type <strong>of</strong> work 1.3Other 0.5Don’t know 0.2No answer 0.2Whether member <strong>of</strong> TU/staff assoc. Yes 29.6No 69.6No answer 0.9Written contract <strong>of</strong> terms and Yes 81.9conditions provided when startedemployment?No 16.4No answer 1.7Whether signed opt-outYes 13.9agreement?No 82.1No answer 4.0Whether does on-call working Yes 15.7No 84.0No answer 0.4Whether works over 48 hours a Yes* 18.5weekNo 77.8No answer 3.7Note: Unweighted base = 1,038. ‘No answer’ includes those who don’t know, refused to answer and whose answersare missing. *This compares to WERS, th<strong>at</strong> found th<strong>at</strong> 11 per cent <strong>of</strong> employees usually worked more than 48hours a week (Kersley et al., 2005). The LFS figure is approxim<strong>at</strong>ely 13 per cent.Source: IES/BMRB, 2005176
Appendix 2: Regressionmethodology andresultsIntroductionThis report has looked <strong>at</strong> the ways in which various measures <strong>of</strong> awareness andknowledge among our respondents varies with their personal and employmentcharacteristics and experiences. It has also looked <strong>at</strong> how the likelihood <strong>of</strong>experiencing a problem, the number <strong>of</strong> these problems experienced, andwhether advice for these problems is sought, varies with the personal andemployment characteristics <strong>of</strong> respondents. The analysis throughout the reporthas been mainly bivari<strong>at</strong>e in n<strong>at</strong>ure, looking <strong>at</strong> the rel<strong>at</strong>ionship betweenawareness/knowledge/problems and the other variables individually. However,this analysis is unable to go beyond the d<strong>at</strong>a observed and formul<strong>at</strong>e a modelwhich can predict the outcome from these variables. For this, regressionanalysis is needed, which looks <strong>at</strong> the ability <strong>of</strong> a factor, or set <strong>of</strong> factors, topredict an outcome, such as the level <strong>of</strong> awareness/knowledge/problems. Forexample, if it is found th<strong>at</strong> awareness or knowledge varies with the respondent’searnings and with the respondent’s occup<strong>at</strong>ion, it remains unclear from bivari<strong>at</strong>eanalysis to wh<strong>at</strong> extent the level <strong>of</strong> awareness or knowledge can in fact bepredicted by these two factors.Further, regression analysis makes it possible to identify where variablesthemselves might be rel<strong>at</strong>ed. For example, if whether or not the respondent hasexperienced a problem varies with gender, but also with whether they work full-/part-time, bivari<strong>at</strong>e analyses cannot disentangle the two rel<strong>at</strong>ionships; giventhere is likely to be a strong rel<strong>at</strong>ionship which also exists between gender andfull-/part-time working, whereas, regression analysis can produce collinearitydiagnostics, which can be used to identify if there is a problem <strong>of</strong> multicollinearitypresent in the model which needs to be addressed.In this appendix, therefore, some regression models <strong>of</strong> general awareness,problems, and whether problems were resolved s<strong>at</strong>isfactorily are examined.Given the rel<strong>at</strong>ively small size <strong>of</strong> the overall sample, dependent variableshave been chosen which are based on questions which were asked <strong>of</strong> thewhole sample <strong>of</strong> 1,038 cases. However, in the case <strong>of</strong> whether a problem,once experienced, was resolved s<strong>at</strong>isfactorily or not, the sample is reduced to259 weighted cases (242 unweighted). This sample is made up <strong>of</strong> those whohave had a problem which is no longer ongoing. Although the sample size issmall, it is useful to discover wh<strong>at</strong> factors predict whether or not a problem isresolved s<strong>at</strong>isfactorily, and to compens<strong>at</strong>e for the reduced sample size the177
number <strong>of</strong> independent variables has been limited. 37 Nonetheless, it isimportant to remember the small sample size when looking <strong>at</strong> the results forthis regression model. In summary, the analysis is restricted to:• a measure <strong>of</strong> self-assessed general awareness <strong>of</strong> employment rights• a measure <strong>of</strong> (prompted 38 ) experience <strong>of</strong> problems <strong>at</strong> work in the past fiveyears• a measure <strong>of</strong> whether problems were resolved s<strong>at</strong>isfactorily. This wasobtained by combining the questions: is the problem/dispute now over;whether a respondent resigned/left as result <strong>of</strong> the problem; and how theproblem was resolved if the respondent did not leave as a result <strong>of</strong> theproblem.One other point to note is th<strong>at</strong> there were some respondents who refused todivulge their earnings and by including earnings, the sample size wasreduced by approxim<strong>at</strong>ely 70. However, this number is rel<strong>at</strong>ively small, andby including earnings as an independent variable in the general awarenessregression, the model is improved (this was concluded by looking <strong>at</strong> theclassific<strong>at</strong>ion table 39 ).Logistic regressionThe technique used is logistic regression, where the dependent variable iscoded 1 or 0. For example, if the respondent is c<strong>at</strong>egorised as ‘aware’ this iscoded as 1, and coded as 0 if they are ‘not aware’. The st<strong>at</strong>istical model isestim<strong>at</strong>ed with a range <strong>of</strong> independent variables and assesses the effect <strong>of</strong>changing one <strong>of</strong> the independent variables on the odds 40 <strong>of</strong> the respondentbeing, for example, aware. In the models presented in the following threetables, one c<strong>at</strong>egory <strong>of</strong> each <strong>of</strong> the independent variables is chosen as thereference c<strong>at</strong>egory (thus, in the case <strong>of</strong> gender, the reference c<strong>at</strong>egory ismale, in the case <strong>of</strong> qualific<strong>at</strong>ions the reference c<strong>at</strong>egory is having no37 Reducing the number <strong>of</strong> independent variables increases the number <strong>of</strong> degrees <strong>of</strong>freedom just as increasing the sample size does. Also, as a guide, one st<strong>at</strong>isticaltext book (Tabachnick et al., 1996, p 132) suggests the sample size should begre<strong>at</strong>er than or equal to 50 plus eight times the number <strong>of</strong> independent variables(N≥50 +(8*no. IVs)). Therefore, if you have a smaller sample size you shouldendeavour to reduce the number <strong>of</strong> independent variables.38 Chapter 4 details how this question was asked.39 The classific<strong>at</strong>ion table for the general awareness regression shows th<strong>at</strong> withoutearnings, 68.2 per cent <strong>of</strong> the observed results are correctly predicted by themodel. However, with earnings, 69.7 per cent are correctly predicted. Also, byincluding earnings, even though the sample size decreases, the percentage <strong>of</strong>respondents with different employment and personal characteristics in the sampleremains similar to when earnings are excluded, eg percentage <strong>of</strong> Whiterespondents compared to percentage <strong>of</strong> non-White respondents is still similar etc.40 Odds in this context are just an altern<strong>at</strong>ive way <strong>of</strong> representing probabilities, so ifthe probability <strong>of</strong> the respondent being aware is ten per cent, the odds are nine toone against or 0.11.178
qualific<strong>at</strong>ions etc.). The co-efficient [Exp (B)] for the reference c<strong>at</strong>egory is setto 1.0 and the co-efficients for other values <strong>of</strong> the variable are interpretedrel<strong>at</strong>ive to this reference c<strong>at</strong>egory. A co-efficient gre<strong>at</strong>er than 1.0 means th<strong>at</strong>the value <strong>of</strong> the variable in question increases the odds <strong>of</strong> the individualbeing aware compared with the reference c<strong>at</strong>egory; a co-efficient <strong>of</strong> less than1.0 means th<strong>at</strong> the odds are reduced compared with the reference c<strong>at</strong>egory.There are three tables below which report the results from the three separ<strong>at</strong>elogistic regressions which have been estim<strong>at</strong>ed. The three dependentvariables used are:• general self-assessed awareness (coded 1 if respondent says they feel theyare ‘very well informed’ or ‘well informed’ about their rights <strong>at</strong> work, coded0 if they say they are ‘not very well informed’ or ‘not well informed <strong>at</strong> all’)• prompted experience <strong>of</strong> problems <strong>at</strong> work in the past five years (coded 1 ifthe respondent has experienced a problem, coded 0 if they have not)• whether a problem <strong>at</strong> work, if experienced, was resolved s<strong>at</strong>isfactorily(coded 1 if it was resolved s<strong>at</strong>isfactorily; the respondent said the problemwas resolved as ‘my employer took action to resolve my problem’, ‘I tookaction to address my employer’s problem’, or ‘my employer and I came to acompromise’. Coded 0 if it was not resolved s<strong>at</strong>isfactorily; the respondentsaid, when asked how the problem was resolved, th<strong>at</strong> the outcome was‘nothing/just went on as before/forgot about it’, or the respondent said theproblem was now over and they had left their job as a result <strong>of</strong> it 41 ).The independent variables used in each logistic regression are detailed in therelevant tables <strong>of</strong> results. They vary slightly for each logistic regression. Ineach case, the independent variables are grouped into two broad c<strong>at</strong>egories<strong>of</strong> factors which might be hypothesised to influence levels <strong>of</strong> awareness,experience <strong>of</strong> problems, or whether a problem is resolved s<strong>at</strong>isfactorily:• personal characteristics <strong>of</strong> the respondent• characteristics rel<strong>at</strong>ed to the respondent’s employment.There are also additional independent variables which are not included ineither <strong>of</strong> the above c<strong>at</strong>egories which are included in different logisticregressions. For example, the respondent’s experience <strong>of</strong> problems <strong>at</strong> work isan additional independent variable in the general awareness logisticregression. These additional independent variables are shown in the relevanttables <strong>of</strong> results and explained in the following sections. The followingsections also highlight, for each <strong>of</strong> the three logistic regressions, how well the41 The other answers th<strong>at</strong> were given, when asked how the problem was resolved: ‘Imoved jobs within the organis<strong>at</strong>ion’, ‘someone else resigned/was dismissed’, ‘Ileft/resigned/changed jobs (not necessarily as a direct result <strong>of</strong> the problem)’, and‘other answers’, were not used to classify respondents as ‘resolved s<strong>at</strong>isfactorily’or not. Those who gave these answers were not included in the sample as theiranswers were too ambiguous. Further, they only numbered 28 weighted (29unweighted).179
model fits the d<strong>at</strong>a 42 , which is important in order to contextualise howrelevant the significant results obtained are. This is followed by the significantresults 43 , and collinearity diagnostics which give an indic<strong>at</strong>ion <strong>of</strong> whether ornot variables are correl<strong>at</strong>ed severely with each other 44 . This is important assevere collinearity or multi-collinearity adversely affects the model’s results;specifically, it can lead to wrongly concluding th<strong>at</strong> the co-efficients <strong>of</strong>independent variables are not significant.General awareness logistic regressionThe independent variables used in this regression are detailed in Table A2.2.They include personal characteristics, employment characteristics, andrespondents’ experience <strong>of</strong> problems <strong>at</strong> work in the past five years. Thefollowing sub-sections highlight to wh<strong>at</strong> extent the logistic regression modelfits the d<strong>at</strong>a, the co-efficients which are st<strong>at</strong>istically significant, and whetheror not severe multi-collinearity is present.8.1.1 Accuracy <strong>of</strong> the modelThe classific<strong>at</strong>ion table below shows th<strong>at</strong> the model predicts correctly 69.7per cent <strong>of</strong> wh<strong>at</strong> is observed in the d<strong>at</strong>a; the model correctly classifies 69.7per cent <strong>of</strong> employees.42 In order to assess how well the model fits the d<strong>at</strong>a, SPSS using Complex Samples,produces two sets <strong>of</strong> st<strong>at</strong>istics. One is pseudo R 2 values which aim to explain howmuch <strong>of</strong> the vari<strong>at</strong>ion in the dependent variable, in this case general awareness, isexplained by the vari<strong>at</strong>ion in the independent variables. However, there is noagreement as to which <strong>of</strong> these values is the right one to use as there areproblems with each <strong>of</strong> them. For example, the Cox and Snell st<strong>at</strong>istic has amaximum which is generally under 1, therefore, it tends to lead to reduced valuescloser to 0, which may wrongly suggest th<strong>at</strong> the model is not a good fit to thed<strong>at</strong>a. The second value is the Nagelkerke st<strong>at</strong>istic which aims to correct the Coxand Snell so it can take the value <strong>of</strong> 1. However, this value also tends to be low,therefore resulting in wrongly suggesting the model is not a good fit to the d<strong>at</strong>a.As a result, the st<strong>at</strong>istics are reported, but are not used to analyse how well themodel fits the d<strong>at</strong>a. Instead, to indic<strong>at</strong>e model fit, the result from the classific<strong>at</strong>iontable reported by SPSS is reported, which indic<strong>at</strong>es the percentage <strong>of</strong> the time themodel correctly predicts wh<strong>at</strong> is observed in the d<strong>at</strong>a.43 The level <strong>of</strong> significance we are using for all our logistic regression tests <strong>of</strong>significance is ten per cent.44 Severe multi-collinearity is generally defined as the correl<strong>at</strong>ion co-efficientbetween two variables being gre<strong>at</strong>er than 0.8 (Carter Hill et al., 2001: 190). Or bylooking <strong>at</strong> collinearity st<strong>at</strong>istics produced by linear regression in SPSS and lookingfor tolerance levels less than 0.1 or VIF values gre<strong>at</strong>er than ten (Field A, 2000:201). This is wh<strong>at</strong> has been used to test for severe multi-collinearity in thisappendix.180
Table A2.1: General awareness, classific<strong>at</strong>ion tablePredictedObserved Not aware Aware Correct %Not aware 95.484 167.406 36.3Aware 54.410 414.839 88.4Overall per cent 20.5 79.5 69.7Note: The number <strong>of</strong> cases is 725 (unweighted); 732 (weighted).Source: IES/BMRB, 2005For reference purposes, the Cox and Snell st<strong>at</strong>istic is 0.127 and theNagelkerke st<strong>at</strong>istic is 0.175. However, as explained earlier 45 , these valuesare only ‘approxim<strong>at</strong>ely’ accur<strong>at</strong>e; therefore, they cannot be used to identifyhow much <strong>of</strong> the vari<strong>at</strong>ion in general awareness is explained by theindependent variables.8.1.2 Personal characteristics th<strong>at</strong> were significantHaving a dependent child 46 increases the odds <strong>of</strong> a respondent assessingthemselves as being aware <strong>of</strong> their employment rights. A respondent who hasa dependent child is 1.6 times more likely, compared to a respondent withouta dependent child, to feel they are aware <strong>of</strong> their employment rights.The highest qualific<strong>at</strong>ion level a respondent has achieved appears to alsoaffect the likelihood <strong>of</strong> a respondent assessing themselves as aware <strong>of</strong> theiremployment rights. The general p<strong>at</strong>tern is th<strong>at</strong>, compared with someone inthe ‘no qualific<strong>at</strong>ions’ c<strong>at</strong>egory, respondents who are more ‘highly’ qualifiedare more likely to say they are aware <strong>of</strong> their employment rights. Thus, theodds <strong>of</strong> feeling you are aware are gre<strong>at</strong>est if a respondent’s highestqualific<strong>at</strong>ion level is NVQ level 5 or equivalent, followed by NVQ level 4 orequivalent, followed by NVQ level 2 or equivalent (the co-efficients for theother c<strong>at</strong>egories are not st<strong>at</strong>istically significant).8.1.3 <strong>Employment</strong> characteristics th<strong>at</strong> were significantBeing a trade union/staff associ<strong>at</strong>ion member increases the odds <strong>of</strong> arespondent c<strong>at</strong>egorising themselves as aware <strong>of</strong> their employment rightscompared to not being a member. Compared to non-members, members are1.8 times more likely to say they are aware <strong>of</strong> their employment rights.Also, earning £10,000 a year or more compared to earning under £10,000 ayear increases the likelihood th<strong>at</strong> a respondent assesses themselves as beingaware about their general employment rights. The odds <strong>of</strong> being aware weregre<strong>at</strong>est if a respondent earns £30,000 to £39,000 a year, followed by45 See Footnote 6 on previous page.46 Defined as having a child aged under 16, or 16, 17 or 18 and in full-timeeduc<strong>at</strong>ion.181
earning £20,000 to £29,000 a year, followed by earning £10,000 to £19,999a year (the co-efficients for the other c<strong>at</strong>egories were not significant).However, being in a job which is not permanent decreases the odds <strong>of</strong>someone classifying themselves as aware <strong>of</strong> their employment rights.Therefore, a respondent in a non-permanent job is 0.29 times as likely toassess themselves as aware <strong>of</strong> their general employment rights compared tosomeone in a permanent job.8.1.4 Additional variables th<strong>at</strong> were significantWhether or not a respondent has experienced a problem <strong>at</strong> work in the past fiveyears was also included as an independent variable and the co-efficient for thisvariable was st<strong>at</strong>istically significant. Thus, if a respondent has experienced aproblem <strong>at</strong> work in the past five years, the odds <strong>of</strong> them assessing themselvesas generally aware <strong>of</strong> their employment rights decreases in comparison tosomeone who has not experienced a problem. However, it could behypothesised th<strong>at</strong> if someone experienced a problem <strong>at</strong> work then this wouldmake them more aware <strong>of</strong> their employment rights as a result. Nonetheless, themeasure <strong>of</strong> awareness used for this regression is a self-assessed one, therefore,if a problem has been experienced this may have highlighted to a respondentthe limit<strong>at</strong>ions <strong>of</strong> their knowledge about employment rights.Table A2.2: General self-assessed awareness <strong>of</strong> employment rights(dependent variable)Independent variables Sig. Exp(B)Personal characteristics Sex (male=0, female=1) 0.597 0.859Ethnic origin (White=0, non-White=1) 0.602 1.242Age <strong>of</strong> respondent in years 0.391 1.009Disability, long-tem illness or health problem (no=0, yes=1) 0.295 0.743Marital st<strong>at</strong>us:Married/co-habiting 0.186 0.716Separ<strong>at</strong>ed/divorced 0.749 0.885Widowed 0.770 1.396Dependent children (no=0, yes=1) 0.030 1.668Highest qualific<strong>at</strong>ion:NVQ level 1 or equivalent 0.517 1.341NVQ level 2 or equivalent 0.083 1.913NVQ level 3 or equivalent 0.138 1.566NVQ level 4 or equivalent 0.069 2.031NVQ level 5 or equivalent 0.088 2.868Language spoken <strong>at</strong> home (English=0, not English=1) 0.390 1.878Sexual orient<strong>at</strong>ion (heterosexual=0, not heterosexual:gay/lesbian/homosexual/bisexual/other=1)0.348 0.500182
Table A2.2: continuedIndependent variables Sig. Exp(B)<strong>Employment</strong> characteristics Sector - SIC (primary and extractive=reference c<strong>at</strong>egory):Manufacturing, utilities and construction 0.466 0.590Distribution, c<strong>at</strong>ering, transport etc. 0.825 1.172Business and financial services 0.677 1.398Public admin, educ<strong>at</strong>ion and health 0.638 1.426Other services 0.533 1.839<strong>Employment</strong> characteristics Occup<strong>at</strong>ion (elementary occup<strong>at</strong>ions=reference c<strong>at</strong>egory):Process, plant and machine opps 0.361 0.704Sales and customer services 0.323 0.684Personal services 0.123 0.503Skilled trades 0.397 1.385Admin and secretarial 0.748 0.895Associ<strong>at</strong>e pr<strong>of</strong>essional and technical 0.437 0.735Pr<strong>of</strong>essionals 0.488 0.607Managers and senior <strong>of</strong>ficials 0.582 1.299Type <strong>of</strong> organis<strong>at</strong>ion(public sector organis<strong>at</strong>ion=reference c<strong>at</strong>egory):Priv<strong>at</strong>e sector organis<strong>at</strong>ion 0.700 1.130Voluntary or charitable organis<strong>at</strong>ion 0.872 0.919Earnings per year (under £10,000=reference c<strong>at</strong>egory):£10,000-£19,999 0.044 1.874£20,000-£29,999 0.048 2.162£30,000-£39,999 0.030 2.887£40,000-£49,999 0.130 2.576£50,000 or more 0.344 1.931<strong>Employment</strong> st<strong>at</strong>us (permanent=0, temporary=1) 0.001 0.296Hours worked (full-time 30 hours or more=0, part-time lessthan 30 hours=1)0.228 1.459Union/staff associ<strong>at</strong>ion member (no=0, yes=1) 0.009 1.875Experience Problems <strong>at</strong> work in the past 5 years? (no=0, yes=1) 0.023 0.657Constant 0.429 0.487Note: Variables and values in bold are significant. The number <strong>of</strong> cases is 725 (unweighted); 732 (weighted).Source: IES/BMRB, 20058.1.5 Collinearity diagnosticsTable A2.3 shows the collinearity diagnostic st<strong>at</strong>istics produced for thegeneral awareness regression. By looking <strong>at</strong> the Tolerance and VIF st<strong>at</strong>istics,183
it can be seen th<strong>at</strong> severe multi-collinearity is not present in the model. Thisis because the tolerance values are not below 0.1 and the VIF values are notabove ten. The correl<strong>at</strong>ion co-efficients between all the pairs <strong>of</strong> variables inthe model also support this. 47Table A2.3: General awareness collinearity diagnosticsCollinearity st<strong>at</strong>isticsIndependent variables Tolerance VIFSex 0.708 1.412Ethnic origin 0.927 1.079Age <strong>of</strong> respondent in years 0.659 1.517Disability, long-term illness or health problems 0.940 1.063Marital st<strong>at</strong>us 0.717 1.395Dependent children 0.844 1.184Highest qualific<strong>at</strong>ion level 0.713 1.402Language spoken <strong>at</strong> home 0.922 1.085Sexual orient<strong>at</strong>ion 0.962 1.040Sector 0.659 1.517Occup<strong>at</strong>ion 0.644 1.553Type <strong>of</strong> organis<strong>at</strong>ion (public, priv<strong>at</strong>e or voluntary/charitable) 0.763 1.310Earnings per year 0.544 1.839<strong>Employment</strong> st<strong>at</strong>us (permanent/temporary) 0.932 1.073Hours worked (full-time 30 hours or more, part-time less than 30hours)0.666 1.502Union/staff associ<strong>at</strong>ion member 0.825 1.213Experienced problems <strong>at</strong> work in the past 5 years 0.936 1.068Note: The number <strong>of</strong> cases is 725 (unweighted).Source: IES/BMRB, 2005<strong>Employment</strong> problems logistic regressionThe same personal and employment characteristic independent variableswere used in this regression as were in the general awareness logisticregression. They are listed in Table A2.5. However, there are twoadditional independent variables: one is the self-assessed generalawareness measure which was previously the dependent variable, and theother is a measure <strong>of</strong> whether or not a respondent’s employer had an HR47 Severe multi-collinearity is generally defined as the correl<strong>at</strong>ion co-efficientbetween two variables being gre<strong>at</strong>er than 0.8 (Carter Hill et al., 2001: 190). Or bylooking <strong>at</strong> collinearity st<strong>at</strong>istics produced by linear regression in SPSS and lookingfor tolerance levels less than 0.1 or VIF values gre<strong>at</strong>er than ten (Field A, 2000:201).184
department. 48 The following sub-sections highlight to wh<strong>at</strong> extent thelogistic regression model fits the d<strong>at</strong>a, the independent variables whoseco-efficients are significant and whether severe multi-collinearity ispresent.8.1.6 Accuracy <strong>of</strong> the modelThe classific<strong>at</strong>ion table below shows th<strong>at</strong> the model predicts correctly 67.3per cent <strong>of</strong> wh<strong>at</strong> is observed in the d<strong>at</strong>a; the model correctly classifies 67.3per cent <strong>of</strong> employees.Table A2.4: Problems experienced, classific<strong>at</strong>ion tablePredictedObserved No Yes Correct %No 289.960 91.903 75.9Yes 136.344 179.349 56.8Overall per cent 61.1 38.9 67.3Note: The number <strong>of</strong> cases is 695 (unweighted); 698 (weighted).Source: IES/BMRB, 2005For reference purposes, the Cox and Snell st<strong>at</strong>istic is 0.140 and theNagelkerke st<strong>at</strong>istic is 0.188. However, as previously discussed, these valuesare only ‘approxim<strong>at</strong>ely’ accur<strong>at</strong>e; therefore, they cannot be used to identifyhow much <strong>of</strong> the vari<strong>at</strong>ion in employment problems experienced is explainedby the independent variables.8.1.7 Personal characteristics th<strong>at</strong> were significantThe odds <strong>of</strong> a respondent having experienced a problem <strong>at</strong> work in the pastfive years decreases as the age <strong>of</strong> the respondent increases. Thus, the odds<strong>of</strong> someone who is 35 having experienced a problem are 0.96 times those <strong>of</strong>a respondent who is 34.In general, marital st<strong>at</strong>us has little significant influence on whether a problemhas been experienced <strong>at</strong> work. The only exception is th<strong>at</strong> compared to singlepeople, separ<strong>at</strong>ed/divorced people are more likely to have had a problem <strong>at</strong>work in the past five years.48 There were three additional independent variables for which there is a theoreticalbasis for supposing th<strong>at</strong> they affect the likelihood <strong>of</strong> a respondent experiencing aproblem <strong>at</strong> work. These were whether the employer had: an HR/personneldepartment, a written equal opportunities policy, or a written grievanceprocedure. However, whether a employer had a written grievance procedure andwhether they had a written equal opportunities policy were not included becausethere were some respondents who had not responded to these questions.Therefore, including them may have introduced a non-response bias. Thus, onlywhether the employer had an HR/personnel department was included.185
Being disabled (in the sense <strong>of</strong> having a disability or health problem lasting orexpected to last for a year or more) also significantly increases the odds <strong>of</strong>experiencing a problem <strong>at</strong> work. The likelihood <strong>of</strong> someone who is disabled <strong>of</strong>having experienced a problem is 1.78 times th<strong>at</strong> <strong>of</strong> a respondent who is not.8.1.8 <strong>Employment</strong> characteristics th<strong>at</strong> were significantBeing a member <strong>of</strong> a trade union/staff associ<strong>at</strong>ion increases the odds <strong>of</strong>having experienced a problem <strong>at</strong> work in the past five years. The odds <strong>of</strong>someone who is a trade union/staff associ<strong>at</strong>ion member having had aproblem are 1.45 times those <strong>of</strong> someone who is not. This may be becausebeing a trade union/staff associ<strong>at</strong>ion member makes someone more aware <strong>of</strong>their employment rights. Thus, they would be more likely to realise whentheir rights were being infringed when there was a problem.The co-efficients <strong>of</strong> two <strong>of</strong> the occup<strong>at</strong>ion c<strong>at</strong>egories were also st<strong>at</strong>isticallysignificant. Being in a ‘sales and customer services’ occup<strong>at</strong>ion or‘pr<strong>of</strong>essional’ occup<strong>at</strong>ion increases the odds <strong>of</strong> a respondent havingexperienced a problem <strong>at</strong> work in the past five years compared to being inthe ‘elementary occup<strong>at</strong>ions’ c<strong>at</strong>egory. The odds <strong>of</strong> having experienced aproblem were gre<strong>at</strong>est for the ‘pr<strong>of</strong>essional’ occup<strong>at</strong>ion c<strong>at</strong>egory, followed bythe ‘sales and customer services’ occup<strong>at</strong>ion c<strong>at</strong>egory.8.1.9 Additional variables th<strong>at</strong> were significantThe co-efficient for a respondent’s employer having an HR department wasnot st<strong>at</strong>istically significant. However, the self-assessed measure <strong>of</strong> generalawareness was. Thus, the odds <strong>of</strong> having experienced a problem <strong>at</strong> work arelower if a respondent assesses themselves as being ‘aware’, compared tosomeone who classifies themselves as ‘not aware’.Table A2.5: Prompted measure <strong>of</strong> whether a problem has beenexperienced <strong>at</strong> work in the past five years (dependentvariable)Independent variables Sig. Exp(B)Personal characteristics Sex (male=0, female=1) 0.382 0.794Ethnic origin (White=0, non-White=1) 0.125 2.069Age <strong>of</strong> respondent in years 0.000 0.960Disability, long-term illness or health problem(no=0, yes=1)Marital st<strong>at</strong>us (single=reference c<strong>at</strong>egory):0.064 1.783Married/cohabiting 0.333 1.268Separ<strong>at</strong>ed/divorced 0.026 2.324Widowed 0.629 0.550Dependent children (no=0, yes=1) 0.889 1.034186
Table A2.5: continuedIndependent variables Sig. Exp(B)Highest qualific<strong>at</strong>ion (no qualific<strong>at</strong>ions=reference c<strong>at</strong>egory):NVQ level 1 or equivalent 0.739 1.150NVQ level 2 or equivalent 0.222 0.689NVQ level 3 or equivalent 0.804 0.925NVQ level 4 or equivalent 0.846 1.065NVQ level 5 or equivalent 0.745 1.181Language spoken <strong>at</strong> home (English=0, not English=1) 0.604 0.792Sexual orient<strong>at</strong>ion (heterosexual=0, not heterosexual:gay/lesbian/homosexual/bisexual/other=1)0.507 1.812<strong>Employment</strong> characteristics Sector - SIC (primary and extractive=reference c<strong>at</strong>egory):Manufacturing, utilities and construction 0.154 2.646Distribution, c<strong>at</strong>ering, transport etc. 0.235 2.332Business and financial services 0.730 1.299Public admin, educ<strong>at</strong>ion and health 0.176 3.238Other services 0.931 1.078Occup<strong>at</strong>ion (elementary occup<strong>at</strong>ions=reference c<strong>at</strong>egory):Process, plant and machine opps 0.321 0.669Sales and customer services 0.000 4.036<strong>Employment</strong> characteristics Personal services 0.251 1.669Skilled trades 0.619 1.163Admin and secretarial 0.348 1.408Associ<strong>at</strong>e pr<strong>of</strong>essional and technical 0.161 1.742Pr<strong>of</strong>essionals 0.003 7.514Managers and senior <strong>of</strong>ficials 0.796 0.904Type <strong>of</strong> organis<strong>at</strong>ion(public sector organis<strong>at</strong>ion=reference c<strong>at</strong>egory):Priv<strong>at</strong>e sector organis<strong>at</strong>ion 0.201 1.784Voluntary or charitable organis<strong>at</strong>ion 0.150 2.062Earnings per year (under £10,000=reference c<strong>at</strong>egory):£10,000-£19,999 0.555 0.841£20,000-£29,999 0.151 0.570£30,000-£39,999 0.253 0.563£40,000-£49,999 0.984 0.989£50,000 or more 0.486 1.488<strong>Employment</strong> st<strong>at</strong>us (permanent=0, temporary=1) 0.583 1.321187
Table A2.5: continuedIndependent variables Sig. Exp(B)Hours worked (full-time 30 hours or more=0, part-time lessthan 30 hours=1)0.164 0.687Union/staff associ<strong>at</strong>ion member (no=0, yes=1) 0.092 1.455Employer has a HR/personnel department (no=0, yes=1) 0.710 0.910AwarenessHow aware do respondents think they are?(not aware=0, aware=1)0.031 0.661Constant 0.93 1.085Note: Variables and values in bold are significant. The number <strong>of</strong> cases is 695 (unweighted); 698 (weighted).Source: IES/BMRB, 20058.1.10 Collinearity diagnosticsTable A2.6 shows the collinearity diagnostic st<strong>at</strong>istics produced for theemployment problems experienced regression. By looking <strong>at</strong> the Toleranceand VIF st<strong>at</strong>istics, it can be seen th<strong>at</strong> severe multi-collinearity is not presentin the model. This is because the tolerance values are not below 0.1 and theVIF values are not above ten. The correl<strong>at</strong>ion co-efficients between all thepairs <strong>of</strong> variables in the model also support this. 49Table A2.6: Problems experienced collinearity diagnosticsCollinearity st<strong>at</strong>isticsIndependent variables Tolerance VIFSex 0.706 1.416Ethnic origin 0.951 1.051Age <strong>of</strong> respondent in years 0.674 1.484Disability, long-term illness or health problems 0.948 1.055Marital st<strong>at</strong>us 0.715 1.398Dependent children 0.838 1.193Highest qualific<strong>at</strong>ion level 0.717 1.395Language spoken <strong>at</strong> home 0.933 1.071Sexual orient<strong>at</strong>ion 0.954 1.049Sector 0.656 1.525Occup<strong>at</strong>ion 0.640 1.562Type <strong>of</strong> organis<strong>at</strong>ion (public, priv<strong>at</strong>e or voluntary/charitable) 0.740 1.35149 Severe multi-collinearity is generally defined as the correl<strong>at</strong>ion co-efficientbetween two variables being gre<strong>at</strong>er than 0.8 (Carter Hill et al., 2001: 190). Or bylooking <strong>at</strong> collinearity st<strong>at</strong>istics produced by linear regression in SPSS and lookingfor tolerance levels less than 0.1 or VIF values gre<strong>at</strong>er than ten (Field A, 2000:201).188
Table A2.6: continuedCollinearity st<strong>at</strong>isticsIndependent variables Tolerance VIFEarnings per year 0.537 1.863<strong>Employment</strong> st<strong>at</strong>us (permanent/temporary) 0.906 1.103Hours worked (full-time 30 hours or more, part-time less than 30hours)0.675 1.482Union/staff associ<strong>at</strong>ion member 0.795 1.258Employer has an HR/personnel department 0.794 1.260General awareness <strong>of</strong> employment rights 0.890 1.124Note: The number <strong>of</strong> cases is 695 (unweighted).Source: IES/BMRB, 2005Resolved s<strong>at</strong>isfactorily logistic regressionIn this regression, the sample consisted <strong>of</strong> those respondents who had aproblem <strong>at</strong> work in the past five years and the problem was ‘now over’ or‘now most likely over’. Therefore, the sample size was 259 weighted (242unweighted). As the sample size is so small, as detailed earlier, the resultsmust be approached with caution.Table A2.8 lists the independent variables th<strong>at</strong> were included in the model.Eight <strong>of</strong> these independent variables were included in the previous logisticregressions. These can be grouped as employment characteristics, personalcharacteristics and the self-assessed measure <strong>of</strong> awareness <strong>of</strong> generalemployment rights. The remaining 14 variables are additional independentvariables which can be summarised as:• Did the employee seek advice? (one additional variable).• Where was advice sought from, for example, HR/personnel? (eightadditional variables).• Steps taken to resolve the problem by the employee, for example, writing totheir employer (four additional variables).• Did the employer write to the employee? (one additional variable).These additional variables were included in the model to identify whether theactions <strong>of</strong> the respondents, and where they sought advice from, holding allother factors constant, had a st<strong>at</strong>istically significant impact on whether or nota problem was resolved s<strong>at</strong>isfactorily.The eight employment and personal characteristics which were included werechosen because they are key variables which are likely to affect whether aproblem is resolved s<strong>at</strong>isfactorily or not. As mentioned earlier, variables have189
een excluded to keep the number <strong>of</strong> independent variables down. 50 Thefollowing sub-sections highlight to wh<strong>at</strong> extent the logistic regression modelfits the d<strong>at</strong>a, the co-efficients which were st<strong>at</strong>istically significant and whetheror not severe multi-collinearity is present.8.1.11 Accuracy <strong>of</strong> the modelThe classific<strong>at</strong>ion table below shows th<strong>at</strong> the model predicts correctly 72.3per cent <strong>of</strong> wh<strong>at</strong> is observed in the d<strong>at</strong>a; the model correctly classifies 72.3per cent <strong>of</strong> employees.Table A2.7: Resolved s<strong>at</strong>isfactorily classific<strong>at</strong>ion tablePredictedObserved No Yes Correct %No 83.755 36.231 69.8Yes 35.523 103.811 74.5Overall per cent 46.0 54.0 72.3Note: The number <strong>of</strong> cases is 242 (unweighted); 259 (weighted).Source: IES/BMRB, 2005For reference purposes, the Cox and Snell st<strong>at</strong>istic is 0.232 and theNagelkerke st<strong>at</strong>istic is 0.309. However, as previously discussed, these valuesare only ‘approxim<strong>at</strong>ely’ accur<strong>at</strong>e; therefore, they can not be used to identifyhow much <strong>of</strong> the vari<strong>at</strong>ion in whether or not a problem is resolveds<strong>at</strong>isfactorily is explained by the independent variables.8.1.12 Personal characteristics th<strong>at</strong> were significantNone <strong>of</strong> the co-efficients <strong>of</strong> the four independent variables included in thisc<strong>at</strong>egory were st<strong>at</strong>istically significant.8.1.13 <strong>Employment</strong> characteristics th<strong>at</strong> were significantBeing a member <strong>of</strong> a trade union/staff associ<strong>at</strong>ion increased the odds <strong>of</strong> aproblem being resolved s<strong>at</strong>isfactorily. If someone was a trade union/staffassoci<strong>at</strong>ion member, compared to a respondent who was not, it was 6.8times more likely a problem would be resolved s<strong>at</strong>isfactorily.50 Job st<strong>at</strong>us (permanent/temporary), marital st<strong>at</strong>us, language spoken <strong>at</strong> home orqualific<strong>at</strong>ion level have not been used as these factors have not been a focus <strong>of</strong>the rest <strong>of</strong> the report. Occup<strong>at</strong>ion, sector or earnings have not been used as thesedecrease the sample size by too much considering it is already fairly small.Sexuality has also not been included as the number <strong>of</strong> non-heterosexuals(homosexual, lesbian, gay, bisexual or other) is very small in our sample, twoweighted (three unweighted). Having a dependent child has not been usedbecause we thought the theoretical basis for including this variable was not asstrong as it is for the variables th<strong>at</strong> have been included.190
8.1.14 Additional variables th<strong>at</strong> were significantThe odds <strong>of</strong> a problem being resolved s<strong>at</strong>isfactorily were higher if arespondent assessed themselves as ‘aware’ <strong>of</strong> their employment rightscompared to someone who felt they were ‘not aware’. They were twice aslikely to resolve a problem s<strong>at</strong>isfactorily. Further, if a respondent discussedthe problem with their employer face to face, compared to if they did not,this increased the odds <strong>of</strong> a problem being resolved s<strong>at</strong>isfactorily two-fold.However, if a respondent sought advice from the CAB, compared to someonewho did not, the odds <strong>of</strong> a problem being resolved s<strong>at</strong>isfactorily decreases.One hypothesis for this is th<strong>at</strong> only respondents with more serious andharder-to-solve problems approach the CAB; therefore, it is less likely theseproblems are resolved s<strong>at</strong>isfactorily. However, this result must be tre<strong>at</strong>edwith caution as there were only eight respondents weighted (six unweighted)who said ‘yes’ they had sought advice from the CAB.Table A2.8: Has a problem, once experienced and 'now over'/ 'mostlikely over', been resolved s<strong>at</strong>isfactorily? (dependentvariable)Independent variables Sig Exp(B)Personal characteristics Sex (male=0, female=1) 0.516 0.759Ethnic origin (White=0, non-White=1) 0.892 1.078Age <strong>of</strong> respondent in years 0.953 0.999Disability, long-tem illness or health problem (no=0, yes=1) 0.265 0.414<strong>Employment</strong> characteristics Type <strong>of</strong> organis<strong>at</strong>ion (public sector organis<strong>at</strong>ion=referencec<strong>at</strong>egory):AwarenessPriv<strong>at</strong>e sector organis<strong>at</strong>ion 0.885 1.060Voluntary or charitable organis<strong>at</strong>ion 0.202 0.209Hours worked (full-time 30 hours or more=0, part-time less than30 hours=1)0.857 1.082Union/staff associ<strong>at</strong>ion member(no=0, yes=1)How aware do respondents think they are?(not aware=0, aware=1)0.000 6.8280.065 2.048Additional characteristics Did the employee seek advice? (no=0, yes=1) 0.373 1.614Advice sought from HR/ personnel? (no=0, yes=1) 0.970 0.979Advice sought from manager <strong>at</strong> work? (no=0, yes=1) 0.321 1.559Advice sought from trade union? (no=0, yes=1) 0.231 0.422Advice sought from other colleague <strong>at</strong> work? (no=0, yes=1) 0.305 1.677Advice sought from a friend/ rel<strong>at</strong>ive? (no=0, yes=1) 0.343 0.509Advice sought from a telephone helpline/ website/intranet?(no=0, yes=1)0.991 0.984191
Table A2.8: continuedIndependent variables Sig Exp(B)Advice sought from CAB? (no=0, yes=1) 0.082 0.230Advice sought from legal source (employment tribunal service,solicitor or other legal represent<strong>at</strong>ive)? (no=0, yes=1)Did the employer write to the employee/someone acting on theirbehalf about the problem?0.167 0.3260.135 2.547Did the employee write to the employer about the problem? 0.106 0.463Did the employee discuss the problem with their employerface to face?Did the employee discuss the problem with their employer bytelephone?Did the employee discuss the problem with their employer byemail?0.099 2.0480.638 1.2360.335 1.752Constant 0.097 0.237Note: Variables and values in bold are significant. The number <strong>of</strong> cases is 242 (unweighted); 259 (weighted).Source: IES/BMRB, 20058.1.15 Collinearity diagnosticsTable A2.9 shows the collinearity diagnostic st<strong>at</strong>istics produced for the‘resolved s<strong>at</strong>isfactorily’ regression. By looking <strong>at</strong> the Tolerance and VIFst<strong>at</strong>istics, it can be seen th<strong>at</strong> severe multi-collinearity is not present in themodel. This is because the tolerance values are not below 0.1 and the VIFvalues are not above ten. The correl<strong>at</strong>ion co-efficients between all the pairs<strong>of</strong> variables in the model also support this. 5151 Severe multi-collinearity is generally defined as the correl<strong>at</strong>ion co-efficientbetween two variables being gre<strong>at</strong>er than 0.8 (Carter Hill et al., 2001: 190). Or bylooking <strong>at</strong> collinearity st<strong>at</strong>istics produced by linear regression in SPSS and lookingfor tolerance levels less than 0.1 or VIF values gre<strong>at</strong>er than ten (Field A, 2000:201).192
Table A2.9: Resolved s<strong>at</strong>isfactorily, collinearity diagnosticsCollinearity st<strong>at</strong>isticsIndependent variables Tolerance VIFSex 0.768 1.302Ethnic origin 0.959 1.043Age <strong>of</strong> respondent in years 0.841 1.189Disability, long-term illness or health problems 0.894 1.118Type <strong>of</strong> organis<strong>at</strong>ion (public, priv<strong>at</strong>e or voluntary/charitable) 0.757 1.321Hours worked (full-time 30 hours or more, part-time less than 30 hours) 0.795 1.257Union/staff associ<strong>at</strong>ion member 0.688 1.453General awareness <strong>of</strong> employment rights 0.907 1.103Did the employee seek advice? 0.387 2.582Advice sought from HR/personnel? 0.735 1.360Advice sought from manager <strong>at</strong> work? 0.670 1.493Advice sought from trade union? 0.596 1.677Advice sought from other colleague <strong>at</strong> work? 0.799 1.252Advice sought from friend/rel<strong>at</strong>ive? 0.745 1.342Advice sought from telephone helpline/website/intranet? 0.848 1.179Advice sought from CAB? 0.874 1.144Advice sought from legal source (employment tribunal, solicitor or other legalrepresent<strong>at</strong>ive)?Did the employer write to the employee/someone acting on their behalf about theproblem?0.790 1.2650.552 1.810Did the employee write to the employer about the problem? 0.526 1.901Did the employee discuss the problem with their employer face to face? 0.792 1.263Did the employee discuss the problem with their employer by telephone? 0.763 1.311Did the employee discuss the problem with their employer by email? 0.826 1.211Note: The number <strong>of</strong> cases is 242 (unweighted).Source: IES/BMRB, 2005193
9Appendix 3: On-callworkingOne <strong>of</strong> the additional aims <strong>of</strong> this survey was to:• estim<strong>at</strong>e the extent <strong>of</strong> on-call working in the UK; differenti<strong>at</strong>ing betweenthose on call <strong>at</strong> their place <strong>of</strong> work (residential on-call) and those who areable to leave their place <strong>of</strong> work.Respondents were therefore asked a series <strong>of</strong> questions about on-callworking. On-call working was defined as: ‘when you have to make yourselfavailable to be called to do work if it is needed’.Respondents who said they worked on call and said how many hours theyworked on call were asked:‘And for how many <strong>of</strong> these [cited] hours on call are you required to be <strong>at</strong>your place <strong>of</strong> work?’For the sample as a whole (regardless <strong>of</strong> the frequency or dur<strong>at</strong>ion), almostfive per cent were required to work on call <strong>at</strong> their place <strong>of</strong> work.Of these, Figure A3.1 shows the average number <strong>of</strong> hours on call percalendar month actually spent <strong>at</strong> the respondents’ place <strong>of</strong> work.194
Figure A3.1: Average number <strong>of</strong> hours on call per calendar monthactually spent <strong>at</strong> place <strong>of</strong> workLess than 10 hours10 to 19.99 hours20 to 29.99 hours30 to 39.99 hours40 to 49.99 hours50 to 59.99 hours60 to 69.99 hours70 to 79.99 hours80 to 89.99 hours90 to 99.99 hours100 to 149.99 hours150 to 199.99 hours200 hours +0 10 20 30 40 50 60 70per centNote: Base is those who work on call regularly, <strong>at</strong> their place <strong>of</strong> work, and who specified the number <strong>of</strong> hours (98).Source: IES/BMRB, 2005Figure A3.1 shows th<strong>at</strong> two-thirds <strong>of</strong> respondents (66 per cent) who work oncall regularly spend less than ten hours a month on call <strong>at</strong> their place <strong>of</strong>work. A further 20 per cent <strong>of</strong> respondents spend between ten and 39.99hours a month on call <strong>at</strong> their place <strong>of</strong> work.Respondents who did some on-call working <strong>at</strong> their place <strong>of</strong> work were thenasked:‘And out <strong>of</strong> these [cited] hours when you are <strong>at</strong> your place <strong>of</strong> work, howmany hours are you required to be actively doing work?’Of the whole sample, four per cent <strong>of</strong> respondents were required to activelybe working <strong>at</strong> their place <strong>of</strong> work while on call. Figure A3.2 isol<strong>at</strong>es theserespondents and shows the average number <strong>of</strong> hours on call per calendarmonth <strong>at</strong> the respondents’ place <strong>of</strong> work spent actively doing work.195
Figure A3.2: Average number <strong>of</strong> hours on call per calendar month <strong>at</strong>place <strong>of</strong> work and actively doing workLess than 10 hours10 to 19.99 hours20 to 29.99 hours30 to 39.99 hours40 to 49.99 hours50 to 59.99 hours60 to 69.99 hours70 to 79.99 hours80 to 89.99 hours90 to 99.99 hours100 to 149.99 hours150 to 199.99 hours0 5 10 15 20 25 30 35 40per centNote: Base is those who work on call regularly, actively <strong>at</strong> their place <strong>of</strong> work, and who specified the number <strong>of</strong> hours (41).Source: IES/BMRB, 2005Figure A3.2 shows th<strong>at</strong> <strong>of</strong> those who are actively required to do work whenthey are on call <strong>at</strong> their place <strong>of</strong> work, over one-third <strong>of</strong> respondents (37 percent) were required to be actively doing work for less than ten hours percalendar month. A further 29 per cent were required to be actively doingwork for between ten and 29.99 hours a month.Broader questions about on-call working were also asked. For example:‘Are/were you required to do on-call working? On-call working is when youhave to make yourself available to be called to do work if it is needed.’Table A3:1 shows the results <strong>of</strong> this question.Table A3.1: Whether required to do on-call workingYes NoUnweighted% % baseAll respondents 16 84 1,035Age 16-24 11 90 11225-34 17 84 21535-44 17 83 28945-54 15 85 24855-64 20 80 170Gender Male 21 79 471196
Female 10 90 564Earnings Under £15,000 10 90 411£15,000 to £24,999 20 80 259£25,000 to £39,999 18 83 173£40,000 + 30 71 79Hours worked Full time 18 82 778Part time 9 91 250Type <strong>of</strong> organis<strong>at</strong>ion Public sector 14 86 333Priv<strong>at</strong>e sector 15 85 662Whether has HR/personnel dept Yes 17 83 733No 14 86 258Whether experienced problems Yes 18 82 416No 14 85 619Managerial/supervisory duties Yes 24 76 386No 11 89 649Number <strong>of</strong> employees inworkplace1 to 9 21 79 15810 to 24 13 87 16825 to 99 17 84 250100 to 499 15 85 228500+ 15 85 206Note: Base = whole sample, excluding the ‘don’t knows’.Source: IES/BMRB, 2005Table A3:1 shows th<strong>at</strong> 16 per cent <strong>of</strong> respondents were required to do on-callworking. Men were more likely to do on-call working than women. Thoseearning over £40,000 a year were more likely to do on-call working thanthose earning under this, full-time workers were more likely to do on-callworking than part-time workers, and those with managerial/supervisoryduties were more likely to work on call than those without such duties.Figure A3.3 illustr<strong>at</strong>es the industry codes for respondents who were requiredto do on-call working and shows th<strong>at</strong> health and social work, the wholesaleand retail trade, manufacturing and public administr<strong>at</strong>ion accounted for thelargest industry sectors.197
Figure A3.3: Industries <strong>of</strong> those doing on-call workingA: Agriculture, Hunting and ForestryB: FishingC: Mining and QuarryingD: ManufacturingE: Electricity, Gas and W<strong>at</strong>er SupplyF: ConstructionG: Wholesale and Retail Trade: Repair <strong>of</strong> Motor Vehicles, etcH: Hotels and RestaurantsI: Transport, Storage and Communic<strong>at</strong>ionJ: Financial Intermedi<strong>at</strong>ionK: Real Est<strong>at</strong>e, Renting and Business ActivitiesL: Public Admin and Defence: Compulsory Social SecurityM: Educ<strong>at</strong>ionN: Health and Social <strong>Work</strong>O: Other Community, Social and Personal Service ActivitiesP: Priv<strong>at</strong>e Households with Employed PersonsQ: Extra-Territorial Organis<strong>at</strong>ions and Bodies0 2 4 6 8 10 12 14 16 18per centNote: Base is all those doing on-call working who specified their industry (144).Source: IES/BMRB, 2005Respondents who said th<strong>at</strong> they worked on call were asked:‘How <strong>of</strong>ten do/did you do on-call work?’Of the sample as a whole, five per cent worked on call on a weekly basis, andthree per cent worked on call irregularly (weekly and irregularly being themost frequent time periods named).Figure A3.4 isol<strong>at</strong>es those who work on call and shows the frequency <strong>of</strong> theiron-call working.198
Figure A3.4: Frequency <strong>of</strong> on-callEvery weekEvery two weeksEvery three weeksEvery four weeksEvery calendar monthEvery two calendar monthsEvery three months/13 weeksEvery six months/26 weeksAll the timeOn a seasonal basisIrregularly0 5 10 15 per cent 20 25 30 35Note: Base is those who did on-call work (162).Source: IES/BMRB, 2005Figure A3.4 shows th<strong>at</strong> one-third (33 per cent) <strong>of</strong> those who worked on calldid so every week, while one in ten did so every two weeks, and 18 per centdid so irregularly.Respondents who worked on call were also asked:‘How many hours [are/were] you required to be on call for in an average[insert period cited above]?’Figure A3.5 shows the results <strong>of</strong> this question, calcul<strong>at</strong>ed as average hoursrequired to be on call per calendar month.199
Figure A3.5: Average hours required to be on call per calendar monthLess than 10 hours10 to 19.9 hours20 to 29.9 hours30 to 39.9 hours40 to 49.9 hours50 to 59.9 hours60 to 69.9 hours70 to 79.9 hours80 to 89.9 hours90 to 99.9 hours100 to 149.9 hours150 to 199.9 hours200 hours +0 5 10 15 20 25per centNote: Base is those who work on call regularly and who specified the number <strong>of</strong> hours (101).Source: IES/BMRB, 2005Figure A3.6 shows th<strong>at</strong> one-fifth <strong>of</strong> respondents who work on call regularly(21 per cent) were required to be on call for less than ten hours per calendarmonth. Thirteen per cent were required to work on call between ten to 19.99hours per month, 12 per cent between 20 and 29.99 hours, and 11 per centbetween 60 and 69.99 hours.200
10Appendix 4: List <strong>of</strong>acronymsAcasBMRBCABCAPIDDADRC<strong>DTI</strong>GPsHRIESLFSLSRCNHSNMWONSSETAWERSWTRAdvisory, Concili<strong>at</strong>ion and Arbitr<strong>at</strong>ion ServiceBritish Market Research BureauCitizens’ Advice BureauComputer-assisted personal interviewingDisability Discrimin<strong>at</strong>ion ActDisability <strong>Rights</strong> CommissionDepartment <strong>of</strong> Trade and IndustryGeneral PractitionersHuman ResourcesInstitute for <strong>Employment</strong> StudiesLabour Force <strong>Survey</strong>Legal Services Research CentreN<strong>at</strong>ional Health ServiceN<strong>at</strong>ional Minimum WageOffice <strong>of</strong> N<strong>at</strong>ional St<strong>at</strong>istics<strong>Survey</strong> <strong>of</strong> <strong>Employment</strong> Tribunal Applic<strong>at</strong>ions<strong>Work</strong>place <strong>Employment</strong> Rel<strong>at</strong>ions <strong>Survey</strong><strong>Work</strong>ing Time Regul<strong>at</strong>ions201
BibliographyHayward, B., Peters, M., Rousseau, N. and Seeds, K. (2004), Findings fromthe <strong>Survey</strong> <strong>of</strong> <strong>Employment</strong> Tribunal Applic<strong>at</strong>ions 2003. <strong>Employment</strong> Rel<strong>at</strong>ionsResearch Series No. 33. <strong>DTI</strong>BMRB (2006a), Individuals’ Awareness, Knowledge and Exercise <strong>of</strong><strong>Employment</strong> <strong>Rights</strong>: Second Benchmark <strong>Survey</strong>. Technical Report. <strong>DTI</strong>BMRB (2006b), Individuals’ Awareness, Knowledge and Exercise <strong>of</strong><strong>Employment</strong> <strong>Rights</strong>: Second Benchmark <strong>Survey</strong>. Report on cognitiveinterviewing. <strong>DTI</strong>BMRB (2006c), Individuals’ Awareness, Knowledge and Exercise <strong>of</strong><strong>Employment</strong> <strong>Rights</strong>: Second Benchmark <strong>Survey</strong>. Report on pilot survey. <strong>DTI</strong>Carter-Hill, R., Griffiths, W.E. and Judge, G.G. (2001), Undergradu<strong>at</strong>eEconometrics. Second Edition. John Wiley & Sons, Inc.Field, A. (2000), Discovering St<strong>at</strong>istics: Using SPSS for Windows. SagePublic<strong>at</strong>ions Ltd.Kersley, B., Alpin, C., Forth, J., Bryson, A., Bewley, H., Dix, G. andOxenbridge, S. (2005), Inside the <strong>Work</strong>place: First Findings from the 2004<strong>Work</strong>place <strong>Employment</strong> Rel<strong>at</strong>ions <strong>Survey</strong> (WERS 2004). <strong>DTI</strong>Meager, N., Tyers, C., Perryman, S., Rick, J. and Willison, R. (2002),Awareness, Knowledge and Exercise <strong>of</strong> Individual <strong>Employment</strong> <strong>Rights</strong>.<strong>Employment</strong> Rel<strong>at</strong>ions Research Series No. 15. <strong>DTI</strong>ONS (2005), Trends in Public Sector <strong>Employment</strong>. ONSPleasence, P. (2006), Causes <strong>of</strong> Action, 2nd Edition. TSOPollert, A. (2004), The Unorganised <strong>Work</strong>er <strong>Survey</strong> 2004: Theoretical andMethodological Issues Summary. <strong>Work</strong>ing Lives Research Institute, LondonMetropolitan UniversityPollert, A. (2005), The Unorganised <strong>Work</strong>er: Problems <strong>at</strong> <strong>Work</strong>, Routes toSupport and Views on Represent<strong>at</strong>ion. Unorganised <strong>Work</strong>er <strong>Survey</strong> 2004.Review <strong>of</strong> Theoretical and Methodological Issues. Project <strong>Work</strong>ing Paper 2.<strong>Work</strong>ing Lives Research Institute, London Metropolitan UniversitySturgis, P., Allum, N., Smith, P. and Woods, A. (2005), The Measurement <strong>of</strong>Factual Knowledge in <strong>Survey</strong>s. Under Review. Available <strong>at</strong>:http://joni.soc.surrey.ac.uk/~scs1ps/papers/Tabachnick, B. and Fidell, L. (1996), Using Multivari<strong>at</strong>e St<strong>at</strong>istics. ThirdEdition. HarperCollins.202
The <strong>DTI</strong> <strong>Employment</strong>Rel<strong>at</strong>ions ResearchSeriesReports published to d<strong>at</strong>e in the <strong>DTI</strong> <strong>Employment</strong> Rel<strong>at</strong>ions ResearchSeries are listed below. Adobe PDF copies can be downloaded from the<strong>DTI</strong> website: www.dti.gov.uk/er/inform.htm or ordered <strong>at</strong>:www.dti.gov.uk/public<strong>at</strong>ionsClick the ‘Browse’ button, then select ‘<strong>Employment</strong> Rel<strong>at</strong>ions ResearchSeries’. Altern<strong>at</strong>ively call the <strong>DTI</strong> Public<strong>at</strong>ions Orderline on 0845 015 0010(+44 845 015 0010) and provide the URN. Or email them <strong>at</strong>:public<strong>at</strong>ions@dti.gsi.gov.uk with your details.Libraries, research centres, organis<strong>at</strong>ions and academics wishing to be addedto our mailing list for printed copies <strong>of</strong> this series should email their details to<strong>DTI</strong> <strong>at</strong>: emar@dti.gsi.gov.uk.No. 1No. 2No. 3No. 4No. 5Involving employees in Total Quality Management: employee<strong>at</strong>titudes and organis<strong>at</strong>ional context in unionised environments.Margaret Collinson, Chris Rees, Paul Edwards with Linda Inness.URN 98/507. June 1998Industrial Tribunals, workplace disciplinary procedures andemployment practice. Jill Earnshaw, John Goodman, RobinHarrison and Mick Marchington. URN 98/564. February 1998The dynamics <strong>of</strong> union membership in Britain – a study usingthe Family and <strong>Work</strong>ing Lives survey. Richard Disney, AmandaGosling, Julian McCrae and Stephen Machin. URN 98/807.January 1999The individualis<strong>at</strong>ion <strong>of</strong> employment contracts in Britain. WilliamBrown, Simon Deakin, Maria Hudson, Cliff Pr<strong>at</strong>ten and PaulRyan. URN 98/943. February 1999Redundancy consult<strong>at</strong>ion: a study <strong>of</strong> current practice and theeffects <strong>of</strong> the Regul<strong>at</strong>ions. Jill Smith, Paul Edwards and MarkHall. URN 99/512. July 1999No. 6 The employment st<strong>at</strong>us <strong>of</strong> individuals in non-standardemployment. Brendan Burchell, Simon Deakin and SheilaHoney. URN 99/770. July 1999No. 7Partnership <strong>at</strong> work. John Knell. URN 99/1078. September1999No. 8 Trends in earnings inequality and earnings mobility 1977-1997:the impact <strong>of</strong> mobility on long-term inequality. AbigailMcKnight. URN 00/534. February 2000203
No. 9No. 10Costs and benefits <strong>of</strong> European <strong>Work</strong>s Councils Directive. TinaWeber, Peter Foster and Kurs<strong>at</strong> Levent Egriboz. URN 00/630.February 2000Explaining the growth in the number <strong>of</strong> applic<strong>at</strong>ions toIndustrial Tribunals, 1972-1997. Simon Burgess, Carol Propperand Deborah Wilson. URN 00/624. April 2001No. 11 Implement<strong>at</strong>ion <strong>of</strong> the <strong>Work</strong>ing Time Regul<strong>at</strong>ions. FionaNe<strong>at</strong>hey and James Arrowsmith. URN 01/682. April 2001No. 12 Collective bargaining and workplace performance: aninvestig<strong>at</strong>ion using the <strong>Work</strong>place Employee Rel<strong>at</strong>ions <strong>Survey</strong>1998. Alex Bryson and David Wilkinson. URN 01/1224.November 2001No. 13 Findings from the 1998 <strong>Survey</strong> <strong>of</strong> <strong>Employment</strong> TribunalApplic<strong>at</strong>ions (<strong>Survey</strong>s <strong>of</strong> Applicants and Employers). URN03/999. February 2004No. 14 Small firms' awareness and knowledge <strong>of</strong> individualemployment rights. Robert Blackburn and Mark Hart. URN02/573. August 2002No. 15No. 16No. 17No. 18No. 19No. 20No. 21Awareness, knowledge and exercise <strong>of</strong> individual employmentrights. Nigel Meager, Claire Tyers, Sarah Perryman, Jo Rick andRebecca Willison. URN 02/667. February 2002<strong>Work</strong>ing long hours: a review <strong>of</strong> the evidence. Volume 1 – Mainreport. Volume 2 – Case studies (and appendices). J Kodz etal. URN: 03/1228. November 2003Evalu<strong>at</strong>ion <strong>of</strong> the Partnership <strong>at</strong> <strong>Work</strong> Fund. Mike Terry and JillSmith. URN 03/512. May 2003Retirement ages in the UK: a review <strong>of</strong> the liter<strong>at</strong>ure. PamelaMeadows. URN 03/820. July 2003Implement<strong>at</strong>ion <strong>of</strong> the <strong>Work</strong>ing Time Regul<strong>at</strong>ions: follow-upstudy. Fiona Ne<strong>at</strong>hey. URN03/970. July 2003The impact <strong>of</strong> employment legisl<strong>at</strong>ion on small firms: a casestudy analysis. Paul Edwards, Monder Ram and John Black.URN 03/1095. September 2003Employee voice and training <strong>at</strong> work: analysis <strong>of</strong> case studiesand WERS98. Helen Rainbird, Jim Sutherland, Paul Edwards,Lesley Holly and Ann Munro. URN 03/1063. September 2003No. 22 The Second <strong>Work</strong>-Life Balance Study: Results from theEmployer <strong>Survey</strong>. Stephen Woodland, Nadine Simmonds, MarieThornby, Rory Fitzgerald and Alice McGee. URN 03/1252.October 2003No. 23No. 24The business context to long hours working. T, Hogarth, W.W.Daniel, A.P.Dickerson, D. Campbell, M.Wintherbotham, D.Vivian. URN 03/833. November 2003Age m<strong>at</strong>ters: a review <strong>of</strong> the existing survey evidence. Dr.Peter Urwin. URN 03/1623. February 2004204
No. 25How employers manage absence. Stephen Bevan, Sally Dench,He<strong>at</strong>her Harper and Sue Hayday. URN 04/553. March 2004No. 26 The content <strong>of</strong> new voluntary trade union recognitionagreements 1998-2002: Volume one – An analysis <strong>of</strong> newagreements and case studies. Dr Sian Moore, Dr Sonia McKayand Helen Bewley. URN 04/1084. August 2004No. 27 The Second <strong>Work</strong>-Life Balance Study: Results from the<strong>Employees</strong>’ <strong>Survey</strong>. Jane Stevens, Juliet Brown and CarolineLee. URN 04/740. March 2004No. 28 2003 Compendium <strong>of</strong> Regul<strong>at</strong>ory Impact Assessments.<strong>Employment</strong> Market Analysis and Research. URN 04/743. April2004No. 29 Trade union recognition: st<strong>at</strong>utory unfair labour practiceregimes in the USA and Canada. John Godard. URN 04/855.March 2004No. 30Equal opportunities policies and practices <strong>at</strong> the workplace:secondary analysis <strong>of</strong> WERS98. Tracy Anderson, Neil Millwardand John Forth. URN 04/836. June 2004No. 31 A survey <strong>of</strong> workers’ experiences <strong>of</strong> the <strong>Work</strong>ing TimeRegul<strong>at</strong>ions. BMRB Social Research. URN 04/1165.November 2004No. 32No. 33The evalu<strong>at</strong>ion <strong>of</strong> the <strong>Work</strong>-Life Balance Challenge Fund. AdrianNelson, K<strong>at</strong>hryn Nemec, Pernille Solvik and Chris Ramsden.URN 04/1043. August 2004Findings from the <strong>Survey</strong> <strong>of</strong> <strong>Employment</strong> tribunal Applic<strong>at</strong>ions2003. Bruce Hayward, Mark Peters, Nicola Rousseau and KenSeeds. URN 04/1071. August 2004No. 34 <strong>Employment</strong> rel<strong>at</strong>ions monitoring and evalu<strong>at</strong>ion plan 2004.<strong>Employment</strong> Market Analysis and Research. URN 04/1256.September 2004No. 35 Findings from the 1998 survey <strong>of</strong> represent<strong>at</strong>ives in<strong>Employment</strong> Tribunal cases. P.L.L<strong>at</strong>reille, J.A. L<strong>at</strong>reille and K.G.Knight.URN 04/1530. August 2004No. 36No. 37No. 39<strong>Employment</strong> <strong>at</strong>titudes: Main findings from the British SocialAttitudes <strong>Survey</strong> 2003. Harjinder Kaur. URN 04/1868.December 2004Job separ<strong>at</strong>ions: A survey <strong>of</strong> workers who have recently left anyemployer. Volume one – Main analysis report. Tania Corbin.URN 04/1920. December 2004Results <strong>of</strong> the Second Flexible <strong>Work</strong>ing Employee <strong>Survey</strong>.He<strong>at</strong>her Holt and Heidi Grainger. URN 05/606. April 2005No. 40 2002 Compendium <strong>of</strong> Regul<strong>at</strong>ory Impact Assessments.<strong>Employment</strong>205
Market Analysis and Research. URN 05/582.April 2005No. 41 2004 Compendium <strong>of</strong> Regul<strong>at</strong>ory Impact Assessments.<strong>Employment</strong> Market Analysis and Research. URN 05/1018.April 2005No. 42The age dimension <strong>of</strong> employment practices: employer casestudies. Stephen McNair and M<strong>at</strong>t Flynn. URN 05/863.June 2005No. 43 The content <strong>of</strong> new voluntary trade union recognitionagreements 1998-2002. Volume two – Findings from the survey<strong>of</strong> employers. Dr Sian Moore, Dr Sonia McKay and HelenBewley. URN 05/1020. May 2005No. 44 <strong>Employment</strong> Rel<strong>at</strong>ions monitoring and evalu<strong>at</strong>ion plan 2005,<strong>Employment</strong> Market Analysis and Research. URN 05/1019.July 2005No. 46No. 47People, Str<strong>at</strong>egy ad Performance: Results from the Second<strong>Work</strong> and Enterprise Business <strong>Survey</strong>. The <strong>Work</strong> Found<strong>at</strong>ion.URN 05/1392. September 2005‘Small, flexible and family friendly’ – work practices in servicesector businesses. Lynette Harris and Carley Foster.URN 05/1491. October 2005No. 49 <strong>Survey</strong> <strong>of</strong> employers’ policies, practices and preferencesrel<strong>at</strong>ing to age. Hilary Metcalf and Pamela Meadows. URN05/674. March 2006No. 50M<strong>at</strong>ernity and p<strong>at</strong>ernity rights and benefits: survey <strong>of</strong> parents2005. Deborah Sme<strong>at</strong>on and Alan Marsh. URN 06/836. March2006.206
Printed in the UK on recycled paper containing a minimum <strong>of</strong> 75% post consumer waste.First published April 2006. Department <strong>of</strong> Trade and Industry. www.dti.gov.uk© Crown Copyright. <strong>DTI</strong>/Pub 8184/.850k/04/06NP. URN 06/837. ISBN 085605 346 5