Download PDF - Severstal
Download PDF - Severstal
Download PDF - Severstal

You also want an ePaper? Increase the reach of your titles
YUMPU automatically turns print PDFs into web optimized ePapers that Google loves.
IntroductionWe are a leading international steel producer with vertically integratedand geographically diversified metallurgical and mining assets.We aim to be one of the most efficient businesses of our kind in the world.Restructuring will enable us to adjust to the lower demand for steel, andreturn to sustainable development.
Chairman’s statementIn April 2008 we restructured the company into threedivisions: <strong>Severstal</strong> Russian Steel, <strong>Severstal</strong> Resourcesand <strong>Severstal</strong> International.The global steel industry, in line with many others,has experienced a tumultuous year. Prior to the lastquarter of 2008, strong fundamentals drove verysignificant growth. Good demand, both in Russia andinternationally, in the first nine months – and ensuinghigh prices for steel, iron ore and coal – made 2008 arecord year for <strong>Severstal</strong>.The deterioration in economic conditions seen acrossthe world in the last quarter of the year was theswiftest and most pronounced we have seen. Steelproducingindustries in the major economies weredirectly affected, as demand fell for everything fromconstruction to cars. This, together with inevitableindustry destocking, hit prices substantially.I believe <strong>Severstal</strong> has responded to these challengesquickly and decisively. Our priority is to ensure thecompany is in the best condition, financially andoperationally, both to operate through the downturnand to emerge from it stronger. We began cuttingproduction across our divisions in October 2008 andwill continue to monitor our markets closely, adjustingour production levels to meet demand. We alsocommenced a programme to reduce the size of ourworkforce to match the required levels of production ateach plant. We have substantially reduced our capitalexpenditure for next year and have a strong cashposition and financing structure in order to navigatethe turbulent times ahead. We remain committed to ourstrategy of being global integrated steel and miningbusiness, which the Board firmly believes will delivervalue to all of our stakeholders in the long term.This has served to increase efficiency and cut costs,streamlining the reporting lines within the business andsimplifying the way it is managed.We have also made good progress in improving healthand safety standards. In April 2008 we introduced aunified health, safety and environment policy acrossthe organisation, which has already helped reduceaccidents among our staff and limit harm to theenvironment. As always, there is more to be done, butwe are committed to this important area.<strong>Severstal</strong>’s Board of Directors continues to work well.I have long been impressed by the company’s highlevels of corporate governance and accountability, andthis year we greatly appreciated the good cooperationbetween the Board and our senior executive team,drawing on the depth of the Board’s shared experience.This was borne out by an independent audit of theBoard’s effectiveness commissioned by <strong>Severstal</strong>during the year. This revealed a real desire among theIndependent Directors to use their experience andexpertise to benefit the company – and the company’sown enthusiasm for them to do so.I would very much like to thank the Board and ExecutiveTeam for all they have done in 2008, as well as ourshareholders for their continued support. Finally, Iwould like to thank our outstanding people, at everylevel of the organisation, for their hard work anddedication in what has been a difficult year.In April 2008 we restructured the company into threedivisions: <strong>Severstal</strong> Russian Steel, <strong>Severstal</strong> Resourcesand <strong>Severstal</strong> International.Christopher ClarkIndependent Chairman of the Board of Directors10 11
Chief Executive’sstatementI believe that the events of 2008 have already had thebenefit of bringing us back to fundamentals2008 was an unprecedented year in many respects– not least in the speed and severity of the globaleconomic downturn and resulting impact on steelproducingcompanies. <strong>Severstal</strong>’s results for the year2008 were good overall, as we benefited from volumegrowth, price increases and margin improvement. Theglobal economic slump in the last quarter resulted inweakening demand for steel and subsequent fallingprices.Revenues for the year 2008 increased by 44.4% to arecord US$22,393 million, and EBITDA grew by 45.5%to US$5,366 million, due to strong demand in the firstnine months of the year, a favourable price environmentand the consolidation of our assets in North America,which is outlined below.<strong>Severstal</strong> Russian SteelRussian Steel benefited from favourable prices, astrong domestic market and growth in productionvolumes. This resulted in a 33.3% increase in revenuesand EBITDA growth of 29.7%. The division continued toimprove its competitiveness during the year, and is alow cost, high quality asset for the Group.In the fourth quarter, we reduced production of crudesteel by 48% quarter-on-quarter, due to lower domesticdemand.Izhora Pipe Mill, our large diameter pipe manufacturer,demonstrated significant growth for the year, withEBITDA increasing by 50.7%, although pipe productionfell by 13% in the fourth quarter.<strong>Severstal</strong> Resources (Mining)In our mining division, <strong>Severstal</strong> Resources, revenuewas 32.6% higher and EBITDA rose by 72.9%, as webenefited from increases in coal and iron ore prices.We reduced the production of iron products (pelletsand concentrate) by 5% in 2008 and production of coalby 21%. This was due to the dramatic change in themarket environment towards the end of the year, andthe sale of the Kuzbassugol mine in Q2.We acquired PBS Coals, a Pennsylvania-basedcoal company, in November 2008 for a total cashconsideration of US$877 million. In the last quarter of2008, the PBS production of coking coal concentrateand steaming coal helped to support the productionlevels of coal in the division as a whole.Our strategy for the gold market is to make relativelysmall, opportunistic investments in order to exploitthe synergies and expertise in our existing core miningbusiness. This has created real value during the year,with our gold business adding US$82 million to EBITDA.In August, <strong>Severstal</strong> Resources took control of Balazhal,a gold mine in East Kazakhstan, and in November weacquired a controlling stake in High River Gold for atotal consideration of US$63 million.<strong>Severstal</strong> InternationalAt <strong>Severstal</strong> International our North Americanoperations reported EBITDA of US$377 millioncompared to negative US$50 million in 2007.This included one-off gains of US$423 million, US$15212 13
million of insurance settlement proceeds and one-offlosses of $380 million in the fourth quarter related toinventory adjustments and onerous supply contract.We enlarged the scope and scale of our North Americanoperations during the year, acquiring the SparrowsPoint steel mill in Maryland (now named <strong>Severstal</strong>Sparrows Point) in May, Esmark in West Virginia (renamedto <strong>Severstal</strong> Wheeling Inc) in August and WCISteel Inc. in Ohio (re-named to <strong>Severstal</strong> Warren Inc.) inJuly.Although crude steel production was 128.7% higherthan in 2007, production dropped 52.0% in the fourthquarter vs. the third quarter due to lower demand in theNorth American market. Conditions in the US remaindifficult, but I believe that our assets there will createvalue for our shareholders over the long term.At Lucchini, our European business, EBITDA increasedto US$430 million, 3.3% higher than the previous year.In the first nine months of 2008, we saw an increasein production and prices due to strong demand in theEuropean market, although Lucchini produced 37% lesscrude steel in the fourth quarter vs. the third quarteras a result of worsening economic conditions. Theproduction of rails continues to be strong, increasing by84.0% in the last quarter of 2008.Response to the current environmentOur management team has taken decisive action tomitigate the impact of the global slowdown on thecompany, and preserve cash.We have reduced our production levels in line withmarket conditions, lowering our capacity utilisationto 50% in Russia, 40% in North America and 60% inEurope.In February 2009, we announced the temporarycessation of production at <strong>Severstal</strong> Warren, which willremain idle until conditions improve. We are monitoringour markets closely and are able to adjust productionto meet demand. The market remains volatile: capacityutilisation rose sharply at the beginning of 2009.To maintain staffing levels appropriate for currentproduction, we began a headcount reductionprogramme across the group during the last quarter of2008. We are keeping this under constant review.We have reduced our 2009 capital expenditureprogramme to US$1 billion, down from our originalforecast of US$3 billion. The vast majority of this will bespent on critical maintenance.<strong>Severstal</strong> has a strong cash position and committedfacilities in place to meet 2009 debt requirements. Asof December 31, 2008, we had unused long-term creditlines of US$951 million in total. In 2009, Managementalso expects to release US$1.2 billion of cash fromworking capital in 2009 as a result of a reduction inraw materials and work-in-process inventories strongcontrol over accounts receivable and overall better cashmanagement.OutlookBecause the market environment remains challengingwith limited visibility, we believe it would beinappropriate to provide any guidance for 2009. Forthe same reason we are not recommending paymentof dividend for the fourth quarter of 2008. We do notanticipate payment of dividends in 2009. This decisionwas not taken lightly, but we believe it is prudent.I firmly believe that economic conditions will improve– and, with them, the demand for steel. We have seensome signs of improvement in the first quarter of2009 and I believe that re-stocking and stimulus plansannounced by many national governments are likely tosupport demand for steel this and next year.We have taken decisive actions necessary to ensurethat <strong>Severstal</strong> will emerge from the downturn stronger.The events of 2008 have clearly indicated the priorities:with the challenging year ahead our focus is on costreduction, preserving cash building and strengtheningrelationships with our customers. I remain confident inthe long-term prospects for our industry.Alexei MordashovChief Executive Officer14 15
Principal events of 2008JanuaryAprilJuneAugustSeptemberDecember<strong>Severstal</strong> completed the acquisition<strong>Severstal</strong> sold its 97.9%, 99.5%<strong>Severstal</strong> sold its 100% and 40%<strong>Severstal</strong> acquired a 100%<strong>Severstal</strong> arranged an Investor Day<strong>Severstal</strong> acquired a 61.5% stakeof a 100% stake in Baracom Limitedand 100% participation inparticipation in Relco Spzoo andstake in Esmark (now re-namedin London.in African Iron Ore Group Ltd (nowfrom its majority shareholder forOAO Mine Berezovskaya, OAOCoimpex Spzoo respectively for a<strong>Severstal</strong> Wheeling Inc.) for a totalre-named <strong>Severstal</strong> Liberia Iron Orea total consideration of US$84.4million. Baracom Limited ownsMine Pervomaiskaya and ZAOZhernovskaya-3 respectivelytotal consideration of US$18 million.consideration of US$977.8 million.OctoberLtd) for a total cash consideration ofUS$32.0 million.79.9% of the voting stock of theholding structure, which controls(also named Kuzbassugol in thetext) to ArcelorMittal for a totalJuly<strong>Severstal</strong> acquired a 100% stakein TOO Semgeo, operating a gold<strong>Severstal</strong> drew US$1.2 billion ona previously signed on a 5-year<strong>Severstal</strong> completed the acquisition74.2% of SeverCorr LLC. Accordingly,consideration of US$652 million.<strong>Severstal</strong> acquired a 100% stakemine Balazhal in East Kazakhstan,syndicated loan facility. The facilityof a 100% stake of a tradingfrom January 2008, SeverCorr wasin WCI Steel Inc. (now re-namedfor a total consideration of US$38.9bears an interest rate of LIBOR +company, ZAO Trade Houseincluded in <strong>Severstal</strong>’s consolidatedDuring April – August 2008,<strong>Severstal</strong> Warren Inc.) locatedmillion.2.35% per annum and has a 1.5 year<strong>Severstal</strong> – Invest from its majorityfinancial statements.<strong>Severstal</strong> acquired additionalin Warren, Ohio, for a totalgrace period followed by quarterlyshareholder, for a total considerationstakes in SeverCorr LLC from theconsideration of US$443.1 million.In August - October 2008, <strong>Severstal</strong>repayments.of US$27.4 million. ZAO Trade House<strong>Severstal</strong> completed the acquisitionformer management and OAOcompleted the acquisition of 100%<strong>Severstal</strong> – Invest owns a 99.0%of a 100% stake in Celtic ResourcesDneprometiz from third parties for aSteel Capital SA, a non-related party,stakes in OAO Karelsky Okatysh,stake in OOO North Steel Company,Holdings Plc by acquiring theremaining 13.7% stake in thetotal consideration of US$56 million,increasing its ownership to 91.8%issued US dollar denominated loanparticipation notes in an aggregateOAO Olkon and in OAO <strong>Severstal</strong>-Metiz by acquiring the remainingNovembera 87.0% stake in OAO Rostovmetall,and a 99.0% in ZAO PPTK-1.company for a total consideration ofand 96.8% respectively.principal amount of US$1,250 million5.2%, 7.3% and 3.0% stakes in these<strong>Severstal</strong> acquired a 100% stakeUS$44.0 million.for the sole purpose of financing aentities for a total consideration ofin PBS Coals Ltd, a U.S. coal<strong>Severstal</strong> acquired a 91.6 % stake inMayloan facility between OAO <strong>Severstal</strong>and Steel Capital SA. The notesUS$70.6 million, US$32.7 millionand US$9.7 million, respectively.mining company, for a total cashconsideration of US$876.8 million.OAO StalMag for a total consideration<strong>Severstal</strong> acquired a 100% stake inare due on July 29, 2013 and bearof US$17.6 million.Sparrows Point LLC (now re-namedinterest at an annual interest rate of<strong>Severstal</strong> acquired a 53.8% stake in<strong>Severstal</strong> Sparrows Point LLC)9.75% payable on January 29 andHigh River Gold Mines Ltd for a totalMarchlocated in Baltimore, Maryland,for a total consideration ofJuly 29 of each year.cash consideration of US$62.5 million.<strong>Severstal</strong> reported a 22.5% increaseUS$818 million, subject to certain<strong>Severstal</strong> acquired a 100% stakein full 2007 year revenues toadjustments of US$48 million,in Redaelli Techna SpA for anUS$15.25 billion and a 33.1% risein 2007 year net profit to US$1.94resulting in a final consideration paidof US$770 million.approximate total consideration ofUS$54.8 million.Principal events of 2009billion.February 2009<strong>Severstal</strong> has repaid its US$325 million Eurobonds – 2009. Repayment was financed by the company’s own sources.March 2009<strong>Severstal</strong> reported a 44.4% increase in full year 2008 revenues to US$22,393 million and a 9.9% rise in 2008 net profitto US$2,034 million.16 17
The world of <strong>Severstal</strong><strong>Severstal</strong> demonstrated very significant growth prior to the globaleconomic slump in the last quarter of 2008. Now our strategy, basedon the understanding that the global steel industry should experiencesubstantial downsizing in the next few years, is to adjust production to thenew levels of demand.Our position of low cost producer in Russia, with more efficient, lean assetsin the US and Europe, will make <strong>Severstal</strong> one of the most attractiveinvestment propositions when markets return to growth.18 19
Russian SteelRussian Steel remains one of the key players on the Russian domesticmarket. It is focused on high-margin, high value-added products, which itcan produce at an extremely competitive cost by global comparison.22 23
<strong>Severstal</strong> North America<strong>Severstal</strong> North America’s total steel production in 2008 was approximately5.1 million tonnes of crude steel and 4.4 million tonnes of rolled steel roducts.With a large customer base and extensive product mix, <strong>Severstal</strong> NorthAmerica is now focused on restructuring and efficiency.24 25
LucchiniLucchini is the second largest steel group in Italy and one of the largestEuropean producers of special quality long steel products. With more than1,000 customers in niche markets, including automotive, rails, bearings,springs and wire rod, Lucchini’s total steel production in 2008 was 3.0 milliontonnes of crude steel and 3.1 million tonnes of finished products.26 27
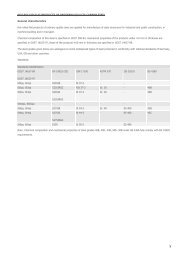
MetalwareThe Metalware segment produces metal products from cold-drawn highcarbonand low-carbon steel for retail consumers, and also for the automobile,construction and engineering industries. In 2008, the segment turned outa total of 847 thousand tonnes of metal products with sales of US$1,175million.The Metalware segment produces metal productsfrom cold-drawn high-carbon and low-carbon steelfor retail consumers, and also for the automobile,construction and engineering industries. In 2008, thesegment turned out a total of 847 thousand tonnes ofmetal products with sales of US$1,175 million.28 29
Costs and pricesUntil mid-2008, rapid economic development,especially in emerging economies, has fosteredunprecedented growth in steel demand and production.Growing demand for steel, in turn raised the steelindustry’s demand for related raw materials such asiron ore, coking coal, coke, scrap and ferroalloys. Rawmaterials producers have responded with significantincreases in production, but short-term supply has notkept up with demand. Partly reflecting the short supplyand high price of key steelmaking inputs, steel pricesrose significantly during this period. Prices for steeland steelmaking raw materials reached their historicalheights in summer 2008.However, since mid-2008 declining global demand,high stocks and other unfavourable market conditions,have sent steel prices down sharply for most productsin most regions. Steel prices in some markets weredown by almost 50% from their peak summer levels.The steel market collapse quickly loosened the rawmaterial markets. Spot prices for steelmaking rawmaterials, ocean freight and energy have fallen, withdemand for these commodities disintegrating. Steelscrap prices plummeted to an extremely low level. Thesituation for iron ore, coal and ferroalloys was reportedas being less dramatic as large quantities are sold onlong-term contracts with prices fixed annually.With falls in steelmaking raw materials’ prices andshipping rates, production costs declined in the latterhalf of the year. This has completely removed anysupport steel prices had from high operating costs, asseen in early 2008.Mergers and acquisitions, andvaluationsGlobal consolidation in the steel industry continuedin 2008 as steel companies aimed to expand theirgeographic presence, consolidate supply, and gainaccess to new markets and customers.In consolidation targets, last year’s M&A activity wassimilar to 2007, with particularly strong focus on theUS where many of the remaining mid-sized companieswere acquired, mainly by international majors fromother regions, including Russia. There is also a newtrend for steelmaking companies - the 2008 upturn iniron ore and coking coal and other materials prices hasprompted much M&A activity in the mining sector. Manyleading steel companies have made self-sufficiency inraw materials a key strategic priority.<strong>Severstal</strong>’s investment in US M&A activityin 2008 reached US$3.2 billion, which amounted to94% of <strong>Severstal</strong>’s total M&A activity in 2008.Despite recent consolidation activity, the steel industryremains much more fragmented than that of itssuppliers (particularly iron ore), or its largest customers(such as automotive producers), or non-ferrousindustries. Further takeovers, mergers and alliances areinevitable as producers look to integrate horizontallywith other mills, and vertically with raw materialsuppliers and steel distributors, to secure their futures.It is possible that M&A activity will be substantial innext few years, now that it is cheaper to buy than tobuild. The enterprise value of many steel companiesis down 75% or more from their peak. Some steelcompanies may join with others based on changes inthe industry’s structure, such as new demand patterns,regional trade shifts and new relationships betweensteel products and raw materials prices.<strong>Severstal</strong>’s position in the globalindustryIn 2008, according to the Steel Business Briefing’slisting of the top 20 world steelmakers, <strong>Severstal</strong>became the world’s 14th largest steel producer byproduction volumes, with output reaching 19.2 milliontonnes of crude steel (9.7 percent up compared to2007). Our Russian Steel division is Russia’s thirdlargest steel company by volume of crude steelproduction with 11.1 million tonnes, which constitutes16.1% of total Russian crude steel production in 2008.Table 3. Largest steel-making companiesMillion metric tonnes crude steelSource: Steel Business BriefingOn the Russian market, which remains the mostimportant to us, we compete against NLMK, MMK andUral Steel in the production and distribution of flatrolledproducts to auto-making, pipe-making, machinerybuilding, construction and steel service centres.In the construction, metalware and engineeringindustries, we compete with MMK, ZSMK, Mechel SteelGroup and Maxi Group in the production and sale oflong products. These companies, as well as Ukrainianenterprises, are our principal competitors in the exportmarkets.<strong>Severstal</strong>’s competitiveadvantages<strong>Severstal</strong> maintained a leading position in the domesticmarket due, principally, to high production quality, wide2008 2007 Change year-on-year %Rank Output Rank OutputArcelorMittal 1 103.3 1 116.4 (11.3)Nippon Steel 2 35.6 2 35.3 0.8Baosteel 3 35.4 5 28.6 23.8HebeiI&S 4 33.3 - - -Posco 5 33.1 4 31.1 6.4JFESteel 6 33.0 3 33.9 (2.7)WuhanI&S 7 27.7 11 20.2 37.1TataSteel 8 24.4 6 26.5 (7.9)Anshan-Benxi 9 23.4 7 23.6 (0.8)Shagang 10 23.3 8 22.9 1.7US Steel 10 23.3 10 21.5 8.4ShandongI&S 12 21.8 - - -Gerdau 13 19.6 13 17.9 9.5<strong>Severstal</strong> 14 19.2 15 17.5 9.7Nucor 15 18.5 12 20.0 (7.5)Evraz 16 17.7 17 16.5 7.3Riva 17 17.2 14 17.9 (3.9)ThyssenKrupp 18 16.0 16 17.0 (5.9)Maanshan 19 15.0 18 14.2 5.6SumitomoMI 20 13.9 20 13.5 3.0product range, reliable deliveries and flexible paymentconditions.A constant drive to optimise costs helps us improve ourfinancial results and allows us to enter new markets. Wealso successfully satisfy growing customer demand formore technical support and maintenance.In export markets, we sell basic-quality productswhere the key competing factor is price. With sales ofinnovative products such as automobile body sheetsand strips, quality ranks in equal importance to price.Our long-term competitive advantage is having verticallyintegrated operations which provide us with security inraw materials. During the downturn vertical integrationallows us to source most of our raw materials fromwithin, and thus protect our margins.34 35
Russian market- the biggest production unit of <strong>Severstal</strong> ResourcesPipe industryConstruction and steel service centresSteel market- became number one in the Russian mining industry inproduction of iron ore pellets.The pipe industry is divided into two segments:producers of pipes for the oil and gas industry andIn 2008, this segment consumed about 20 milliontonnes, more than 10% up on 2007. The growth ofIn 2008, Russia produced 56.6 million metric tonnes ofsteel products, down 5.0% compared to 2007 (source:Chermet). Consumption of steel products reducedThe market for metal-intensiveindustriesproducers of pipes for the public utilities and housingsector.consumption in first three quarters of 2008 was suchthat the fall in demand in fourth quarter didn’t offset it.by 14% from 40 million tonnes in 2007 to near 34.4<strong>Severstal</strong>’s major customers in Russia are the pipe-In 2008, the size of Russian pipe market was about 4.9However, the segment did experience a rapid fall inmillion tonnes in 2008. Export of steel products frommaking industry, auto-making industry, machinery-million tonnes, excluding seamless pipes, down 8% ondemand over short period. Reduced availability ofRussia decreased by 9.2% compared to 2007, from 29.5building industry, construction and steel service2007. The market is characterised by a high degree ofcredit financing and reduced demand for residentialmillion tonnes to 26.8 million tonnes (source: Chermet).centres, and all four are strategically important to us.industry consolidation with few major pipe-makers andconstruction led to review and curtailing of long-termImports of steel products into Russia decreased byOur export sales are divided into two segments - Balticsconsiderable deferred market demand.plans of construction companies, resulting in less27% compared to 2007, amounting to 4.6 million& CIS and foreign markets.demand for steel.tonnes. Imports of steel pipes decreased by 40.6% andamounted to 0.95 million tonnes (source: Chermet).Coal and iron ore marketsCoking coalAutomotive industryIn 2008, this industry bought 2.1 million tonnes of steelproducts, down 9% from 2007. The market is highlyconcentrated, with three major customers sharingWe expect a rise in competition in the pipes for oiland gas industry in the next few years, related to apossible increase in production volumes by existingcompetitors and introduction of new capacities. Untilrecently, the market for pipes for the public utilities andOutlook for 2009Steel demand has collapsed in 2008 and is likely toTotal volumes of Russian coal concentrate productionover 50% of steel purchases, though with a gradualhousing sector demonstrated growth in demand due toremain weak during 2009. It is possible that aggressivewere 50 million tonnes (source: Rasmin). In 2008,reduction of their share year on year. Until recently, theincreased residential construction activity.production cuts across the globe will stabilise prices<strong>Severstal</strong> Resources’ share of the overall coking coaldecline in domestic car production was compensatedsoon, but we do not anticipate an extensive rebound.concentrate production volumes in Russia was 9%,for by growth in foreign car production at RussianThe economic downturn has led to a reduction in steel3% less than the previous year. This reduction in sharejoint venture automotive companies, the majority ofdemand from the pipe-making industry. This reductionWeak steel demand combined with expected lower costwas caused by the sale of coal producer Kuzbassugol inwhich are assembling plants. Future prospects for thisis smaller for main-line pipes as the government, apressure from steelmaking raw materials’ prices, areApril 2008. However, <strong>Severstal</strong> Resources’ market sharemarket are linked to both production volumes at thesemajor customer, didn’t change its operational planslikely to result in lower steel prices that could be onlyin the Russian market of hard coking coal concentratejoint venture companies and to the increasing level ofsignificantly. However, economic instability may causeslightly above average global production costs. At thereached 20.0% in 2008, which is 2.2% higher than 2007.localisation of production. There is also a new trend ina decline in steel consumption in this sector despitesame time, Russian steel producers should be able tothe Russian automotive industry - growing cooperationdeferred demand. For pipes for the public utilities andbenefit from significantly lower than average productionTotal volumes of coking coal concentrate consumptionbetween major national automakers with the worldhousing sector the reduction in demand is larger due tocosts, supported by the depreciation of the rouble, andin Russia were 42 million tonnes in 2008, 0.4 millionleaders through strategic alliances.reduced activity in construction industry.continue to generate solid cash flows.tonnes less than in 2007. The volume of exportdeliveries was 8.9 million tonnes, 1.0 million tonnes lessDue to the sharp deterioration in financial conditionsMachinery buildingDemand may be stimulated successfully in China bythan in 2007. The majority (78%) of deliveries went toin the last months of 2008, steel demand from theIn 2008, the size of the Russian market for metalthe second half of 2009, though in many other regions,integrated steel mills, and 22% to chemical plants.industry has declined appreciably. The availability ofproducts for machinery was approximately 6.0 millionrecovery will be muted and unhurried. SignificantIron oreconsumer credits reduced sharply, demand for carsdropped and financing for automakers’ operationaltonnes, which is 10% lower than in 2007. The marketis still fragmented with a large number of smallinfrastructure investment stimulus packages announcedin the US and China should support steel markets, if notTotal volumes of Russian iron ore production were 89activity also became far less available. Many autoand medium-sized customers despite continuingin the short term, at least over two to three years.million tonnes (source: Rudprom). <strong>Severstal</strong> Resources’dealers try to minimise the effect of the economic crisisconsolidation.share of this was 15.7%, 1.1% more than 2007.by reducing car inventories. The Russian governmentEconomic growth may be lower than expected. Inprovides support to local car producers in the formThe industry shows considerable decline in steeladdition, the global economic downturn may be moreIn 2008, <strong>Severstal</strong> Resources’ share in the Russianof protective measures (increase of import duties forconsumption. Machinery building in general has aprotracted that currently assumed. These risks maymarket of iron ore pellets reached 34.1%, 4.5%foreign cars, government support of customer creditlong production-to-sale cycle so this industry is morecrystallise if economic policy responses to the currenthigher than 2007. Our share of the market of iron orefor domestic car purchases) which are already having adependent on credit financing. Reduced availability ofprecipitous economic situation are delayed, inadequateconcentrate reached 8.9% (0.4% up compared to 2007).positive effect.lending had a negative impact on operational activityor insufficiently coordinated where a global response isFor the second consecutive year, OAO Karelsky Okatyshand profitability of this sector.required.36 37
Risk managementRisk factorsfinancial crisis and tough credit conditions may lead to afinancial crisis, deteriorating demand and market• Increase of production of high value added goodslack of financing for capital projects.pressure from the steel industry.which are less sensitive to the market fluctuations;Activities of <strong>Severstal</strong> are subject to certain risks, themost important of which are described below. We aretaking steps to create an effective risk managementMergers and acquisitionsIn recent years, we have increased our ownershipTiming and volumes of raw material deliveries can besignificant factors which can easily run out of controlfor <strong>Severstal</strong>, in particular the rapid suspension of• Strengthening of our position in product niches.Competitionsystem aimed at developing confidence in reachinginterests in a number of companies and acquired otherproduction due to lack of steel demand along withThe current economic situation may cause seriousstrategic and operating goals and at providingcompanies, businesses and production assets. You canslow changes of the prices and tariffs for raw materialschange in peer competition in the industry. There is areasonable assurance in protection from potentialfind more detailed information in the Principal events ofand energy resources, and tariffs remaining high forthreat of competition from alternative materials whichlosses. The corporate policy, standards and procedures2008 section.land transport services. <strong>Severstal</strong> also depends ondue to their features can replace steel in auto making,of risk management system covers all divisions andThere can be no assurance that we will achieve therelationships and contracts with the major suppliers ofconstruction, pipe production, production of packingentities of <strong>Severstal</strong>.target synergies in our operations in the United States orraw materials, energy resources and services worldwide.materials.elsewhere in connection with the recent acquisitions.Our high level of self-sufficiency in iron ores, pellets,Top-managers of the company, management andcoke and coking coal allows for significant risk reductionTo improve our competitive capabilities we areemployees at each level are responsible for developingand using the risk management system, and we have arisk management committee in <strong>Severstal</strong> to coordinateits implementation, with key managers as members. TheMarket risksChanges in demandin primarily Russian Steel.Changes in selling pricesOne of the specific features of steel and miningundertaking certain measures:• Continuous efforts to decrease costs and increaseefficiency at each stage of production;• Proactive position to find new attractive nicheBoard of Directors and top management of the companyDemand for steel products depends on the economicindustries is their liability to cyclical changes of steelmarkets to enter them earlier than competitors;control the system’s effectiveness.growth in different regions of the world and demand inprices. Positive price conditions that had existed before• Research activity to define real needs of customers toChange of economic situationmetal-intensive industries. Our business is especiallysensitive to changes of demand in the machinery,the fourth quarter of 2008 were replaced by the sharp fallof prices.be able to offer to them competitive quality.Recently Russia has shown dynamic economic growth.However, the global financial crisis and suddenconstruction and oil and gas industries. Unlike pastyears, demand for steel in the world market will beDomestic orders have decreased substantially beginningFinancial risksdeterioration of credit conditions have broken theexisting trends and have led to increase of economicgrowing minimally or may even decrease in absolutefigures compared to 2008. At the same time it isthe last quarter 2008. Export sales now accountfor a large part of the sales volume. Spot prices forCredit riskrisks in Russia, affected the country’s investment climatenecessary to note that sharp decline in demand andfinished goods and low visibility, even in the short term<strong>Severstal</strong> developed and implements policies andnegatively, and decreased the activity of investors andproduction in the fourth quarter of 2008 and first monthsperspective, are the specifics of export sales at theprocedures to manage credit risks, including creditcustomers.of 2009 created the basis for de-stocking and created amoment. As a result, even relatively small changes ofcommittees’ approvals. The policy is to use advanceterms for cyclical rebuild of the world economy startingprices in the foreign markets can affect our business.payments for selling products. Using post paymentThe slowdown in economic growth, decrease in foreignfrom the second half of 2009.normally requires a bank guarantee from an approvedinvestment and deterioration of solvency, as well asgreater general pessimism and uncertainty, have veryseriously affected the development of the RussianFluctuations in the prices of rawmaterials, energy and servicesOur policy will allow us to moderate the negative impactof the present economic situation and to overcome thecrisis faster. Our major efforts are currently aimed at:bank, or credit insurance. Letters of credit may be usedas well. Only after approval by credit committee, areproducts sold to key customers on deferred paymenteconomy and the dynamics of certain industries,<strong>Severstal</strong> consumes significant volumes of raw materials• Effective management of working capital;conditions.especially key steel customers such as construction andsuch as coking coal, iron ore, ferroalloys and base• Increase of operational effectiveness,;auto making.metals, as well as electricity, natural gas and industrial• Close control over costs,;gasses.• Focus on customers (quality of production andLack of stability in the stock markets is a serious risk thatSince the fourth quarter of 2008, prices of raw materialsservices);directly affects our capitalisation and share price. Thefor steel production are decreasing due to the world38 39
Financial institutionsIn order to diversify credit risks, we hold financialresources in deposits and accounts or securities inaccordance with the limits set for financial institutionsAs of December 31, 2008 <strong>Severstal</strong> had net currencyposition, liabilities exceeded assets in US$ and Euros:• US$ – US$2,677.1 million;• Euros – US$ 484.2 million.Loss of key competencies, skills andknowledge due to reduction ofemployees during the slowdownOur environment protection requirements includestatutory payments for air, water and soil pollution andthe installation of special refining equipment.and holdings. <strong>Severstal</strong> management monitors financialDeteriorating demand for steel caused by the economicinstitutions’ ratings to minimise the potential impact ofcounterparty default.Interest rate fluctuationsThe financial crisis resulted in increased volatility and<strong>Severstal</strong> does not use forward contracts or other hedgeinstruments which might lower the impact of such losses.Operational risksdownturn demands less workforce. We have developedand implemented a programme of staff optimisationaimed at reducing expenses.However, the uncertainty of the situation and necessityLegislationand regulatory risksTaxes legislation changesincreased risk premiums in the debt financing. Thesefactors may limit our access to financial markets.Investments effectivenessfor further staff reduction leads to an increasing risk oflosing valuable industry expertise, knowledge and skills,Despite almost complete codification, RussianFederation taxes and duties regulations constantlyIncreased cost of financing may negatively affect theThe world steel market is characterised by high andboth technical and managerial.change, with additions being made every year. And whilefinancial results and lead to lower return on investments.growing requirements for quality and variety in steelmost changes aim to improve rights of taxpayers, someFluctuations of interest rates may affect future cashproducts. Our investment programme is aimed atTo mitigate these risks, we continue to implementof changes may have a negative effect.flows. Interest rates are either fixed or floating andreducing costs and increasing productivity, improvingpersonnel development and retention programmes,normally linked to LIBOR or EURIBOR. We continuouslyquality, and extending variety. We finance thetalent management, and accentuate our corporateBut as a whole, current legislation provides taxpayersmonitor the capital markets situation and take necessaryinvestment programme from both internal and externalvalues and ethical principles, and their role in differentwith enough effective instruments to secure their rightsmeasures to reflect the changing market conditions. Thesources.situations and Some other additional measures.and interests, and <strong>Severstal</strong> uses these instruments.level of debt financing as of December 31, 2008 wasUS$ 8.26 billion. So changes of interest rates may haveIn order to mitigate the technical and technological risks,Health, safety and environmental risksLicensing legislation changessignificant impact on our financial results. We havewe choose contractors for construction, installationThe mining and steel industries present potentialWe engage in many types of operations anda positive net position on financial instruments withand launch of equipment thoroughly. Our employeeshazards to the environment and to people because theactivities, some of which are subject to licensing. Ourfixed rates as of December 31, 2008, financial assetsare regularly assessed and when necessary trainingproduction process includes high temperatures andorganisational and technical operations, and productionwith fixed rates exceeded liabilities with fixed rates byis provided. A company-wide people developmentaggressive chemicals, and creates both solid and liquidand business processes, take place in accordance to theUS$118.5 million. We have a negative net position on theprogramme is in place.industrial waste. This results in strict requirementshighest standards, so the toughening and enforcementfinancial instruments with floating interest rates as ofDecember 31, 2008, financial liabilities exceeded assetsEquipment technical conditions risksbeing applied to mining and steel companies regardingoccupational health and safety, fire protection andof licensing requirements and conditions does notpresent a significant risk.with floating interest rates by US$4,501.4 million.Exchange rate fluctuationsOur production activities may be affected by risks in thetechnical condition of equipment. Incidents may lead tostoppage in production, idle time, decreasing productionenvironmental safety.In 2008, we introduced unified health, safety andLegislation and regulation risksmanagement policiesWe may be affected by exchange rate risks if we acquirevolumes and breach of quality standards.environment protection policy, including commitments to:<strong>Severstal</strong> bases its activities, both Russian andassets or liabilities nominated in currencies other thanMitigation includes our investment programme as well• Comply with all of the relevant regulatoryinternational, on strict adherence to all applicable lawsour functional currency.as planned preliminary repair and our maintenancerequirements;and regulations – tax, customs, and currency control,programme.• Develop, implement and maintain efficient HS&Eand ensures monitoring, with timely and adequateWe engage in transactions and acquire assets andWe maintain insurance covering property, plant andmanagement systems;reaction to changes, and strives to build and maintainobligations in several currencies: Russian roubles, USequipment commensurate with the standards of other• Prevent unsafe actions and eliminate unsafeconstructive dialogue with regulators on interpreting anddollars, Euros, and others. In the second half of 2008,international and domestic steel companies and haveconditions in the workplace;implementing laws and regulations.changing macroeconomic conditions and the financialbusiness interruption insurance cover ranging from fixed• Train and encourage our employees to use safe andcrisis led to significant changes to the Russian balance ofcosts to full gross profits, depending on the plant, forenvironmentally friendly work practices, and providepayments. The Russian rouble devalued. Further declineinterruption periods of up to twelve months’ indemnity.them with effective personal protection equipment;of the rouble in respect to US$ may negatively affect ourWe also purchase insurance for third-party liability in• Make all senior and line management responsibleability to serve our debt.respect of property or environmental damage.for the safe working arrangements and continualimprovement of HS&E performance;40 41
<strong>Severstal</strong> performancereview<strong>Severstal</strong> revenueUS$ million<strong>Severstal</strong> EBITDAUS$ millionan increase from 11.6% in 2007. This was due to asuccessful start up at Columbus Mill and consolidationgalvanized and other metallic coated sheet by 77.6%,semifinished products by 51.3%, hot-rolled strip and2522201512,72315,50322,39365432,9553,6885,366of Sparrows Point, Warren and Wheeling. It waspartially offset by a drastic decline in demand in thefourth quarter 2008 resulting in certain melting facilityshut-downs and reduced melting capacity at Dearborn,due to “B” blast furnace incident in early 2008. Theplate by 56.7% and cold- rolled sheet by 80.1%.Strategy102share of Lucchini was 17.8% in 2008, while in 2007 it<strong>Severstal</strong> benefited from the strong global demand for51was 24.2%.steel products in the first three quarters of 2008 due00to the structural strengths of its low-cost, vertically-2006 2007 20082006 2007 2008Compared to 2007, Mining increased its EBITDA marginintegrated Russian platform and a high value-added,by 8.1% to 35% and became our most profitablediversified product mix in its European and US<strong>Severstal</strong> is an international,vertically-integrated metals and miningcompany that sells high-quality metaland mining products to customers allover the world.Key production figuresIn 2008, <strong>Severstal</strong> reported record revenues ofUS$22,393 million, 44.4% more than in 2007. Thevolume of crude steel production increased by 9.7 %segment in 2008, mainly due to increase in prices forcoal and iron ore. In 2008, Russian Steel’s EBITDAmargin amounted to 30.1%, compared to 31.0%in 2007. In 2008, Izhora Pipe Mill’s EBITDA marginamounted to 27.5% compared to 27.4% in 2007.Lucchini decreased its EBITDA margin to 10.8% inbusinesses. We completed a number of long-termstrategic investment projects in 2008, including a fullramp-up of <strong>Severstal</strong> Columbus in the United Statesof America and a completion of a Kolpino Mill-5000modernisation in Russia.In 2008, we became the world’s 14th largest steeland reached 19.2 million tonnes in 2008 compared2008 from 11.1% in 2007 mainly due to increasesIn 2008, we acquired three steel plants and a cokingproducer. We are a full production cycle companyto 2007. EBITDA was US$5,366 million, 45.5% morein prices for raw materials. Metalware increased itscoal producer, PBS Coals, in the United States ofcomprising ore mining enterprises, steel mills and rolledthan in the previous year. This performance was dueEBITDA margin to 9.7% in 2008 from 8.6% in 2007America, which helped to secure vertical integrationproduct plants, as well as downstream productionto strong demand and higher prices in the first ninefollowing a programme to reduce costs, an increasedand improve resilience of our US business platform.businesses. Our production facilities are geographicallymonths of 2008. However, there was an exceptionalshare of high-value added products in the productIn addition, we continued to build global verticaldiverse, with locations in Russia, the United States,drop in the demand for steel in the fourth quartermix, and consolidation of Redaelli. <strong>Severstal</strong> Northintegration by acquiring African Iron Ore Group LtdItaly, France, Great Britain, Ukraine, Africa, Kazakhstanof 2008, as global economic conditions worsenedAmerica increased its EBITDA margin to 7.1% in 2008(now re-named <strong>Severstal</strong> Liberia Iron Ore Ltd). We alsoand elsewhere.dramatically, and this affected our 2008 year resultsfrom negative 2.8% in 2007 mainly due to the effectsignificantly strengthened our existing gold portfolionegatively. The EBITDA margin grew from 23.8% toof one-off gains related to long-term electricity supplyby acquiring High River Gold Mines Ltd in a favourableFollowing a corporate restructuring in April 2008,24.0%.contract buy-out, an award from AT Massey Coal Co inmarket environment.<strong>Severstal</strong> is made up of three divisions: <strong>Severstal</strong>connection with a breach of contract for coal supplyRussian Steel, <strong>Severstal</strong> Resources (Mining) andRussian Steel remained our most important businessand a portion of insurance settlement proceeds (net ofThe economic downturn led to an unprecedented<strong>Severstal</strong> International. <strong>Severstal</strong> Russian Steel divisionby share of total revenue, which grew from 54.4% inloss).decline in global steel consumption in the last threeincludes Russian Steel, Izhora Pipe Mill, and Metalware.2007 to 50.2% in 2008. Izhora Pipe Mill contributedmonths of 2008 and called for decisive strategicThe Resources division comprises <strong>Severstal</strong>’s assets3.7% to our total revenues, with US$824 million.In 2008, the principal products we manufacturedmeasures. We have focused our efforts on optimisingrelating to iron ore, coal and gold mining. InternationalMetalware’s share decreased slightly, by 1.3%,were hot-rolled strip and plate (22.5%), long productscosts, rationalising our existing assets in line withincludes North American operations and Lucchini.although its sales grew by US$163 million. Mining’s(11.2%), galvanized and other metallic coated sheetdemand, and preserving our financial resilience, whileshare of consolidated revenues decreased to 11.0% in(7.0%), cold-rolled sheet (8.5%), and metalwaremaintaining a long-term focus on satisfying customer2008 compared to 11.9% a year earlier. <strong>Severstal</strong> Northproducts (3.6%). In 2008, our sales of long productsdemand in the growing industries and securing a strongAmerica contributed 23.8% to total revenues in 2008,grew by 20.4%, metalware products by 37.1%,cost position worldwide.42 43
The principal elements of our long-term strategy are to:• Address long-term development needs of the emerging economies by expanding our product offering to theconstruction, infrastructure, transport and energy sectors• Focus on profitable value-added niche products in the developed markets• Maintain a leading cost position through the cycle:- Target full vertical integration into steelmaking raw materials for our integrated steel mills.- Develop through EAF-based variable-cost technology in scrap-rich regions.• Create value in our mining business by international expansion into highly attractive mining commodities’markets, including acquisitions of production facilities and exploration and development of new deposits inresource-rich, low-cost locations• Maintain financial resilience and discipline, with a returns-focused approach to M&A and capital spending projects.To realise this strategy, we will continue to rationalise our facilities, improve cost competitiveness and implementstringent cost-saving and cash-preservation measures. At the same time, we will continue critical investments infuture growth platforms, including infrastructure and construction markets in Russia and vertical integration into rawmaterials worldwide.Capital investmentsIn 2008, we invested US$2,152 million, 1.1% more than You will find more detailed information in thein the previous year, mainly on Russian Steel, Mining description of each business. We have acted decisivelyand <strong>Severstal</strong> North America equipment modernisation in the face of an increasingly challenging environmentprogrammes and new projects.and reduced our capex plans for 2009 to US$1.0 billion,<strong>Severstal</strong>’s capital investments (US$ million)Segments 2008 2007 Change year-on-year %<strong>Severstal</strong> North America 694 978 (29.0)Russian Steel 669 513 30.4Mining 415 384 8.1Lucchini 338 199 69.8Metalware 32 30 6.7IPM 8 23 (65.2)Intersegment adjustment (4) 1 n/aTotal capex 2,152 2,128 1.1<strong>Severstal</strong>’s revenue by segments*, 2008<strong>Severstal</strong>’s EBITDA by segments*, 2008<strong>Severstal</strong>’s capex by segments, 2008including US$0.6 billion of maintenance works, fromour US$3.0 billion projected long-term plan. Our revisedcapex spending is focused on crucial maintenance andphase out of expansion projects, the majority of whichhave been suspended.In 2008, capital investment programmes at our mainsteel production and mining facilities in Russia, as wellas our steel production facilities in the US and Europe,were focused on modernising existing facilities,expanding production and achieving operationalefficiencies.Russian Steel45.0%IPM3.3%Russian Steel62.8%IPM4.2%<strong>Severstal</strong> North America 32.2%Metalware1.5%Lucchini15.9%Metalware4.7%Lucchini8.0%Metalware2.1%Russian Steel31.1%IPM0.4%Mining<strong>Severstal</strong> NorthAmerica9.8%21.3%Mining<strong>Severstal</strong> NorthAmerica15.9%7.0%MiningLucchini19.3%15.7%Intersegmentadjustment(0.2%)*-Excludes intersegment adjustments of US$2,613 milliondecrease in revenue*-Excludes intersegment adjustments of US$30 milliondecrease in EBITDA44 45
Developing promising steel gradesTo gain competitive advantages, we developed newproducts including: tube-making strips, such as X-70and X-100 API-class strength steel for large diameterpipelines; heavy plates for a shipbuilding project tobe rolled by the 2800 and 5000 rolling mills; hot-dipgalvanized sheets for automotive exposed parts andIF-steels; new-class carbon and low-alloyed steels withincreased corrosion resistant and low-temperatureresistant properties; and long products of A 500C classfor construction applications.Investments in new productionfacilitiesIn 2008 we started Kolpino, a processing service centrewith an annual capacity of 80,000 tonnes. This has anumber of unique production facilities for painting,beam welding and plasma arc cutting. Constructingthis centre was a part of our strategy to increasethe production of high value-added products (deepprocessing of plates for shipbuilding, engineering andconstruction industries).In 2008, we spent $18.3 million on our ongoing projectat TPZ Sheksna, a mill capable of producing 250,000tonnes of electric welded pipes a year. We also investedin the construction of Balakovo Mill, a new facility inthe Saratov region in Russia. This mill, with the plannedcapacity of approximately 1.0 million tonnes, willproduce a wide range of long products primarily for theconstruction industry.We also successfully completed the first stage ofSeverCorr project (now named <strong>Severstal</strong> Columbus).This included the construction of 1.5 million tonnes ofsteelmaking capacity, hot strip mill, a pickling line andtandem cold mill facility, a batch anneal, a temper mill,and a galvanizing line.Operational efficiency and cost savinginvestmentsIn North America we completed the modernisationof “C” Blast Furnace at Dearborn. This includedthe introduction of pulverized coal injection (PCI),a technology which allows a reduction in theconsumption of coke and natural gas. This was a partof our programme for stage-by-stage transfer of blastfurnaces to this technology, which we already use atLucchini.We also started a number of projects at Lucchiniaimed at reducing costs, improving the product mixand optimising coke and gas use. These investmentsinclude installing a continuous casting machine atthe Fos sur Mer, optimising the steel shop at theHagondange plant and improving productivity ofthe EAF at the melt shop at the Fos sur Mer plant atAscometal.In North America we launched two major projects in2008. The first relates to the construction of a newpickle line and tandem cold mill, which is expected todecrease operating costs and allows <strong>Severstal</strong> NorthAmerica to produce the steel products its automotivecustomers will require in the future. The second projectrelates to the construction of a new exposed hot-dipgalvanizing line.The volume of crude steel production increasedby 9.7 % and reached 19.2 million tonnes in 2008compared to 2007.46 47
Mining<strong>Severstal</strong>’s Mining segment is one of Russia’s three largest producers of iron oreconcentrate (with a market share of 8.9%, source: marketing agency Rudprom), pellets(34.1%, source: Rudprom), coking coal (11%, source: marketing agency Rasmin) andferroniobium (5%, source: management estimation).In 2008, we continued our expansion into the goldproduction business through several acquisitions.As a result, <strong>Severstal</strong>’s gold division has becomeRussia’s second largest gold producer. After gatheringa pool of entities in the CIS, we have entered the NorthAmerican market and acquired the medium-sized coalproducer, PBS Coals Limited. This company is locatedin Pennsylvania, US, close to international seaportsin Baltimore and Norfolk, and near to <strong>Severstal</strong>’sNorth American steel companies. In November 2008,we acquired African Iron Ore Group Ltd (renamed to<strong>Severstal</strong> Liberia Iron Ore Ltd), to carry out geologicalsurveys and explore iron ore deposits in the PutuRange, Liberia.Our production in 2008 included 723 thousand tonnesof coking coal, 2,222 thousand tonnes of steam coal,4,574 thousand tonnes of coking coal concentrate,4,674 thousand tonnes of iron ore concentrate, 9,363thousand tonnes of pellets, 147 tonnes of ferroniobiumand around 6.2 tonnes (199,881 ounces) of gold.Revenues from our Mining businesses amounted toUS$2,452.7 million in 2008, with EBITDA totallingUS$859.4 million.StructureWe group our Mining businesses as follows:• Iron ore production• Coal production• Gold production• Corporate centre• Ferroniobium production.Within our small ferroniobium production business, weproduced 147 tonnes in 2008.Iron ore productionOur iron ore division includes two extractingcompanies: OAO Karelsky Okatysh, producing pellets,and OAO Olkon, producing iron ore concentrate.OAO Karelsky Okatysh is located in Kostomuksha, atown in the Republic of Karelia in north-west Russia. Theestimated life of its reserves is 39 years, based on ananalysis of optimal mine development.OAO Olkon is located in Olenegorsk, a town in theMurmansk region in north-west Russia. The estimatedlife of its reserves, according to our geological statisticsreport, is 19 years.Coal productionOur coal production division includes Vorkutaugol,PBS Coals Ltd (which we acquired in November 2008)and Kuzbassugol (until April 2008, when we sold itto ArcelorMittal for a total consideration of US$652million).Vorkutaugol comprises five mines (Vorkutinskaya,Severnaya, Zapolyarnaya, Komsomolskaya andVorgashorskaya), the Yunyaginsky open pit, and severalwashing plants. It extracts both coking and steam coal,and is located in Russia’s European North, in the city ofVorkuta in the Komi Republic. Its estimated economiclife is 29 years, based on an analysis of optimalreserves development.PBS Coals Ltd operates strip mines (Leon Paul, Trentand Rhoads) and deep mines – all using the methodof room and pillar, with continuous miners, Quecreek,Miller, Geronimo, Agustus, Roytown and KimberlyRun. The company is based in Somerset County,Pennsylvania, US. It extracts coking and steam coal,and produces coking coal concentrate.We sold Kuzbassugol mainly because it was no longera strategic asset; its revenue became less than 12.2%of the Mining segment’s total revenue in 2007. Also,the temporary deficit of coking coal on the Russian andglobal markets in early 2008 enabled us to sell thecompany at a good price. We used the proceeds fromsale to finance our Vorkuta operations.Gold productionOur gold production division includes the followingentities (data about reserves comes from the officialstatistical reports of each entity):• OOO Nerengri-Metallik (the Tabornoye field)is located in the Republic of Sakha-Yakutia.Its gold reserves of C1+C2 category amount toapproximately 10 tonnes.• ZAO Mine Aprelkovo (the Pogromnoye field) islocated in the Chita region. The mine’s reserves ofC1+C2 category amount to 7.8 tonnes.• Celtic Resources Holdings Plc (the Suzdal andZherek fields) is located in Kazakhstan. Itsgold reserves of C1+C2 category amount toapproximately 31 tonnes.• Severnaya Zolotorudnaya Kompaniya acquires anddevelops gold fields. In the second half of 2007 thecompany won rights to geological exploration andsubsequent gold production at:- Uryakhskoye gold ore field, located in the Irkutskregion (P2+P3 category resources of 100 tonnes)- Sagan-Golsky (P1+P2 category resourcesestimated at 60 tonnes)- Vitimkansky plots (estimated resources of 15tonnes) in the Republic of Buryatia- Kunikansky gold ore field, located in the Chitaregion (P2 category resources of 15 tonnes)- Nerchinsky gold ore field, located in the Chitaregion (P2+P3 category resources of 58 tonnes).In July 2008, we acquired TOO Semgeo, operating inthe Kazakhstan Balazhal mine with 30.4 tonnes of goldreserves of C1+C2 category.In November 2008, we acquired High River GoldMines Ltd, operating in Russia and Burkina Faso withmeasured and indicated CIM Classified Resources(including reserves) of 105 tonnes of gold. We alsoacquired a 50 % share of the licence for Prognoz, with3,351 tonnes of silver.Corporate centreOur corporate centre carries out administrative andcontrol functions.48 49
Ferroniobium productionSince January 2008, the Mining segment also includesferroniobium production, carried out by OAO StalMag,in Krasnoyarsk, East Siberia, Russia. The company hasreserves with an estimated life of 12 years, according toour geological statistics report.StrategyAs the principal supplier of raw materials for the<strong>Severstal</strong> Russian Steel segment, the Mining segmentforms the foundation of our vertically integratedKey performance indicatorsbusiness model. Our key strategic priorities for thesegment are:• Improving the quality of industrial safety, labourand environmental protection• Further strengthening our position in the coal andiron ore markets• Making good use of our mining expertise bydiversifying our ferrous metals production businessand expanding our presence in the non-ferrousmetals market, gold in particular.Our aim is to ensure the sustainable development of ourexisting mining assets, and to enable growth into newminerals and geographies.2008 2007 Change year-on-year %Revenue (US$ million) 2,452.7 1,849.1 32.6Gross profit (US$ million) 1,081.4 667.0 62.1Profit from operations (US$ million) 606.4 282.0 115.0Operating margin (%) 24.7 15.3 n/aEBITDA (US$ million) 859.4 497.0 72.9EBITDA per tonne (US$/tonne) 41 20 105EBITDA margin (%) 35.0 26.9 n/aAverage product prices (FCA) (US$/tonne)Coking coal (concentrate) 144 84 71.4Steam coal 36 26 38.5Iron ore concentrate 72 59 22.0Pellets 103 75 37.3Ferroniobium 24,658 n/a n/aGold (US$/oz) 887 n/a n/aEBITDA margin (%)Coal 26.2 8.1 n/aIron ore concentrate 39.5 41.4 n/aPellets 40.6 39.6 n/aFerroniobium (80.8) n/a n/aGold 41.6 n/a n/aIn 2008, our Mining segment’s revenue increased by 2008 amounted to US$161 million, with EBITDA margin32.6%, to US$2,452.7 million. This was primarily due to of 39.5%, and the Vorkutaugol contribution in 2008higher sales prices for our products. EBITDA amounted amounted to US$213 million, with EBITDA margin ofto US$859.4 million, 72.9% higher than in 2007, and 29.9%. These increases were due to higher productionour EBITDA margin increased from 26.9% in 2007for the first nine months of 2008 and higher sellingto 35.0% in 2008. Our gold business added US$82 prices.million to the EBITDA increment in 2008 with an EBITDAmargin of 41.6%. OAO Karelsky Okatysh contribution The average number of employees in the Miningto EBITDA in 2008 amounted to US$425 million, with segment in 2008 was 24,040, which was 2,765 feweran EBITDA margin of 40.6%. OAO Olkon contribution in than in 2007.Production resultsProduction volumes, thousand tonnes 2008 2007 Change year-on-year %Coking coal 723 1,847 (60.9)Coking coal concentrate 4,574 5,789 (21.0)Steam coal 2,222 1,827 21.6Iron ore concentrate 4,674 4,651 0.5Pellets 9,363 10,045 (6.8)Ferroniobium (tonnes) 147 - n/aGold (tonnes) 6 - n/aThe 60.9 % decrease in coking coal production wasdue to sale of Kuzbassugol, lack of Moschny (strong)seam mining at the Severnaya mine, and a decrease inthe average number of development longwalls at ourVorkutaugol entities. The sale of Kuzbassugol, and aOur production of iron ore concentrate increased byonly 0.5%. The production of pellets decreased by 6.8%due to reduction in demand in the fourth quarter – yetefficiency measures led to higher production during thefirst 10 months of 2008.global sales decline in the fourth quarter of 2008, alsocontributed to this decrease. The 21.0% coking coalconcentrate decrease was due mainly to the sale ofKuzbassugol. Addition of PBS Coals Ltd led to increaseFerroniobium and gold production growth was due tothe incorporation of OAO StalMag and a number of goldproducing companies into the Mining segment.in coking coal production by 235 thousand tonnes inNovember-December 2008.Steam coal production grew 21.6% due to increasedextraction of steam coal at Vorkutaugol and addition ofPBS Coals Ltd.50 51
Sales and marketingThe Russian raw material marketThe coal businesses in our Mining segment are amongRussia’s top four coking coal producers (source: Rasmin).Sales by products, FCA based with discounts/price premium2008 2007 Change year-on-year %Thousand US$ million Thousand US$ million Thousand US$ milliontonnestonnestonnesCoking coal 746 38.7 2,167 69.9 (65.6) (44.6)Coking coal concentrate 4,504 650.5 5,795 486.6 (22.3) 33.7Steam coal 1,983 70.9 2,328 60.3 (14.8) 17.6Pellets 9,164 939.3 9,927 745.8 (7.7) 25.9Iron ore concentrate 4,763 341.6 4,562 267.7 4.4 27.6Ferroniobium (tonnes) 146 3.6 - - n/a n/aGold (tonnes) 6.7 190.4 - - n/a n/aTotal sales by products - 2,235.0 - 1,630.3 n/a 37.1Other and shipping - 217.7 - 218.8 n/a (0.5)Total sales - 2,452.7 - 1,849.1 n/a 32.6Inter-segment transactions (13,081) (1,379.5) (15,363) (1,099.1) n/a n/aSales by productsHigh-value-added products accounted for the largestpart of our sales in 2008. Pellets accounted for 38.3%of total sales, coking coal concentrate accounted for26.5% and iron ore concentrate accounted for 13.9%.Coking and steam coal accounted for 1.6% and 2.9% ofrevenue respectively.The negative economic environment affected the lastquarter of 2008, leading to a decline in demand foriron ore. Nevertheless, due to our incorporation of newassets, the expansion of our gold business, continuingefficiency measures, and a positive market environmentduring the first nine months of 2008, we managed toachieve higher sales figures for 2008 than for 2007.Coking coal sales fell by 65.6% in volume and 44.6% inrevenue in 2008, compared with 2007.Coal concentrate sales decreased by 22.3% in volumeand increased by 33.7% in revenue, resulting fromthe sale of Kuzbassugol (volumes) and the increasein prices (revenue). Sales of steam coal decreased by14.8% in volume in 2008, compared with the previousperiod, and grew by 17.6% in revenue. Again, thereasons for this were the sale of Kuzbassugol (volumes)and the increase in prices (revenue). Pellet sales fellby 7.7% in volume and increased by 25.9% in revenue.Iron ore concentrate sales increased by 4.4% in volumeand 27.6% in revenue. During 2008, we started to sellferroniobium and gold.Principal marketsRussian marketRussia is the principal market for our Miningbusinesses. Our main customer is <strong>Severstal</strong>’s RussianSteel segment.Domestic sales by products, FCA based with discounts/price premiumOur iron ore businesses, which produce iron oreconcentrate and pellets, are among the leaders in termsof extraction volumes in their respective markets.Our share of the overall Russian iron ore concentrateproduction increased from 8.5% in 2007 to 8.9% in2008. Our share of Russian pellet production increasedfrom 29.6% in 2007 to 34.1% in 2008 (source:Rudprom).We can guarantee our stable market position, as wehave the following competitive advantages:• We are the only mining business in Russia capableof offering the whole range of principal iron sources:iron ore pellets, iron ore concentrate, coking coaland ferroniobium.• We produce unique raw materials for steel plants inthe Russian market: fluxed iron ore pellets and highgradehard coking coal.• We have a quality resource base in Russia, allowingus to produce valuable grades of coal and highqualityiron ore products.• We offer a high level of client service, includingflexible pricing policies.• We have a convenient geographical location closeto our principal consumers, as well as favourablelogistics and a developed infrastructure close to ourmain assets.• Our Mining businesses are part of our verticallyintegrated metallurgic holdings, which means wehave greater access to financial, intellectual andprofessional resources.We forecast that, in spite of the downturn in economicactivity, our share of raw materials production formetallurgy (iron ore and coking coal) on the Russianmarket will increase in 2009. This will be due to ourintroduction of customer-oriented programmes, andchanges in the supply chain of our vertically integratedmetallurgical holdings.2008 2007 Change year-on-year %Thousand tonnes US$ million Thousand tonnes US$ million Thousand tonnes US$ millionCoking coal 673 32.4 2,086 66.8 (67.7) (51.5)Coking coal concentrate 3,933 599.0 4,981 424.1 (21.0) 41.2Steam coal 1,723 57.1 1,727 45.3 (0.2) 26.0Pellets 7,205 738.4 7,740 621.1 (6.9) 18.9Iron ore concentrate 4,612 328.7 4,562 267.7 1.1 22.8Ferroniobium (tonnes) 146 3.6 - - n/a n/aGold (tonnes) 3.3 94.3 - - n/a n/aTotal sales by products - 1,853.5 - 1,425.0 n/a 30.1Other and shipping - 161.0 - 151.4 n/a 6.3Total domestic sales revenue - 2,014.5 - 1,576.4 n/a 27.8Inter-segment transactions (12,287) (1,292.5) (15,006) (1,045.6) n/a n/aOur share of sales on the Russian market in 2008 was 82.1% of revenue. The largest part of our revenue on theRussian market resulted from sales of pellets (36.7%), coking coal concentrate (29.7%) and iron ore concentrate(16.3%).52 53
ExportExport accounted for 17.9% of our total sales byrevenue in 2008. The principal exports were pellets(45.9%), gold (22.0%) and coking coal concentrate(11.8%). The share of other products was negligible.The main destinations for these products were Europe,the US and the CIS (Ukraine and Belarus principally).Export sales by products, FCA based with discounts/price premium2008 2007 Change year-on-year %Thousand tonnes US$ million Thousand tonnes US$ million Thousand tonnes US$ millionCoking coal 74 6.3 80 3.1 (7.5) 103.2Coking coal concentrate 572 51.5 814 62.5 (29.7) (17.6)Steam coal 260 13.8 601 15.0 (56.7) (8.0)Pellets 1,959 201.0 2,187 124.6 (10.4) 61.3Iron ore concentrate 151 12.9 - - n/a n/aFerroniobium - - - - n/a n/aGold (tonnes) 3.3 96.2 - - n/a n/aTotal sales by products - 381.7 - 205.2 n/a 85.9Other and shipping - 56.5 - 67.5 n/a (16.3)Total export salesRevenue - 438.2 - 272.7 n/a 60.7Inter-segment transactions (794) (87.0) (357) (53.5) n/a n/aCostsCost of sales structure2008 2007 Change yearon-year%US$ million % of total US$ million % of totalMaterialsGrinding balls and rods 40.0 2.9 28.6 2.4 39.9Explosives 36.8 2.7 30.5 2.6 20.7Metal - roll 21.0 1.5 7.9 0.7 165.8Technological coals 12.2 0.9 20.8 1.8 (41.3)Other materials 143.0 10.4 103.5 8.8 38.2Integral implements and spares 49.9 3.6 34.7 2.9 43.8Total materials 302.9 22.1 226.0 19.1 34.0EnergyElectric power 140.7 10.3 125.6 10.6 12.0Gasoline 62.7 4.6 33.4 2.8 87.7Other energy resources 74.2 5.4 54.1 4.6 37.2Total energy 277.6 20.2 213.1 18.0 30.3Staff costs 403.1 29.4 321.2 27.2 25.5Depreciation and amortisation 223.5 16.3 196.9 16.7 13.5Services 207.7 15.1 183.8 15.5 13.0Change in inventories (60.8) (4.4) (1.2) (0.1) n/aOther 17.3 1.3 42.3 3.6 (59.0)Total 1,371.3 100.0 1,182.1 100.0 16.0Exports of coking coal concentrate and steam coal decreased by 29.7% and 56.7% in volume, 17.6% and 8.0% inrevenue respectively. This was due to the sale of Kuzbassugol in April 2008.Capital expenditureWe invested a total of US$415 million in our Miningbusiness in 2008, 8.1% more than in 2007. We spentUS$161 million of this modernising and developing theVorkutaugol mines, US$72 million on new equipmentat OAO Karelsky Okatysh, US$54 million on OAO Olkon,and US$100 million on gold entities.As part of our development strategy, we made thefollowing investments in 2008:• Investment in coal-producing projects: US$171million in 2008• Investment in projects to increase extraction andrefining of iron ore: US$126 million in 2008• Investment in projects to increase our extractionand refining of gold: US$100 million in 2008In 2008, costs in the Mining segment increased byUS$189.3 million, or 16.0%. This was due to a 34.0%increase in the cost of raw materials, a 30.3% increasein the cost of energy and a 25.5% increase in labourcosts. The increase in the cost of raw materials was duenot only to the increase in the volume of production, butalso to price rises.Decisive management actions<strong>Severstal</strong>’s management has taken decisive action tomitigate the impact of the global economic downturnon the company, and to preserve cash. Since November2008, we have taken certain measures to adjust ouroperations to the new environment:• Cost reduction measures – decreasing theadministrative headcount, reducing overheads,and optimising production plans to meet reduceddemand. We are also rescheduling beneficiationand pelletisation levels to optimise equipmentproductivity.• Working capital measures – renegotiating contractconditions, daily control of accounts receivable, anddecreasing inventory levels.• Minimising capital expenditure – for 2009, wehave scheduled only critical maintenance projects,amounting to US$218.6 million. We have postponedother projects.• Minimising M&A activity – we do, however,continue to monitor market opportunities. Forexample, we acquired a majority stake in High RiverGold Mines Ltd in the fourth quarter 2008, as weconsider this a good market opportunity.54 55
Russian SteelRussian Steel is <strong>Severstal</strong>’s largest segment by revenue. In 2008, it was the thirdlargest steel company in Russia by volume of crude steel production (16.1%) andthird in terms of rolled products (17.7%).Crude steel production in Russia, 2008Steel products production in Russia, 2008Russian Steel comprises:Cherepovets Steel MillThis mill specialises in steel production (with a totalsteelmaking capacity of 12 million tonnes a year).Output decreased due to its open-hearth furnaceclosing on November 1, 2008. The mill also produces awide range of flat and long-rolled products, includinghot and cold-rolled flat products, galvanized andcolour coated products, and long-steel applications.Rolling mill 5000, in Kolpino, produces hot-rolled platesand strips. ZAO Severgal, which became a workshopof Cherepovets Steel Mill in 2008, produces highqualitygalvanized steel for the automotive and otherindustries.A ferrous scrap metal recycling business operating inNorthwest and Central Russia, previously part of theMining segment, has transferred to Russian Steel.We acquired ZAO Trade House <strong>Severstal</strong>-Invest, awholesaler of rolled metal products, from its MajorityShareholder in December 2008. It is one of the largestnetworks of metal trading companies in Russia,and sells a wide range of steel products through itsbranches in the western Russian Federation.The consolidated financial statements for the year2007 were adjusted to account for the effect of scrapcompany transfers and the acquisition of ZAO TradeHouse <strong>Severstal</strong>-Invest.Scrap collection and processingWe sold participation in OAO Metallurgremont to aOur ferrous scrap metal recycling business providescompany controlled by its Majority Shareholder, andscrap metal to Cherepovets Steel Mill and otherOOO RTI Centre to a third party.Evraz18.9%Metallinvest9.1%Evraz19.7%Metallinvest9.9%companies.MMK<strong>Severstal</strong>17.3%16.1%MechelOther7.5%18.8%MMK<strong>Severstal</strong>19.5%17.7%MechelMAXI Group7.7%2.4%Trading and service companiesFor the purpose of structure and expensesoptimisation, OOO Severshtamp merged with OOONLMK12.3%NLMK14.1%Other9.0%This segment comprises trading companies in theSSM-Tyazhmash, and ZAO Neva-MetallTrans with ZAOSource: ChermetSource: ChermetRussian Federation and abroad.Neva-Metall.Russian Steel’s geographical location gives usWe produced 11.1 million tonnes of crude steel andThe main purpose of service companies is to maintainthe production processes of Cherepovets Steel Mill.Strategyfavourable access to raw materials, transportationnetworks and markets.10.1 million tonnes of semi-finished, rolled anddownstream products in 2008. Revenue was US$11.25Changes in of our steel businessRussian Steel’s main objectives are:billion, an increase of 33.3% compared to 2007. AndWe recently established ZAO <strong>Severstal</strong> Long Product• To increase output of high-margin productsWe produce a wide range of products through this partEBITDA was US$3.39 billion, up 29.7% on 2007.Mill Balakovo. Located in the Saratov region, it will• To increase its share in the most profitable marketof our business, including hot-rolled sheets, profiles,produce long products. However, the project is currentlysegments, namely:and cold-rolled coated sheets – encompassing special-on hold until the market situation improves.- Plate for pipes and shipbuilding industriesgrade sheets for the automotive industry, hot-rolled- Constructing mini-mills to manufacture rolledplates and long products. Most of our products are soldWe’ve also acquired <strong>Severstal</strong>lat Silesia Spzoo,products for the construction industryto the domestic market, including Russian automotive,in Poland, which specialises in the resale of- High-quality products for engineering.construction, shipbuilding, engineering and otherrolled products. Its forecasted sales volumes are• To improve cost control and efficiency.industries.approximately 100 thousand tonnes.56 57
Key performance indicatorsIn 2008, Russian Steel’s revenue grew by US$2.81billion. This was 33.3% up on 2007, due to a growthin sales prices. The average price for steel productsincreased by US$275 per tonne in 2008. Productioncosts grew significantly in 2008 due to a rise in thecost of raw materials and energy – as well as a higheraverage wage.Key performance indicatorsRussian Steel averaged 49,551 full-time equivalentemployees in 2008, down 0.6% compared to 2007.Despite various acquisitions, the number of employeesremained stable due to a deliberate downsizingpolicy. Cherepovets Steel Mill reduced its workforceby 8.4%, with some employees transferring to servicecompanies. Russian Steel’s management has takenseveral measures to mitigate the effects of the globaleconomic downturn, leading to a reduction in thenumber of employees of approximately 9 thousand inthe last quarter of 2008 and the first quarter of 2009.But this was partly offset by increased prices for rolledproducts, so our 2008 operating margin decreased to26.1%.In 2008, overall EBITDA grew by 29.7%. EBITDA pertonne grew by 34.6% to US$318.3. The EBITDA margindecreased slightly, from 31% to 30.1%.2008 2007 Change year-on-year %Revenue (US$ million) 11,245.7 8,435.5 33.3Gross profit (US$ million) 4,260.8 3,201.1 33.1Profit from operations (US$ million) 2,935.9 2,242.8 30.9Operating margin (%) 26.1 26.6 n/aEBITDA (US$ million) 3,389.3 2,613.0 29.7EBITDA per tonne (US$/tonne) 318.3 236.4 34.6EBITDA margin (%) 30.1 31.0 n/aAverage steel product price (US$/tonne)* 942 667 41.2Semifinished products (US$/tonne) 681 430 58.4Hot-rolled strip and plate (US$/tonne) 962 649 48.2Cold-rolled sheet (US$/tonne) 910 671 35.6Galvanized and other metallic coated sheet (US$/tonne) 1,153 928 24.2Color coated sheet (US$/tonne) 1,472 1,249 17.9Long products (US$/tonne) 867 610 42.1Others tubes and pipes, formed shapes (US$/tonne) 1,049 801 31.0Metalware products (US$/tonne) 1,126 845 33.3Average scrap price (US$/tonne) 385 234 64.5* excluded scrapProduction resultsIn 2008, Russian Steel produced 8.1 million tonnes ofhot metal (7.2% less than in 2007), 11.1 million tonnesof crude steel (6.7% less than in 2007) and 10.1 milliontonnes of steel products (6.4% less than in 2007).Production resultsProduction volumes, thousand tonnes 2008 2007 Change year-on-year %Total outputHot metal 8,125 8,759 (7.2)Crude steelBasic oxygen furnaces 8,141 8,323 (2.2)Elictric arc furnaces 1,895 2,076 (8.7)Open hearth furnaces 1,061 1,500 (29.3)Total crude steel 11,097 11,899 (6.7)Production for saleSemifinished products 909 872 4.2Rolled productsHot-rolled strip and plate 4,680 5,004 (6.5)Cold-rolled sheet 1,358 1,435 (5.4)Galvanized and other metallic coated sheet 669 735 (9.0)Color coated sheet 220 230 (4.3)Long products 1,808 2,022 (10.6)Total rolled products 8,735 9,426 (7.3)Other tubes and pipes, formed shapes 439 470 (6.6)Metalware products 41 43 (4.7)Total production for sale 10,124 10,811 (6.4)The first nine months of 2008 were quite successfulfor Russian Steel. Crude steel production was 600thousand tonnes higher than for the same period in2007.Production cuts started in October 2008. In the fourthquarter of 2008, crude steel production was down48% quarter-on-quarter, mainly due to lower domesticdemand. As a result, the open-hearth furnace wasclosed on November 1, 2008.Sales and marketingIn 2008, revenues rose by 33.3% compared to 2007,despite a slight decrease in shipments. This isexplained by a decrease in steel consumption in thelast quarter of 2008. The increase in revenue is duemainly to a considerable increase in average salesprices for steel products in the first nine months of2008, compared to the same period in 2007.Russian Steel’s sales by productIn 2008, sales of hot-rolled strip and plate accountedfor 42.2% of overall sales volume (41.2% of revenue),long products for 17.3% of volume (15.3% of revenue),cold-rolled sheet for 12.0% of volume (11.1% ofrevenue), semi-finished products for 8.2% of volume(5.7% of revenue) and galvanized and other metalliccoated sheet for 6.1% of volume (7.1% of revenue).58 59
Russian Steel’s sales by product2008 2007 Change year-on-year %Thousand US$ million Thousand US$ million Thousand US$ milliontonnestonnestonnesSemifinished products 942 641.0 881 378.7 6.9 69.3Hot-rolled strip and plate 4,820 4,637.4 5,037 3,267.4 (4.3) 41.9Cold-rolled sheet 1,372 1,249.1 1,422 954.7 (3.5) 30.8Galvanized and other metallic сoatedsheet 695 801.3 756 701.4 (8.1) 14.2Color coated sheet 244 359.1 232 289.7 5.2 24.0Long products 1,980 1,715.8 2,115 1,290.0 (6.4) 33.0Others tubes and pipes, formed shapes 463 485.6 514 411.7 (9.9) 17.9Metalware products 76 85.6 75 63.4 1.3 35.0Scrap 835 321.3 1,243 290.7 (32.8) 10.5Total steel products 11,427 10,296.2 12,275 7,647.7 (6.9) 34.6Other and shipping - 949.5 - 787.8 n/a 20.5Total sales 11,427 11,245.7 12,275 8,435.5 (6.9) 33.3Inter-segment transactions (1,028) (1,190.0) (880) (647.7) 16.8 83.7Principal marketsRussian marketThe Russian market is the most important for RussianSteel. Market share, in revenue terms, changed onlyslightly – 69.3% in 2008, compared to 69.5% in 2007.As well as low logistics costs, the Russian market hasone of the highest growth rates in the world, and allowsfor long-term relationships with customers on culturaland other “soft” grounds.In 2008, sales to the Russian market dropped by 6.3%,yet revenues grew by 34.2%. Hot-rolled strip and plateaccounted for 43.7% of sales, while long productsaccounted for 25.3%, cold-rolled sheet for 12.9%, andgalvanized and other metallic coated sheet for theremaining 7.8%.Russian Steel’s main domestic customers include pipemills and automotive, machinery, construction andshipbuilding companies.Compared to 2007, we sold 8.1% less hot-rolled stripand plate by volume and 39.1% more by revenue in2008. For long products, this was an 8.4% decreasein shipments by volume and an increase by 31.7% inrevenues. Revenues from galvanized and other metalliccoated sheet increased by 0.4% in tonnes and by 26.1%in US dollars.Overall, the first three quarters of 2008 the domesticmarket showed very favourable dynamics, connectedwith speculative demand. Almost all Russian steel millsstruggled to meet market demand. But this situationreversed in the fourth quarter of 2008 – speculativedemand started to diminish due to growing economicuncertainty, pulling prices down as well as demand.However, as stated before, this fall in the last threemonths of 2008 only modestly influenced results forthe year as a whole.Export marketsExport sales volumes went down by 7.9% in 2008,compared to 2007, while revenues grew significantly– by 35.7%, thanks to price increases. The maincontributors to export revenues were hot-rolled stripand plate (39.5%), semi-finished products (21.5%),scrap (18.1%) and cold-rolled sheet (10.5%).In 2008, we enjoyed good prices for every product inglobal markets. With sales volumes of hot-rolled stripand plate growing by 3.9%, this led to an increase inrevenue of 49%. Another leading export was semifinishedproducts, with revenues 70.6% higher thanin 2007 thanks to 7.1% higher sales volumes and verypositive price dynamics.Sales by regionStrategically, Russian Steel is building long-termrelationships in the CIS and the EU. Deliveries toother regions are primarily carried out on a spotbasis. However, sales to tube and pipe makers, andautomotive producers are part of the dedicatedbusiness process, and are treated as a priority.In 2008, the main regions of export were Europe (59.7%of the export revenues) and the Middle East (15.3%).Revenues from other regions account for 25% of exportsales. This export structure is very similar to that of2007 (60.8% Europe, 17.3% Middle East).Sales by industryRussian Steel focuses on selling products to thepipe production, automotive, machine building andconstruction industries, and to steel service centres(also referred to as regional distribution). In revenueterms, regional distribution accounted for 51.3% of allsales worldwide in 2008. Pipe production accountedfor 20.9%, the automotive industry for 10.4%, andconstruction for 3.3%.The sales structure is similar to that in 2007’s, and canbe attributed to Russian Steel’s long-term marketingstrategy.Revenues by regions, 2008 Revenues by industry, 2008Russian Federation 69.3%Europe18.3%The Middle East 4.7%South-East Asia 2.2%China and Central Asia 1.7%Central & South America 1.6%North America 1.4%Africa0.8%Trading andregional distributionPipemakingAutomotive51.3%20.9%10.4%Machine buildingSteel IndustryConstructionRailway Construction7.1%6.1%3.3%60 61
Capital expendituresWe invested US$669.4 million in our steel businessin 2008. Of this, we spent US$241.8 million onnew projects and US$427.6 million repairing andmodernising existing ones.Main ongoing projects• Air separation unit 12• Polymer coated line 2• Coke furnace battery No. 7 (with shop of chemicalproducts recovery No.2)• Blast furnace No. 3• Converter shop: Continuous caster 1-5,slab scarfer machineCostsCost of sales structure• Hot deep galvanized line• Scrap processing shop• Rolling mill-2800• Formed section shop• Sheksna weld pipe mill• Kolpino service centre2008 2007 Change yearonyearUS$ million % of total US$ million % of total%MaterialsCoal 976.6 14.0 606.2 11.6 61.1Coke 106.8 1.5 34.1 0.6 213.2Iron ore 626.2 9.0 507.8 9.7 23.3Pellets 538.5 7.7 465.0 8.9 15.8Scrap metal 1,406.9 20.1 1,074.8 20.5 30.9Ferroalloys and nonferrous metals 616.9 8.8 463.1 8.8 33.2Other materials 693.2 9.9 433.5 8.3 59.9Total materials 4,965.1 71.1 3,584.5 68.4 38.5EnergyGas 187.6 2.7 150.2 2.9 24.9Electric power 190.0 2.7 181.2 3.5 4.9Other energy resources 116.6 1.7 75.4 1.4 54.6Total energy 494.2 7.1 406.8 7.8 21.5Staff costs 631.4 9.0 553.5 10.6 14.1Depreciation and amortisation 391.3 5.6 316.9 6.1 23.5Services 266.0 3.8 204.5 3.9 30.1Other 236.9 3.4 168.2 3.2 40.8Total 6,984.9 100.0 5,234.4 100.0 33.4Costs of sales increased by US$1,750.5 million in 2008, compared to 2007.The main reason for this is an increase in prices formaterials and energy (US$1,384.4 million). Thisincludes the increase in scrap metal costs (US$487.7million), coal (US$358.8 million), iron ore (US$107.0million), pellets (US$90.2 million) and energy (US$82.5million).Costs of sales decreased by US$290.3 million dueto a drop in sales volumes by 848 thousand tonnes;the other factor contributed to the decrease in costsof sales by US$44.9 million is the raw materialsconsumption rate.Other factors contributed to the increase in cost of salesare the following:• Changes in the structure of used raw materials(US$50.2 million);• Loss from exchange rate movements (US$204.4million);• Higher labour costs (US$60.2 million). Higher labourcosts were mainly due to the increase in averagewages and salaries, connected to Russian inflation.• Higher depreciation and amortization of assets(US$63.5 million);• Increase in cost of services, such as insurance, setup and dismantling of equipment (US$54.0 million);• Cost of ferroalloys for production of different typesof steel (US$99.7 million);• Materials obsolescence provision (US$70 million)and fixed costs write-off (US$17.0 million), etc.Decisive managementactions:• Using modern technological materials anddecisions;• Improving industrial efficiency through better use ofenergy and materials;• Optimising purchasing costs;• Reducing functional and operating budgets;• Optimising the workforce and monitoring staffexpenses;• Cutting capital expenditure by focusing only onrepairing and modernising projects;• Implementing policies to reduce net working capitalduring the last quarter of 2008 and all of 2009.62 63
<strong>Severstal</strong> International:<strong>Severstal</strong> North America<strong>Severstal</strong> North America (SNA) comprises <strong>Severstal</strong> North America Inc. (Dearborn),SeverCorr LLC (Columbus), <strong>Severstal</strong> Sparrows Point LLC (Sparrows Point), <strong>Severstal</strong>Warren Inc. (Warren), <strong>Severstal</strong> Wheeling Inc. (Wheeling), Mountain State Carbon LLC,Northern Steel Group Inc. (NSG) and the holding companies, <strong>Severstal</strong> US HoldingsLLC, <strong>Severstal</strong> Wheeling Holding LLC and Baracom Limited. Apart from NSG, which is aservice centre, these companies make up the third largest steelmaking organisation inthe US.SNA has 12.0 million tonnes of annual crudesteelmaking capacity, 11.9 million tonnes of hotrolledsheet, 4.9 million tonnes of cold-rolled sheet,2.9 million tonnes of galvanized sheet and 0.7 milliontonnes of tin plate capacity. Our corporate headquartersare in Dearborn, Michigan, and our manufacturingfacilities are in: Dearborn, Michigan (Dearborn);Columbus, Mississippi (Columbus); Sparrows Point,Maryland (Sparrows Point); Mingo Junction, Ohio;Martins Ferry, Ohio; Yorkville, Ohio; Beech Bottom,West Virginia.We produce high-quality flat-rolled products – includinghot-rolled, cold-rolled, electro-galvanized, hot-dipgalvanized and tin-plated steel – for customers inthe automotive, converter, container, pipe and tube,construction, service centre and other markets. Wealso produce high-strength steel and other specialisedproducts, used mainly in the automotive industry.We concentrate on manufacturing high-value-addedproducts to maximise profitability.In 2008, we produced 5,100 thousand tonnes of slabs,and shipped 5,184 thousand tonnes of steel products.Our sales revenue in 2008 amounted to US$5,319million, with EBITDA of US$377 million.Joint ventures andassociatesSNA holds interests in four joint ventures and oneassociate. We set these up with other US companies toexpand our products and services. The joint venturesproduce metallurgical coke and galvanized steel, andprovide steel processing and roll grinding services.Double EagleDearborn owns 50% of Double Eagle Steel CoatingCompany, a joint venture with United States SteelCorporation. Double Eagle has the world’s largestelectro-galvanizing line, and produces premium qualitygalvanized sheet steel – primarily for automotivecustomers. The plant, located in Dearborn, Michigan,has a production capacity of 789,000 tonnes per year,and it dedicates around half of this to Dearborn.Spartan SteelDearborn owns 48% of Spartan Steel Coating LLC,a joint venture with Worthington Steel of Michigan.Spartan Steel produces hot-dip galvanized sheet steelprimarily for automotive and service centre customers.Its plant is in Monroe, Michigan. It has a productioncapacity of 544,000 tonnes per year, about 80% ofwhich it dedicates to Dearborn. Dearborn suppliesnearly 100% of the steel sheet used as substrate forSpartan Steel.Delaco ProcessingDearborn owns 49% of Delaco Processing LLC, whichis located in Dearborn, Michigan and specialises inslitting steel strip and sheet up to 1,829 mm in width.Delaco Supreme Tool and Gear Co. own the remaining51% of Delaco Processing LLC.Bethlehem Roll TechnologiesSparrows Point owns 50% of Bethlehem RollTechnologies (BRT) LLC, which is located in SparrowsPoint, Maryland and provides roll-grinding services toSparrows Point. Court Industries owns the remaining50% of BRT.Ohio Coatings CompanyWheeling owns a 50% voting interest and around44% equity interest in Ohio Coatings Company, a jointventure between Wheeling, TCC Steel and Nittetsu ShojiAmerica, Inc., which produces tin plate steel. The plant,in Yorkville, Ohio, has a production capacity of 300,000tonnes per year.Steelmaking facilitiesColumbus<strong>Severstal</strong> Columbus is a ‘greenfield’ steel company withnext generation technology. It’s based in Columbus,Mississippi, the heart of America’s new southernindustrial region. Construction of the steel plantbegan in October 2005, and it was commissionedoperationally in October 2007. The facility is a uniquecombination of mini-mill steelmaking and integratedfinishing technology. It features a scrap-based electricarc furnace, feeding a thin-slab caster coupled with ahigh-powered hot-strip mill. Thin-slab output is furtherprocessed in a highly sophisticated cold-rolling mill andgalvanizing line.Columbus focuses on the production of high-quality,flat-rolled steel with an initial annual productioncapacity of 1.5 million tonnes. The facility providesproducts for use in the automotive, building,agricultural, pipe and tube, and appliance industries.Columbus is the first EAF-based steel mill in the worldpositioned to produce exposed automotive steel.<strong>Severstal</strong>’s investment plans include a second phaseof construction to increase its capacity to 3.0 milliontonnes of high-quality steel.The plant’s location near a number of large steelcustomers makes distribution more efficient. With its1,400-acre site under development as an industrialpark to accommodate production partners and relatedmanufacturers on-site, Columbus complements SNA’smid-western US business: its major market is the southeasternUS, within 400 miles of the manufacturinglocation. Columbus’s objective is to become a leadingsupplier of a wide range of high-quality, flat-rolled steelproducts, including exposed automotive applications,for southern US customers.Dearborn<strong>Severstal</strong> acquired <strong>Severstal</strong> North America Inc.– located in Dearborn, Michigan – in January 2004. Thecompany produces and sells flat-rolled steel products,mainly to domestic automotive manufacturers and theirsuppliers, and has an annual capacity of 3.3 milliontonnes. As well as its steel operations, as noted above,Dearborn owns a 50% interest in Double Eagle, a 48%interest in Spartan Steel, and a 49% interest in DelacoProcessing. All these activities are based in southeasternMichigan.64 65
Mountain State CarbonDearborn and Wheeling each own 50% of MountainState Carbon LLC, a metallurgical coke-making jointventure, located in Follansbee, West Virginia. It wasformed to provide its owners with a reliable supply ofhigh-quality, competitively priced domestic coke. Itsannual production is 1 million tones, and our ownershipallows us to receive coke every year at a substantiallylower cost than imported coke.2008 AcquisitionsIn May 2008, <strong>Severstal</strong> acquired Sparrows Point, LLC(renamed to <strong>Severstal</strong> Sparrows Point, LLC), located inBaltimore, Maryland for a total consideration of US$818million. This was subject to certain adjustments ofUS$48 million, resulting in a final consideration ofUS$770 million. The transaction reflects a strategicopportunity to add complementary assets and scaleto SNA’s existing US business. Sparrows Point has acapacity of 3.4 million tonnes of crude steel; it is theonly integrated producer of flat-rolled steel on the USEast Coast and is a major North American supplier of tinmill products.In July 2008, <strong>Severstal</strong> acquired WCI Steel (renamedto <strong>Severstal</strong> Warren, Inc.), a producer of value-addedsteel products, based in Warren, Ohio, for a totalconsideration of US$443.1 million. This company’s totalannual steelmaking capacity of 1.4 million tonnes isfocused on high-quality, custom flat-rolled steel for usein demanding applications. It produces high-quality,flat-rolled steel for the automotive, appliance, furniture,construction and energy markets. However, in February2009, we announced the temporary shut down of thesteel galvanizing line at the <strong>Severstal</strong> Warren facility.<strong>Severstal</strong> Warren Inc. will remain idle while the companybalances production volume to match current demand.We expect this acquisition – which consists mainly oftwo operating companies, <strong>Severstal</strong> Wheeling, Inc. andNorthern Steel Group (NSG) – to play a critical role inour North American industrial strategy, with an annualcapacity of 2.5 million tonnes. The combined companyis one of North America’s leading producers of flatrolledsteel and expands <strong>Severstal</strong>’s product offeringsto direct customers and service centres.SNA expects to benefit substantially from co-operationbetween the new additions and existing US operationsin Dearborn, Michigan and Columbus, Mississippi. Theaddition of Wheeling and NSG to our US portfolio alsooffers potential for significant advances in operationaland financial efficiencies, as do our recent acquisitionsof Sparrows Point in Baltimore, Maryland and WCISteel in Warren, Ohio. Also, full ownership of MountainState Carbon will increase the company’s domesticcoke-making capacities and consolidate further our rawmaterial supply base.StrategyThe strategic objectives of <strong>Severstal</strong> North America are:• Improve efficiency of operations throughdownsizing and cost-cutting initiatives• Secure low cost raw material supplies• Improve margins and acquire downstream outletsfor our products.Key performance indicators2008 2007 Change year-on-year %Production of crude steel (Thousand tonnes) 5,100 2,230 128.7Sales of steel products (Thousand tonnes) 5,184 2,537 104.3Revenue (US$ million) 5,319 1,805 194.7Gross profit (US$ million) (522) (43) 1,114.0Profit from operations (US$ million) 145 (111) (230.6)Operating margin (%) 2.7 (6.1) n/aEBITDA (US$ million) 377 (50) (854.0)EBITDA per tonne (US$/tonne) 73 (20) (465.0)EBITDA margin (%) 7.1 (2.8) n/aAverage steel product price (US$/tonne) * 978 693 41.1Hot-rolled strip and plate (US$/tonne) 905 595 52.1Cold-rolled sheet (US$/tonne) 979 711 37.7Galvanized and other metallic coated sheet (US$/tonne) 1,040 864 20.4Color coated sheet (US$/tonne) 1,706 - n/aMetalware products (US$/tonne) 1,829 - n/aSemifinished products (US$/tonne) 967 - n/a* steel products include semifinished, rolled and downstream productsSales revenue in 2008 amounted to US$5,319 million,which is 194.7% higher than the US$1,805 millionwe achieved in 2007. EBITDA in 2008 amounted toThey are also due to favourable litigation and contracttermination outcomes, and ‘B’ blast furnace incidentinsurance recoveries.US$377 million, which is an 854.0% improvement onthe US$(50) million figure for 2007. Improvementsin operating profit in 2008 compared with 2007 areAt the end of 2008, 6,453 employees and contractorsworked at SNA, compared with 2,610 in 2007.related mainly to increasing sales volume – bothacquisition-related and market-driven – and revenuerates.In August 2008, SNA acquired Esmark Inc. (renamedto <strong>Severstal</strong> Wheeling Holding, Inc.) for a totalconsideration of US$977.8 million.66 67
Sales by products2008 2007 Change year-on-year %ThousandtonnesUS$millionThousandtonnesUS$millionThousandtonnesUS$millionHot-rolled strip and plate 2,215 2,004 1,353 805 63.7 148.9Cold-rolled sheet 1,088 1,065 464 330 134.5 222.7Galvanized and other metallic coated sheet 1,490 1,549 720 622 106.9 149.0Color coated sheet 17 29 - - n/a n/aTotal rolled products 4,810 4,647 2,537 1,757 89.6 164.5Metalware products 70 128 - - n/a n/aSlabs 294 292 - - n/a n/aPig iron 10 2 - - n/a n/aTotal semifinished products 304 294 - - n/a n/aTotal steel products 5,184 5,069 2,537 1,757 104.3 188.5Other and shipping - 250 - 48 - 420.8Total 5,184 5,319 2,537 1,805 104.3 194.7US salesHot-rolled strip and plate 1,913 1,729 1,222 727 56.5 137.8Cold-rolled sheet 1,040 1,021 433 309 140.2 230.4Galvanized and other metallic coated sheet 1,450 1,511 669 577 116.7 161.9Color coated sheet 17 29 - - n/a n/aTotal rolled products 4,420 4,290 2,324 1,613 90.2 166.0Metalware products 70 128 - - n/a n/aSlabs 290 290 - - n/a n/aPig iron 10 2 - - n/a n/aTotal semifinished products 300 292 - - n/a n/aTotal steel products 4,790 4,710 2,324 1,613 106.1 192.0Other and shipping - 250 - 48 - 420.8Total US sales 4,790 4,960 2,324 1,661 106.1 198.6Export salesHot-rolled strip and plate 302 275 131 78 130.5 252.6Cold-rolled sheet 48 44 31 21 54.8 109.5Galvanized and other metallic coated sheet 40 38 51 45 (21.6) (15.6)Color coated sheet - - - - n/a n/aTotal rolled products 390 357 213 144 83.1 147.9Metalware products - - - - n/a n/aSlabs 4 2 - - n/a n/aPig iron - - - - n/a n/aTotal semifinished products 4 2 - - n/a n/aTotal steel products 394 359 213 144 85.0 149.3Other and shippingTotal export sales 394 359 213 144 85.0 149.3In 2008, compared with 2007, sales volume increased by 104.3%. This was due primarily to the impact of our acquisitions of newentities, a strong US market for the first nine months of the year, and the restart of Dearborn’s ‘C’ blast furnace.Production resultsProduction volumes, thousand tonnes 2008 2007 Change year-on-year %Total outputHot metal 3,201 1,656 93.3Crude steel 5,100 2,230 128.7Hot-rolled strip and plate 4,772 2,666 79.0Cold-rolled sheet 2,387 1,279 86.6Galvanized and other metallic coated sheet 1,400 699 100.3Metalware products 92 - n/aProduction for saleHot-rolled strip and plate 2,087 1,382 51.0Cold-rolled sheet 1,009 484 108.5Galvanized and other metallic coated sheet 1,304 751 73.6Color coated sheet 17 - n/aTotal rolled products 4,417 2,617 68.8Metalware products 63 - n/aSlabs 295 - n/aPig iron 14 - n/aTotal semifinished products 309 - n/aTotal steel products 4,789 2,617 83.0In 2008, the acquisitions already mentioned, andthe commissioning of Dearborn’s ‘C’ blast furnace,combined to produce 5,100 thousand tonnes ofslabs. Compared with 2,230 thousand tonnes in2007, this is a 128.7% increase. Hot-rolled strip andplate output amounted to 4,772 thousand tonnes in2008 – an increase of 79.0 % on the 2,666 thousandtones we produced in 2007. Cold-rolled sheet outputamounted to 2,387 thousand tonnes in 2008 – anincrease of 86.6% on the 1,279 thousand tonnes weproduced in 2007. Galvanized and other coated sheetoutput amounted to 1,400 thousand tonnes in 2008.Compared with 699 thousand tonnes in 2007, this is anincrease of 100.3%.Dearborn’s ‘B’ blast furnace, which was scheduled fora complete reline in 2010, experienced a productionincident on 5 January 2008, resulting in a completeproduction outage. This event did not affect ‘C’ blastfurnace production significantly.Sales and marketingFrom 2007 to 2008, total sales volume and domesticsales volume increased by 104.3% and 106.1%respectively. This was due mainly to newly acquiredentities (Sparrows Point, Warren and Wheeling) and toColumbus attaining post-construction full capacity.Direct sales to automotive manufacturers in 2008accounted for 24.2% of total revenue, which is muchless than the 51.3% we saw in 2007. This decreaserelates to the fact that US automotive manufacturerswere the first to feel the impact of the negativeeconomic conditions in North America.The share of non-automotive revenue increased from48.7% in 2007 to 75.8% in 2008. This was due mainlyto our newly acquired entities and Columbus increasingsales, compared with 2007. Sparrows Point, Warren andWheeling are less affected by the automotive industrythan Dearborn, while Columbus has not met all industryrequirements to sell steel to automotive manufacturers.68 69
92.4% of 2008 total sales volumes were shipped to theUS domestic market, which is almost the same as in2007. Consequently, export sales accounted for 7.6%of 2008 total sales volumes. The Canadian marketaccounted for around 50.3% of exports, compared with98% in 2007. This decrease was due to Columbus andSparrows Point sales to Western Europe and SouthAmerica in 2008.Capital expenditureTotal capital expenditure in 2008 was US$694 million,which is 71.0% of the amount spent in 2007. Themajority of this (US$358 million) relates to modernisingDearborn’s ‘C’ blast furnace, and the remaining partrelates to capital expenditure at <strong>Severstal</strong> Columbus(US$263 million) and newly acquired entities (SparrowsPoint, Warren and Wheeling).CostsTotal cost of sales in 2008 was US$5,842 million, whichis three times higher than in 2007. The majority of thisincrease relates to newly acquired entities – SparrowsPoint, Warren, Wheeling and Northern Steel Group– which together amount to US$3,141 million. Also,the cost of sales at <strong>Severstal</strong> Columbus exceeded the2007 level by US$978 million, as it attained postconstructionfull capacity.Decisive management actionsSNA has undertaken initiatives to mitigate the effectof deteriorating general economic conditions in NorthAmerica. These include a selective reduction in meltand finishing operations, optimisation of productionschedules across North American facilities, effortsto align SNA’s supply base more consistently withdownscaled production requirements, and labour andoverhead cost reductions. We have also taken steps toimprove liquidity – including curtailing all discretionalcapital expenditure, and other measures to promotegreater working capital efficiency, such as trade creditextension and inventory optimisation.SNA revenues by industriesAutomotive 24.2%Service centres 21.9%Converters 31.1%Other customers 22.8%We have also introduced Total Operating Performance(TOP) and Total Cost of Ownership (TCO) initiatives,to help eliminate waste and inefficiencies in sales,purchasing, production, and staff departments – andwe expect these to have a beneficial impact on costs.<strong>Severstal</strong> International:LucchiniLucchini is the second largest steel group in Italy and one of the largest Europeanproducers of special quality steel long products by volume of production.Lucchini has 4.0 million tonnes of annual crudesteelmaking capacity, serving more than 1,000customers in niche markets such as automotive, rails,bearings, springs and wire rod.In 2008, we produced 3.0 million tonnes of crude steeland 3.2 million tonnes of finished products for sale,including 2.2 million tonnes of rolled steel, 0.6 milliontonnes of semifinished products and 0.4 million tonnesof hot metal and pig iron. Sales revenues in 2008 wereUS$3,989.5 million and EBITDA was US$429.8 million.Lucchini operates two principal businesses – Piombinoin Italy and Ascometal in France.Lucchini Piombino, ItalyPiombino is a European leader in long specialty steelproducts, including round bars, rolled blooms, andbillet and flat products. It is also a leading Italianproducer of high-quality wire rod, including drawingwire rod, cold heading steel and welding steel.StrategyPiombino has approximately 20% of European marketshare and 80% of domestic market share for rails andrail stocks, based on Eurofer data.Piombino’s main production facilities include plantsin Piombino, Trieste, Bari, Condove and Lecco (all inItaly), with headquarters located in Brescia, Italy. At theend of 2008, Piombino had 3,327 employees (full-timeequivalent).Lucchini Ascometal, FranceAscometal is a European leader in long special steelsand operates four integrated EAF-based mills, two coldfinishing centres and a distribution centre in France. Itsfacilities are strategically located near scrap collectionand processing centres. Its headquarters are in Paris,France. At the end of 2008, the company employed2,882 people (full-time equivalent).Lucchini’s overall strategic objectives are:• Continue to diversify the customer base.• Specialise in customised, high-quality products for the automotive, machinery, appliances and rail sectors.• Identify and realise the synergies of operating within <strong>Severstal</strong>.Piombino’s strategic objectives are:• Enhance the product offering with long products.• Alter the balance of production from semi-finished products and low-added-value long products, towardhigh-added-value flat products.• Improve operational efficiency.• Ascometal’s strategic objectives are:• Achieve significant growth in profitability.• Broaden the product offering.70 71
Key performance indicators2008 2007 Change year-on-year %Revenue (US$ million) 3,989.5 3,756.5 6.2Gross profit (US$ million) 617.0 562.1 9.8Profit from operations (US$ million) 268.3 216.4 24.0Operating margin (%) 6.7 5.8 n/aEBITDA (US$ million) 429.8 416.0 3.3EBITDA per tonne (US$/tonne) 130 108 20.4EBITDA margin (%) 10.8 11.1 n/aAverage steel product price (US$/tonne) 1,195 939 27.3Pig iron and hot metal (US$/tonne) 507 374 35.6Semifinished products (US$/tonne) 854 699 22.2Long products (US$/tonne) 1,342 1,036 29.5Rails (US$/tonne) 936 1,029 (9.0)Metalware products (US$/tonne) 1,268 - n/aIncreased steel prices confirmed the general positive trend for finished goods, and helped deliver Lucchini US$3,989.5 million inrevenue in 2008, 6.2% more than in 2007. EBITDA in 2008 was US$429.8 million, a 3.3% increase on the previous year.Production resultsSales and marketingAfter a strong rise in demand for steel in the firstpart of the year (2.3% higher than the same period inthe previous year), actual steel consumption in theEuropean Community over the year as a whole droppedsuddenly and significantly.This was due to a decrease in automotive demand (- 6.3%in Q4 2008) and the construction industry crisis (withdemand already down in the 1st quarter of the year).In Q4 2008, a significant reduction in steelconsumption, a direct result of the global financialcrisis, caused all steel companies to reduce production.Steel prices have been volatile, with prices rising upuntil the summer, as a result of higher scrap iron andother raw material costs. This was followed by a sharpdrop in demand and prices in the latter part of the year.Wire rod sales in 2008 showed a similar trend, withstrong demand and rising prices in the first part ofthe year, followed by drastically reduced demand inthe second part of the year, with prices falling as aconsequence.Bars showed a more stable trend, although the fourthquarter also showed a strong decline in demand.Demand for rails remained strong, thanks to thecontinued demand for new infrastructure in theemerging economies and Mediterranean countries.The price of, and demand for, billets showed the samecyclical pattern as described above.Pig iron sales rose sharply until July, and then droppedlater in the year, mainly due to a strong flow of importsfrom Russia and the Ukraine.In 2008, Lucchini produced:• 3,021 thousand tonnes of crude steel• 2,189 thousand tonnes of hot metal• 2,151 thousand tones of finished rolled steel, including long products and rails• 982 thousand tones of semifinished products, including hot metal and pig iron• 40 thousand tonnes of metalware products.Production resultsProduction volumes, thousand tonnes 2008 2007 Change year-on-year %Total outputHot metal 2,189 2,534 (13.6)Crude steel 3,021 3,585 (15.7)Production for saleSemifinished products 982 1,223 (19.7)Long products 1,832 2,016 (9.1)Rails 319 313 1.9Metalware products 40 73 (45.2)Total production for sale 3,173 3,625 (12.5)Sales by products2008 2007 Change year-on-year %Thousand tonnes US$ million Thousand tonnes US$ million Thousand tonnes US$ millionPig iron and hot metal(PI&HM) 475 241 417 156 13.9 54.5Steel productsSemifinished products(excl. PI&HM) 597 510 983 687 (39.3) (25.8)Long products 1,884 2,529 2,130 2,207 (11.5) 14.6Rails 298 279 290 241 2.8 15.8Downstream products 41 52 23 81 78.3 (35.8)Total steel products 2,820 3,370 3,426 3,216 (17.7) 4.8Total sales by products 3,295 3,611 3,843 3,372 (14.3) 7.1Other and shipping - 378 - 385 n/a (1.8)Total sales 3,295 3,989 3,843 3,757 (14.3) 6.272 73
Lucchini’s total sales volume of 3,295 thousand tonnesSales volumes of semifinished products (excluding hotSales to the railway, mechanical and machine buildingLucchini’s main objectives are to maintain andwas 14.3% lower than in 2007. The 6.2% increase inmetal and pig iron) were 39.3% lower in 2008 than inindustries fell by 4% in volume. In the oil drillingstrengthen its cost leadership position in Italy andrevenues was mainly due to rising prices in the first2007. At the same time, sales revenues of semi-finishedsegment (others), market conditions only deterioratedWestern Europe, and to pursue new, high-growthnine months of 2008.products fell by 25.8% and currently account for 12.8%in the last weeks of the year, so sales volumes weremarkets such as Eastern Europe and the Far East.of Lucchini’s total 2008 revenue.fairly stable over the year as a whole.Sales revenues of long products increased by 14.6%,while volumes fell by 11.5%. Sales revenues of longSales volumes of rails increased by 2.8% and revenuesKey marketsWith commercial offices in Zurich, Barcelona, NewYork, Singapore, Dusseldorf and Manchester (UK), andproducts accounted for 63.4% of Lucchini’s totalincreased by 15.8%. Rails accounted for 7.0% ofLucchini has more than 1,000 customers in its maincentralized sales and marketing departments, Lucchinirevenue in 2008.Lucchini’s total 2008 revenue.markets in Italy, France and Germany. It sells itsexports its products to more than 60 countries.Piombino products primarily in the Italian domesticPiombinoAscometalmarket, and nearly half of its Ascometal products in theFrench domestic market.Sales by market, Lucchini2008 2007 Change year-on-US$ million % of total US$ million % of totalyear %MarketEurope 3,549 89.0 3,220 85.7 10.2Americas 130 3.3 244 6.5 (46.7)Asia 304 7.6 290 7.7 4.8Africa 6 0.1 - - n/aRussian Federation - - 3 0.1 (100.0)Total 3,989 100.0 3,757 100.0 6.2Steel industryRailway industryAutomotiveConstruction18.3%17.8%12.6%11.5%Machine building7.6%Trading and regionaldistribution 7.4%Cold Heading Quality 7.2%Other17.5%AutomotiveMachine buldingBearings36.5%28.3%17.8%Railway industryOther (incl. energy)4.6%12.8%Capital expenditureNeither Piombino nor Ascometal implemented any bigcapital projects in 2008.The majority of Piombino’s deliveries in the year were tothe steel processing, railway and automotive industries.Other important customers were construction andmachine building companies. Sales in the steel industrysegment were 6% lower in 2008 than in 2007. This wasdue to the sharp reduction in sales of semi-finishedproducts, tied to a dramatic decline in demand in the4th quarter of 2008.In Europe, demand for special bars decreased by 3%with a severe downturn in the second half of 2008.Ascometal’s global sales fell by 10% in volume, but theoverall value of sales was slightly up on 2007.New car registrations in Europe shrank by 8%,leading to unprecedented destocking and reducedproduction throughout the industrial chain. Originalequipment manufacturers, forging, bearings and springsubcontractors were all affected by the situation.Because of this, Ascometal tonnage sales to theautomotive industry fell by 17% compared to 2007,while bearings sales faired slightly better, falling by only10%, due to slightly better market conditions for nonautomotiveproducts.Lucchini’s total capital expenditure of US$337.8 millionwas 69.5% higher in 2008 than in 2007 (when it wasUS$199.3 million). This increase was mainly as a resultof money invested in development projects (aimed atimproving quality and performance and reducing cost)which accounted for 81% of Lucchini’s total expenditurein the year. The remaining 19% was spent on IT, safety,environmental and non-production projects.74 75
CostsMetalwareCosts of sales were US$3,372.4 million in 2008, a 5.6%increase on 2007, mainly due to rising materials costs.We have a 20.4% of the metalware market in Russia, 17.8% (in low-carbon) inUkraine, 23% share in the UK, and 30% of the wire rope market in Italy.Costs of sales structure2008 2007 Change yearon-year%US$ million % of total US$ million % of totalMaterials 2,141.5 63.5 1,895.6 59.3 13.0Energy 382.3 11.3 357.8 11.2 6.8Staff costs 380.3 11.3 408.4 12.8 (6.9)Depreciation and amortisation 162.1 4.8 189.1 5.9 (14.3)Services and other 306.2 9.1 343.5 10.8 (10.9)Total 3,372.4 100.0 3,194.4 100.0 5.6Decisive managementactionsOur financial results for 2008 are among the best in thecompany’s history, despite the negative market trendsin the latter part of the year, when the demand for steelfell rapidly as a direct result of the global economicsituation.In this extreme period of uncertainty andunpredictability, we are focusing on adapting to thischanging business environment.In particular, we are monitoring closely the running timeof all installations on our order book, and implementinga range of initiatives to reduce cost, inventories andoutflows.Our priorities are to mitigate the effect on the companyof the deteriorating economic conditions. In effect weare concentrating on retaining our ability to compete,while ensuring we exploit fully any opportunities thatemerge as a result of the economic downturn.Our management is confident that the measures we aretaking will enable us to meet these objectives.Our metalware segment includes:• OAO <strong>Severstal</strong>-Metiz – Cherepovets plant,Volgograd plant, Orel plant (Russia)• OAO Dneprometiz (Ukraine)• Carrington Wire Ltd. (Great Britain)• Redaelli Tecna SpA (Italy), and• four other subsidiaries in Russia: Steellace,UniFence, UniSpring and Orelcord.This segment of our business manufactures:• Cold-drawn products (cold-drawn steel, railwayfasteners, steel shapes)• High-carbon products (wire, wire ropes, includinghigh-tech speciality wire ropes for hoisting,cableways and mining)• Low-carbon products (wire, nails, fibre)• Welding consumables (flux cored wire, solid weldingwire, electrodes)• Mesh (chain-link mesh, woven mesh, welded mesh,gabions)• Fasteners for common applications, and• Other products including spring blocks,• Consumer goods,• Steel cord.Metalware has an annual production capacity of1.5 million tonnes of wire and wire products, whichincludes over 55,000 different product types.In 2008, the segment’s plants manufactured 866.6thousand tonnes of metalware products. Salesrevenues were US$1.2 billion and EBITDA was US$113.9million.StructureOAO <strong>Severstal</strong>-Metiz includes plants in Cherepovets,Volgograd and Orel:• The Cherepovets plant focuses on high-value-addedproducts (cold-drawn, high-carbon, low-carbonsegments).• The Volgograd plant specialises in high-carbonproducts, including steel wire and wire ropes.• The Orel plant focuses on fasteners and weldingconsumables.In 2008, <strong>Severstal</strong> increased its ownership percentagein OAO <strong>Severstal</strong>-Metiz to 100%.OAO Dneprometiz is located in Dnepropetrovsk,Ukraine. It specialises in manufacturing lowcarbonhigh-value-added products. In terms ofproduction volumes, Dneprometiz is Ukraine’s largestmanufacturer of metalware. In 2008, OAO <strong>Severstal</strong>-Metiz increased its ownership percentage in OAODneprometiz to 96.81%.The segment has a diversified portfolio of suppliers,including almost all large manufacturers of rawmaterials in CIS and Europe – such as CherepovetsSteel Mill, OEMK, MMK, MMZ, ArcelorMittal, Corus,Lucchini and OVAKO.About 55% of the required volume of input materialsused in our metalware production comes from theCherepovets Steel Mill.Carrington Wire Ltd. operates in Elland, Great Britain.The plant occupies a leading position within the UKsteel wire products market. It focuses on producinghigh-carbon, low-carbon and cold heading wire. In2008, OAO <strong>Severstal</strong>-Metiz held a 100% stake inCarrington.76 77
Redaelli Tecna SpA operates in Italy. It manufactureshigh performance wire ropes for industrial hoisting,mining, cableways, civil-engineering structuresand electrical power engineering. It also includes adistribution chain (Teci) and a technical engineeringbusiness (Tensoteci). In July 2008, OAO <strong>Severstal</strong>-Metizacquired a 100% stake in Redaelli Tecna SpA.Our metalware segment also includes four subsidiarybusinesses in Russia:• UniFence is located in Orel and Cherepovets, andmanufactures mesh and gabions.• UniSpring is located in Orel and Cherepovets, andmanufactures spring blocks.• Orelcord is located in Orel, and produces steel cord,technical cord for conveyer belts, brass plated beadwire and hose wire.• Steellace is located in Orel and Volgograd, andmanufactures consumer goods.Key performance indicatorsStrategyMetalware’s strategic goals are to:• Concentrate on high-margin products• Create an optimal product-service portfolio• Optimise manufacturing, by having specialistmanufacturing sites and optimising itsinfrastructure.Operationsand key performanceindicatorsBased on our 2008 results, our revenue for thisbusiness segment amounted to US$1.2 billion, a 16.1%increase on 2007. EBITDA increased to US$113.9 millionfrom US$87.3 million, a 30.5% on 2007. The EBITDAmargin increased to 9.7% from 8.6% in 2007.Despite a 19.1% reduction in sales volumes, thesegment increased its sales revenue by US$163.2million compared to 2007. This was thanks tofavourable market conditions and an increase in pricesduring nine months of 2008.2008 2007 Change year-on-year %Sales of metalware products (Thousand tonnes) 847.1 1,047.6 (19.1)Revenue (US$ million) 1,174.9 1,011.7 16.1Gross profit (US$ million) 189.6 149.3 27.0Profit from operations (US$ million) 97.2 75.9 28.1Operating margin (%) 8.3 7.5 n/aEBITDA (US$ million) 113.9 87.3 30.5EBITDA margin (%) 9.7 8.6 n/aEBITDA per tonne (US$/tonne) 134 83 61.4Average product price (US$/tonne) 1,360 934 45.6The average number of employees in our metalware segment in 2008 was 10,442 people, 11% fewer than in 2007.Sales and marketingKey markets and industriesOur metalware segment sells its products in Russia(accounting for 64.1% of revenues), Ukraine, GreatBritain, Italy and other European and CIS countries. In2008, our Russian sales grew by 18.8% compared to2007, while sales to other countries grew by 11.5%.The growth in Russian sales in the nine months of 2008was primarily due to:• The substantial growth in prices (the average pricefor the segment’s products was US$1,360 per tonnein 2008, 45.6% higher than in 2007);• Improvements in our product mix – with a greaterfocus on high-value-added products;• Cutting back on production of goods with lowprofitability, and;• Increased metalware consumption in theconstruction sector.In the last quarter of 2008, sales revenue decreasedas a result of negative changes in global economicconditions. In addition, the end of the year wascharacterised by typical seasonal production decline.Both factors resulted in lower consumer demand in thesegment’s key markets of construction, automotiveand machinery construction. This led to a 19% drop inshipments of finished product, from 1,047.3 thousandtonnes in 2007 to 847.1 thousand tonnes in 2008.Increasing levels of imported metalware productsfrom Ukraine, South East Asia and China, present uswith a significant challenge. Our metalware segmentis working to mitigate this by taking an active role ininitiating protective anti-dumping measures.Carrington Wire Ltd. occupies a leading position in theUK wire and wire products market (with 23% of themarket). It is one of the sector’s key players in Europe,alongside Redaelli Tecna S.p.a., the world market leaderin speciality wire ropes.Sales by industry in Russia andthe Belarus RepublicAutomotive industry 27%Mining industry 15%Russian railway 12%Construction 11%With a diversified demand for metalware products,overall sales for the year were stable. In Russia, thebulk of sales were to the automotive industry (27%),the mining industry (15%), the Russian railway (12%),the construction industry (11%), metalware production(9%), cable production (2%), and other industries(24%).Capital expendituresMetalware production 9%Cable production 2%Other24%We invested US$31.5 million in our metalwarebusiness in 2008, US$1.6 million more than in 2007.Our investment programmes were focused primarilyon infrastructure optimisation projects, improvinginternal efficiency, reducing costs, and developing newproducts to help our clients reduce their costs.78 79
CostsCosts of sales were US$985.3 million in 2008, a 14.3% increase on 2007. This was mainly due to the increase inprices of raw materials, primarily of wire rod.Costs of sales structure2008 2007 Change yearon-year%US$ million % of total US$ million % of totalMaterials, semi finished products, purchased component 792.9 80.5 674.6 78.2 17.5Energy 30.1 3.1 31.8 3.7 (5.3)Staff costs 81.4 8.3 73.4 8.5 10.9Depreciation and amortisation 24.5 2.5 22.6 2.6 8.4Other 56.4 5.6 60.0 7.0 (6.0)Total 985.3 100.0 862.4 100.0 14.3Izhora Pipe MillIzhora Pipe Mill is 100% owned by <strong>Severstal</strong> and since 2007 it has beenconsidered a separate business segment. The mill has an annual productioncapacity of 600,000 tonnes of large-diameter pipes.In 2008, the mill sold 294,259 tonnes of large-diameter pipes, accounting for24% of the Russian market. Based on our 2007-2008 results, Izhora was Russia’sthird largest large-diameter pipe producer.Production of large-diameterpipes in Russiabuyers in question and their shipments will start againin the first and second quarters of 2009.Decisive management actions:• Optimising our staff resources and staff expenses byimplementing part-time working and managing staffcosts according to sales volumes• Reducing our functional and operating budgets• Optimising our purchasing costs• Implementing a policy to reduce our net working capital,particularly by reducing our raw materials stocks toreflect changes in production volumes, and cancellingour prepayment schemes with suppliers• Prioritising those investment projects that will help usreduce costs, and those with a shorter payback period• Implementing additional measures to increase ourprofitability.Vyksa Steel Mill 40% Izhora Pipe Mill 24%Volzhsky Pipe Mill 26% Chelyabinsk Pipe Mill 10%In 2008, Izhora produced 437.9 thousand tones oflarge-diameter pipes, a 46.3% increase on 2007.Revenue was US$823.7 million, an increase of 49.6%on 2007. Revenue was higher thanks to favourablepricing and a focus on more value-added products.However, the 4th quarter results were offset bypipe shipped in previous quarters being returned,something we and the buyers concerned decided wasnecessary because of slow payments and increasingpast due accounts. The returned pipe has now beenpartially re-sold for another project. We have negotiateda new repayment schedule and delivery time with theEBITDA was US$227.0 million, up 50.7% on theprevious year. The EBITDA margin increased slightlyfrom 27.3% to 27.6%.Description of businessIzhora Pipe Mill produces pipes with a diameter of610-1,420 mm, and a thickness of 14-40 mm. The pipesare covered with a three-layer polymer coating on theoutside, and smooth or anti-corrosion coating on theinside. The mill is capable of producing pipes of up to18.3 metres in length, which are unique by Russianstandards (the standard length being 12 metres).Extended-length pipes help reduce construction costs,because the number of welded joints decreases by 1.5times, which speeds up construction and improvesreliability.Today, the Izhora Pipe Mill manufactures the X70 andX80 strength class pipes, for which there is highestdemand. It is capable of manufacturing large-diameterpipes with a strength class of up to X100. Theseproducts are designed for the construction of trunk oiland gas pipelines both on and offshore (DNV 450 IFD).The mill is located in Kolpino, the industrial zoneof St. Petersburg. It has a well-developed transportinfrastructure (railroad stations, river and sea ports)and a highly qualified workforce.80 81
It also has a unique competitive advantage– a continuous production line, which significantlyreduces costs. Slabs are manufactured at <strong>Severstal</strong>’sCherepovets Steel Mill, and subsequently rolled intoplate on the wide plate mill-5000. The plate is thendelivered to the pipe mill (located on the same site), tobe made into large-diameter pipes. Other Russian pipeproducers have to buy slabs in Russia or abroad, whichincreases their costs and their dependency on risingpipe plate prices.Izhora Pipe Mill’s other competitive advantages includethe fact it produces extended-length pipes, and it issituated close to the St. Petersburg transport hub, aswell as the construction route of the North-Europeangas pipeline (the Nord Stream project). Nord Stream isone of the main consumers of the plant’s products.Strategyalso begin supplying the BTS II project (Baltic pipelineIzhora Pipe Mill’s principal goal is to increase thecompany).company’s market share of large-diameter pipes for theoil and gas industry.Key performance indicatorsMarket conditionsIn the next few years, a deficit of large-diameter pipes isforecast in Russia, as a result of several major pipelinesystems being constructed.Main projectsIn 2008, Gazprom began building a new gas pipeline,Yamal-Bovanenkovo-Ukhta, as well as continuingconstruction of the Nord Stream gas pipeline system. In2009 the gas monopoly also plans to continue buildinga gas pipeline, Yamal-Bovanenkovo-Ukhta, and startcontracting for the Shtokman gas field in the BarentsSea, as well as building the Altai pipeline to deliverRussian gas to China.In 2009, Transneft plans to continue construction of theEast Siberia-Pacific Ocean oil pipeline system, and will2008 2007 Change year-on-year %Production of pipes (Thousand tonnes) 437.9 299.3 46.3Revenue (US$ million) 823.7 550.7 49.6Gross profit (US$ million) 286.0 170.9 67.3Profit from operations (US$ million) 200.8 127.1 58.0Operating margin (%) 24.4 23.1 n/aEBITDA (US$ million) 227.0 150.6 50.7EBITDA per tonne (US$/tonne) 771.4 500.5 54.1EBITDA margin (%) 27.6 27.3 n/aAverage product price (US$/tonne) 2,789 1,764 58.1Sales and marketingIzhora Pipe Mill’s priority sales target is the Russiandomestic market. In 2008, the plant sold more then99% of its total output in Russia. Export accounted forless than 1% of sales. The principal consumers of theplant’s products are Russia’s gas and oil industries.Gazprom is the principal client, accounting for almost95.8% of shipments, or 281,840 tonnes.The mill has all the necessary certificates confirmingthe quality of its products (API, ISO, and DNV).CostsMaterialsDecisive managementactions:• Reducing capital expenditure• Reducing operational costs and general andadministrative expenses• Implementing a strong policy to reduce net workingcapitalCost of sales structure• Optimising workforce and staff expenses.US$ million % of total US$ million % of total2008 2007 Change year-onyear%Metal - roll 641.5 119.3 296.1 78.0 116.6Other materials 54.2 10.1 35.9 9.4 51.0Total materials 695.7 129.4 332.0 87.4 109.5EnergyCapital investmentsIn 2008, capital investments amounted to US$8.3million, 64% less than in 2007. The reduction wasmainly because the construction of the plant’s principalfacilities has now been completed.CostsThe total cost of sales in 2008 amounted to US$537.7million, 84.7% of which was raw materials costs due tochanges in inventories. Depreciation costs were 4.7%,and labour costs were 4.7% of the total cost of sales.Electric power 2.7 0.5 1.8 0.5 50.0Gas 0.1 0.0 0.1 0.0 -Other energy resources 0.4 0.1 0.3 0.1 33.3Total energy 3.2 0.6 2.2 0.6 45.5Staff costs 24.9 4.7 17.8 4.7 39.9Depreciation and amortization 25.4 4.7 22.8 6.0 11.4Services 28.2 5.2 2.3 0.6 1,126.1Other 0.5 0.0 2.7 0.7 (81.5)Change in inventories (240.2) (44.6) - - n/aTotal 537.7 100.0 379.8 100.0 41.682 83
<strong>Severstal</strong> on the capitalmarketsShare capitalOur share capital consists of 1,007,701,355 shares,with a nominal value of 0.01 RUR each, which equals10,077,013.55 RUR. No additional shares were issuedin 2008.As of 1 January 2009, 82.37% of our share capitalwas directly or indirectly controlled by CEO AlexeyMordashov. <strong>Severstal</strong>’s institutional investors andemployees own the remaining 17.63%.Share capital structureGlobal Depositary ReceiptsSponsored Global Depositary Receipts (GDRs) wereissued under the Reg S and 144A rules. One receiptcorresponds to the rights provided by one regularshare. Deutsche Bank Trust Company, Americas, is thedepositary bank, while Deutsche Bank, Moscow, LLCperforms custodian banking functions.GDR holders by geography as ofDecember 31, 2008GDR and share price<strong>Severstal</strong>’s shares and GDRs demonstrated impressivegrowth in the first half of the year, though the acuteslowdown in the world economy in the second half ofthe year completely reversed the improvement, and withthe weak market for steel companies, our price declinedconsiderably in 2008. Our quotations reached a peak onMay 16, 2008 at US$28.5 per share and per GDR.Our capitalisation decreased to US$2.76 billion atDecember 31, 2008 (with a share price of US$2.74 atLSE).In Russia, our underlying shares are traded on the RTSand on MICEX stock exchanges. Overseas, they’retraded in the form of depositary receipts, on the LondonStock Exchange and via the PORTAL trading system inthe US.Aggregate figures for exchange-traded <strong>Severstal</strong> shares and GDR turnover for2008Trading bourse Trading code of the share Turnover, US$ million Turnover, millions of sharesMICEX CHMF 6,545* 515RTS CHMF 116 6LSE SVST 4,710 290Total 4,952 286*2008 average nominal exchange rate: 24.87 RUR/one US$, Bank of RussiaDividends, 2008A. MordashovInstitutional investors and employeesGDR characteristics82.37%17.63%1. United Kingdom 36.93%2. Americas 27.12%3. Sweden 8.2%4. Rest of Europe 6.91%5. Switzerland 4.23%6. Cyprus 4.4%7. Asia Pacific/Middle East 3.92%8. Netherlands .46%9. Denmark .40%10. Germany .28%11. Russian Federation 1.60%Type of receipt International Identification number, ISIN CUSIP Trading boursesReg S/sponsored US8181501045 818150302 London Stock Exchange (LSE)144A/sponsored US8181503025 818150104 PORTALPeriod Record date Ex-dividend date Dividends per share (RUR) Starting date for paymentsInterim dividends for 3 months 2008 15.05.2008 15.05.2008 5.20 03.07.2008Interim dividends for 6 months 2008 20.08.2008 20.08.2008 18.35 01.10.2008Interim dividends for 9 months 2008 14.11.2008 14.11.2008 7.17 30.12.2008Dividends for 12 months 2008 27.04.2009 27.04.2009 - -Dividend policy:• Dividend payments are made quarterly.• Satisfactory annual profits are the preliminarycondition for dividend payment.• In determining the size of annual dividends we takeinto account the cyclical characteristics of the industry.The size of dividends can change depending on thevolume of net profits and the company’s cash flow.• In the medium term, the company foresees dividendpayments of no less than 25% of net profits received atthe end of the reporting period, calculated under IFRS.• In the long term, the company has the right to increasethe size of the dividend payments provided that capitalexpenditure requirements are met.• The company has the right to decide to pay outinterim dividends, provided it is in a financially stablecondition.84 85
BondsEurobond credit ratings<strong>Severstal</strong> versus RTS Index %During 2008, the principal rating agencies upgradedIn July 2008, Steel Capital SA, a non-related party,issued US dollar denominated loan participation notesin an aggregate principal amount of US$1,250 millionthe credit ratings of <strong>Severstal</strong> bonds, confirming thecompany’s high level of reliability. Fitch upgraded<strong>Severstal</strong> Eurobonds to BB, while Moody’s upgraded125<strong>Severstal</strong>RTSfor the sole purpose of financing a loan facility betweenOAO <strong>Severstal</strong> and Steel Capital SA. The notes are duethe bonds to Ba2. Standard & Poor’s upgraded<strong>Severstal</strong> Eurobonds to BB.100on July 29, 2013 and bear interest at annual interestrate of 9.75% payable on January 29 and July 29 of each75year.US$In February 2009, <strong>Severstal</strong> has repaid its US$32550million Eurobonds-2009 issue from the Company’sinternal funds. There are currently two Eurobond issues25on the market, from 2004 and 2008 years.0Eurobond credit raitings as at 31 December, 2008Standard & Poor’s Fitch Moody’s02.01.200827.02.200823.04.200818.06.200813.08.200808.10.200803.12.200805.02.2009<strong>Severstal</strong>-2009 BB n/a Ba2<strong>Severstal</strong>-2013 BB BB Ba2<strong>Severstal</strong>-2014 BB BB Ba2Share price and turnover on MICEXEurobond issues as at 31 December, 20082000700IssueInterestDate of redemption Sum of issue,Date of issuerateUS$Lead manager<strong>Severstal</strong>-2009 8.625 24 February 2004 24 February 2009 325 million Citigroup GlobalMarkets Limited<strong>Severstal</strong>-2013 9.75 29 July 2008 29 July 2013 1,250 million Citigroup GlobalMarkets Limited<strong>Severstal</strong>-2014 9.25 19 April 2004 19 April 2014 375 million Citigroup GlobalMarkets LimitedForm of issueLoan ParticipationNotesLoan ParticipationNotesLoan ParticipationNotesroubles18001600140012001000800600Turnover rubles mln<strong>Severstal</strong> (MICEX)6005004003002004002001000009.01.200806.02.200805.03.200803.04.200804.05.200802.06.200801.07.200829.07.200826.08.200823.09.200822.10.200820.11.200818.12.200823.01.200920.02.2009roubles million86 87
GDR price and stock turnover on the London Stock Exchange70.0Turnover $ mln<strong>Severstal</strong> GDR60.050.030.0025.0020.00Corporate socialresponsibilityAt <strong>Severstal</strong>, we are committed to sustained development across the economic,ecological and social aspects of our work.$ mln40.030.020.010.015.0010.005.00GDR priceIn 2008, we continued our operations in line with our threekey principles of social responsibility:• industrial safety and environmental control• development and social support of personnel• promotion of the socioeconomic development of theHealth, Safety &EnvironmentOne of the most significant moments of 2008 for OAO<strong>Severstal</strong> was approving the corporate Health, Safety &0.00.00regions we operate in.<strong>Severstal</strong>’s major priorities in 2008 were enhancingEnvironment Policy Statement. This document – signed byAlexey Mordashov, CEO of OAO <strong>Severstal</strong> – defines core02.01.200830.01.200827.02.200828.03.200825.04.200827.05.200824.06.200822.07.200819.08.200817.09.200815.10.200812.11.200810.12.200812.01.200909.02.200909.03.2009labour safety and improving environmental protection atthe company’s business units. We developed a generalcorporate policy to define the basic principles and majorpriorities at all stages of our production activity.Health and safetylines of business for all the divisions of the company.Compared to 2004, the consolidated <strong>Severstal</strong> Lost TimeYTM, PointsOur achievements in the sphere of corporate socialIncident Frequency Rate (LTIFR) decreased more thantwice over. In practice, this means that in 2008, largelyresponsibility in 2008 were reflected in the Russianthanks to management efforts, we were able to prevent 5045.00rating Accountability, where <strong>Severstal</strong> was up two pointsserious injuries per 10,000 employees.40.0035.00<strong>Severstal</strong> 2009<strong>Severstal</strong> 2013<strong>Severstal</strong> 2014compared to 2007, at eleventh. A number of our socialprogrammes were positively appraised by experts.For example, both Road to Home, a scheme aimedThe most significant contribution in incident preventionwas brought by <strong>Severstal</strong> Resources division. For the last30.0025.00at preventing child homelessness which is currentlyunderway in Cherepovets, and the talent developmentprogramme Young Resources (launched by the company’sfive years LTIFR1 at those operations reduced 3.7 times.An important factor in this success was the large-scalecorporate programme Safety for Everyone, which lookedPoints20.0015.00Mining division), became prise winners in the all-Russiancontest Institutional Donor of Russia. Some programmeswere also included in the collection of ‘best socialto develop the corporate culture of safe behaviour at worksites (DuPont’s methodology) and adapt worldwide bestsafetymanagement practices. During the last five years,10.005.00practices’ of Russian companies prepared by the RussianUnion of Industrialists and Entrepreneurs.the Russian Steel division LTIFR reduced 1.5 times. In2008, Cherepovets Steel Mill implemented more than 250different safety actions to provide employees with a safe0.0<strong>Severstal</strong>’s social and charity investments in 2008 totalledand healthy work environment.01.01.200801.03.200801.05.200801.07.200801.09.200801.11.200801.01.200901.03.2009US$75.9 million, 10% less than 2007 – the decrease wasdue to optimisation of the charity programme budget.Elsewhere, investment in social programmes increased by3% from 2007.Compared to 2004, the <strong>Severstal</strong> International divisionLTIFR2 reduced 1.4 times. In 2008, the <strong>Severstal</strong>International’s operations in Italy continued to implementthe corporate safety project Zero Incidents, which focuseson reducing occupational incidents.88 89
The project does this by developing and promoting theAs part of the personnel training and developmentDeveloping local communitiesColumbus sponsored the Economic Council, dedicatedpersonal-safety leadership of line managers, improvingeffort, <strong>Severstal</strong>’s Corporate University made the most<strong>Severstal</strong>’s cooperation with the social sphere is basedto advancing local businesses and organizations. Inthe internal safety communications, and offering intensiveof original training methods, such as business cases andon strategic programmes in areas such as employmentaddition, SNA provided support for the Second Harvestsafety training for employees. The division’s Frenchbusiness simulations. A total of more than 2,500 hours ofand occupational guidance, youth policy, health care,Food Bank, operating in Warren, Ohio, where <strong>Severstal</strong>operations undertook similar actions. In various locationsauditorium classes were held during the year, and thereand support of unprotected people. As a company, weWarren is located.throughout the USA, <strong>Severstal</strong> International is supportingwere six long-term training and development programmes:work with regional authorities to set out our primarya number of health and safety projects.MBA, Top-100, Talent Pool, Leadership for Productioncommitments.Elsewhere, <strong>Severstal</strong> Sparrows Point lent its support toEnvironmentManagers, Master, and Programme for Developmentof Production Consultancy Managers. For many of theIn 2008, non-commercial partnership Urban DevelopmentAutism Speaks, the nation’s leading organisation devotedto autism.In 2008, <strong>Severstal</strong> worked on a number of significantcompany’s employees, the University provides theAgency continued its work in Cherepovets in assistingIn 2008, the first three projects of <strong>Severstal</strong>’s charityenvironmental programmes, continuing our closepossibility of computer-aided distance learning, withsmall and medium-scale businesses. The partnership wasprogramme– Museums of the Russian North – opened.partnerships with environmental authorities, trade unions,over 5,500 users recorded in 2008. In the same year,established in 1999 by the City Mayor’s Office and OAOWe launched the contest in 2007, with a total grant fundand research and public organisations.the University’s other line of activities – research into<strong>Severstal</strong>. The Agency has launched a special programme,of 9 million roubles, with the organisational backing ofLast year, <strong>Severstal</strong>’s financial commitment topersonnel satisfaction, loyalty and the psychological andBusiness Incubator, to support entrepreneurship bythe Russian branch of UK Charity Fund CAF Russia. Theenvironmental causes exceeded US$113 million.social climate – included 36 large-scale research projects,offering all-round assistance at early, risky, stages. Incontest was won by six projects from five cities in Russia’sCherepovets Steel Mill of the Russian Steel divisionpolling over 14,000 people.2008, the Agency consulted over 1,800 people, trainednorth-western region, which is a strategic area for most ofcontinued its Energy Saving Integrated Programme. Theover 150 beginner entrepreneurs, and created over 500<strong>Severstal</strong>’s Russian business units.programme is not only about saving energy resources,Improving people’s health is a priority for our social policy,jobs.In 2008, our priority in terms of charitable activities wasbut also trying to significantly reduce carbon dioxideand one pursued by all of <strong>Severstal</strong>’s business units. Thethe development of international cross-cultural dialogue.emissions in the air (about 1 million tonnes a year). That<strong>Severstal</strong> Health Programme, which has been runningAlso last year, OAO Vorkutaugol (Vorkuta Coal) developed<strong>Severstal</strong> supported the Tretyakov Gallery’s large-scaleinitiative was recognised and supported by the Europeanat the Cherepovets Steel Mill since 2002, provides ana social partnership programme with the city. The projectexhibition project – Orthodox Icon of Russia, UkraineBank for Reconstruction and Development (EBRD), whichexample of our all-round approach. Based on the 2008set out to support the city’s medical and educationaland Belarus – which was presented in Moscow, Kiev andprovided a700 million credit for OAO <strong>Severstal</strong> – makingresults, temporary disability of the plant employeesinstitutions.Minsk. October 2008 saw the opening in Oklahoma, ofit Russia’s largest energy-saving deal. In 2008, thanksreduced by 6.8% (in man days per 100 workers) comparedOAO Karelsky Okatysh annually allocates funds for theAmerican Artists from the Russian Empire, which providedto the Energy Saving Program, the energy consumptionto 2007.maintenance of cultural and sport centre, with more thanan insight into new facets in the history of relationsdecreased by more than 20%. In the same year, <strong>Severstal</strong>80,000 people visiting it in 2008. The company alsobetween our two countries. In Germany, <strong>Severstal</strong>International’s total expenditure for ecological activitiesIn 2008, Cherepovets Steel Mill proceeded with housingbacked such important musical events as internationalsupported the exhibition Russia 1900: Art and Culture inamounted to more than US$103 million.construction under the Corporate Housing Programme,folk-lore festival Kanteletar.the Epoch of Last Reign in late 2008.A good example of the effective cooperation betweenresulting in 20 residential buildings – 1,950 apartmentsIn 2008, Lucchini continued to support cultural and<strong>Severstal</strong>, local communities and public organisations is– being commissioned. The company is working on asport events of Piombino municipality. Specifically, itOne of Russia’s most important musical events, thea programme at Deaborn Steel Works, Michigan, whichpackage of programs for training highly qualified expertssupported musical festivals. The company helped youthseventh Moscow Easter Festival, was held in Moscow, St.focused on retrofitting local school buses with dieselfor its talent pool. Elsewhere, <strong>Severstal</strong> Resources divisionteam Piombino Football Club and a local volleyball clubPetersburg and some other Russian cities, with <strong>Severstal</strong>’soxidation catalysts and diesel multi-stage filters.continued the Young Resources Programme.buy sports equipment and uniforms, and also helped tobacking. The symphony orchestra of the Mariinsky TheaterDevelopment and social support ofpersonnelIn view of the world’s deteriorating economic situation inlate 2008, we took extra measures to maintain the levelorganise an international tennis tournament.<strong>Severstal</strong> North America’s (SNA) corporate support inarranged two charitable concerts, so Cherepovets sawEaster Festival events for the first time.At <strong>Severstal</strong> we’re consistently creating conditions toof social guarantees and to retain qualified personnel.2008 encompassed a variety of non-profit organizations,Now that the world economy is constantly changing, heremake the most of employees’ potential, and to generateSpecifically, we introduced professional re-trainingranging from cultural to educational to communityat <strong>Severstal</strong> we are committed to pursuing our focus ona culture based on professionalism, individual initiativeand re-qualification programmes, and developed ouroriented charities. Cooperation with local communitiescorporate social responsibility. We’ll be placing specialand responsibility. In 2008, our business units gotcooperation with local self-administration bodies andand municipal organisations has always been SNA’semphasis on programmes aimed at ensuring socialfully involved in the ‘social sphere’, covering suchpublic organizations.primary focus. For example, they contributed towardstability in regions where we operate. <strong>Severstal</strong> also plansareas as health improvement, catering and recreationDearborn’s Homecoming Festival, the city’s premierto make the most of our resources, work constructivelyarrangements, personnel development and training, andcommunity event. <strong>Severstal</strong> Wheeling made a donation towith other partners, involve them in our strategicsocial support for pensioners and veterans.the West Virginia Mansion Preservation Foundation Inc., todecisions, and build relationships based on transparencyrestore the Governor’s mansion. In Mississippi, <strong>Severstal</strong>and mutual responsibility.90 91
Board of DirectorsChristopher ClarkIndependent Chairman of the Board of Directors,Chris Clark, 67, is a leading industrialist and brings extensive business knowledge to the Board. Chris’s career spans 40 years at JohnsonMatthey plc, the specialty chemicals and precious-metals group, where he became Chief Executive in 1998. He led the Group into the FTSE100 in 2002. Since his retirement in 2004, Chris has taken a number of non-executive positions. He currently chairs Associated British Portsand Urenco Limited, the leading international supplier of enriched uranium to the power-generating industry.Chris is a graduate in metallurgy; he studied at Trinity College, Cambridge and Brunel University, London.Peter KraljicIndependent Director,Member of the Audit Committee and the Strategy CommitteePeter Kraljic, 69, is a Director Emeritus at McKinsey, where he has spent 32 years and held a number of senior positions until his retirementin 2002. Focused mainly on industrial clients in the chemicals, pharmaceuticals, automotive assembly, and steel and aluminium sectors, hewas also a member of McKinsey’s Personnel Development Committee and has managed the company’s activities in France as a GeneralDirector. Peter has also written a number of scientific and business articles for publications such as the Harvard Business Review and LeFigaro Economic. He has recently led special projects aimed at economic growth and job creation in Germany and Brazil.Peter graduated from the University of Ljubljana, Slovenia (Faculty of Metallurgy), and holds a PhD degree from Polytechnic University inHanover, Germany. He also holds a Masters degree in business management from the INSEAD business school, France.Alexey MordashovCEO, <strong>Severstal</strong>,Member of Nomination and Remuneration CommitteeAlexey Mordashov, 43, has worked for <strong>Severstal</strong> since 1988. He started his career as a senior shop economist, becoming Chief FinancialOfficer in 1992. In December 1996, Alexey was appointed as <strong>Severstal</strong>’s Chief Executive Officer. In June 2002, he was elected Chairman of<strong>Severstal</strong>’s Board of Directors, and served as Chief Executive Officer of <strong>Severstal</strong> Group. Since December 2006, he has been Chief ExecutiveOfficer of <strong>Severstal</strong>. Alexey serves on the Entrepreneurs Council of the Government of Russian Federation. In addition, he is a memberof the Russian-German workgroup responsible for strategic economic and finance issues, and he is the head of the Russian Union ofIndustrialists and Entrepreneurs’ (RSPP) Committee of Trade Policy. Since March 2006 Alexey has been member of the EU-Russia BusinessCooperation Council. He is also a member of the Atlantic Council President’s International Advisory Board.Alexey earned his undergraduate degree from the Leningrad Institute of Engineering and Economics, and also holds an MBA degree fromNewcastle Business School of Northumbria University (Newcastle UK). He was granted an honorary doctorate from the Saint-PetersburgState University of Engineering and Economics in 2001 and from the University of Northumbria in 2003.Vadim MakhovNon-Executive Director, <strong>Severstal</strong>,Chairman of the Strategy Committee, <strong>Severstal</strong>,Chairman, <strong>Severstal</strong> North America,Vice-President, Lucchini,Vadim Makhov, 37, has worked at <strong>Severstal</strong> since 1994 as Deputy Head of the Economic Research Laboratory and Head of <strong>Severstal</strong>’sStrategic Department. From June 2002, Vadim served as Deputy Chief Executive Officer of the <strong>Severstal</strong> Group. Since 2004, he has beenChairman of the Board of Directors of <strong>Severstal</strong> North America. From 2004 until December 2006 he was Deputy Chief Executive Officer of<strong>Severstal</strong> Group for Strategy and Business Development, and from 2007 to 2008 he worked as Deputy Chief Executive Officer of <strong>Severstal</strong>for Strategy and Business Development. Vadim is currently a Chairman of the Strategy Committee of the Board of Directors.Vadim is a graduate of the State Management Academy named after Sergo Ordzhonikidze, and holds an MBA degree from NewcastleBusiness School of Northumbria University (Newcastle, UK).Martin AngleIndependent Director, Chairman of the Audit CommitteeMartin Angle, 58, holds a number of non-executive directorships in addition to JSC <strong>Severstal</strong>, including Pennon Group plc; Savills plc (aleading international property adviser); Dubai International Capital LLC; the Chairmanship of The National Exhibition Group in the UK;and until July 2008 the Chairmanship of Celerant Consulting, an international, operational management consultancy. He also sits on theBoard of the Warwick Business School. During his career, Martin has held senior executive positions in investment banking, industry andmore recently private equity, where he was an Operational Managing Director of Terra Firma Capital Partners and held various seniorpositions in its portfolio companies including the Waste Recycling Group, where he was Executive Chairman, and the Meridien Hotel Group,where he was Deputy Chairman. Prior to that, Martin was for a number of years the Group Finance Director of TI Group plc, a specialisedengineering company in the UK FTSE 100 with activities in over 50 countries. Before that, he spent 20 years working in investment banking,where he held a number of senior positions with SG Warburg & Co Ltd, Morgan Stanley and Dresdner Kleinwort Benson.Mikhail NoskovNon-Executive Director, <strong>Severstal</strong>Mikhail Noskov, 45, worked at the International Moscow Bank between 1989 and 1993. From 1994, he was Trade Finance Director of CreditSuisse (Moscow). He has worked for <strong>Severstal</strong> since February 1997 as Head of Corporate Finance, and from 1998 as Finance and EconomicsDirector. In June 2002, he was made Deputy CEO for Finance and Economics of the <strong>Severstal</strong> Group; from 2007 till 2008 he was DeputyCEO for Finance and Economics of <strong>Severstal</strong>. Mikhail graduated from the Moscow Institute of Finance.Martin is a graduate in physics, a Chartered Accountant, a member of the Securities Institute and a Fellow of the Royal Society of Arts.Ronald FreemanIndependent Director,Member of the Audit CommitteeRonald Freeman, 69, is a member of the Board of Directors, a Consulting Partner, and stockholder of the Moscow-based Troika Dialoginvestment bank. He is also a member of the Supervisory Board and the Human Resources Committee of truck manufacturer, KAMAZ; amember of the board of directors of Volga Gas; a member of the Executive Committee of the Atlantic Council; and a member of the boardof directors of Polish Telecom. He is a member of the International Advisory Committee of Columbia Law School and the DevelopmentCommittee of Mansfield College (Oxford, UK). Between 1991 and 1997, Ronald was Head of the Banking Department of the EuropeanBank for Reconstruction and Development (EBRD). He was responsible for debt and equity financing in the private sector in 23 countries ofthe former Soviet Union, with a total annual funds commitment of €2 billion. Prior to that, Ronald was Vice Chairman of Citigroup Europeaninvestment banking and a general partner of Salomon Brothers.Rolf StombergSenior Independent Director, Chairman of the Nomination and Remuneration CommitteeRolf Stomberg, 68, is Chairman of the Supervisory Board of LANXESS AG, Leverkusen, a global chemical company which was formed afterthe re-organisation of Bayer AG. He is Senior Independent Director of medical device producer Smith and Nephew plc, London, and advisesa number of German family-owned companies. After his executive career of nearly 30 years with BP (British Petroleum Co plc), where helast held the positions of CEO of BP’s downstream business and Managing Director on the main board of the company, he held a numberof directorships in internationally operating companies in Europe. These included Reed Elsevier Group, TNT NV, Scania AB, John Mowlemplc and Management Consulting Group plc.Rolf is an economics graduate holding a Doctorate of Hamburg University, where he also served as a Lecturer. He was Honorary professorat the business school of Imperial College, London, and the Institut Francais de Petrol, Paris.Ronald holds a BA degree from Lehigh University, and an LLB from the Law School of Columbia University. He was admitted to the NewYork Bar.Anatoly KruchininCEO, <strong>Severstal</strong> Russian SteelAnatoly Kruchinin, 48, began his career at <strong>Severstal</strong> in 1982. In 1993, he became Chief Power Engineer and in March 1999, he was madeCommercial Director. From January 2002, Anatoly worked as Executive Director of <strong>Severstal</strong>, becoming the company’s CEO in July 2002.Since December 2006, he has been Chief Executive Officer of Cherepovets Steel Mill.Anatoly is a graduate of the Ivanovo Power Engineering Institute and holds an MBA degree from National Economic Academy under theGovernment of Russia.Gregory MasonCOO, <strong>Severstal</strong>,CEO, <strong>Severstal</strong> North America Inc,CEO, <strong>Severstal</strong> International Division,Member of the Strategy CommitteeGregory Mason, 57, joined <strong>Severstal</strong> in 2004 having previously been a managing partner in Metal Strategies, an international metalsindustry management-consulting firm. In 2006, he was appointed as Chief Operating Officer of <strong>Severstal</strong> and in 2008 as CEO of <strong>Severstal</strong>International. In March 2009 he was appointed General Director of <strong>Severstal</strong> North America. Previous roles include Vice President of theDetroit Steel Company, Technical Director of Caparo Steel, Director of Steelmaking Technology at Davy International and Chief Engineerat KRUPP Industries (a division of KRUPP Stahl).Gregory is a registered professional engineer in the USA. He received his Masters degree from the Naval University of St. Petersburg.92 93
Board of Directors’reportIntroduction<strong>Severstal</strong> strongly believes in best practice incorporate governance. The company publishedits Corporate Governance Code in October 2006.This was approved by the Board, and the Boardcontinues to participate actively in the corporategovernance of the company. This report has beenprepared following the recommendations of theCode of Best Practice set out in section 1 of theFinancial Reporting Council’s Code on CorporateGovernance.The BoardThe Board represents a balance betweenIndependent Directors, Non-Executive Directorsand Executives, and is comprised of ten members,five of whom are Independent Directors.<strong>Severstal</strong>’s Board comprises an Independent Chairman,Christopher Clark; four Independent Directors, RonaldFreeman, Peter Kraljic, Martin Angle, and Doctor RolfStromberg; two Non-Executive Directors, MikhailNoskov and Vadim Makhov, and three ExecutiveDirectors, Alexey Mordashov, Anatoly Kruchinin andGregory Mason.The proportion of Independent to Executive Directors– unprecedented for a Russian company – as well asspecial voting rules on strategically important issuesguarantee equal concern for the interests of all thecompany shareholders. The Board considers all ofits Independent and Non-Executive Directors to beindependent for the purposes of the Combined Code.Board meetings andattendanceAttendance by individual directors at meetings of theBoard and its committees in 2008 was as follows:Members of theBoard of directors JSC“<strong>Severstal</strong>”Number of Boardmeetings forattendance **Number ofattended BoardmeetingsAudit Committee(5 meetings)***Remunerationand NominationCommitteeStrategyCommittee(3 meetings)(3 meetings)Christopher Clark 12 12 4* 3 -Ronald Freeman 12 12 5 3* 1*Peter Kraljic 12 12 5 3* 3Martin Angle 12 12 5 3* 1*Rolf Stomberg 12 12 5* 3 2*Alexey Mordashov 12 12 2* 3 -Vadim Shvetsov 7 0 - - -Mikhail Noskov 12 12 5* - -Vadim Makhov 12 12 1* - 3Anatoly Kruchinin 12 12 2* - -Gregory Mason 5 5 0 - 3* means that the specified Director is not a member of that Committee, although he attended the meetings at the invitation of the Chairman of the Committee.** eight of the meetings were held via conference call with circulation of voting ballots to express the written opinion of the Board members*** one of the meetings was held via conference callBoard and Committee members now have directand constant access to review Board and Committeematerials via a dedicated electronic system introducedin 2008. The system was also introduced to enableelectronic voting for agenda items and for Boardmeetings correspondence. We will also be able toestablish an electronic archive of Board and Committeematerials for convenient reference by Board membersin future.Role of the <strong>Severstal</strong> Board<strong>Severstal</strong>’s Board of Directors is responsible forthe general management and performance of thecompany’s operations, including approval of itsstrategy and monitoring its financial and businessoperations. The Board’s principal objective is to run thecompany in such a manner as to increase shareholdervalue in the medium and long term.The Board bases its decisions on the need to act in thebest interests of the entire company and to be fair to allshareholders. It may not give preference to the interestsof any individual shareholder or group of shareholders.The Board is also responsible for the proper functioningof the system for disclosure and dissemination ofinformation about the company’s operations and forimplementing the company’s information policy.The Board is authorised to take decisions concerningevery aspect of <strong>Severstal</strong>’s activity, with the exceptionof matters referring to the jurisdiction of the GeneralShareholders’ Meeting.Key duties:. Responsibility for the strategic direction of thecompany. Review of the consolidated budget and theProvision of appropriate recommendations. Reviewing the appointment and compensationpolicy applicable to the company’s seniorexecutives, including the CEO, and makingrecommendations regarding such a policy4. Dividend policy5. Approval of interested parties’ transactions (asthis term is defined in accordance with RussianLaw) with the value for each such transaction notto exceed 2% of the book value of <strong>Severstal</strong>’sassets at the date of decision to enter into suchtransaction6. Approval of a transaction if its value exceeds 10%of the book value of <strong>Severstal</strong>’s assets at the dateof the date to enter into such a transaction7. Approval of a transaction to acquire (i) shares orparticipation interests or rights to manage suchshares or participation interests or (ii) fixed orintangible assets if the amount of the transactionspecified in sub-clauses (i) or (ii) above exceedsthe equivalent of US$500 million.A resolution on the matters set out in clauses 6 and 7requires a 2/3 majority vote of the elected members ofthe Board of Directors.94 95
Board effectivenessIn 2008, the Board commissioned its first independentSenior Independent DirectorDuring the year under review, the Board resolved toaudit of its effectiveness by the respected internationalRolf Stomberg is <strong>Severstal</strong>’s Senior Independentestablish a new Committee of the Board, the StrategyThe roles of Chairman and Chief Executive Officer areexecutive search firm Heidrick & Struggles. TheDirector and is also Chairman of the Remuneration andCommittee. Its purpose, composition and functionsseparate and their responsibilities are clearly definedfindings were encouraging and demonstrated, amongNomination Committee. His responsibilities includeare set out below. To formalise the new Strategyin the company’s statutory documents and regulatedother things, the wealth of experience available tomeeting major shareholders and chairing meetings ofCommittee the relevant changes have been introducedby Russian law. The role of the Chairman is to organise,the company from the Independent Directors andthe Independent and Non-Executive Directors when theto <strong>Severstal</strong>’s Corporate Governance Code and thelead and manage the Board and to convene and presidethe fact that the company is keen to benefit from thisChairman is not present.Regulations on Committees of the Board of Directors.over Board meetings. Directors new to the Board aregiven background information on the company whenexperience.Dr. Stomberg’s individual contribution to theThe Audit Committeethey join. This includes details of its operations andprocedures, as well as information on what is requiredCompany Secretarydevelopment corporate governance and his promotionof high standards and best practice in corporateThe Audit Committee supervises the financialperformance and business operations of the company.from them in their role according to the company’sgovernance in Russia was acknowledged recently byThe objective of the Audit Committee is to assist thestatutory documents. This includes <strong>Severstal</strong>’sOleg Tsvetkov became Company Secretary of <strong>Severstal</strong>The ‘Director of the Year’ National Awards in Russia.Board of Directors in:Corporate Governance Code, and applicable corporatein 2006. In 2008, Mr. Tsvetkov was awarded theDr. Stomberg was named laureate of the ‘Independent• Monitoring the timeliness, completeness andgovernance law, best practice to help ensure their earlyprestigious ‘Corporate Governance Director – CorporateDirector’ nomination.reliability of financial and other reporting, itseffective contribution to the company.Secretary’ award by the Independent DirectorsAssociation and PricewaterhouseCoopers.Terms of appointmentpreparation and submission process• The operation of risk management, internal controlThe Chief Executive Officer carries out the day-to-dayMembers of the Company’s Board of Directors areand corporate governance systems.management of the company and ensures its efficientThe scope of activities of the Company Secretary’selected by the shareholders at their General MeetingThe Audit Committee consists of three Independentoperation by discharging the tasks set by the Boardoffice includes: Board of Directors activities,and remain members for the period until the nextDirectors and currently comprises Martin Angle,of Directors. The Chief Executive is responsible for thepreparation and holding of the General Meetingsannual General Meeting. Those elected to theChairman of the Audit Committee, Ronald Freemanorganisation, status and accuracy of the company’sand meetings of the Board of Directors, disclosureCompany’s Board of Directors may be re-elected anand Dr. Peter Kraljic. In accordance with its terms,accounting practices, timely provision of financialof information, corporate governance advice,unlimited number of times.the Committee has sufficient recent relevant financialreports to appropriate authorities, and timely provisionof information regarding the company’s operationscommunications with shareholders and GDR holders aswell as relations with Russian and foreign stock marketMeetings of Non-Executive Directorsexperience, and the overall skills required for financialstatements, business risk analysis and financialto shareholders, creditors and the media. The Chiefregulators. The Company Secretary is responsibleThe Independent and Non-Executive Directors meetmanagement skills. No senior executive of the companyExecutive also cooperates with trade unions to protectfor ensuring that the company, its management andseparately during the year. In 2008, they held four suchis a member of the Audit Committee. During 2008 thethe interests of company employees and communicatesofficers comply with the applicable law, the company’smeetings.Audit Committee met five times.with government and municipal authorities.charter and internal documents.During 2008 the company was restructured into threebusinesses. These are <strong>Severstal</strong> Russian Steel headedNon-Executive DirectorsKey CommitteesThe Audit Committee carries out the followingfunctions:• The evaluation of candidates proposed asby Anatoly Kruchinin, <strong>Severstal</strong> Resources headed byThe Key Committees of the Board are consultative andthe company’s external auditors, developingRoman Denisken, and <strong>Severstal</strong> International headed byThe Board reviews the independence of all Independentadvisory bodies intended for dealing with issues raisedrecommendations for the Board regarding theGregory Mason. <strong>Severstal</strong> carried out the restructuringand Non-Executive Directors on an annual basis andby the Board. Committees may not act on behalf ofselection of the external auditors.exercise in order to reduce the number of reporting lineshas determined that all such directors are independentthe Board of Directors; neither are they management• The development of recommendations for the Boardbetween individual operations and the Board, ensuringand have no cross-directorships or significant linksbodies of the company, having no powers in relation toof Directors regarding the amount of the externala clear line of sight to the operating businesses andwhich could materially interfere with them exercisingmanaging the company.auditors’ fees.greater operating efficiency. The move streamlinestheir independent judgment. The IndependentCommittee meetings are held as and when necessary• Supervision of the scope and results of thethe reporting structure between individual operationsand Non-Executive Directors play a leading role inbut in any case are held at least three times a year.auditors’ work (including the evaluation ofand the Board and provides a simplified structure tocorporate accountability and governance through theirCommittee decisions are made by a majority vote of allthe auditors’ opinion) and its efficiency andincrease competitiveness, cut costs and maximisemembership of the Remuneration and Nomination,Committee members taking part in the meeting. Eachobjectivity; monitoring the independence of theshareholder returns.Strategy and Audit Committees.member has one vote and the Committee Chairman hasexternal auditor, taking into account the applicableno casting vote in the event of a vote tie.requirements of professional and regulatory bodiesin Russia and the UK.96 97
• A review of the company’s regular financialstatements and an analysis of the changes inaccounting policies and practices as well asmaterial adjustments made on the basis of the auditfindings.• Analysis of the company’s annual report and anyother published financial information prior to itssubmission for approval to the Board of Directorsand its publication.• Analysis of any official statements relating to thecompany’s financial performance; reviews of anyopinions concerning significant aspects of financialreporting.• Monitoring the effectiveness and efficiency ofrisk management, internal control and corporategovernance systems.• Monitoring and exercising control over the efficiencyof the internal audit function.• The development and implementation of anethical compliance policy for auditors supplyingnon-audit services, taking into account relevantethical restrictions applicable to such activities; theoperation of risk management, internal control andcorporate governance systems.• Analysis of any material changes in the existinglegislation affecting the Company’s financialstatements and any findings of supervisoryauthorities and court proceedings.The Audit Committee prepares its own evaluation of theauditors’ opinion on financial statements and providesthis evaluation to the Board of Directors and to theAnnual Shareholders’ General Meeting.In order that the company’s financial and businessoperations are monitored efficiently, the companyemploys external auditors that have no interests in thecompany for annual verification and approval of theaccounts.The company’s books and records are audited incompliance with the requirements of statutory lawand International Standards on Auditing issued by theInternational Federation of Accountants (IFAC) withrespect to financial statements prepared under theInternational Financial Reporting Standards (IFRS).Such an audit takes place annually and, as of the firstquarter of 007, the company’s quarterly reports arealso reviewed IFRS in accordance with the InternationalStandard on Review Engagements 40.The Remuneration and NominationCommitteeThe Remuneration and Nomination Committee, whichconsists of three members, seeks to assist the companyin engaging qualified experts in managing the companyand creating the incentives necessary to ensure theirsuccessful work for the company.At least two members of the Remuneration andNomination Committee, including the Chairman ofthe Committee, are Independent Directors who arenot senior executives of the Company. The Committeeperforms the following functions:• Developing general recommendations for the Boardof Directors on selecting nominees to the Board ofDirectors, proposed by the Board of Directors.• Conducting preliminary evaluations of potentialnominees to the Board of Directors and provides theBoard of Directors with recommendations regardingsuch nominees.• Informing the Board of Directors of any potentialnominees to the Board of Directors it is aware of andrecommending individual persons for nomination orelection to the Board of Directors.• Issuing opinions as to whether a personnominated to the Board of Directors qualifies as anIndependent Director.• Developing the system of remuneration andother payments made by the company or at thecompany’s expense (including life and healthinsurance, pension plans) for Board members ofthe company based on personal contributions ofits members to the achievement of the company’sstrategic objectives.• Preparing and submitting for approval by the Boardof Directors the appointment and remunerationpolicy for senior executives of the company,including its Chief Executive, as well as providingrecommendations on the terms of the contractsigned with the Chief Executive.• Reviewing the performance of Board membersincluding the advisability of nominating respectiveBoard members for another term in office.• Providing recommendations to the Board ofDirectors regarding material terms of the GeneralDirector’s contract.• Reviewing the information furnished by Boardmembers, which shall be disclosed in accordancewith the existing legislation or the Charter, with aview to establishing whether such Board membershave an interest in any decisions of the company,as well as information related to the circumstancespreventing the aforementioned officers fromefficiently discharging their duties as membersof the Board and circumstances entailing theirloss of independence as a member of the Board ofDirectors.The Committee strives to maintain the optimumbalance, recruiting the best-qualified professionalsto manage the company, and levels of remunerationsufficiently attractive to interest these professionals inworking for the company.The Remuneration and Nomination Committeecomprises Doctor Rolf Stomberg (Chairman of theCommittee), Christopher Clark and Alexey Mordashov.The Remuneration and Nomination Committee metthree times in 008.Corporate SecretaryOleg TsvetkovGeneralShareholders’ MeetingBoard of DirectorsChairman – Chris ClarkChief Executive OfficerAlexey MordashovThe Strategy CommitteeThe Strategy Committee develops and submits to theBoard of Directors its recommendations in relation toelaboration of the company business priorities andits development strategy, including the preparationof measures contributing to the improvement of theCompany business on a long-term basis.The Strategy Committee consists of Gregory Mason,Vadim Makhov, Dr. Peter Kraljic and is chaired by VadimMakhov.The Strategy Committee carries out the followingfunctions:• The preparation and submission to the Board ofDirectors of its recommendations and proposals inrelation to the principal development trends of thestrategic planning activity of the company, as wellas to changes and amendments in the company’sgeneral strategy.• Reviewing and informing the Board of the principaltrends of strategic development pursued byother legal entities, federal authorities and localgovernments; and providing the Board of Directors,at its request, with its consulting assistance inrelation to the strategic planning of the companybusiness matters.Corporate structure of <strong>Severstal</strong> in 2008Audit CommitteeChairman – Martin AngleNomination and RemunerationCommitteeChairman – Rolf StombergStrategy CommitteeChairman – Vadim Makhov<strong>Severstal</strong> Russian Steel<strong>Severstal</strong> Resources<strong>Severstal</strong> International98 99
OAO <strong>Severstal</strong> and subsidiariesConsolidated financial statementsfor the years ended December 31, 2008, 2007 and 2006ContentsOAO <strong>Severstal</strong>and subsidiariesConsolidated financial statementsfor the years ended December 31, 2008, 2007 and 2006Independent Auditors’ Report 102Consolidated income statements 104Consolidated balance sheets 105Consolidated statements of cash flows 106Consolidated statements of changes in equity 107Notes to the consolidated financial statements 108-1811. Operations 1082. Presentation of the consolidated financial statements 1093. Summary of the principal accounting policies 1154. Sales 1275. Staff costs 1276. Net (loss)/income from securities operations 1287. Net other operating income/(expenses) 1288. Impairment of non-current assets 1299. Net other non-operating income/(expenses) 13410. Financing 13411. Taxation 13512. Related party transactions 13713. Related party balances 13814. Cash and cash equivalents 13915. Short-term bank deposits 13916. Short-term financial investments 14017. Trade accounts receivable 14018. Inventories 14019. Other current assets 14120. Long-term financial investments 14121. Investment in associates and joint ventures 14222. Property, plant and equipment 14323. Intangible assets 14524. Debt finance 14625. Other current liabilities 14726. Retirement benefit liabilities 14727. Other non-current liabilities 14928. Share capital 15129. Discontinued operations and assets held for sale 15430. Subsidiaries, associates and joint ventures 15631. Segment information 16732. Financial instruments 17333. Commitments and contingencies 18034. Subsequent events 181100 100 10101
ZAO KPMGNaberezhnaya Tower Complex,Block C 18 Krasnopresnenskaya NaberezhnayaTelephone +7 (495) 937 4477Fax +7 (495) 937 4400/99Independent Auditor’s ReportPage 2Moscow, Russia 123317Internetwww.kpmg.ruIndependent Auditors’ ReportBoard of DirectorsOAO <strong>Severstal</strong>Report on the Consolidated Financial StatementsOpinionIn our opinion, the consolidated financial statements present fairly, in all material respects, the consolidatedfinancial position of the Group as at 31 December 2008, 2007 and 2006, and its consolidated financial performanceand its consolidated cash flows for the years then ended in accordance with International Financial ReportingStandards.We have audited the accompanying consolidated financial statements of OAO <strong>Severstal</strong> (the “Company”) and itssubsidiaries (the “Group”), which comprise the consolidated balance sheets as at 31 December 2008, 2007 and2006, and the consolidated income statements, consolidated statements of changes in equity and consolidatedcash flow statements for the years then ended, and a summary of significant accounting policies and otherexplanatory notes.ZAO KPMG5 March 2009Management’s Responsibility for the Financial StatementsManagement is responsible for the preparation and fair presentation of these consolidated financial statements inaccordance with International Financial Reporting Standards. This responsibility includes: designing, implementingand maintaining internal control relevant to the preparation and fair presentation of financial statements that arefree from material misstatements, whether due to fraud or error; selecting and applying appropriate accountingpolicies; and making accounting estimates that are reasonable in the circumstances.Auditors’ ResponsibilityOur responsibility is to express an opinion on these consolidated financial statements based on our audits. Weconducted our audits in accordance with International Standards on Auditing. Those standards require that wecomply with relevant ethical requirements and plan and perform the audits to obtain reasonable assurance whetherthe financial statements are free of material misstatement.An audit involves performing procedures to obtain audit evidence about the amounts and disclosures in the financialstatements. The procedures selected depend on the auditor’s judgment, including the assessment of the risks ofmaterial misstatement of the financial statements, whether due to fraud or error. In making those risk assessments,the auditor considers internal control relevant to the entity’s preparation and fair presentation of the financialstatements in order to design audit procedures that are appropriate in the circumstances, but not for the purposeof expressing an opinion on the effectiveness of the entity’s internal control. An audit also includes evaluatingthe appropriateness of accounting principles used and the reasonableness of accounting estimates made bymanagement, as well as evaluating the overall presentation of the financial statements.We believe that the audit evidence we have obtained is sufficient and appropriate to provide a basis forour opinion.ZAO KPMG, a company incorporated under the Laws of the Russian Federation and a member firm of the KPMGnetwork of independent member firms affiliated with KPMG International, a Swiss cooperative.102103
OAO <strong>Severstal</strong> and subsidiariesConsolidated income statementsYears ended December 31, 2008, 2007 and 2006(Amounts expressed in thousands of US dollars, except as otherwise stated)Year ended December 31,Note 2008 2007 (restated) 2006 (restated)SalesSales - external 22,138,418 15,352,404 12,511,561Sales - to related parties 12 254,299 150,984 211,2754 22,392,717 15,503,388 12,722,836Cost of sales (16,486,030) (10,821,582) (8,873,553)Gross profit 5,906,687 4,681,806 3,849,283General and administrative expenses (1,030,140) (766,890) (633,705)Distribution expenses (1,117,776) (942,533) (729,906)Indirect taxes and contributions (178,829) (154,070) (142,484)Share of associates’ (loss)/profit (3,400) 6,240 1,451Net (loss)/gain from securities operations 6 (96,753) 25,564 28,271Loss on disposal of property, plant and equipment (43,826) (35,525) (38,524)Net other operating income/(expenses) 7 790,180 (7,266) (23,174)Profit from operations 4,226,143 2,807,326 2,311,212Impairment of non-current assets 8 (1,540,263) (28,895) (57,820)Net gain on restructuring of tax liabilities 27 - - 14,669Negative goodwill 30 292,685 12,223 4,213Net other non-operating income/(expenses) 9 238,945 (58,676) (53,551)Profit before financing and taxation 3,217,510 2,731,978 2,218,723Interest income 10 155,233 166,639 110,096Interest expense 10 (505,716) (325,580) (255,962)Foreign exchange difference (279,068) 3,206 33,054Profit before income tax 2,587,959 2,576,243 2,105,911Income tax expense 11 (520,373) (700,153) (635,094)Profit from continuing operations 2,067,586 1,876,090 1,470,817Profit from discontinued operations 29 - 433 32,849Profit for the year 2,067,586 1,876,523 1,503,666Attributable to:shareholders of OAO <strong>Severstal</strong> 2,034,008 1,849,531 1,447,505minority interest 33,578 26,992 56,161Weighted average number of shares outstandingduring the period (millions of shares) 1,007.2 1,007.7 928.4Basic and diluted earnings per share (US dollars) 2.02 1.84 1.56These consolidated financial statements were approved by the Board of Directors on March 05, 2009.The accompanying notes form an integral part of these consolidated financial statements.OAO <strong>Severstal</strong> and subsidiariesConsolidated balance sheetsDecember 31, 2008, 2007 and 2006(Amounts expressed in thousands of US dollars)AssetsCurrent assets:NoteDecember 31,2008December 31,2007 (restated)December 31,2006 (restated)Cash and cash equivalents 14 2,653,742 1,622,542 1,743,395Short-term bank deposits 15 818,545 666,327 1,147,270Short-term financial investments 16 112,782 215,494 306,285Trade accounts receivable 17 1,942,268 1,769,038 1,397,144Accounts receivable from related parties 13 63,831 47,193 73,619Inventories 18 4,278,554 2,720,634 2,342,098VAT recoverable 360,838 284,122 357,088Income tax recoverable 172,947 81,963 40,399Other current assets 19 280,082 318,961 266,225Assets held for sale 29 8,872 465,341 -Total current assets 10,692,461 8,191,615 7,673,523Non-current assets:Long-term financial investments 20 69,982 112,959 114,933Investments in associates and joint ventures 21 104,142 202,987 222,830Property, plant and equipment 22 9,868,305 8,289,116 6,970,865Intangible assets 23 1,454,486 687,067 61,666Restricted cash 21,703 13,810 57,406Deferred tax assets 11 227,492 64,185 34,211Other non-current assets 41,615 39,084 20,016Assets held for sale 29 - - 113,516Total non-current assets 11,787,725 9,409,208 7,595,443Total assets 22,480,186 17,600,823 15,268,966Liabilities and shareholders’ equityCurrent liabilities:Trade accounts payable 1,526,818 1,211,373 1,108,831Accounts payable to related parties 13 71,960 91,547 260,809Short-term debt finance 24 1,977,513 1,129,216 1,081,965Income taxes payable 46,958 41,323 44,822Other taxes and social security payable 210,992 199,349 201,743Dividends payable 128,715 107,485 23,243Other current liabilities 25 805,619 620,369 554,544Liabilities related to assets held for sale 29 4 91,750 -Total current liabilities 4,768,579 3,492,412 3,275,957Non-current liabilities:Long- term debt finance 24 6,278,004 2,813,166 2,264,191Deferred tax liabilities 11 509,327 509,409 398,164Retirement benefit liabilities 26 779,296 387,398 442,954Other non-current liabilities 27 591,290 324,652 359,598Liabilities related to assets held for sale 29 - - 1,792Total non-current liabilities 8,157,917 4,034,625 3,466,699Equity:Share capital 28 3,311,288 3,311,288 3,311,288Treasury shares (26,303) - -Additional capital 1,165,530 1,165,530 1,165,530Foreign exchange differences 83,812 1,145,499 537,075Retained earnings 4,495,458 3,951,116 2,939,334Other reserves 18,497 - -Total equity attributable to shareholders of parent 9,048,282 9,573,433 7,953,227Minority interest 505,408 500,353 573,083Total equity 9,553,690 10,073,786 8,526,310Total equity and liabilities 22,480,186 17,600,823 15,268,966The accompanying notes form an integral part of these consolidated financial statements.104 105
OAO <strong>Severstal</strong> and subsidiariesOAO <strong>Severstal</strong> and subsidiariesConsolidated statements of cash flowsYears ended December 31, 2008, 2007 and 2006(Amounts expressed in thousands of US dollars)Consolidated statements of changes in equityYears ended December 31, 2008, 2007 and 2006(Amounts expressed in thousands of US dollars)Operating activities:Year ended December 31,2008 2007 (restated) 2006 (restated)Profit before financing and taxation 3,217,510 2,731,978 2,218,723Adjustments to reconcile profit to cash generated from operations:Depreciation and amortization (Notes 22 and 23) 1,085,780 846,262 604,917Impairment of non-current assets (Note 8) 1,540,263 28,895 57,820Provision for inventories, receivables and other provisions 537,466 53,603 (5,089)Negative goodwill (292,685) (12,223) (4,213)Loss on disposal of property, plant and equipment 43,826 35,525 38,524Net gain on restrusturing of tax liabilities (Note 27) - - (14,669)Gain on disposal of subsidiaries and associates (Note 30) (314,435) (31,507) (846)Loss/(gain) on remeasurement and disposal of financial investments 96,753 (25,564) (28,271)Share of associates’ results less dividends from associates 3,400 (6,240) (1,451)Changes in operating assets and liabilities:Trade accounts receivable 79,654 (357,090) (48,109)Amounts receivable from related parties (39,695) 2,110 91,497VAT recoverable (109,020) 110,677 142,035Inventories (945,707) (235,891) (347,060)Trade accounts payable (157,717) 107,116 91,238Amounts payable to related parties 11,781 79,656 (104,912)Other taxes and social security payables 7,673 (63,422) (118,626)Other non-current liabilities (34,919) (101,158) 10,396Assets held for sale 38,609 (1,856) -Net other changes in operating assets and liabilities 123,339 123,815 (24,845)Cash generated from operations 4,891,876 3,284,686 2,557,059Interest paid (excluding banking operations) (362,789) (244,324) (222,245)Income tax paid (1,094,472) (804,223) (684,645)Net cash from operating activities 3,434,615 2,236,139 1,650,169Investing activitiesAdditions to property, plant and equipment (2,030,531) (1,997,285) (1,599,779)Additions to intangible assets (83,939) (27,194) (8,808)Net (increase)/decrease in short-term bank deposits (259,880) 580,706 (431,142)Additions to financial investments and associates (878,472) (889,595) (1,052,968)Acquisition of minority interests and entities under common control (219,588) (316,862) (294,249)Net cash outflow on acquisitions of subsidiaries (Note 30) (3,068,588) (643,279) (57,625)Net cash inflow on disposals of subsidiaries (Note 30) 671,717 235,978 1,588Proceeds from disposal of property, plant and equipment 42,853 34,150 16,253Proceeds from disposal of financial investments 860,549 773,090 949,713Interest received (excluding banking operations) 155,233 150,583 105,260Cash from investing activities (4,810,646) (2,099,708) (2,371,757)Financing activities:Proceeds from debt finance 7,542,083 3,677,480 2,674,626Proceeds form grants - 72 30,735Proceeds from share issue - - 1,105,197Repurchase of issued shares (26,303) - -Repayment of debt finance (3,685,787) (3,277,251) (2,539,521)Repayments under lease obligations (24,994) (3,915) -Dividends paid (1,346,535) (736,156) (269,286)Minority capital contributions - - 6,685Dividend to the Majority shareholder paid by acquired entity under commoncontrol (34,036) - -Cash from financing activities 2,424,428 (339,770) 1,008,436Effect of exchange rates on cash and cash equivalents (17,197) 82,486 86,625Net increase/(decrease) in cash and cash equivalents 1,031,200 (120,853) 373,473Cash and cash equivalents at beginning of the year 1,622,542 1,743,395 1,369,922Cash and cash equivalents at end of the year (Note 14) 2,653,742 1,622,542 1,743,395TotalMinorityinterestAttributable to the shareholders of OAO <strong>Severstal</strong>TotalOtherreservesRetainedearningsForeignexchangedifferencesAdditionalcapitalTreasurysharesNote SharecapitalBalances at December 31, 2005 as previously reported 3,311,254 - 60,367 34,368 1,818,475 - 5,224,464 490,729 5,715,193Acquisition of entities under common control - - - - (37,927) - (37,927) 15,059 (22,868)Balances at December 31, 2005 as restated 3,311,254 - 60,367 34,368 1,780,548 - 5,186,537 505,788 5,692,325Profit for the year (restated) - - - - 1,447,505 - 1,447,505 56,161 1,503,666Foreign exchange differences (restated) - - - 502,707 - - 502,707 49,210 551,917Total recognized income and expenses 1,950,212 105,371 2,055,583Dividends - - - - (278,798) - (278,798) - (278,798)Share issue 34 - 1,105,163 - - - 1,105,197 - 1,105,197Effect of acquisitions and disposals - - - - (9,921) - (9,921) (38,076) (47,997)Balances at December 31, 2006 (restated) 3,311,288 - 1,165,530 537,075 2,939,334 - 7,953,227 573,083 8,526,310Profit for the year (restated) - - - - 1,849,531 - 1,849,531 26,992 1,876,523Foreign exchange differences (restated) - - - 608,424 - - 608,424 56,709 665,133Total recognized income and expenses 2,457,955 83,701 2,541,656Dividends - - - - (801,462) - (801,462) (12,028) (813,490)Effect of acquisitions and disposals- - - -(36,287) - (36,287) (144,403) (180,690)Balances at December 31, 2007 (restated) 3,311,288 - 1,165,530 1,145,499 3,951,116 - 9,573,433 500,353 10,073,786Profit for the year - - - - 2,034,008 - 2,034,008 33,578 2,067,586Changes in fair value of cash flows hedges - - - - - (6,704) (6,704) (2,710) (9,414)Deferred tax on changes in fair value of cash flow hedges - - - - - 432 432 745 1,177Foreign exchange differences - - - (1,061,687) - - (1,061,687) (36,848) (1,098,535)Total recognized income and expenses 966,049 (5,235) 960,814Repurchase of issued shares - (26,303) - - - - (26,303) - (26,303)Dividends - - - - (1,378,510) - (1,378,510) (8,126) (1,386,636)Dividend to the Majority Shareholder paid by acquiredentity under common control - - - - (34,036) - (34,036) - (34,036)Fair value adjustment upon acquisition of subsidiaryto previously held interest 30 - - - - - 33,020 33,020 - 33,020Amortization of fair value adjustment upon acquisionof subsidiary to previously held interest - - - - - (8,251) (8,251) - (8,251)Effect of acquisitions and disposals - - - - (77,120) - (77,120) 18,416 (58,704)Balances at December 31, 2008 3,311,288 (26,303) 1,165,530 83,812 4,495,458 18,497 9,048,282 505,408 9,553,690The accompanying notes form an integral part of these consolidated financial statements.The accompanying notes form an integral part of these consolidated financial statements.106 107
OAO <strong>Severstal</strong> and subsidiariesOAO <strong>Severstal</strong> and subsidiariesNotes to the consolidated financial statementsfor the years ended December 31, 2008, 2007 and 2006(Amounts expressed in thousands of US dollars, except as stated otherwise)Notes to the consolidated financial statementsfor the years ended December 31, 2008, 2007 and 2006(Amounts expressed in thousands of US dollars, except as stated otherwise)1081. OperationsThese consolidated financial statements of OAO <strong>Severstal</strong> and subsidiaries comprise the parent company, OAO<strong>Severstal</strong> (‘<strong>Severstal</strong>’ or ‘the Parent Company’) and its subsidiaries (collectively ‘the Group’) as listed in Note 30.<strong>Severstal</strong> began operations on August 24, 1955 and completed the development of an integrated iron and steelmill in Cherepovets during February 1959 when the first steel was rolled. On September 24, 1993, as a part ofthe Russian privatization program, <strong>Severstal</strong> was registered as a Joint Stock Company (‘OAO’) and privatized.Through participating in <strong>Severstal</strong>’s privatization auctions and other purchases, Alexey Mordashov (the “MajorityShareholder”) has purchased shares in <strong>Severstal</strong> such that as at December 31, 2008, 2007 and 2006 he controlled,directly or indirectly, 82.37% of <strong>Severstal</strong>’s share capital.<strong>Severstal</strong>’s global depositary receipts (GDRs) have been quoted on the London Stock Exchange since November2006. <strong>Severstal</strong>’s shares are quoted on the Russian Trading System (‘RTS’) and on the Moscow Interbank CurrencyExchange (‘MICEX’). <strong>Severstal</strong>’s registered office is located at Ul Mira 30, Cherepovets, Russia.The Group comprises the following segments:• Mining segment – this segment comprises two iron ore complexes, Karelsky Okatysh and Olkon in northwestRussia, and two coal mining complexes, Vorkutaugol in northwest Russia and PBS Coals Ltd, located in the USA,as well as gold mining assets in the eastern part of Russia, in Africa and in Kazakhstan.• Russian Steel – this segment consists primarily of the Group’s steel production and high-grade automotivegalvanizing facilities in Cherepovets, rolling mill 5000 in Kolpino, both in northwest Russia, a ferrous scrapmetal recycling business operating in northwest and central Russia (previously reported within Mining segment),as well as various worldwide supporting functions for trading, maintenance and transportation.• Lucchini – this segment comprises several plants and service centers, including Piombino and Ascometalbusiness units. It produces special and high quality steel and quality and specialty long products. Productionsites are located in Western Europe, primarily in Italy and France. This segment also includes its distributionnetwork companies, which are located primarily in Western Europe.• North America – this segment consists of two integrated iron and steel mills, <strong>Severstal</strong> North America in GreatLakes region and Sparrows Point on the East Coast of the USA, two producers of flat rolled and other high valueadded steel products, <strong>Severstal</strong> Wheeling (former Esmark group of companies) on the East Coast of the USA and<strong>Severstal</strong> Warren Inc. (former WCI Steel Inc.) in the northeast region of the USA, a mini-mill, SeverCorr LLC on thesoutheast of the USA and a coking coal production facility, Mountain State Carbon LLC on the East Coast of theUSA.• Izhora Pipe Mill (‘IPM’) – this segment operates a large-diameter pipe mill in northwest Russia.• Metalware segment – this segment comprises three plants in Russia, one plant in Ukraine, one plant in theUnited Kingdom and one plant in Italy containing wire drawing equipment that takes long products (mainly wire)from the Russian Steel and Lucchini segments and external suppliers and turns them into products with a highervalue added for the Russian and international markets.• Financing segment – this segment operated a retail bank until November 2007 when the bank was disposed off.This transaction was accounted for as a discontinued operation. The transaction is further discussed in Note 29to these consolidated financial statements.A segmental analysis of the consolidated balance sheet and income statement is given in Note 31.Economic environmentThe Group’s activity in all its operating segments have been adversely affected by the uncertainty and instabilityin international financial, currency and commodity markets resulting from the global financial crisis. The recessionaffecting most economic regions, forcing the Group to reduce production, cut costs and manage increased risk factors.As a result of slower demand for steel products the Group’s production has declined at its steel plants in Russia, NorthAmerica and Europe commencing October 2008. As a consequence, the Group’s workforce, plant and equipmentexperience downtimes.Furthermore, a large part of the Group is based in the Russian Federation and is consequently exposed to the economicand political effects of the policies adopted by the Russian government. The Russian Federation has been experiencingpolitical and economic change that has affected, and may continue to affect, the activities of enterprises operating inthis environment. Consequently, operations in the Russian Federation involve risks that typically do not exist in othermarkets.The consolidated financial statements reflect management’s assessment of the impact of the global financial andeconomic crisis as well as the impact of the Russian business environment on the operations and the financial positionof the Group. The future business environment may differ from management’s assessment.International sales of rolled steel from the Group’s Russian operations have been the subject of several anti-dumpinginvestigations. The Group has taken steps to address the concerns of such investigations and participates actively intheir resolution. A brief description of protective measures effective at <strong>Severstal</strong>’s key export markets is given below:• Exports of hot-rolled coils and thin sheets from Russia to the USA are restricted by the minimum prices issuedquarterly by the US Department of Commerce and annual quotas.• Exports of hot-rolled plates from Russia to the USA are restricted by the minimum prices established based on theproducer’s actual cost and profit on the domestic market. <strong>Severstal</strong> is the first and exclusive Russian company, forwhich since September 2005 the hot-rolled plates market is open.• The Canadian market of hot-rolled plate was restricted by minimum prices in 2007. However, effective January 9,2008, this restriction had been cancelled.• The European Union (‘EU’) market is protected by quotas. During the last few years quotas have been raisedconsistently after adjusting for the effects of EU enlargements, equaling 3.031 mln. tons in 2008. <strong>Severstal</strong>traditionally gets approximately 35% of the total Russian quota and strives to utilize it fully because the EU marketis a key market for the Group.2. Basis for preparation of the consolidated financialstatementsStatement of complianceThese consolidated financial statements are prepared in accordance with International Financial Reporting Standards(‘IFRS’) as issued by the International Accounting Standards Board.Basis of measurementThe consolidated financial statements are prepared on the historic cost basis except for financial instruments at fairvalue through profit and loss and available-for-sale financial assets stated at fair value.109
OAO <strong>Severstal</strong> and subsidiariesOAO <strong>Severstal</strong> and subsidiariesNotes to the consolidated financial statementsfor the years ended December 31, 2008, 2007 and 2006(Amounts expressed in thousands of US dollars, except as stated otherwise)Notes to the consolidated financial statementsfor the years ended December 31, 2008, 2007 and 2006(Amounts expressed in thousands of US dollars, except as stated otherwise)The Group’s statutory financial records are maintained in accordance with the legislative requirements of thecountries in which the individual entities are located, which differ in certain respects from IFRS. The accountingpolicies applied in the preparation of these consolidated financial statements are set out in Note 3.Critical accounting judgments, estimates and assumptionsPreparation of the consolidated financial statements in accordance with IFRS requires the Group’s managementto make estimates and assumptions that affect the reported amounts of assets and liabilities and disclosure ofcontingent assets and liabilities at the date of financial statements, and the reported amounts of revenues andexpenses during the reporting period. The determination of estimates requires judgments which are based onhistorical experience, current and expected economic conditions, and other available information. Actual resultscould differ from those estimates.The most significant areas requiring the use of management estimates and assumptions relate to:• useful lives of property, plant and equipment;• impairment of assets;• allowances for doubtful debts, obsolete and slow-moving inventories;• decommissioning liability;• retirement benefit liabilities;• litigations; and• deferred income tax assets.Useful lives of property, plant and equipmentThe Group assesses the remaining useful lives of items of property, plant and equipment at least at each financialyear-end and, if expectations differ from previous estimates, the changes are accounted for as a change in anaccounting estimate in accordance with IAS 8 “Accounting Policies, Changes in Accounting Estimates and Errors”.These estimates may have a material impact on the amount of the carrying values of property, plant and equipmentand on depreciation expense for the period.Impairment of assetsThe Group reviews the carrying amount of its tangible and intangible assets to determine whether there is anyindication that those assets are impaired. In making the assessments for impairment, assets that do not generateindependent cash flows are allocated to an appropriate cash-generating unit. Subsequent changes to the cashgenerating unit allocation or to the timing of cash flows could impact the carrying value of the respective assets.During the reporting period the Group’s operations were negatively affected by the global economic downturnresulting in a slower demand for steel products. As a consequence, the Group has performed a thorough analysis ofimpairment of its assets. The results of the impairment tests and the assumptions used are further disclosed in Note8 to these consolidated financial statements.Allowance for doubtful debtsThe Group makes allowance for doubtful receivables to account for estimated losses resulting from the inabilityof customers to make required payments. When evaluating the adequacy of an allowance for doubtful debts,management bases its estimates on the current overall economic conditions, the ageing of accounts receivablebalances, historical write-off experience, customer creditworthiness and changes in payment terms. Changes in theeconomy, industry or specific customer conditions may require adjustments to the allowance for doubtful accountsrecorded in the consolidated financial statements.Allowance for obsolete and slow-moving inventoriesThe Group makes allowance for obsolete and slow-moving raw materials and spare parts. In addition, certainfinished goods of the Group are carried at net realizable value. Estimates of net realizable value of finished goodsare based on the most reliable evidence available at the time the estimates are made. These estimates take intoconsideration fluctuations of price or cost directly relating to events occurring subsequent to the balance sheet dateto the extent that such events confirm conditions existing at the end of the period.Decommissioning liabilityThe Group reviews its decommissioning liability, representing site restoration provisions, at each balance sheet dateand adjusts it to reflect the current best estimate in accordance with IFRIC 1 “Changes in Existing Decommissioning,Restoration and Similar Liabilities”. The amount recognized as a provision is the best estimate of the expendituresrequired to settle the present obligation at the balance sheet date based on the requirements of the currentlegislation of the country where the respective operating assets are located. The risks and uncertainties thatinevitably surround many events and circumstances are taken into account in reaching the best estimate of aprovision. Considerable judgment is required in forecasting future site restoration costs. Future events that mayaffect the amount required to settle an obligation are reflected in the amount of a provision when there is sufficientobjective evidence that they will occur.Retirement benefit liabilitiesThe Group uses an actuarial valuation method for measurement of the present value of post-employment benefitobligations and related current service cost. This involves the use of demographic assumptions about the futurecharacteristics of the current and former employees who are eligible for benefits (mortality, both during and afteremployment, rates of employee turnover, disability and early retirement, etc.) as well as financial assumptions(discount rate, future salary and benefit levels, expected rate of return on plan assets, etc.).LitigationsThe Group exercises judgment in measuring and recognizing provisions and the exposure to contingent liabilitiesrelated to pending litigations or other outstanding claims subject to negotiated settlement, mediation, arbitrationor government regulation, as well as other contingent liabilities. Judgment is necessary in assessing the likelihoodthat a pending claim will succeed, or liability will arise, and to quantify the possible range of the final settlement.Because of the inherent uncertainties in this evaluation process, actual losses may be different from the originallyestimated provision. These estimates are subject to change as new information becomes available, primarilywith the support of internal specialists or with the support of outside consultants. Revisions to the estimates maysignificantly affect future operating results.110111
OAO <strong>Severstal</strong> and subsidiariesOAO <strong>Severstal</strong> and subsidiariesNotes to the consolidated financial statementsfor the years ended December 31, 2008, 2007 and 2006(Amounts expressed in thousands of US dollars, except as stated otherwise)Notes to the consolidated financial statementsfor the years ended December 31, 2008, 2007 and 2006(Amounts expressed in thousands of US dollars, except as stated otherwise)Deferred income tax assetsDeferred tax assets are reviewed at each balance sheet date and reduced to the extent that it is no longerprobable that sufficient taxable profit will be available to allow all or part of the deferred tax asset to be utilized.The estimation of that probability includes judgments based on the expected performance. Various factors areconsidered to assess the probability of the future utilization of deferred tax assets, including past operating results,operational plans, expiration of tax losses carried forward, and tax planning strategies. If actual results differ fromthat estimates or if these estimates must be adjusted in future periods, the financial position, results of operationsand cash flows may be negatively affected. In the event that the assessment of future utilization of deferred taxassets must be reduced, this reduction will be recognized in the income statement.Functional and presentation currencyThe presentation currency of these consolidated financial statements is the US dollar.The functional currency is determined separately for each of the Group’s entities. For all Russian entities functionalcurrency is the Russian ruble. The functional currency of the Group’s entities located in North America is the USdollar. The functional currency of the majority of the Group’s entities located in Western Europe is the Euro.The translation into the presentation currency is made as follows:• all assets and liabilities, both monetary and non-monetary, are translated at the closing exchange rates at thedates of each balance sheet presented;• all income and expenses in each income statement are translated at the average exchange rates for the periodspresented; and• all resulting exchange differences are recognized as a separate component in equity.Any conversion of amounts into US dollars should not be construed as a representation that such amounts havebeen, could be, or will be in the future, convertible into US dollars at the exchange rates used, or at any otherexchange rate.Adoption of new and revised IFRSAs of January 1, 2008, the Group has adopted three Interpretations issued by the International Financial ReportingInterpretations Committee, which are effective for the annual reporting periods beginning on or after January1, 2007. These are: IFRIC 11 “IFRS 2: Group and Treasury Share Transactions”; IFRIC 12 “Service ConcessionArrangements”; and IFRIC 14 “IAS 19 – The Limit on a Defined Benefit Asset, Minimum Funding Requirementsand their Interaction”. The adoption of these Interpretations did not affect the Group’s consolidated financialstatements.New accounting pronouncementsA number of new Standards, amendments to Standards and Interpretations were not yet effective for the year endedDecember 31, 2008, and have not been applied in these consolidated financial statements.Standards and InterpretationsEffective for annual periods beginning on or afterIAS 1 (Revised) “Presentation of Financial Statements” January 1 and July 1, 2009IAS 16 (Amended) “Property, Plant and Equipment” January 1 and July 1, 2009IAS 20 (Amended) “Accounting for Government Grants andDisclosure of Government Assistance” January 1, 2009IAS 23 (Revised) “Borrowing Costs” January 1,2009IAS 27 (Amended) “Consolidated and Separate Financial Statements” July 1, 2009IAS 28 (Amended) “Investments in Associates” January 1 and July 1, 2009IAS 31 (Amended) “Interests in Joint Ventures” January 1 and July 1, 2009IAS 32 (Amended) “Financial instruments: Presentation” January 1 and July 1, 2009IAS 36 (Amended) “Impairment of Assets” January 1 and July 1, 2009IAS 38 (Amended) “Intangible Assets” January 1 and July 1, 2009IAS 39 (Amended) “Financial Instruments: Recognition andMeasurement” January 1 and July 1, 2009IAS 40 (Amended) “Investment Property” January 1, 2009IFRS 1 (Amended) “First-time Adoption of International Financial ReportingStandards” January 1 and July 1, 2009IFRS 2 (Amended) “Share-based Payment” January 1 and July 1, 2009IFRS 3 (Revised) “Business Combinations” July 1, 2009IFRS 5 (Amended) “Non-current Assets Held for Sale and DiscontinuedOperations” January 1 and July 1, 2009IFRS 8 “Operating Segments” January 1, 2009IFRIC 13 “Customer Loyalty Programmes” July 1, 2009IFRIC 15 “Agreements for the Construction of Real Estate” January 1, 2009IFRIC 16 “Hedges of a Net Investment in a Foreign Operation” October 1, 2008IFRIC 17 “Distributions of Non-cash Assets to Owners” July 1, 2009IFRIC 18 “Transfers of Assets from Customers” July 1, 2009The adoption of the pronouncements listed above is not expected to have a significant impact on the Group’sconsolidated financial statements in future periods except for those discussed below.Revised IAS 1 Presentation of Financial Statements introduces the concept of total comprehensive income,which represents changes in equity during a period other than those changes resulting from transactions withowners in their capacity as owners. Total comprehensive income may be presented in either a single statement ofcomprehensive income (effectively combining both the income statement and all non-owner changes in equity in asingle statement), or in an income statement and a separate statement of comprehensive income. Management hasnot yet decided on the presentation format of the comprehensive income in the Group’s 2009 consolidated financialstatements.Revised IAS 23 Borrowing Costs ceases the option to expense borrowing costs and requires that an entity capitalizeborrowing costs directly attributable to the acquisition, construction or production of a qualifying asset as a partof the cost of that asset. The standard identifies the borrowing costs eligible for capitalization as those that wouldhave been avoided if the expenditure on the qualifying asset had not been made. The revised IAS 23 will becomemandatory for the Group’s 2009 consolidated financial statements and will constitute a change in accounting policyfor the Group. In accordance with the transitional provisions, the Group will apply the revised IAS 23 to qualifying112113
OAO <strong>Severstal</strong> and subsidiariesOAO <strong>Severstal</strong> and subsidiariesNotes to the consolidated financial statementsfor the years ended December 31, 2008, 2007 and 2006(Amounts expressed in thousands of US dollars, except as stated otherwise)Notes to the consolidated financial statementsfor the years ended December 31, 2008, 2007 and 2006(Amounts expressed in thousands of US dollars, except as stated otherwise)assets for which capitalization of borrowing costs commences on or after the effective date. Therefore there will beno impact on prior periods in the Group’s 2009 consolidated financial statements.Revised IFRS 3 Business Combinations incorporates the following changes that are likely to be relevant to theGroup’s operations:• The definition of a business has been broadened, which is likely to result in more acquisitions being treated asbusiness combinations.• Contingent consideration will be measured at fair value, with subsequent changes therein recognized in profit orloss.• Transaction costs, other than share and debt issue costs, will be expensed as incurred.• Any pre-existing interest in the acquiree will be measured at fair value with the gain or loss recognized in profitor loss.• Any non-controlling (minority) interest will be measured at either fair value, or at its proportionate interest in theidentifiable assets and liabilities of the acquiree, on a transaction-by-transaction basis.Revised IFRS 3 becomes mandatory for the Group’s 2010 annual consolidated financial statements and will beapplied prospectively and therefore there will be no impact on prior periods in the Group’s 2010 consolidatedfinancial statements.IFRS 8 Operating Segments introduces the “management approach” to segment reporting. IFRS 8, which becomesmandatory for the Group’s 2009 consolidated financial statements, will require a change in the presentation anddisclosure of segment information based on the internal reports regularly reviewed by the Group’s Chief OperatingDecision Maker in order to assess each segment’s performance and to allocate resources to them. Currently theGroup presents segment information in respect of its seven combined business and geographical segments(Note 31).Reclassifications and restatementsDuring the current year the Group modified the income statement classification of retirement benefit income andexpense between cost of sales and general and administrative expense to more appropriately reflect their nature.In order to conform to the current year presentation the following reclassifications to the prior years were made:Year ended December 31,2007 2006(Decrease)/increase in cost of sales (25,387) 47,003Increase/(decrease) in general and administrative expenses 25,387 (47,003)Furthermore, in order to conform to the current year presentation the following reclassifications to the prior yearswere made for the bank customer accounts in the Financial segment:3. Summary of the principal accounting policiesThe following significant accounting policies have been consistently applied in the preparation of these consolidatedfinancial statements throughout the Group.a. Basis of consolidationSubsidiariesSubsidiaries are those enterprises controlled, directly or indirectly, by the Parent Company. The financial statementsof subsidiaries are included in these consolidated financial statements from the date that control effectivelycommences until the date that control effectively ceases. The minority interest represents the minorities’ proportionof the net identifiable assets of the subsidiaries, including the minorities’ share of fair value adjustments onacquisitions. Minority interests are presented in the consolidated balance sheet within equity, separately from theparent’s shareholders’ equity.Intra-group balances and transactions, and any unrealized gains arising from intra-group transactions, areeliminated in preparing these consolidated financial statements; unrealized losses are also eliminated unless thetransaction provides an evidence of impairment of the asset transferred.Acquisition of SubsidiariesThe purchase method of accounting was used to account for the acquisition of subsidiaries by the Group.The initial accounting for a business combination involves identifying and determining the fair values to be assignedto the acquiree’s identifiable assets, liabilities and contingent liabilities and the cost of acquisition. If the initialaccounting for a business combination is incomplete by the end of the period in which the combination is effected,the Group accounts for the combination using the provisional values for the items for which the accounting isincomplete. The Group recognizes any adjustments to those provisional values as a result of completing the initialaccounting within twelve months from the acquisition date. As a result goodwill or negative goodwill is adjustedaccordingly.Comparative information presented for the periods before the completing the initial accounting for the acquisition ispresented as if the initial accounting had been completed at the acquisition date.Accounting for business combinations of entities under common controlIFRS provides no guidance on accounting for business combinations of entities under common control. Managementadopted the accounting policy for such transactions based on the relevant guidance of accounting principlesgenerally accepted in the United States (‘US GAAP’). Management believes that this approach and the accountingpolicy disclosed below are in compliance with IFRS.December 31 December 312007 2006Decrease in bank customer accounts - (31,143)Increase in other current liabilities - 31,143Moreover, as discussed in Note 30 these consolidated financial statements have been restated on the effects of theacquisitions from the Majority Shareholder and the final purchase price allocation.Acquisitions of controlling interests in companies that were previously under the control of the Majority Shareholderare accounted for as if the acquisition had occurred at the beginning of the earliest comparative period presentedor, if later, at the date on which control was obtained by the Majority Shareholder. The assets and liabilitiesacquired are recognized at their book values. The components of equity of the acquired companies are added tothe same components within Group equity except that any share capital of the acquired companies is recorded asa part of additional capital. Cash consideration for such acquisitions is recognized as a liability to or a reduction ofreceivables from related parties, with a corresponding reduction in equity, from the date the acquired company is114115
OAO <strong>Severstal</strong> and subsidiariesOAO <strong>Severstal</strong> and subsidiariesNotes to the consolidated financial statementsfor the years ended December 31, 2008, 2007 and 2006(Amounts expressed in thousands of US dollars, except as stated otherwise)included in these consolidated financial statements until the cash consideration is paid. Parent Company sharesissued in consideration for the acquired companies are recognized from the moment the acquired companies areincluded in these financial statements.No goodwill is recognized where the Group acquires additional interests in the acquired companies from theMajority shareholder. The difference between the share of net assets acquired and the cost of investment isrecognized directly in equity.Investments in associatesAssociates are those enterprises in which the Group has significant influence, but does not have control over thefinancial and operating policies.Notes to the consolidated financial statementsfor the years ended December 31, 2008, 2007 and 2006(Amounts expressed in thousands of US dollars, except as stated otherwise)GoodwillGoodwill arising on the acquisition of a subsidiary, associate or a jointly controlled entity represents the excessof the cost of acquisition over the Group’s interest in the net fair value of the identifiable assets, liabilities andcontingent liabilities of the subsidiary, associate or jointly controlled entity recognized at the date of acquisition.Goodwill is initially recognized as an asset at cost and is subsequently measured at cost less any accumulatedimpairment losses. Goodwill in respect of subsidiaries is disclosed as an intangible asset and goodwill relating toassociates and jointly controlled entities is included within the carrying value of the investments in these entities.Where goodwill forms a part of a cash generating unit and the part of the operations within that unit is disposed of,the goodwill associated with that operation is included in the carrying amount of the operation when determiningthe gain or loss on disposal of the operation.Investments in associates are accounted for under the equity method and are initially recognized at cost, from thedate that significant influence commences until the date that significant influence ceases. Subsequent changesin the carrying value reflect the post-acquisition changes in the Group’s share of net assets of the associate andgoodwill impairment charges, if any, after adjustments to align the accounting policies with those of the Group.When the Group’s share of losses exceeds the carrying amount of the associate, the carrying amount is reduced tonil and recognition of further losses is discontinued except to the extent that the Group has incurred obligations inrespect of the associate.Unrealized gains on transactions between the Group and its associates are eliminated to the extent of the Group’sinterest in the associates; unrealized losses are also eliminated unless the transaction provides evidence of animpairment of the asset transferred.Interests in joint venturesA joint venture is a contractual arrangement whereby the Group and other parties undertake an economic activitywhen the strategic financial and operating policy decisions relating to the activities of the joint venture require theunanimous consent of the parties sharing control.Where a Group entity undertakes its activities under joint venture arrangements directly, the Group’s share of jointlycontrolled assets and any liabilities incurred jointly with other venturers are recognized in its financial statementsand classified according to their nature. Liabilities and expenses incurred directly in respect of interests in jointlycontrolled assets are accounted for on the accrual basis. Income from the sale or use of the Group’s share of theoutput of jointly controlled assets, and its share of joint venture expenses, are recognized when it is probable thatthe economic benefits associated with the transactions will flow to the Group and their amount can be measuredreliably.Negative goodwill represents the excess of the Group’s share in fair value of acquired identifiable assets, liabilitiesand contingent liabilities over the cost of an acquisition. It is recognized in the income statement at the date of theacquisition.b. Foreign currency transactionsTransactions in foreign currencies are translated to the functional currency of each entity at the foreign exchangerate ruling on the date of the transaction. Monetary assets and liabilities denominated in foreign currencies at thebalance sheet date are translated to the functional currency of each entity at the foreign exchange rate ruling at thatdate. Non-monetary assets and liabilities denominated in foreign currencies are translated to the functional currencyof the entity at the foreign exchange rate ruling at the date of the transaction. Foreign exchange gains and lossesarising on the translation are recognized in the income statement.c. Exploration for and evaluation of mineral resourcesExpenditures associated with search for specific mineral resources are recognized as exploration and evaluationassets. The following expenditure comprises cost of exploration and evaluation assets:• acquisition of rights to explore;• researching and analyzing existing exploration data;• conducting geological studies, exploratory drilling and sampling;• examining and testing extraction and treatment methods; and/or• compiling prefeasibility and feasibility studies.If a project does not prove viable, all irrecoverable exploration and evaluation expenditure associated with theproject net of any related impairment allowances is written off to the income statement.Joint venture arrangements that involve the establishment of a separate entity in which each venturer has an interestare referred to as jointly controlled entities. The Group reports its interests in jointly controlled entities usingthe equity method of accounting whereby an interest in jointly controlled entities is initially recorded at cost andadjusted thereafter for post-acquisition changes in the Group’s share of net assets of theе joint venture. The incomestatement reflects the Group’s share of the results of operations of the joint venture.Unrealized gains on transactions between the Group and its jointly controlled entities are eliminated to the extentof the Group’s interest in the joint venture; unrealized losses are also eliminated unless the transaction providesevidence of an impairment of the asset transferred.The Group measures its exploration and evaluation assets at cost and classifies as tangible or intangible accordingto the nature of the assets acquired and applies the classification consistently. Exploration and evaluation assetsconsidered to be tangible are recorded as a component of property, plant and equipment at cost less impairmentcharges. Otherwise, they are recorded as intangible assets, such as licenses. To the extent that tangible asset isconsumed in developing an intangible asset, the amount reflecting that consumption is capitalized as a part of thecost of the intangible asset. As the asset is not available for use, it is not depreciated. All exploration and evaluationassets are monitored for indications of impairment.116117
OAO <strong>Severstal</strong> and subsidiariesOAO <strong>Severstal</strong> and subsidiariesNotes to the consolidated financial statementsfor the years ended December 31, 2008, 2007 and 2006(Amounts expressed in thousands of US dollars, except as stated otherwise)Notes to the consolidated financial statementsfor the years ended December 31, 2008, 2007 and 2006(Amounts expressed in thousands of US dollars, except as stated otherwise)118An exploration and evaluation asset is no longer classified as such when the technical feasibility and commercialviability of extracting a mineral resource are demonstrable and the development of the deposit is sanctioned bymanagement. The carrying amount of such exploration and evaluation expenditure is reclassified into developmentexpenditure.d. Development expenditureDevelopment expenditure includes costs directly attributable to the construction of a mine and the relatedinfrastructure and is accumulated separately for each area of interest. Development expenditure is capitalized and isrecorded as a component of property, plant and equipment or intangible assets, as appropriate. No depreciation ischarged on the development expenditure before the start of the commercial production.To the extent that revenue arises from test production during the development stage, an amount is charged fromdevelopment expenditure to the cost of sales so as to reflect a zero net margin.e. Property, plant and equipmentProperty, plant and equipment are carried at cost less accumulated depreciation and accumulated impairmentlosses. Cost includes expenditure that is directly attributable to the acquisition of the asset and, for qualifying assets,borrowing costs capitalized in accordance with the Group’s accounting policy. In the case of assets constructedby the Group, related works and direct project overheads are included in cost. The cost of replacing part of an itemof property, plant and equipment is recognized in the carrying amount of the item if it is probable that the futureeconomic benefits embodied within the part will flow to the Group and its cost can be measured reliably. The carryingamount of the replaced part is derecognized. Repair and maintenance expenses are charged to the income statementas incurred. Gains or losses on disposals of property, plant and equipment are recognized in the income statement.Depreciation is provided so as to write off property, plant and equipment over its expected useful life. Depreciation iscalculated using the straight line basis, except for depreciation on vehicles and certain metal-rolling equipment, whichis calculated on the basis of mileage and units of production, respectively. The estimated useful lives of assets arereviewed regularly and revised when necessary.The principal periods over which assets are depreciated are as follows:Buildings and constructionsPlant and machineryOther productive assetsCommunity and infrastructure assets0 – 50 years0 – 20 years5 – 20 years5 – 50 yearsf. LeaseLeases are classified as finance leases whenever the terms of the lease transfer substantially all the risks and rewardsof ownership to the Group. All other leases are classified as operating leases.Assets held under finance leases are initially recognized as assets of the Group at their fair value at the inception ofthe lease or, if lower, at the present value of the minimum lease payments. The corresponding liability to the lessor isincluded in the balance sheet as a finance lease obligation.Lease payments are apportioned between finance charges and reduction of the lease obligation so as to achieve aconstant rate of interest on the remaining balance of the liability. Finance charges are charged directly to the incomestatement as a part of interest expense.The depreciation policy for depreciable leased assets is consistent with that for depreciable assets, which areowned. If there is no reasonable certainty that the Group will obtain ownership by the end of the lease term, theasset is fully depreciated over the shorter of the lease term or its useful life.Operating lease payments are recognized as an expense on a straight-line basis over the lease term, except whereanother systematic basis is more representative of the time pattern in which economic benefits from the leasedasset are consumed.g. Intangible assets (excluding goodwill)Intangible assets acquired by the Group are measured on initial recognition at cost. Following initial recognition,intangible assets are carried at cost less accumulated amortization and accumulated impairment losses.Intangible assets are amortized over the estimated useful lives using the straight-line basis and assessed forimpairment whenever there is an indication that the intangible asset may be impaired. The estimated useful lifeand amortization method are reviewed at the end of each annual reporting period, with the effect of any changes inestimate being accounted for on a prospective basis.The table below presents the useful lives of intangible assets:Mineral rightsSoftwareOther intangible assets - 25 years - 10 years3 - 50 yearsThe major components of the other intangible assets include capitalized favorable contracts and land lease rights.Amortization of intangible assets is included in the caption “Cost of sales” in the consolidated income statement.h. Impairment of assetsThe carrying amount of goodwill is tested for impairment annually. At each balance sheet date the Group assesseswhether there is any indication of impairment of Group’s other assets. If any such indication exists, the asset’srecoverable amount is estimated. An impairment loss is recognized whenever the carrying amount of an asset or itscash-generating unit exceeds its recoverable amount.Calculation of recoverable amountFor financial assets carried at amortized cost, the amount of the impairment is the difference between the asset’scarrying amount and its recoverable amount that is the present value of estimated future cash flows, discounted atthe financial asset’s original effective interest rate. For other assets the recoverable amount is the greater of the fairvalue less cost to sale and value in use. In assessing value in use, the estimated future cash flows are discounted totheir present value using a pre-tax discount rate that reflects current market assessments of the time value of moneyand the risks specific to the asset. For an asset that does not generate cash inflows largely independent of thosefrom other assets, the recoverable amount is determined for the cash-generating unit to which the asset belongs.Reversals of impairmentAn impairment loss in respect of a held-to-maturity investment, loan or receivable is reversed if the subsequentincrease in recoverable amount can be related objectively to an event occurring after the impairment loss wasrecognized. An impairment loss in respect of goodwill is not reversed. In respect of other assets, an impairment loss119
OAO <strong>Severstal</strong> and subsidiariesOAO <strong>Severstal</strong> and subsidiariesNotes to the consolidated financial statementsfor the years ended December 31, 2008, 2007 and 2006(Amounts expressed in thousands of US dollars, except as stated otherwise)Notes to the consolidated financial statementsfor the years ended December 31, 2008, 2007 and 2006(Amounts expressed in thousands of US dollars, except as stated otherwise)is reversed if there has been a change in the estimates used to determine the recoverable amount. An impairmentloss is reversed only to the extent that the asset’s carrying amount does not exceed the carrying amount that wouldhave been determined, net of depreciation or amortization, if no impairment loss had been recognized.i. InventoriesInventories are stated at the lower of cost and net realizable value. Net realizable value is the estimated sellingprice in the ordinary course of business, less the estimated costs of completion and selling expenses. The costof inventories is based on the weighted average principle and includes expenditure incurred in acquiring theinventories and bringing them to their existing location and condition. In the case of manufactured inventories andwork in progress, cost includes an appropriate share of production overheads. Allowances are recorded againstslow-moving and obsolete inventories.j. Financial assetsFinancial assets include cash and cash equivalents, investments, and loans and receivables.Cash and cash equivalents comprise cash balances, cash deposits and highly liquid investments with originalmaturities of three months or less, that are readily convertible to known amounts of cash and are subject to aninsignificant risk of changes in value.Financial assets are classified into the following specified categories: financial assets ‘at fair value through profit orloss’ (FVTPL), ‘held-to-maturity’ investments, ‘available-for-sale’ (AFS) financial assets and ‘loans and receivables’.The classification depends on the nature and purpose of the financial assets and is determined at the time of initialrecognition.Effective interest methodThe effective interest method is a method of calculating the carrying value of a financial asset held at amortizedcost and of allocating interest income over the relevant period. The effective interest rate is the rate that exactlydiscounts estimated future cash receipts (including all fees on points paid or received that form an integral partof the effective interest rate, transaction costs and other premiums or discounts) through the expected life of thefinancial asset, or, where appropriate, a shorter period.Income is recognized on an effective interest basis for debt instruments other than those financial assets designatedas at FVTPL.Financial assets at FVTPLFinancial assets are classified as at FVTPL where the financial asset is either held for trading or it is designated as atFVTPL.A financial asset is classified as held for trading if:• it has been acquired principally for the purpose of selling in the near future; or• it is a part of an identified portfolio of financial instruments that the Group manages together and has a recentactual pattern of short-term profit-taking.A financial asset other than a financial asset held for trading may be designated as at FVTPL upon initial recognition if:• such designation eliminates or significantly reduces a measurement or recognition inconsistency that wouldotherwise arise; or• the financial asset forms part of a group of financial instruments, which are managed and performance isevaluated on a fair value basis, in accordance with the Group’s documented risk management or investmentstrategy, and information about the grouping is provided internally on that basis.Financial assets at FVTPL are stated at fair value, with any resultant gain or loss recognized in profit or loss. The netgain or loss recognized in profit or loss incorporates any dividend or interest earned on the financial asset.Held-to-maturity investmentsNon-derivative financial assets with fixed or determinable payments and fixed maturity dates that the Group hasthe positive intent and ability to hold to maturity are classified as held-to-maturity investments. Held-to-maturityinvestments are recorded at amortized cost using the effective interest method less any impairment.Loans and receivablesTrade receivables, loans, and other receivables that have fixed or determinable payments that are not quoted in anactive market are classified as loans and receivables. Loans and receivables are measured at amortized cost usingthe effective interest method, less any impairment. Interest income is recognized by applying the effective interestrate, except for short-term receivables when the recognition of interest would be immaterial.AFS financial assetsAvailable for sale financial assets are those non-derivative financial assets that are not classified as financial assetsat FVTPL, held-to-maturity or loans and receivables and are stated at fair value. Listed shares that are traded in anactive market are stated at their market value. Investments in unlisted shares that do not have a quoted market pricein an active market and whose fair value cannot be reliably measured are recorded at management’s estimate offair value. Gains and losses arising from changes in fair value are recognized directly in equity with the exception ofimpairment losses, which are recognized directly in the income statement. Where the investment is disposed of or isdetermined to be impaired, the cumulative gain or loss previously recognized in the equity is included in the incomestatement for the period.Dividends on AFS equity instruments are recognized in the income statement when the Group’s right to receive thedividends is established.Derecognition of financial assetsThe Group derecognizes a financial asset only when the contractual rights to the cash flows from the asset expire; orit transfers the financial asset and substantially all the risks and rewards of ownership of the asset to another entity.k. Financial liabilitiesFinancial liabilities are classified as either financial liabilities ‘at FVTPL’ or ‘other financial liabilities’.120121
OAO <strong>Severstal</strong> and subsidiariesOAO <strong>Severstal</strong> and subsidiariesNotes to the consolidated financial statementsfor the years ended December 31, 2008, 2007 and 2006(Amounts expressed in thousands of US dollars, except as stated otherwise)Financial liabilities at FVTPLFinancial liabilities are classified as at FVTPL where the financial liability is either held for trading or it is designated asat FVTPL.A financial liability is classified as held for trading if:• it has been incurred principally for the purpose of repurchasing in the near future; or• it is a part of an identified portfolio of financial instruments that the Group manages together and has a recentactual pattern of short-term profit-taking.A financial liability other than a financial liability held for trading may be designated as at FVTPL upon initialrecognition if:• such designation eliminates or significantly reduces a measurement or recognition inconsistency that wouldotherwise arise; or• the financial liability forms a part of a group of financial instruments, which are managed and performance isevaluated on a fair value basis, in accordance with the Group’s documented risk management or investmentstrategy, and information about the grouping is provided internally on that basis.Financial liabilities at FVTPL are stated at fair value, with any resultant gain or loss recognized in profit or loss. The netgain or loss recognized in profit or loss incorporates any interest paid on the financial liability.Other financial liabilitiesOther financial liabilities, including borrowings, are initially measured at fair value, net of transaction costs. Borrowingcosts on loans specifically for the purchase or construction of a qualifying asset are capitalized as a part of the cost ofthe asset they are financing.Other financial liabilities are subsequently measured at amortized cost using the effective interest method, withinterest expense recognized in the income statement.Derecognition of financial liabilitiesThe Group derecognizes financial liabilities when, and only when, the Group’s obligations are discharged, cancelled orthey expire.l. Hedging instrumentsThe Group holds cash flow hedging instruments in order to hedge the exposure to variability in cash flows that isattributable to a particular risk associated with a recognized asset or liability or a highly probable forecast transactionand could affect profit or loss.Changes in the fair value of the derivative hedging instrument designated as a cash flow hedge are recognized directlyin equity to the extent that the hedge is effective. To the extent that the hedge is ineffective, changes in fair value arerecognized in profit or loss.Notes to the consolidated financial statementsfor the years ended December 31, 2008, 2007 and 2006(Amounts expressed in thousands of US dollars, except as stated otherwise)recognized in equity is transferred to the carrying amount of the asset when it is recognized. In other cases the amountrecognized in equity is transferred to profit or loss in the same period that the hedged item affects profit or loss.m. Dividends payableDividends are recognized as a liability in the period in which they are authorized by the shareholders.n. Indirect taxes and contributionsIndirect taxes and contributions are taxes and mandatory contributions paid to the government, or governmentcontrolled agencies, that are calculated on a variety of bases, but exclude taxes calculated on profits, value addedtaxes calculated on revenues and purchases and social security costs calculated on wages and salaries. Socialsecurity costs are included in cost of sales, distribution expenses and general and administrative expenses inaccordance with the nature of related wages and salaries expenses.o. Income taxIncome tax on the profit for the year comprises current and deferred tax. Income tax is recognized in the incomestatement except to the extent that it relates to items recognized directly in equity, in which case it is recognized inequity.Current tax expense is calculated by each entity on the pre-tax income determined in accordance with the taxlaw of the country, in which the entity is incorporated, using tax rates enacted at the balance sheet date, and anyadjustment to tax payable in respect of previous years.Deferred tax is calculated using the balance sheet method, providing for temporary differences between the carryingamounts of assets and liabilities for financial reporting and taxation purposes. Deferred tax is measured at the taxrates that are expected to be applied to the temporary differences when they reverse, based on the laws that havebeen enacted or substantively enacted by the balance sheet date. Deferred tax assets and liabilities are offset ifthere is a legally enforceable right to offset current tax liabilities and assets, and they relate to income taxes leviedby the same tax authority on the same taxable entity, or on different tax entities, but they intend to settle current taxliabilities and assets on a net basis or their tax assets and liabilities will be realized simultaneously.Deferred tax assets are recognized only to the extent that it is probable that future taxable profits will be availableagainst which these assets can be utilized. Deferred tax assets are reviewed at each reporting date and are reducedto the extent that it is no longer probable that the related tax benefit will be realized.Deferred tax is not recognized in respect of the following:• investments in subsidiaries where the Group is able to control the timing of the reversal of the temporarydifferences and it is probable that the temporary difference will not reverse in the foreseeable future;• if it arises from the initial recognition of an asset or liability that is not a business combination and, at the time ofthe transaction, affects neither accounting profit nor taxable profit or loss,• initial recognition of goodwill.If the hedging instrument no longer meets the criteria for hedge accounting, expires or is sold, terminated or exercised,then hedge accounting is discontinued prospectively. The cumulative gain or loss previously recognized in equityremains there until the forecast transaction occurs. When the hedged item is a non-financial asset, the amount122123
OAO <strong>Severstal</strong> and subsidiariesOAO <strong>Severstal</strong> and subsidiariesNotes to the consolidated financial statementsfor the years ended December 31, 2008, 2007 and 2006(Amounts expressed in thousands of US dollars, except as stated otherwise)Notes to the consolidated financial statementsfor the years ended December 31, 2008, 2007 and 2006(Amounts expressed in thousands of US dollars, except as stated otherwise)p. ProvisionsEmployee benefitsThe Group pays retirement, healthcare and other long-term benefits to its employees.The Group has two types of retirement benefits: a defined contribution plans and defined benefit plans. Definedcontribution plans are post-employment benefit plans under which the Group pays fixed contributions into aseparate entity and will have no legal or constructive obligation to pay further amounts in respect of those benefits.The Group’s only obligation is to pay contributions as they fall due, including contributions to the Russian FederationState pension fund. Prepaid contributions are recognized as an asset to the extent that a cash refund or a reductionin future payments is available.Defined benefits plans are post-employment benefits plans other than defined contribution plans. The calculationof the Group’s net obligation in respect of defined retirement benefit plans is performed annually by managementusing the projected unit credit method. In accordance with this method, the Group’s net obligation is calculatedseparately for each defined benefit plan by estimating the amount of future benefit that employees have earnedin return for their service in the current and prior periods; that benefit is discounted to its present value and thefair value of any plan assets is deducted. The discount rate used is the yield at the balance sheet date on highquality corporate bonds for a respective country that have maturity dates approximating the terms of the Group’sobligations. Any actuarial gain or loss arising from the calculation of the retirement benefit obligation is fullyrecognized in the current year’s income statement.Other provisionsOther provisions are recognized in the balance sheet when the Group has a legal or constructive obligation as aresult of a past event, it is probable that an outflow of economic benefits will be required to settle the obligation,and a reliable estimate can be made of the amount of the obligation.q. Share capitalOrdinary sharesOrdinary shares are classified as equity. Incremental costs directly attributable to issue of ordinary shares and shareoptions are recognized as a deduction from equity, net of any tax effects.Repurchase of issued sharesWhen share capital recognized as equity is repurchased, the amount of the consideration paid which includesdirectly attributable costs, is net of any tax effects, and is recognized as a deduction from equity. Repurchasedshares are classified as treasury shares and are presented as a deduction from total equity. When treasury sharesare sold or reissued subsequently, the amount received is recognized as an increase in equity, and the resultingsurplus or deficit on the transaction is transferred to/from retained earnings.r. Revenue recognitionRevenue is measured at the fair value of the consideration received or receivable. Revenue is reduced for estimatedcustomer returns, rebates and other similar allowances.Other long-term employee benefits include various compensations, non-monetary benefits and long-term incentiveprogram.Decommissioning liabilityThe Group has environmental liabilities related to restoration of soil and other related works, which are due uponthe closures of certain of its production sites. Decommissioning liabilities are estimated case-by-case based onavailable information, taking into account applicable local legal requirements. The estimation is made using existingtechnology, at current prices, and discounted using a real discount rate. Future decommissioning costs, discountedto net present value, are capitalized and the corresponding decommissioning liability raised as soon as theconstructive obligation to incur such costs arises. Future decommissioning costs are capitalized in property, plantand equipment and are depreciated over the life of related asset. The unwinding of the decommissioning liabilityis included in the consolidated income statement as interest expense. Ongoing rehabilitation costs are expensedwhen incurred.Onerous contractsA provision for onerous contracts is recognized when the expected benefits to be derived by the Group froma contract are lower than the unavoidable cost of meeting its obligations under the contract. The provision ismeasured at the present value of the lower of the expected cost of terminating the contract and the expected netcost of continuing with the contract. Before a provision is established, the Group recognizes any impairment loss onthe assets associated with that contract.When goods are sold or services are rendered in exchange for dissimilar goods or services, the revenue is measuredat the fair value of the goods or services received, adjusted by the amount of cash or cash equivalents transferred.When the fair value of the goods or services received cannot be measured reliably, the revenue is measured at thefair value of the goods or services given up, adjusted by the amount of any cash or cash equivalents transferred.Sale of goodsRevenue from the sale of goods is recognized in the income statement when the significant risks and rewards ofownership have been transferred to the buyer; the Group retains neither continuing managerial involvement to thedegree usually associated with ownership nor effective control over the goods sold; the amount of revenue can bemeasured reliably; it is probable that the economic benefits associated with the transaction will flow to the entity;and the costs incurred or to be incurred in respect of the transaction can be measured reliably.Rendering of servicesRevenue from a contract to provide services is recognized by reference to the stage of completion of the contract.s. Interest incomeInterest income is recognized in the income statement on a time basis, by reference to the principal outstandingand at the effective interest rate applicable, which is the rate that exactly discounts estimated future cash receiptsthrough the expected life of the financial asset to that asset’s net carrying amount.124125
OAO <strong>Severstal</strong> and subsidiariesOAO <strong>Severstal</strong> and subsidiariesNotes to the consolidated financial statementsfor the years ended December 31, 2008, 2007 and 2006(Amounts expressed in thousands of US dollars, except as stated otherwise)t. Interest expenseInterest expense is recognized in the income statement as it accrues, taking into account the effective yield on theliability.All interest costs incurred in connection with borrowings, which are not directly attributable to the acquisition,construction or production of qualifying assets, are expensed as incurred.u. Net income from securities operationsNet income from securities operations comprises dividend income (except for dividends from equity associates),realized and unrealized gains on financial assets at fair value through profit or loss, realized gains and impairmentlosses on available-for-sale and held-to-maturity investments.v. Earnings per shareEarnings per share is calculated by dividing the net profit by the weighted average number of shares outstandingduring the year, assuming that shares issued in consideration for the companies acquired from the MajorityShareholder were issued from the moment these companies are included in these consolidated financialstatements.w. Discontinued operationsDiscontinued operations are disclosed when a component of the Group either has been disposed of during thereporting period, or is classified as held for sale or other type of disposal at the balance sheet date. This condition isregarded as met only when the disposal is highly probable within one year from the date of classification.The comparative income statement is presented as if the operation had been discontinued from the beginning of thecomparative period.Assets and liabilities of a disposal group are presented in the balance sheet separately from other assets andliabilities. Comparative information related to discontinued operations is not amended in the balance sheet.x. Segment reportingA segment is a distinguishable component of the Group that is engaged either in providing related products orservices (business segment), or in providing products or services within a particular economic environment(geographical segment), which is subject to risks and returns that are different from those of other segments. TheGroup’s primary format for segment reporting is a combination of both business and geographical components,predetermined by the Group’s management and internal reporting structure.Inter-segment pricing is determined on an arm’s length basis.Segment capital expenditure is the total cost incurred during the period to acquire property, plant and equipment,and intangible assets other than goodwill.Notes to the consolidated financial statementsfor the years ended December 31, 2008, 2007 and 2006(Amounts expressed in thousands of US dollars, except as stated otherwise)4. SalesSales by product were as follows:Sales by delivery destination were as follows:5. Staff costsEmployment costs were as follows:Year ended December 31,2008 2007 2006Hot-rolled strip and plate 5,952,558 3,797,586 3,449,291Long products 3,793,931 3,150,114 2,434,993Galvanized and other metallic coated sheet 2,350,259 1,323,406 1,143,198Cold-rolled sheet 2,314,440 1,285,217 1,349,704Semifinished products 1,667,294 1,101,800 939,351Metalware products 1,384,637 1,009,999 845,033Large diameter pipes 819,727 530,726 -Shipping and handling costs billed to customers 808,695 662,447 544,833Others tubes and pipes, formed shapes 485,467 411,690 351,194Pellets and iron ore 453,069 304,825 242,697Color coated sheet 388,160 289,687 144,514Scrap 321,317 290,752 26,513Rails, wheels and axles 279,354 321,751 375,270Coal and coking coal concentrate 257,463 264,753 249,280Gold 190,415 - -Others 925,931 758,634 626,96522,392,717 15,503,388 12,722,836Year ended December 31,2008 2007 2006Russian Federation 8,878,900 6,879,437 5,159,766Europe 6,336,431 5,317,895 4,417,367North America 5,410,115 2,002,852 2,406,186The Middle East 556,413 450,360 215,059China and Central Asia 399,029 353,916 138,016South-East Asia 381,929 291,052 143,553Central & South America 320,489 151,281 156,685Africa 109,411 56,595 86,20422,392,717 15,503,388 12,722,836Year ended December 31,2008 2007 2006Wages and salaries (2,078,521) (1,534,443) (1,279,816)Social security costs (450,812) (418,031) (304,087)Retirement benefit costs (Note 26) (28,647) (7,719) (2,385)(2,557,980) (1,960,193) (1,586,288)Actuarial (losses)/gains recognized (Note 26) (33,141) 37,056 (67,658)Staff costs (2,591,121) (1,923,137) (1,653,946)126127
OAO <strong>Severstal</strong> and subsidiariesOAO <strong>Severstal</strong> and subsidiariesNotes to the consolidated financial statementsfor the years ended December 31, 2008, 2007 and 2006(Amounts expressed in thousands of US dollars, except as stated otherwise)For the year ended December 31, 2008, key management’s remuneration totalled US$ 43.9 million (2007: US$ 57.2million; 2006: US$ 44.5 million). As a part of the above amount US$ 40.1 million was paid in 2006 to the Group’srelated party, ZAO <strong>Severstal</strong> Group that employed executive officers of <strong>Severstal</strong> and seconded them to <strong>Severstal</strong>during the year ended December 31, 2006.6. Net (loss)/income from securities operationsYear ended December 31,2008 2007 2006Held-for-trading securitiesProfit on disposal 3,037 - 153Remeasurement to fair value (106,058) 3,864 401Held-to-maturity securities and loansRemeasurement to fair value (discounting) (2,249) 3,577 13,909Available-for-sale securitiesProfit on disposal 1,203 11,849 6,384Remeasurement to fair value 2,794 4,012 7,183Dividends received 4,520 2,262 241(96,753) 25,564 28,2717. Net other operating income/(expenses)Year ended December 31,2008 2007 2006Insurance proceeds 430,000 - -Compensation for damages 267,000 - -Gain on termination of a supply contract 177,000 - -Other (83,820) (7,266) (23,174)790,180 (7,266) (23,174)In January 2008, an explosion occurred on one of <strong>Severstal</strong> North America’s (“SNA”) furnaces, blast furnace “B”.Following the accident, SNA has ceased blast furnace “B” operation. SNA is insured against property damage andbusiness interruption with a combined gross coverage of US$ 500.0 million, subject to customary deductibles. Thebusiness interruption insurance covers fixed costs and loss of profits. The entire amount of the insurance coverageof US$ 430.0 million was received in 2008.In February 2008, a long term electricity supply contract between SNA and Dearborn Industrial Generation (“DIG”)has been terminated with a lump sum payment from DIG to compensate SNA for the differential between thecontract price and the price SNA will have to pay another electricity supplier for the duration of the original contract.This lump sum payment amounted to US$ 177.0 million.In December 2008, a court decision was announced to award the Group the compensation of damages of US$ 267.0million by A.T. Massey Coal Co. in connection with a breach of a contract for coal supply during the years 2004– 2006.Insurance proceeds, compensation for damages and gain on termination of supply contract relates to <strong>Severstal</strong>North America segment.Notes to the consolidated financial statementsfor the years ended December 31, 2008, 2007 and 2006(Amounts expressed in thousands of US dollars, except as stated otherwise)8. Impairment of non-current assetsYear ended December 31,2008 2007 2006Impairment of property, plant and equipment (Note 22) (1,079,124) (28,895) (57,820)Impairment of goodwill (Note 23) (461,139) - -(1,540,263) (28,895) (57,820)For the purpose of impairment testing, the recoverable amount of each cash-generating unit has been determinedbased on value in use calculation, except for <strong>Severstal</strong> Warren Inc. where the recoverable amount has beendetermined based on fair market value less costs to sell. Value in use calculation uses cash flow projections basedon actual operating results and business plan approved by management and a corresponding discount rate whichreflects time value of money and risks associated with each individual cash generating unit. Key assumptionsmanagement used in their value in use calculation are as follows:• For all cash generating units apart from the Mining segment cash flow projections cover a period of five years,cash flows beyond that five-year period have been extrapolated taking into account business cycles. Cash flowprojections for cash generating units of Mining segment cover a period which corresponds to the contractualtime of respective mining licenses.• Cash flow projections were prepared in nominal terms.• Cash flow projections during the forecast period are based on long-term price trends for both sales pricesand material costs specific for each segment and geographic region and operating cost inflation in line withconsumer price inflation for each country. Consumer price inflation expectations (in local currency) during theforecast period are as follows:Inflation expectations, %Russia 12.0USA 1.8 - 2.0Italy 1.9 - 2.0France 1.6 - 2.0UK 2.3 - 2.0• Discount rates for each cash-generating unit were estimated in nominal terms on the weighted average cost ofcapital basis. These rates, presented by segment, are as follows:Discount rates, %Mining segment:Russia* 18.5 - 21.4Kazakhstan* 23.6USA* 16.4Russian Steel* 20.1 - 22.1Lucchini 12.6 - 13.1North America 17.7 - 18.9Izhora Pipe Mill* 22.5Metalware sement:Russia* 21.7Italy 10.5*US$ rateValues assigned to key assumptions and estimates used to measure the unit’s recoverable amount are consistentwith external sources of information and historic data for each cash-generating unit. Management believes that thevalues assigned to the key assumptions and estimates represent the most realistic assessment of future trends.128129
OAO <strong>Severstal</strong> and subsidiariesOAO <strong>Severstal</strong> and subsidiariesNotes to the consolidated financial statementsfor the years ended December 31, 2008, 2007 and 2006(Amounts expressed in thousands of US dollars, except as stated otherwise)Notes to the consolidated financial statementsfor the years ended December 31, 2008, 2007 and 2006(Amounts expressed in thousands of US dollars, except as stated otherwise)ImpairmentFor the following cash generating units an impairment loss was identified:Mining segmentVorkutaugolAn impairment loss was recognised in the amount of US$ 128.8 million and was allocated to property, plant andequipment.The following specific assumptions were used in the impairment test:The above estimates are particularly sensitive in the following areas:• a 1% increase in discount rate increases an impairment loss by US$ 44.7 million;• a 10% decrease in future planned revenues increases an impairment loss by US$ 222.8 million.Russian SteelNeva MetallAn impairment loss was recognized in the amount of US$ 29 million and was allocated fully to goodwill.• the forecast extraction volumes grow on average at 5% p.a. during the five year period ending 2013 and remainconstant thereafter;• the forecast has the following growth rates for coking coal prices: average decline of 16% p.a. in 2009 to 2011;average growth of 29% p.a. during the next two years and constant at 80% of 2013 prices thereafter;• the forecast has the following growth rates for steam coal prices: average decline of 16% p.a. in 2009 to 2010;average growth of 10% p.a. during the next three years and constant at 89% of 2013 prices thereafter;• operating costs are forecast to decrease by 27% in 2009 compared to 2008 and then increase on average by 9%p.a. during the next four years; thereafter costs remain constant at 2013 level;• pre-tax discount rate of 18.5% (in US$ terms).The above estimates are particularly sensitive in the following areas:The carrying amount of goodwill allocated to the cash generating unit before impairment loss was US$ 40 million.The following specific assumptions were used in the impairment test:• cash flow projections are based on financial forecasts approved by management covering a four year period;• volumes are assumed to be constant during the forecast period and thereafter;• the forecast sales prices increase by 1% in 2009, increase by 7% p.a. in 2010 to 2012 and remain constant at2012 level thereafter;• operating costs are forecast to increase on average by 11% p.a. in 2009 to 2012 and remain constant at 2012level thereafter;• pre-tax discount rate of 22.1% (US$ terms).• a 1% increase in discount rate increases an impairment loss by US$ 21.3 million;• a 10% decrease in future planned revenues increases an impairment loss by US$ 341.8 million.PBS Coals LimitedAn impairment loss was recognised in the amount of US$ 361.1 million and was allocated fully to goodwill.The carrying amount of goodwill allocated to the cash generating unit before impairment loss was US$ 447.5 million.The following specific assumptions were used in the impairment test:• the forecast extraction volumes increase by 22% in 2009, increase by 10% in 2010 and remain constant at 2010level thereafter;• the forecast coking coal prices increase by 1.1% p.a. during the five year forecast period and remain constantthereafter;• the forecast steam coal prices increase on average by 2.5% p.a. during the five year forecast period and remainconstant at 2013 level thereafter;• operating costs are forecast to increase by 9% in 2009 and then increase on average by 1% p.a. during the nextfour years; thereafter costs are assumed to be constant at 2013 level;• pre-tax discount rate of 16.4%.The above estimates are particularly sensitive in the following areas:• a 1% increase in discount rate increases an impairment loss by US$ 3.0 million;• a 10% decrease in future planned revenues increases an impairment loss by US$ 17.0 million.Other unitsThe impairment loss related to other cash generating units within the segment was recognized in the amount of US$5.9 million and was allocated to specific items of property, plant and equipment.LucchiniThe impairment loss was recognised in the amount of US$ 3.8 million in relation to specific items of property, plantand equipment.<strong>Severstal</strong> North America<strong>Severstal</strong> Wheeling Holding CompanyAn impairment loss was recognised of US$ 621.8 million and was allocated to property, plant and equipment in theamount of US$ 557.4 million and to goodwill in the amount of US$ 64.4 million.The carrying amount of goodwill allocated to the cash generating unit before impairment loss was US$ 64.4 million.130131
OAO <strong>Severstal</strong> and subsidiariesOAO <strong>Severstal</strong> and subsidiariesNotes to the consolidated financial statementsfor the years ended December 31, 2008, 2007 and 2006(Amounts expressed in thousands of US dollars, except as stated otherwise)Notes to the consolidated financial statementsfor the years ended December 31, 2008, 2007 and 2006(Amounts expressed in thousands of US dollars, except as stated otherwise)The following specific assumptions were used in impairment test:• the forecast sales volumes decline by 49% in 2009, increase by 54% in 2010 and further increase on average by5% p.a. in 2011 to 2013; thereafter sales volumes remain constant at the average level of the forecast period;• the forecast steel prices increase by 8% in 2009; decline by 2% in 2010 and remain stable till 2013; thereaftersales prices remain constant at the weighted average level of the forecast period;• operating costs are forecast to decrease by 33% in 2009, increase by 32% in 2010 and then increase on averageby 5% p.a. during the next three years; thereafter operating costs remain constant at the average level of theforecast period;• pre-tax discount rate of 18.9%.Results of Goodwill impairment testingThe goodwill of the following cash generating units had been tested for impairment and no impairment loss wasrecognised as the result of those tests:Mining segmentNerengri-Metallik and Rudnik AprelkovoThe carrying amount of goodwill allocated to the cash generating unit was amounted US$ 54.5 million.The above estimates are particularly sensitive in the following areas:The following assumptions were used in the impairment test:• a 1% increase in discount rate increases an impairment loss by US$ 21.1 million;• a 10% decrease in future planned revenues increases an impairment loss by US$ 113.4 million.<strong>Severstal</strong> Warren Inc.The recoverable amount was determined as fair market value less costs to sell.An impairment loss was recognised of US$ 382.6 million and was allocated to property, plant and equipment in theamount of US$ 376 million and to goodwill in the amount of US$ 6.6 million.The carrying amount of goodwill allocated to the cash generating unit before impairment loss was US$ 6.6 million.The following assumptions were used for the calculation of fair market value less cost to sell:• the market value of the major production equipment is determined based on the most recent valuationperformed by the independent appraiser when finalising the purchase price allocation (Note 30);• the value of other items of property, plant and equipment is determined on current prices for scrap, adjusted fordecommissioning costs;• the fair value calculation includes site restoration and other related environmental expenditures based onrequirements of applicable regulation.Management believes that any reasonable possible change in any of these key assumptions would not cause thecarrying amount of the cash generating unit to exceed its recoverable amount.Metalware segmentThe impairment loss related to other cash generating units was recognised in the amount of US$ 7.2 million and wasallocated to property, plant and equipment.• the forecast extraction volumes grow on average at 22% p.a. during 2009 to 2012 and remain constantthereafter;• the forecast has the following growth rates for gold prices: decline of 16% in 2009; average growth of 12% p.a.in 2010 to 2013; average decline of 4% p.a. during the remaining contractual term of the respective licenses;• operating costs are forecast to increase on average by 9% p.a. in 2009 to 2013 and to grow on average by 1%p.a. during the remaining contractual term of the respective licenses;• pre-tax discount rate of 21% (in US$ terms).The above estimates are particularly sensitive in the following areas:• a 10% decrease in future planned revenues causes the carrying amount of cash generating unit to exceed itsrecoverable amount by US$ 52.2 million.Celtic Resources Holdings Plc.The carrying amount of goodwill allocated to the cash generating unit was amounted US$ 37.8 million.The following assumptions were used in the impairment test:• the forecast extraction volumes increase on average by 54% p.a. in 2009 to 2010, decline on average by 10% in2011 to 2012 and remain constant thereafter;• the forecast has the following growth rates for gold prices: decline of 17% in 2009; average growth of 12% p.a.in 2010 to 2013; average decline of 5% p.a. during the remaining contractual term of the respective licenses;• operating costs are forecast to increase on average by 39% p.a. in 2009 to 2010, further grow on average by 5%p.a. in 2011 to 2012 and remain constant during the remaining contractual term of the respective licenses;• pre-tax discount rate of 23.6% (in US$ terms).Management believes that any reasonably possible change in any of these key assumptions would not cause thecarrying amount of the cash generating unit to exceed its recoverable amount.132133
OAO <strong>Severstal</strong> and subsidiariesOAO <strong>Severstal</strong> and subsidiariesNotes to the consolidated financial statementsfor the years ended December 31, 2008, 2007 and 2006(Amounts expressed in thousands of US dollars, except as stated otherwise)Notes to the consolidated financial statementsfor the years ended December 31, 2008, 2007 and 2006(Amounts expressed in thousands of US dollars, except as stated otherwise)Metalware segment11. TaxationRedaelli Tecna S.p.AThe carrying amount of goodwill allocated to the cash generating unit was amounted US$ 45.1 million.The following is an analysis of the income tax expense:Year ended December 31,The following specific assumptions were used in the impairment test:• sales volumes are assumed to be stable during the forecast period and thereafter, except for 2010 where slightincrease by 3% is assumed;• forecasted sales prices decrease by 22% in 2009 and then increase by 5% p.a. in 2009 to 2013; thereafter pricesremain constant at 2013 level;• operating costs are forecast to increase on average by 7% p.a. in the forecast period and remain constant at2013 level thereafter;• pre-tax discount rate of 10.5%.The above estimates are particularly sensitive in the following areas:2008 2007 2006Current tax charge (1,010,251) (784,658) (612,573)Corrections to prior year’s current tax charge 21,849 15,416 (13,152)Deferred tax benefit/(expense) 420,047 69,089 (9,369)Effect of change in statutory tax rate 47,982 - -Income tax expense (520,373) (700,153) (635,094)The following table is a reconciliation of the reported net income tax expense and the amount calculated by applyingthe Russian statutory tax rate of 24 % to reported profit before income tax. In 2008, the Russian Governmentenacted a change in the Russian statutory tax rate from 24% to 20%. The new rate becomes effective beginningJanuary 1, 2009.• a 10% decrease in future planned revenues causes the carrying amount of cash generating unit to exceed itsrecoverable amount by US$ 16.7 million.9. Net other non-operating income/(expenses)Year ended December 31,2008 2007 2006Social expenditure (43,664) (42,566) (33,872)Charitable donations (32,277) (41,276) (17,060)Depreciation of community and infrastructure assets (4,293) (6,341) (3,465)Gain on disposal of subsidiaries and associates (Note 30) 314,435 31,507 846Other 4,744 - -238,945 (58,676) (53,551)10. FinancingYear ended December 31,2008 2007 2006Interest income:Third parties 137,151 152,708 78,524Related parties 18,082 13,931 31,572155,233 166,639 110,096Interest expense:Third parties (486,360) (309,819) (246,681)Related parties (5,019) (3,370) (4,224)Amortization of transaction costs (14,337) (12,391) (5,057)(505,716) (325,580) (255,962)Year ended December 31,2008 2007 2006Profit before income tax 2,587,959 2,576,243 2,105,911Tax charge at Russian statutory rate - 24% (621,110) (618,298) (505,419)Profits taxed at different rates 88,817 (19,305) (36,247)Corrections to prior years’s current tax charge 21,849 15,416 (13,152)Net gain on tax restructuring - - 3,521Non-tax deductible expenses, net (61,210) (39,216) (78,280)Tax-loss carry forwards expired (12,901) (18,494) (17,462)Changes in non-recognized deferred tax assets 28,939 (20,256) 32,375Reassessment of deferred tax liabilities (12,739) - (20,430)Effect of change in statutory tax rate 47,982 - -Income tax expense (520,373) (700,153) (635,094)Income tax charge for the year ended December 31, 2008 includes tax expense of nil (2007: US$ 1.3 million, 2006:US$ 2.7 million) related to profits from discontinued operations (Note 29) and tax expense of nil related to gains ondisposals of discontinued operations (2007: US$ 9.0 million, 2006: nil).134135
OAO <strong>Severstal</strong> and subsidiariesOAO <strong>Severstal</strong> and subsidiariesNotes to the consolidated financial statementsfor the years ended December 31, 2008, 2007 and 2006(Amounts expressed in thousands of US dollars, except as stated otherwise)Notes to the consolidated financial statementsfor the years ended December 31, 2008, 2007 and 2006(Amounts expressed in thousands of US dollars, except as stated otherwise)The composition of the net deferred tax liability based on the temporary differences arising between the fiscal andreporting balance sheets of the consolidated companies, is given below:December 31,2008 2007 2006Deferred tax assets:Tax-loss carry forwards 306,984 33,587 23,121Property, plant and equipment 48,006 30,406 28,777Intangible assets 13,728 3,867 1,332Inventory 81,684 81,360 79,263Accounts receivable 24,533 14,911 10,391Provisions 352,555 128,493 97,333Financial investments 51,018 5,173 2,883Other 81,890 22,748 24,634Gross deferred tax assets 960,398 320,545 267,734Less offseting with deferred tax liabilities (732,906) (256,360) (233,523)Recognised deferred tax assets 227,492 64,185 34,211December 31,2008 2007 2006Deferred tax liabilities:Property, plant and equipment (685,505) (544,628) (511,318)Provisions (1,171) (5,868) (8,328)Intangible assets (283,981) (112,655) (465)Inventory (103,033) (43,510) (63,643)Investments in associates (79,714) (25,012) (20,162)Accounts receivable (275) (2,949) (3,421)Financial liabilities (40,332) - -Other (48,222) (31,147) (24,350)Gross deferred tax liabilities (1,242,233) (765,769) (631,687)Less offseting with deferred tax assets 732,906 256,360 233,523Recognised deferred tax liabilities (509,327) (509,409) (398,164)Net deferred tax liability (281,835) (445,224) (363,953)The Group had not recognized cumulative tax-loss carry forwards in the following amounts and with the followingexpiry dates (stated in millions of US dollars):Year ended December 31,2008 2007 2006In the following year - 44.4 59.7Between one and five years - - 50.9Between five and ten years 24.2 - -No expiry 105.1 84.2 50.4129.3 128.6 161.0Temporary differences, related to investments in subsidiaries where the Group is able to control the timing of thereversal and it is probable that the temporary difference will not reverse in the foreseeable future, amounted toUS$ 653.6 million at December 31, 2008 (December 31, 2007: US$ 1,689.2 million; December 31, 2006: US$ 996.5million respectively).12. Related party transactionsYear ended December 31,2008 2007 2006Sales and income received from other related parties:Sales 254,299 150,984 211,275Interest income 18,082 13,931 31,572272,381 164,915 242,847Purchases from related parties:Purchases from associates:Non-capital expenditures 71,206 1,810 1,878Purchases from joint ventures:Non-capital expenditures 149,151 218,912 139,752Purchases from other related parties:Non-capital expenditures 145,956 666,137 1,012,740Capital expenditures 5,215 8,572 130,769371,528 895,431 1,285,139The movement in the net deferred tax liability is as follows:Year ended December 31,2008 2007 2006Opening balance (445,224) (363,953) (316,848)Recognized in income statement 468,029 69,089 (9,369)Recognized in shareholders’ equity 5,805 - -Business combinations (379,947) (111,276) (10,421)Business de-combinations 27 8,491 -Reclassified to assets held for sale - (24,913) -Foreign exchange difference 69,475 (22,662) (27,315)Closing balance (281,835) (445,224) (363,953)136137
OAO <strong>Severstal</strong> and subsidiariesOAO <strong>Severstal</strong> and subsidiariesNotes to the consolidated financial statementsfor the years ended December 31, 2008, 2007 and 2006(Amounts expressed in thousands of US dollars, except as stated otherwise)Notes to the consolidated financial statementsfor the years ended December 31, 2008, 2007 and 2006(Amounts expressed in thousands of US dollars, except as stated otherwise)13. Related party balances14. Cash and cash equivalentsDecember 31,2008 2007 2006Joint ventures’ balancesShort-term trade accounts payable 5,267 16,353 12,675Other related party balancesCash and cash equivalents at related party bank 322,865 239,909 542Deposits with related party bank and pension fund 115,488 18,985 -Accounts receivable from other related parties:Trade accounts receivable 27,796 12,659 25,967Advances paid 4,812 6,546 34,438Other receivables 31,223 27,988 13,214Short-term loans 2,952 20,322 75,452Short-term promissory notes 18,951 7,457 5,198Short-term loans to bank customers - - 13,856Long-term loans 19,155 17,447 -Long-term loans to bank customers - - 7,078Held-to-maturity securities and deposits 1,485 62,759 50,151106,374 155,178 225,354Short-term trade accounts payable to other related parties:Trade accounts payable 38,644 36,886 73,528Advances received 1,353 3,843 785Short-term payables for acquisition of subsidiaries 10,211 32,592 84,368Other accounts payable 16,485 1,873 14,830Bank demand deposits - - 58,719Bank term deposits - - 15,904Long-term payables for acquisition of subsidiaries - - 29,42866,693 75,194 277,562Debt financing includes the following balances with other related parties:Short-term debt financing 32,186 57,956 13,257Long-term debt financing 1,675 21,685 26,30333,861 79,641 39,560December 31,2008 2007 2006Petty cash 552 780 283Cash at bank 2,044,902 1,251,782 470,273Restricted cash accounts 119,487 82 6,994Short-term deposits with maturity of less than 3 months 488,801 369,898 893,844Investments in quoted monetary instruments - - 62,327Cash balances of consolidated bank:Cash - - 1,171Nostro accounts at the Central Bank of Russia - - 110,036Nostro accounts at other banks - - 6,637Placements with banks - - 191,8302,653,742 1,622,542 1,743,395As described in note 30 to these consolidated financial statements, as at December 31, 2006 the Group had asubsidiary OAO Metallurgical commercial bank (“Metcombank”). Nostro accounts of Metcombank at the CentralBank of Russia and at other banks and interbank loans given by Metcombank with an original maturity of threemonths or less were included in cash and equivalents as at December 31, 200615. Short-term bank depositsShort-term bank deposits totaled US$ 818.5 million at December 31, 2008 (December 31, 2007: US$ 666.3million, December 31, 2006: US$ 1,147.3 million) and comprised of deposits with an original maturity of morethan three months but remaining period to maturity of less than one year. The majority of such deposits have anoriginal maturity of less than 6 months, and such deposits are used by the Group to earn investment income, whilepreserving a high liquidity position. Substantially all such deposits can be withdrawn, in case of necessity, prior tothe maturity date with no loss in principal but reduced interest income.The amounts outstanding are expected to be settled in cash. The Group did not hold any collateral for amounts owedby related parties.138139
OAO <strong>Severstal</strong> and subsidiariesOAO <strong>Severstal</strong> and subsidiariesNotes to the consolidated financial statementsfor the years ended December 31, 2008, 2007 and 2006(Amounts expressed in thousands of US dollars, except as stated otherwise)Notes to the consolidated financial statementsfor the years ended December 31, 2008, 2007 and 2006(Amounts expressed in thousands of US dollars, except as stated otherwise)16. Short-term financial investmentsDecember 31,2008 2007 2006Held-for-trading securities:Promissory notes and bonds of third parties 9,031 36,578 128,375Promissory notes of related parties 18,951 7,457 5,198Quoted equity securities 44,489 56,003 19,143Other securities - 56,270 -Loans:Loans to related parties 2,952 20,322 75,452Loans to third parties 21,760 38,046 11,912Loans to bank customers:Third p arties - - 54,991Related p arties - - 13,856Alowance for loan losses - - (2,758)Available-for-sale securities 6,254 818 116Held-to-maturity securities 9,345 - -112,782 215,494 306,285Loans given to related parties were provided at interest rates ranging from nil to 15% per annum, and were given tofinance working capital and investments.17. Trade accounts receivable19. Other current assetsDecember 31,2008 2007 2006Advances paid and prepayments 189,294 236,778 189,918Other taxes and social security prepaid 17,346 16,414 19,628Reserves at Central Bank of Russia - - 12,325Other assets 73,442 65,769 44,354280,082 318,961 266,22520. Long-term financial investmentsDecember 31,2008 2007 2006Loans:Loans to related parties 19,155 17,447 -Loans to third parties 390 10,305 27,460Loans to bank customers:Related parties - - 7,078Third parties - - 19,226Available-for-sale securities 48,952 22,448 11,018Held-to-maturity securities and deposits 1,485 62,759 50,15169,982 112,959 114,933December 31,2008 2007 2006Customers 2,032,791 1,806,775 1,432,366Allowance for doubtful debts (90,523) (37,737) (35,222)1,942,268 1,769,038 1,397,14418. InventoriesDecember 31,2008 2007 2006Raw materials and supplies 2,392,490 1,382,607 1,240,538Work-in-progress 722,693 479,358 389,740Finished goods 1,163,371 858,669 711,8204,278,554 2,720,634 2,342,098Of the above amounts US$ 1,987.4 million (December 31, 2007: US$ 264.4 million, December 31, 2006: US$ 181.9million) are stated at net realizable value.During the year ended December 31, 2008, the Group recognized a US$ 25.0 million release and a US$ 432.8 millionallowance to reduce the carrying amount to a net realizable value (December 31, 2007: US$ 24.9 million and US$25.5 million respectively; December 31, 2006: US$ 32.2 million and US$ 9.1 million respectively).140141
OAO <strong>Severstal</strong> and subsidiariesOAO <strong>Severstal</strong> and subsidiariesNotes to the consolidated financial statementsfor the years ended December 31, 2008, 2007 and 2006(Amounts expressed in thousands of US dollars, except as stated otherwise)Notes to the consolidated financial statementsfor the years ended December 31, 2008, 2007 and 2006(Amounts expressed in thousands of US dollars, except as stated otherwise)21. Investments in associates and joint ventures22. Property, plant and equipmentThe Group’s investments in associated and joint ventures companies are described in the tables below. Groupstructure and certain additional information on investments in associated and joint ventures companies, includingownership percentages, is presented in note 30.December 31,2008 2007 2006AssociatesAir Liquide <strong>Severstal</strong> 6,297 7,537 7,026Others 6,018 1,276 3,655Joint venturesSpartan Steel Coating LLC 51,552 53,978 63,818Double Eagle Steel Coating Company 19,354 22,936 28,859Ohio Coatings Company 16,595 - -Bethlehem Roll Technologies, LLC 4,326 - -Mountain State Carbon LLC - 117,260 119,472104,142 202,987 222,830The following is summarized financial information in respect of associates and joint ventures:December 31,2008 2007 2006Current assets 82,092 171,647 202,168Non-current assets 279,722 428,917 446,928Short-term liabilities 52,566 87,477 115,188Long-term liabilities 91,021 93,167 101,751Equity 218,227 419,920 432,157Year ended December 31,2008 2007 2006Revenues 305,991 326,700 373,749Net income 21,513 16,211 7,617The movements in property, plant and equipment are as follows:Land andbuildingsPlant andmachineryOtherproductiveassetsCommunity andinfrastructureassetsConstructionin-progressTotal assetsCost:December 31, 2005 1,489,257 4,131,553 233,549 59,528 1,273,165 7,187,052Reclassifications (3,170) 6,769 (4,676) 1,077 - -Additions - - - - 1,654,131 1,654,131Business combinations 81,452 11,203 917 687 1,728 95,987Disposals (9,255) (199,820) (20,993) (765) (22,245) (253,078)Business de-combinations - - - (394) - (394)Transfer to other assets - - - - (11,907) (11,907)Transfers 414,230 1,319,143 35,848 15,809 (1,785,030) -Foreign exchange difference 164,860 415,924 22,974 6,063 90,831 700,652December 31, 2006 2,137,374 5,684,772 267,619 82,005 1,200,673 9,372,443Reclassifications 9,840 (25,979) 6,669 9,470 - -Additions - - - - 2,096,695 2,096,695Business combinations 83,389 83,429 6,053 711 21,412 194,994Disposals (11,418) (186,230) (12,028) (14,613) (6,618) (230,907)Business de-combinations (53,885) (154,917) (4,262) (2,277) (4,981) (220,322)Reclassified to assets held for (182,171) (166,972) (13,863) (152) (56,508) (419,666)saleTransfer to other assets - (7,793) - - (23,729) (31,522)Transfers 347,794 1,806,315 75,453 26,683 (2,256,245) -Foreign exchange difference 168,957 452,825 25,021 7,584 61,088 715,475December 31, 2007 2,499,880 7,485,450 350,662 109,411 1,031,787 11,477,190Reclassifications (3,494) (27,972) 23,729 7,737 - -Additions - - - - 2,060,203 2,060,203Business combinations 439,131 2,084,223 71,575 141 113,752 2,708,822Disposals (14,207) (155,926) (9,355) (1,355) (29,092) (209,935)Business de-combinations (3,827) (5,056) (344) (336) (2,178) (11,741)Reclassified to assets held for- (2,976) (9) - (15) (3,000)saleTransfer to other assets - - - - (22,101) (22,101)Transfers 230,808 969,495 96,028 7,766 (1,304,097) -Foreign exchange difference (351,685) (910,313) (67,357) (19,553) (155,777) (1,504,685)December 31, 2008 2,796,606 9,436,925 464,929 103,811 1,692,482 14,494,753Of the above amounts of additions to construction-in-progress US$ 11.6 million (2007: US$ 18.7 million, 2006: US$32.6 million) is interest capitalized.142143
OAO <strong>Severstal</strong> and subsidiariesOAO <strong>Severstal</strong> and subsidiariesNotes to the consolidated financial statementsfor the years ended December 31, 2008, 2007 and 2006(Amounts expressed in thousands of US dollars, except as stated otherwise)Notes to the consolidated financial statementsfor the years ended December 31, 2008, 2007 and 2006(Amounts expressed in thousands of US dollars, except as stated otherwise)23. Intangible assetsDepreciation and impairment:Land andbuildingsPlant andmachineryOther productiveassetsCommunity andinfrastructureassetsOther productive assets include transmission equipment, transportation equipment and tools.Construction-inprogressTotal assetsDecember 31, 2005 249,132 1,289,074 89,448 41,397 97,859 1,766,910Reclassifications (3,640) 5,515 (1,678) (197) - -Depreciation expense 113,087 449,635 29,737 3,465 - 595,924Business combinations 1,634 91 277 3 - 2,005Disposals (3,741) (169,420) (14,356) (561) (11,056) (199,134)Business de-combinations - - - (374) - (374)Transfers 7,952 2,165 3 5,003 (15,123) -Impairment of assets 10,454 33,253 1,824 2,605 9,684 57,820Foreign exchange difference 27,286 131,221 8,887 4,189 6,844 178,427December 31, 2006 402,164 1,741,534 114,142 55,530 88,208 2,401,578Reclassifications 1,583 (4,650) 565 2,502 - -Depreciation expense 143,124 652,555 34,132 6,341 - 836,152Business combinations 1,938 7,191 803 8 - 9,940Disposals (2,689) (147,110) (9,280) (1,309) (1,186) (161,574)Business de-combinations (6,806) (51,376) (1,312) (1,869) (69) (61,432)Reclassified to assets held forsale (22,223) (63,321) (5,190) (17) (6,043) (96,794)Transfers 3,215 304 58 4,956 (8,533) -Impairment of assets 2,112 15,012 (36) 2,441 9,366 28,895Foreign exchange difference 40,517 167,105 11,081 4,751 7,855 231,309December 31, 2007 562,935 2,317,244 144,963 73,334 89,598 3,188,074Reclassifications 8,416 (20,894) 10,161 2,317 - -Depreciation expense 162,789 806,565 62,199 4,293 - 1,035,846Disposals (21) (95,642) (5,867) (570) (15,997) (118,097)Business de-combinations (1,497) (1,768) (341) (435) - (4,041)Reclassified to assets held forsale - (1,096) (9) - - (1,105)T ransfers - (10) (1) 1,941 (1,930) -Impairment of assets 146,625 876,020 11,914 3,702 40,863 1,079,124Foreign exchange difference (110,062) (389,964) (28,068) (13,711) (11,548) (553,353)December 31, 2008 769,185 3,490,455 194,951 70,871 100,986 4,626,448Net book values:December 31, 2006 1,735,210 3,943,238 153,477 26,475 1,112,465 6,970,865December 31, 2007 1,936,945 5,168,206 205,699 36,077 942,189 8,289,116December 31, 2008 2,027,421 5,946,470 269,978 32,940 1,591,496 9,868,305Cost:GoodwillMineralrightsSoftwareEvaluation, explorationanddevelopmentexpenditure*Other intangibleassetsDecember 31, 2005 1,438 29,220 27,998 - 6,327 64,983Additions - 4,717 1,473 - 2,618 8,808Disposal - - - - (337) (337)Foreign exchange difference 2 2,948 3,033 - 689 6,672December 31, 2006 1,440 36,885 32,504 - 9,297 80,126Additions - 916 13,927 11,202 5,391 31,436Business combinations 150,702 245,653 - 156,582 72,274 625,211Disposals - - (6,161) - (966) (7,127)Reclassified to assets heldfor sale - (34,254) - - - (34,254)Business de-combinations - - (6,224) - (4,728) (10,952)Foreign exchange difference 4,804 3,280 2,701 1,137 3,157 15,079December 31, 2007 156,946 252,480 36,747 168,921 84,425 699,519Additions - 2,246 28,058 33,650 28,238 92,192Business combinations 569,512 479,694 604 113,853 113,617 1,277,280Disposals - (289) (1,014) (121) (13,270) (14,694)Business de-combinations (3,621) - - - - (3,621)Foreign exchange difference (20,747) (11,038) (1,580) (30,502) (12,784) (76,651)December 31, 2008 702,090 723,093 62,815 285,801 200,226 1,974,025Amortization and impairment:December 31, 2005 20 - 4,558 - 3,882 8,460Amortization expense - 1,708 5,045 - 2,240 8,993Disposals - - - - (249) (249)Foreign exchange difference 2 55 823 - 376 1,256December 31, 2006 22 1,763 10,426 - 6,249 18,460Amortization expense - 3,046 3,756 - 3,308 10,110Disposals - - (6,161) - (396) (6,557)Reclassified to assets heldfor sale - (3,602) - - - (3,602)Business de-combinations - - (3,924) - (3,923) (7,847)Foreign exchange difference 2 215 844 - 827 1,888December 31, 2007 24 1,422 4,941 - 6,065 12,452Amortization expense - 28,597 5,905 - 15,432 49,934Impairment 461,139 - - - - 461,139Disposals - (172) (367) - (981) (1,520)Foreign exchange difference (4) (1,174) (489) - (799) (2,466)December 31, 2008 461,159 28,673 9,990 - 19,717 519,539Net book values:December 31, 2006 1,418 35,122 22,078 - 3,048 61,666December 31, 2007 156,922 251,058 31,806 168,921 78,360 687,067December 31, 2008 240,931 694,420 52,825 285,801 180,509 1,454,486Total144*At December 31, 2008 of the above amounts US$ 39.7 million (December 31, 2007: nil; December 31, 2006: nil) are licensesin development stage.145
OAO <strong>Severstal</strong> and subsidiariesOAO <strong>Severstal</strong> and subsidiariesNotes to the consolidated financial statementsfor the years ended December 31, 2008, 2007 and 2006(Amounts expressed in thousands of US dollars, except as stated otherwise)24. Debt financeDecember 31,2008 2007 2006Eurobonds 2009 325,000 325,000 325,000Eurobonds 2013 1,250,000 - -Eurobonds 2014 375,000 375,000 375,000Other issued notes and bonds 14,150 - 113,934Bank financing 5,941,200 2,932,570 2,226,979Factoring of receivables 191,623 201,909 224,049Other financing 142,711 119,361 72,674Accrued interest 112,090 41,807 56,692Unamortized balance of transaction costs (96,257) (53,265) (48,172)8,255,517 3,942,382 3,346,156Total debt is denominated in the following currencies:US Dollars 4,957,298 1,960,275 1,426,895Rubles 653,339 547,866 470,143Euro 2,616,523 1,432,490 1,449,118Other currencies 28,357 1,751 -8,255,517 3,942,382 3,346,156Total debt is contractually repayable after the balance sheet date as follows:Less than one year 1,977,513 1,129,216 1,081,965Between one and five years 5,393,228 1,923,336 1,542,177After more than five years 884,776 889,830 722,0148,255,517 3,942,382 3,346,156Debt finance rose from banks and unused long term credit lines are secured by charges over:• US$ 2,837.0 million (December 31, 2007: US$ 1,142.0 million; December 31, 2006: US$ 701.4 million) of the netbook value of plant and equipment;• US$ 2,303.6 million (December 31, 2007: US$ 679.1 million; December 31, 2006: US$ 1,080.7 million) of currentassets and revenues from export contracts; and,• 50% ownership in Mountain State Carbon and investments in other associates and joint ventures in <strong>Severstal</strong>North America segment and 50% ownership in IPM, the Group’s subsidiary.Notes to the consolidated financial statementsfor the years ended December 31, 2008, 2007 and 2006(Amounts expressed in thousands of US dollars, except as stated otherwise)25. Other current liabilitiesDecember 31,2008 2007 2006Amounts payable to employees 400,791 248,231 187,330Advances received 105,611 221,612 236,565Provisions (Note 27) 69,540 43,974 12,011Onerous contracts 71,509 - -Accrued expenses 63,779 34,166 54,084Lease liabilities 23,182 9,753 2,579Derivative financial liabilities 19,110 - -Payable for acquisition of subsidiaries 7,320 - -Decommissioning liability (Note 27) 5,308 - -Deferred income 3,319 - -Bank customer accounts - - 31,143Other liabilities 36,150 62,633 30,832805,619 620,369 554,54426. Retirement benefit liabilitiesThe Group provides for its employees the following retirement benefits, which are actuarially calculated as definedbenefit obligation: lump sums payable to employees on retirement, monthly pensions, jubilee benefits, invalidityand death lump sums, burial expenses compensations, healthcare benefits, life insurance and other benefits.The following assumptions have been used to calculate the retirement benefit liability:December 31,2008 2007 2006Discount rates:Russia 8.5% to 10.6% 6.5% 6.5%USA 5.3% to 6.5% 5.3% 5.8%UK 6.7% 3.1% 4.9%Italy and France 4.4% to 5.3% 5.1% to 5.6% 4.6%Future rates of benefit increase:Russia 6.3% to 8.2% 5.8% to 6.2% 6.2%USA Fixed at 0% or 4.0% Fixed at 0% or 9.0% Fixed at 0%to 10.0%UK 2.7% 3.4% 2.8%Italy and France 3.0% to 6.0% 2.0% to 3.0% 3.0%A part of the Group’s debt financing is subject to certain covenants. The Group complied with all significant debtcovenants, including equity ratios, during the years ended December 31, 2008, 2007 and 2006.At the balance sheet date the Group had US$ 950.6 million (December 31, 2007: US$ 1,082.7 million; December 31,2006: US$ 717.9 million) of unused long term credit lines available to it.Present value of the defined benefit obligation less the fair value of plan assets is recognized as retirement benefitliability at the balance sheet.December 31,2008 2007 2006 2005 2004Present value of the defined benefit obligation 987,418 495,713 549,009 387,657 208,325Fair value of the plan assets (208,122) (108,315) (106,055) (49,171) (50,302)Retirement benefit liability 779,296 387,398 442,954 338,486 158,023146147
OAO <strong>Severstal</strong> and subsidiariesOAO <strong>Severstal</strong> and subsidiariesNotes to the consolidated financial statementsfor the years ended December 31, 2008, 2007 and 2006(Amounts expressed in thousands of US dollars, except as stated otherwise)Notes to the consolidated financial statementsfor the years ended December 31, 2008, 2007 and 2006(Amounts expressed in thousands of US dollars, except as stated otherwise)The movements in the defined benefit obligation are as follows:Year ended December 31,2008 2007 2006Opening balance 495,713 549,009 387,657Business combinations/(de-combinations) 526,630 (33,612) 39,328Reclassified to assets held for sale - (9,260) -Benefits p aid (60,698) (55,238) (33,547)Interest cost 33,065 27,589 24,962Service cost (Note 5) 27,602 18,640 18,767Actuarial loss/(gain) (Note 5) 25,889 (37,497) 68,573Foreign exchange (gain)/loss (60,783) 36,082 43,269Closing balance 987,418 495,713 549,009The overall expected rate of return on pension plan assets is calculated based on the expected long-terminvestment returns for each category of assets that forms the portfolio. The assessment of expected returns is basedon historical returns and predictions of the market for each category of assets in the portfolio in the next twelvemonths. Expected and actual rate of return on plan assets is presented in the table below:2008 2007 2006Actual Expected Actual Expected Actual ExpectedRussia 4.0% 16.0% 16.1% 17.0% 13.0% 12.0%USA -10.0% to 0% 0% to 3.0% n/a n/a n/a n/aUK -15.0% 3.6% 5.0% 5.0% 2.7% 2.7%The retirement benefit expenses recognized in the income statement are contained in the caption: ‘Cost of sales’,The movements in the plan assets are as follows:Year ended December 31,2008 2007 2006Opening balance 108,315 106,055 49,171Business combinations/(de-combinations) 117,215 (10,122) 28,566Contributions made during the year 38,637 11,534 13,424Benefits paid (28,232) (14,852) (12,356)Return on assets (Note 5) (1,045) 10,921 16,382Actuarial (loss)/gain (Note 5) (7,252) (441) 915Foreign exchange (loss)/gain (19,516) 5,220 9,953Closing balance 208,122 108,315 106,055Defined benefit obligation analysis is as follows:December 31,2008 2007 2006Wholly unfunded 497,129 258,926 284,485Partly funded 490,289 236,787 264,524Total 987,418 495,713 549,009‘General and administrative expenses’ allocated proportionally to related salary expenses, except for the interestcost, which is recognized in the caption ‘Interest expense’.27. Other non-current liabilitiesDecember 31,2008 2007 2006Decommissioning liability 246,147 108,961 128,209Provisions 139,625 66,902 67,139Amounts payable to employees 66,479 - -Lease liabilities 53,479 14,515 13,742Deferred income 31,590 29,660 29,588Derivative financial liabilities 11,183 - -Restructured tax liabilities 758 24,978 67,731Payable for acquisition of subsidiaries - - 29,428Other liabilities 42,029 79,636 23,761591,290 324,652 359,598Plan assets analysis is as follows:December 31,2008 2007 2006Equity instruments 38,161 44,448 44,450Deposits 14,946 3,037 1,980Shares in mutual funds 34,531 - -Cash 75,565 1,170 1,417Government bonds 11,557 28,548 28,850Corporate bonds 14,335 14,964 14,178Other investments 19,027 16,148 15,180Total 208,122 108,315 106,055The Group’s best estimate of contributions expected to be paid to the plan in 2009 is US$ 43.3 million.Decommissioning liabilityThe Group has environmental liabilities related to restoration of soil and other related works, which are due uponthe closures of its mines and production facilities. These costs are expected to be incurred between 2009 – 2050.The present value of expected cash outflows were estimated using existing technology, and discounted using a realdiscount rate. These rates, presented by segment, are as follows:Discount rates, %2008 2007 2006Minings egment:Russia 2.0 - 2.8 2.0 2.0Kazakhstan 1.0 n/a n/aUSA 2.4 - 6.8 n/a n/aBurkina Faso 3.8 n/a n/aNorth America 1.8 n/a n/a148149
OAO <strong>Severstal</strong> and subsidiariesOAO <strong>Severstal</strong> and subsidiariesNotes to the consolidated financial statementsfor the years ended December 31, 2008, 2007 and 2006(Amounts expressed in thousands of US dollars, except as stated otherwise)Notes to the consolidated financial statementsfor the years ended December 31, 2008, 2007 and 2006(Amounts expressed in thousands of US dollars, except as stated otherwise)The movements in the decommissioning liability are as follows:The movements in the provisions are as follows:Year ended December 31,Year ended December 31,2008 2007 2006Opening balance 108,961 128,209 102,885Change in assumptions (3,820) - 3,936Interest cost 18,162 19,062 12,875Business combinations 151,746 14,927 -Usage of decommissioning liability (4,709) - -Reclassified to assets held for sale - (63,314) -Foreign exchange difference (18,885) 10,077 8,513Closing balance 251,455 108,961 128,209December 31,2008 2007 2006Current portion 5,308 - -Non-current portion 246,147 108,961 128,209251,455 108,961 128,209ProvisionsThe current portion of provisions is included in the caption ‘Other current liabilities’. The total amount of theprovisions is presented in the table below:December 31,2008 2007 2006Environmental claims 42,910 24,459 6,052Other employee related 14,453 16,075 13,578Legal claims 38,178 27,423 21,917Social security claims 32,421 30,259 28,689Restructuring 12,664 8,284 5,569Other 68,539 4,376 3,345209,165 110,876 79,150December 31,2008 2007 2006Current portion 69,540 43,974 12,011Non-current portion 139,625 66,902 67,139209,165 110,876 79,150These provisions represent management’s best estimate of the potential losses arising in these cases, calculatedbased on available information and appropriate assumptions used. The actual outcome of those cases is currentlyuncertain and might differ from the recorded provisions.2008 2007 2006Opening balance 110,876 79,150 68,346Charge to the income statement 95,875 32,907 18,470Business combinations 37,916 781 -Usage of provisions (27,648) (5,821) (15,205)Business de-combinations - (6,321) (24)Foreign exchange difference (7,854) 10,180 7,563Closing balance 209,165 110,876 79,150Restructured tax liabilitiesOAO Vorkutaugol and OAO Mine Vorgashorskaya had significant amounts of taxes in arrears, when they wereacquired by the Group’s Majority Shareholder in June 2003.In November 2005, certain subsidiaries in the Mining segment signed restructuring agreements with the taxauthorities for the taxes in arrears. In accordance with these agreements, the principal amounts of taxes, andfines thereon and 15% of tax interest are payable by instalments over four years. If those payments are made onschedule, the remaining 85% of tax interest liability as at the date of restructuring will be forgiven. Over the pastyears the Group has been making payments in accordance with the agreed schedules and intends to completethe settlement of the restructured taxes in 2009. Restructured tax liabilities are subject to interest rate of 5% perannum, which is included in the caption “Interest expense” since the moment of restructuring.Accordingly, net gain on restructuring of tax liabilities is shown in the income statement as following:Year ended December 31,2008 2007 2006Gain on restructuring of tax liabilities - - 14,669- - 14,669Current portion of restructured tax liabilities is included in the caption ‘Other taxes and social security payable’. Thetotal amount of the restructured taxes is presented in the table below:Year ended December 31,2008 2007 2006Current portion 21,834 20,960 43,553Non-current portion 758 24,978 67,73122,592 45,938 111,28428. Share capitalThe Parent Company’s share capital consists of ordinary shares with a nominal value of RUR 0.01 each. Authorizedshare capital of <strong>Severstal</strong> at December 31, 2008, 2007 and 2006 comprised 1,007,701,355 issued and fully paidshares.The nominal amount of initial share capital was converted into US dollars using exchange rates during the Sovietperiod, when the Government contributed the original capital funds to the enterprise. These capital funds were150151
OAO <strong>Severstal</strong> and subsidiariesOAO <strong>Severstal</strong> and subsidiariesNotes to the consolidated financial statementsfor the years ended December 31, 2008, 2007 and 2006(Amounts expressed in thousands of US dollars, except as stated otherwise)Notes to the consolidated financial statementsfor the years ended December 31, 2008, 2007 and 2006(Amounts expressed in thousands of US dollars, except as stated otherwise)converted into ordinary shares on September 24, 1993 and sold by the Government at privatization auctions.Share issue 2006The Parent Company issued shares in June 2006 in consideration for the mining companies acquired from theMajority Shareholder. As discussed in note 30, certain shareholders exercised their pre-emptive rights in connectionwith the share issue for acquisition of mining companies. Total proceeds for such shares issued for cash in June2006 were US$ 162,179 thousand and comprised of US$ 5 thousand of increase in share capital and US$ 162,174thousand of increase in share premium.In November 2006, the Parent Company completed the listing of its global depositary receipts (‘GDRs’) on theLondon Stock Exchange. The Group’s Majority Shareholder placed 85,000,000 GDRs in an initial public offering(‘IPO’) at a price of US$ 12.50 per GDR (one GDR represents one share). The Parent Company was not issuing newshares and has not received any proceeds in connection with this initial public offering.short-term bank deposits, divided by shareholder’s equity. The level of dividends is also monitored by the Board ofDirectors of the Group.There were no changes in the Group’s approach to capital management during the year.DividendsThe maximum dividend payable is restricted to the total accumulated retained earnings of the Parent Companydetermined according to Russian law. As at the balance sheet date, reserves available for distribution of US$ 5,047.2million, were not yet approved by the Board of Directors (December 31, 2007: US$ 5,894.9 million; December 31,2006: US$ 4,667.6 million).On June 9, 2006, the Meeting of Shareholders approved the annual dividend of RUR 4.0 (US$ 0.15 at June 9, 2006exchange rate) per share in respect of 2005. Owners of 551.9 million shares were entitled to these dividends.However, as a part of this process, the Parent Company initiated the issue of up to 85,000,000 additional sharesin the fourth quarter of 2006. On November 14, 2006, the Board of Directors set the price for pre-emptive rightspurchases equal to the IPO price less pro rata expenses for the IPO transaction – RUR 322.81 per share (US$ 12.13at November 14, 2006 exchange rate). The Board of Directors also decided that shares for which pre-emptive rightswere not exercised would be offered through open subscription at the IPO price of RUR 332.74 per share (US$ 12.50at November 14, 2006 exchange rate).On September 25, 2006, the Meeting of Shareholders approved an interim dividend of RUR 3.6 (US$ 0.13 atSeptember 25, 2006 exchange rate) per share for the first half of 2006. Owners of 930.8 million shares were entitledto these dividends.On December 25, 2006, the Meeting of Shareholders approved an interim dividend of RUR 2.0 (US$ 0.075) per shareand GDR for the third quarter of 2006. Owners of 930.8 million shares were entitled to these dividends.The Group received RUR 24,829 million (US$ 943.0 million at December 18, 2006 exchange rate – the date ofclosing of share issue) for 76,916,692 shares placed under pre-emptive rights subscription. The Group did notreceive applications under the open subscription. Total proceeds for such shares issued for cash in December 2006comprised of US$ 29 thousand of increase in share capital and the remaining amount was recorded as an increasein share premium.On June 15, 2007 the Meeting of Shareholders approved the annual dividend of 5.0 rubles (US$ 0.2 at June 15,2007 exchange rate) per share and per GDR in respect of 2006.On June 29, 2007 the Meeting of Shareholders approved an interim dividend of 2.6 rubles (US$ 0.1 at June 29,2007 exchange rate) per share and per GDR for the first quarter of 2007.Consequently, the total value of issued share capital presented in these consolidated financial statementscomprises:On September 28, 2007 the Meeting of Shareholders approved an interim dividend of 10.0 rubles (US$ 0.4 atSeptember 28, 2007 exchange rate) per share and per GDR for the first half of 2007.Number of shares, thsd. US$’000Share capital at December 31, 2006 1,007,701 3,311,288Share capital at December 31, 2007 1,007,701 3,311,288Share capital at December 31, 2008 1,007,701 3,311,288All shares carry equal voting and distribution rights.Capital managementThe Group’s policy is to maintain a strong capital base so as to maintain investor, creditor and market confidenceand to sustain future development of the business. This policy includes compliance with certain externally imposedminimum capital requirements. The Group’s management constantly monitors profitability and leverage ratios andcompliance with the minimum capital requirements. The Group uses the return on assets ratio which is definedas profit from operations divided by total assets (averaged over the measurement period) and the leverage ratiocalculated as net debt, comprising of long-term and short-term indebtedness less cash, cash equivalents andOn December 20, 2007 the Meeting of Shareholders approved an interim dividend of 2.5 rubles (US$ 0.1 atDecember 20, 2007 exchange rate) per share and per GDR for the third quarter of 2007.On June 27, 2008 the Meeting of Shareholders approved the annual dividend of 4.0 rubles (US$ 0.2 at June 27,2008 exchange rate) per share and per GDR in respect of 2007.On June 27, 2008 the Meeting of Shareholders approved an interim dividend of 5.2 rubles (US$ 0.2 at June 27,2008 exchange rate) per share and per GDR for the first quarter of 2008.On September 30, 2008 the Meeting of Shareholders approved an interim dividend of 18.35 rubles (US$ 0.7 atSeptember 30, 2008 exchange rate) per share and per GDR for the first half of 2008.On December 26, 2008 the Meeting of Shareholders approved an interim dividend of 7.17 rubles (US$ 0.2 atDecember 26, 2008 exchange rate) per share and per GDR for the third quarter of 2008.152153
OAO <strong>Severstal</strong> and subsidiariesOAO <strong>Severstal</strong> and subsidiariesNotes to the consolidated financial statementsfor the years ended December 31, 2008, 2007 and 2006(Amounts expressed in thousands of US dollars, except as stated otherwise)Notes to the consolidated financial statementsfor the years ended December 31, 2008, 2007 and 2006(Amounts expressed in thousands of US dollars, except as stated otherwise)29. Discontinued operations and assets held for saleThe Group’s discontinued operations consisted of OAO Metallurgical Commercial Bank (presented the Group’sFinancing segment) which was disposed of in November 2007, and Lucchini companies which were classifiedas held for sale as at December 31, 2007 and December 31, 2006. The post-tax loss on the disposal of OAOMetallurgical Commercial Bank amounted to US$ 10.2 million.The results of discontinued operations and net cash flows were as follows:Year ended December 31,2008 2007 2006Revenue - 831 8,675Expenses - (2,914) (3,365)Other income - 3,821 30,212Profit before income tax - 1,738 35,522Income tax expense - (1,305) (2,673)Profit for the year - 433 32,849Net cash from operating activities - (64,446) 148,650Net cash from financing activities - - 17,779The Group’s assets held for sale as at December 31, 2007 were primarily Kuzbass coal mines, a group ofsubsidiaries, which the Group disposed of in the first half of 2008, and the Lucchini and Metalware segments’companies.The major classes of assets and liabilities of the disposal groups measured at the lower of carrying amount and fairvalue less costs to sell at December 31, 2008, 2007 and 2006 were as follows:December 31,2008 2007 2006Current assets:Cash and cash equivalents 46 6,199 5,986Short-term financial investments - 18,550 -Trade accounts receivable - 2,365 100Accounts receivable from related parties - 2,732 -Inventories 5,525 9,182 -VAT recoverable 1,406 1,808 -Income tax recoverable - 422 3Other current assets - 5,160 -Total current assets 6,977 46,418 6,089Non-current assets:Long-term financial investments - 2,540 514Investments in associates - 1 1,395Property, plant and equipment 1,895 332,632 19,375Intangible assets - 30,710 50Deferred tax assets - 24,913 11Other non-current assets - 28,127 86,082Total non-current assets 1,895 418,923 107,427Total assets 8,872 465,341 113,516Current liabilities:Trade accounts payable - 7,938 -Other taxes and social security payable 4 3,862 -Other current liabilities - 6,980 -Total current liabilities 4 18,780 -Non-current liabilities:Retirement benefit liabilities - 9,260 -Other non-current liabilities - 63,710 1,792Total non-current liabilities - 72,970 1,792Total liabilities 4 91,750 1,792154155
OAO <strong>Severstal</strong> and subsidiariesOAO <strong>Severstal</strong> and subsidiariesNotes to the consolidated financial statementsfor the years ended December 31, 2008, 2007 and 2006(Amounts expressed in thousands of US dollars, except as stated otherwise)30. Subsidiaries, associates and joint venturesThe following is a list of the Group’s significant subsidiaries, associates and joint ventures and the effectiveownership holdings therein:December 31,Company 2008 2007 2006 Location ActivityRussian Steel segment:Subsidiaries:ZAO Severgal 100.0% 100.0% 75.0% Russia Hot dip galvanizingZAO <strong>Severstal</strong> SMZ-Kolpino 100.0% 100.0% n/a Russia Steel constructionsZAO <strong>Severstal</strong> TPZ-Sheksna 100.0% 100.0% n/a Russia Steel constructionsZAO <strong>Severstal</strong> Steel Solutions 100.0% 100.0% n/a Russia Steel constructionsOOO SSM-Tyazhmash 100.0% 100.0% 100.0% Russia Repairs&constructionOAO Domnaremont 82.7% 82.7% 82.1% Russia Repairs&constructionZAO Firma Stoik 99.9% 100.0% 100.0% Russia Repairs&constructionOAO Metallurgremont n/a 79.8% 79.8% Russia Repairs&constructionOOO Energoremont 100.0% 100.0% 100.0% Russia Repairs&constructionOOO Electroremont 100.0% 93.3% 93.3% Russia Repairs&constructionVictory Industries, Inc 100.0% 100.0% 100.0% USA Repairs&constructionOOO Uralmash MO n/a n/a 100.0% Russia EngineeringOOO AviaCompany <strong>Severstal</strong> 100.0% 100.0% 100.0% Russia Air transport<strong>Severstal</strong> Export GmbH 100.0% 100.0% 100.0% Switzerland* Steel salesAS <strong>Severstal</strong>lat 50.5% 50.5% 50.5% Latvia* Steel salesLatvijas Metals 50.5% 50.5% 50.5% Latvia* Steel salesZAO SeverStalBel 100.0% 80.6% n/a Belarus* Steel sales<strong>Severstal</strong>-Ukraine LLC. 51.0% 51.0% n/a Ukraine* Steel salesArmaturu Servisa Centrs SIA 50.5% 25.2% 25.2% Latvia* Steel service centerZAO Neva-Metall Trans n/a 100.0% n/a Russia Shipping operationsZAO Neva-Metall 100.0% 100.0% n/a Russia Shipping operationsUpcroft Limited 100.0% 100.0% 100.0% Cyprus* Holding company**Varndell Limited 100.0% 100.0% 100.0% Cyprus* Holding company**ZAO Vtorchermet 85.6% 84.8% n/a Russia Processing scrapZAO Rospromresursy 100.0% 100.0% n/a Russia Processing scrapOAO Murmanskvtormet 75.1% 75.1% n/a Russia Processing scrapOAO Arhangelskii vtormet 75.0% 75.0% n/a Russia Processing scrapZAO Trade House <strong>Severstal</strong>-Invest 100.0% 100.0% 100.0% Russia Metal salesOOO North Steel Company 99.0% 99.0% 99.0% Russia LeasingOAO Rostovmetall 87.0% 87.0% 87.0% Russia LeasingZAO PPTK-1 99.0% 99.0% 99.0% Russia LeasingAssociates:Air Liquide <strong>Severstal</strong> 25.0% 25.0% 25.0% Russia Production liquid oxygenIPM segment:Subsidiaries:ZAO Izhora Pipe Mill 100.0% 100.0% 100.0% Russia Wide pipesFinancing segment:Subsidiaries:OAO Metallurgical Commercial Bank n/a n/a 72.9% Russia Banking(*) – Russian Steel segment contains Russian production entities, foreign trading companies, which are selling products primarilyproduced in Russia, and other foreign companies, which either provide services to Russian production entities or are managedfrom Russia.(**) – Upcroft is holding 29.0% of Lucchini SpA and Varndell is holding 50.8% of Lucchini SpA.Notes to the consolidated financial statementsfor the years ended December 31, 2008, 2007 and 2006(Amounts expressed in thousands of US dollars, except as stated otherwise)December 31,Company 2008 2007 2006 Location Activity<strong>Severstal</strong> North America segment:Subsidiaries:<strong>Severstal</strong> US Holdings LLC 100.0% 100.0% 100.0% USA Holding companyBarakom Limited 100.0% 100.0% 100.0% Cyprus Holding company<strong>Severstal</strong> North America Inc 100.0% 100.0% 100.0% USA Iron & steel millSevercorr LLC 91.8% 74.2% 74.2% USA Steel mill<strong>Severstal</strong> Warren Inc 100.0% n/a n/a USA Steel mill<strong>Severstal</strong> Wheeling Holding Company 100.0% n/a n/a USA Steel mill<strong>Severstal</strong> Sparrows Point LLC 100.0% n/a n/a USA Steel millMountain State Carbon LLC 100.0% 50.0% 50.0% USA Coking coalNorthern Steel Group Inc 100.0% n/a n/a USA Steel service centerAssociates:Delaco Processing LLC 49.0% 49.0% 49.0% USA Steel slittingJoint ventures:Spartan Steel Coating LLC 48.0% 48.0% 48.0% USA Hot dip galvanizingDouble Eagle Steel Coating company 50.0% 50.0% 50.0% USA Electro-galvanizingBethlehem Roll Technologies LLC 50.0% n/a n/a USA Grinding steel mill rollsOhio Coatings Company 50.0% n/a n/a USA Tin plate steelLucchini segment:Subsidiaries:Lucchini SpA 79.8% 79.8% 70.8% France Holding companyAscometal SAS 79.8% 79.8% 70.8% France Steel manufacturingAscometal GmbH 79.8% 79.8% 70.8% Germany SalesAscoforge Safe SAS n/a n/a 70.8% France ForgingsBari Fonderie Meridionali SpA 79.8% 79.8% 70.8% Italy ForgingsBi-Mec Srl n/a 79.8% 70.8% Italy MaintenanceGSI Lucchini SpA 55.3% 55.3% 49.1% Italy Steel spheresNitruvid SAS n/a n/a 70.8% France Steel finishingLucchini Asia Pacific Pte Ltd 79.8% 79.8% 70.8% Singapore SalesLucchini Holland BV 79.8% 79.8% 70.8% Netherlands Investment holdingLucchini HPS GmbH n/a n/a 23.5% Germany SalesLucchini Iberia SI 79.8% 79.8% 70.8% Spain SalesLucchini Poland Spzoo n/a n/a 70.8% Poland MachiningLucchini Servizi Srl 79.8% 79.8% 70.8% Italy DormantLucchini Sidermeccanica SpA n/a n/a 70.8% Italy Casting and machiningLucchini Siderprodukte AG 51.9% 51.9% 46.0% Switzerland SalesLucchini Sweden AB n/a n/a 70.8% Sweden MachiningLucchini UK Ltd n/a n/a 70.8% UK MachiningLuchini USA Inc 79.8% 79.8% 70.8% USA SalesServola SpA 79.8% 79.8% 70.8% Italy Asset holdingSideris Steel SAS 79.8% 79.8% 70.8% France Investment holdingSimmofos Sarl n/a 79.8% 70.8% France Asset holdingVertek Srl n/a 79.8% 70.8% Italy Steel finishingSiderco SpA n/a 79.8% n/a Italy Slag processorAssociates:ESPRA SAS 27.9% 27.9% 24.8% France Steel scrapLogistica Servola Srl 39.9% 39.9% 35.4% Italy DormantSetrans Srl n/a n/a 21.2% Italy Logistics and storageTecnologie Ambientali Pulite Srl 19.9% 19.9% 17.6% Italy Enviromental servicesGICA SA 19.9% 19.9% n/a Switzerland Carbon dioxide tradingCompanies classified as held, for sale:Relco Spzoo n/a 79.8% 70.8% Poland Land holdingCoimpex Spzoo n/a 31.9% 28.3% Poland Land holding156157
OAO <strong>Severstal</strong> and subsidiariesOAO <strong>Severstal</strong> and subsidiaries158Notes to the consolidated financial statementsfor the years ended December 31, 2008, 2007 and 2006(Amounts expressed in thousands of US dollars, except as stated otherwise)December 31,Company 2008 2007 2006 Location ActivityMining segment:Subsidiaries:OAO Karelsky Okatysh 100.0% 94.8% 90.8% Russia Iron ore pelletsOAO Olkon 100.0% 92.7% 91.8% Russia Iron ore concentrate<strong>Severstal</strong> Liberia Iron Ore Ltd 61.5% n/a n/a Liberia Iron oreOAO Vorkutaugol 94.0% 93.1% 89.2% Russia Coking coal concentrateOAO Mine Vorgashorskaya 75.0% 75.0% 73.6% Russia Coking coal concentratePBS Coals Limited 100.0% n/a n/a Canada Coking coal concentrateOAO Mine Pervomaiskaya n/a 99.4% 99.1% Russia Coking coal concentrateOAO Mine Berezovskaya n/a 97.5% 96.3% Russia Coking coal concentrateOAO SShEMK n/a 75.6% 75.6% Russia EngineeringOAO Severokuzbasskoe PTU n/a 87.3% 87.3% Russia TransportationOAO Anzhero-Sudzhenskoe PTU n/a 94.4% 94.4% Russia TransportationOOO Nerengri-Metallik 100.0% 100.0% n/a Russia Gold miningZAO Rudnik Aprelkovo 100.0% 100.0% n/a Russia Gold miningCeltic Resources Holdings Plc 100.0% 86.3% n/a Ireland Holding companyAlel JSC 100.0% 86.3% n/a Kazakhstan Gold miningZherek LLP 100.0% 86.3% n/a Kazakhstan Gold miningHigh River Gold Mines Ltd 53.8% n/a n/a Canada Holding companyOJSC Buryatzoloto 45.7% n/a n/a Russia Gold miningBerezitovy Rudnik LLC 53.3% n/a n/a Russia Gold miningSociete Des Mines de Taparko 48.4% n/a n/a Burkina Faso Gold miningTOO Semgeo 100.0% n/a n/a Kazakhstan Gold miningOOO SPB-Giproshakht 100.0% 100.0% n/a Russia EngineeringOAO Pechorugol n/a n/a 99.3% Russia Holding companyOOO Olkon-Invest n/a n/a 100.0% Russia Holding companyOOO Terra n/a n/a 100.0% Russia Holding companyOOO Holding Gornaya Company 100.0% 100.0% 100.0% Russia Holding companyLybica Holding B.V. 100.0% n/a n/a the Netherland Holding company7029740 Canada Limited 100.0% n/a n/a Canada Holding companyZAO Impulse-Consult n/a n/a 100.0% Russia Holding companyOOO Investment Company Kuzbassugol n/a n/a 100.0% Russia Holding companyMetalware segment:Subsidiaries:OAO <strong>Severstal</strong>-Metiz 100.0% 97.0% 97.0% Russia Steel machiningOAO Dneprometiz 96.8% 58.2% 58.2% Ukraine Steel machiningCarrington Wire Ltd 100.0% 97.0% 97.0% UK Steel machiningRedaelli Tecna S.p.A. 100.0% n/a n/a Italy Steel machiningOOO Volgometiz n/a n/a 100.0% Russia Steel machiningOOO Policher n/a n/a 87.3% Russia Polymer coatingsOOO UniFence 100.0% 97.0% n/a Russia Steel machiningOOO ChSPZ MKR (UniSpring) 100.0% 97.0% 48.5% Russia Mattress springsCompanies classified as held for sale:OOO “ <strong>Severstal</strong>-metiz: weldingconsumables” 100.0% n/a n/a Russia Welding consumablesIn addition, at the balance sheet date, a further 42 (December 31, 2007: 46; December 31, 2006: 26) subsidiariesand associates, which are not material to the Group, either individually or in aggregate, have been included in theseconsolidated financial statements.Information on carrying amounts of associated companies is disclosed in Note 21 of these consolidated financialstatements.Notes to the consolidated financial statementsfor the years ended December 31, 2008, 2007 and 2006(Amounts expressed in thousands of US dollars, except as stated otherwise)Acquisitions from Majority ShareholderDuring 2008, 2007 and 2006, <strong>Severstal</strong> completed acquisitions of controlling stakes in a number of companiespreviously controlled by <strong>Severstal</strong>’s Majority Shareholder. These consolidated financial statements take account ofsuch acquisitions as if they had occurred at the beginning of the earliest comparative period presented or, if later, atthe date on which control was obtained by the common controlling shareholder.In March 2006, the Meeting of Shareholders of the Parent Company approved the additional share issue to acquirecontrolling stakes in coal and iron ore mining assets controlled by its Majority Shareholder and approved anindependent appraiser.In March 2006, having received a fairness opinion on the proposed transaction from Citigroup, the Board of Directorsapproved the independent appraiser’s valuations of the Parent Company shares being issued at RUR 320.74 per share(US$ 11.24 at the exchange rate on the date of valuation - October 1, 2005) and of the mining assets being acquired atRUR 117,202 million (US$ 4,107.0 million at the exchange date on the date of valuation – October 1, 2005).In May 2006, an extraordinary shareholder meeting approved the price and other terms of the share issue foracquiring the mining assets and on June 6, 2006, the transaction was completed.Shareholders of the Parent Company, which were entitled to voting on March 27, 2006 but did not participate in it orvoted against the deal, had the right to participate in the additional share issue by purchasing for cash the amountof shares that maintained their current shareholding interest at a price of RUR 320.74 per share. The market price ofshares on March 27, 2006 was RUR 384 (US$ 13.79) per share. The Parent Company issued 13,516,489 shares to theshareholders that used these pre-emptive purchase rights.In May 2006, the Group completed the process of purchasing back controlling stakes in certain service andconstruction companies, which were disposed by the Group on December 31, 2004 to related parties. Purchase pricestotalled US$ 60.8 million, which is not significantly different from the amounts received by the Group for disposal ofthese entities on December 31, 2004.In October 2006, the Group completed the acquisition of a 50.8% stake in Lucchini SpA for Euro 550.0 million,comprising redemption of loans issued by the Group to related parties and a Euro 182.3 million (US$ 234.3 million)cash payment.In December 2006, the Group completed the acquisition of a 100.0% stake in ZAO <strong>Severstal</strong>-Resource from<strong>Severstal</strong>’s Majority Shareholder for a negligible consideration. ZAO <strong>Severstal</strong>-Resource is the management companyfor the companies of Mining segment.In July 2007, the Group acquired a 100.0% stake in each of the companies OOO Petrovtormet and OOO<strong>Severstal</strong>skrap-Komi, for a total consideration of US$ 0.02 million and US$ 0.2 million, respectively, and a 75.01% anda 75.1% stake in OAO Arhangelskii vtormet and in OAO Murmanskvtormet, for a total consideration of US$ 2.2 millionand US$ 2.9 million, respectively.In January 2008, the Group completed the acquisition of a 100.0% stake in Baracom Limited for a total considerationof US$ 84.4 million. Baracom Limited owns 79.9% of the voting stock of the holding structure which controls 74.2%of SeverCorr LLC. SeverCorr is mini-mill which produces high quality steel for motor-car, construction, pipe andengineering industries.159
OAO <strong>Severstal</strong> and subsidiariesOAO <strong>Severstal</strong> and subsidiariesNotes to the consolidated financial statementsfor the years ended December 31, 2008, 2007 and 2006(Amounts expressed in thousands of US dollars, except as stated otherwise)Notes to the consolidated financial statementsfor the years ended December 31, 2008, 2007 and 2006(Amounts expressed in thousands of US dollars, except as stated otherwise)In December 2008, the Group completed the acquisition of a 100.0% stake of a trading company, ZAO Trade House<strong>Severstal</strong> – Invest, for a total consideration of US$ 27.4 million. ZAO Trade House <strong>Severstal</strong> – Invest owns a 99.0%stake in OOO North Steel Company, a 87.0% stake in OAO Rostovmetall, and a 99.0% in ZAO PPTK-1.Acquisitions of subsidiaries from third and other related partiesAcquisitions in 2006In February 2006, the Group acquired a 57.9% stake in joint stock company Dneprometiz for US$ 34.8 million.<strong>Severstal</strong> also obtained an option to buy an additional 27.0% stake of the share capital after one year for aconsideration in the range from US$ 14.0 to US$ 20.0 million. Dneprometiz produces wire and certain othermetalware products at its production facilities located in Ukraine.During August – December 2007, the Group acquired an 86.3% stake in Celtic Resources Holdings Plc. for a totalconsideration of US$ 264.6 million. Celtic Resources Holdings is a mining company based in Dublin, Ireland. CRHowns and operates gold mines, including the Suzdal Mine (Alel JSC) and Zherek Mine (Zherek LLP) in Kazakhstan.The acquirees’ profit since the acquisition dates included in the Group’s profit for the period, is insignificant to theGroup’s profit for the period. The acquirees’ revenue and profit from the beginning of the period to the dates ofacquisition comprised US$ 62.0 million and US$ 7.0 million respectively.Acquisitions in 2008In January 2008, the Group acquired a 91.6% stake in OAO StalMag for a total consideration of US$ 17.6 million. OAOStalmag is a ferroniobium producer which production will be used by the Group’s entities.In April 2006, the Group acquired 100.0% of Carrington Wire Ltd., a UK wire and other metalware products producer,for US$ 30.5 million.Loss since the acquisition dates included in the Group’s profit for the period amounted to US$ 16.0 million. Theacquirees’ revenue and loss from the beginning of the period to the dates of acquisitions are insignificant to theGroup’s revenue and profit for the period.Acquisitions in 2007In January 2007, the Group completed the acquisition of 84.8% of the share capital of ZAO Vtorchermet and itswholly-owned subsidiaries and certain related companies for a total consideration of US$ 45.4 million. ZAOVtorchermet is a scrap processing and wholesale company, and the majority of its operations are located in SaintPetersburg.In March 2007, the Group purchased 100.0% of the share capital of Siderco SpA from the Lucchini family for 1.4million (US$ 1.8 million at the transaction date exchange rate).In May 2007, the Group completed the acquisition of a 100.0% stake in a stevedore company, ZAO Neva-Metall, forUS$ 98.7 million and 100.0% of the shipping agency ZAO Neva-Metall Trans for US$ 1.3 million from a related party.The majority of their operations are located in Saint Petersburg.In July 2007, the Group acquired a 100.0% stake in each of the companies OOO Georesurs, OOO <strong>Severstal</strong>-Vtormet,and OОO SPB-Giproshakht for a total consideration of US$ 2.1 million, US$ 24.9 million, and US$ 6.3 million,respectively.The acquiree’s profit since the acquisition date included in the Group’s profit for the period, as well as the revenueand profit from the beginning of the period to the date of acquisition are insignificant to the Group’s revenue andprofit for the period.In May 2008, the Group acquired a 100.0% stake in Sparrows Point LLC (re-named to <strong>Severstal</strong> Sparrows Point LLC)for a total consideration of US$ 818 million, subject to certain adjustments of US$ 48 million, resulting in a finalconsideration paid of US$ 770.0 million. Sparrows Point LLC is an integrated steel plant on the East Coast of USAwith its own deep water port and rail connection to the main East Coast rail networks.The acquiree’s loss from the beginning of the period to the date of acquisition is insignificant to the Group’s profitfor the period. Loss since the acquisition date included in the Group’s profit for the period amounted to US$ 130.8million. The acquiree’s revenue from the beginning of the period to the date of acquisition comprised US$ 766.1million.In July 2008, the Group acquired a 100.0% stake in WCI Steel Inc. (re-named to <strong>Severstal</strong> Warren Inc.) for a totalconsideration of US$ 443.1 million. WCI Steel Inc. operates a steel mill in Warren, Ohio, and is an integrated producerof flat-rolled steel products, including high carbon, alloy, ultra high strength, and heavy-gauge galvanized steel.The acquiree’s loss from the beginning of the period to the date of acquisition is insignificant to the Group’s profit forthe period. Loss since the acquisition date included in the Group’s profit for the period amounted to US$ 41.7 million.In addition an impairment loss of US$ 382.6 million has been recognized and was allocated to property, plant andequipment in the amount of US$ 376.0 million and to goodwill in the amount of US$ 6.6 million, as discussed in Note8. The acquiree’s revenue from the beginning of the period to the date of acquisition comprised US$ 498 million.In October 2007, the Group acquired a 100.0% stake in OOO Nerengri-Metallik and a 100.0% stake in ZAO MineAprelkovo for a total consideration of US$ 105.0 million and US$ 153.0 million, respectively. OOO Nerengri-Metallikmines gold from the Tabornoye deposit in the Sakha-Yakutiya Republic, ZAO Mine Aprelkovo mines from thePogromnoye gold deposit in the Chita Region. Both deposits are operated as open-pit mines with gold extractedutilizing heap leaching technology.The acquirees’ profits since the acquisition dates included in the Group’s profit for the period, as well as the revenueand profit of the acquired entities from the beginning of the period to the dates of acquisition, individually and in theaggregate, are insignificant to the Group’s revenue and profit for the period.In July 2008, the Group acquired a 100.0% stake in Redaelli Tecna SpA for an approximate total considerationof 35.0 million (US$ 54.8 million at the transaction date exchange rate). Redaelli Tecna SpA is a manufacturer ofhigh performance wire ropes for industrial hoisting, mining, cableways, material transportation, etc. Managementhas not yet completed the estimation of fair values of the acquired assets and liabilities and, accordingly, the initialaccounting for the acquisition was determined provisionally. Final purchase price allocation is expected to becompleted within one year starting from the date of acquisition.The acquiree’s profit since the acquisition date included in the Group’s profit for the period, as well as the revenueand profit from the beginning of the period to the date of acquisition are insignificant to the Group’s revenue andprofit for the period.160161
OAO <strong>Severstal</strong> and subsidiariesOAO <strong>Severstal</strong> and subsidiariesNotes to the consolidated financial statementsfor the years ended December 31, 2008, 2007 and 2006(Amounts expressed in thousands of US dollars, except as stated otherwise)Notes to the consolidated financial statementsfor the years ended December 31, 2008, 2007 and 2006(Amounts expressed in thousands of US dollars, except as stated otherwise)In August 2008, the Group acquired a 100.0% stake in Esmark (re-named to <strong>Severstal</strong> Wheeling Inc.) for a totalconsideration of US$ 977.8 million. Esmark is a manufacturer and distributor of flat rolled and other steel productsin the United States. The Group acquired all of Esmark’s business, including the remaining 50.0% stake in MountainState Carbon LLC previously accounted for under the equity method.The acquiree’s profit from the beginning of the period to the date of acquisition comprised US$ 29.6 million. Profitsince the acquisition date included in the Group’s profit for the period amounted to US$ 166.9 million. In additionan impairment loss of US$ 621.8 million has been recognized and was allocated to property, plant and equipmentin the amount of US$ 557.4 million and to goodwill in the amount of US$ 64.4 million, as discussed in Note 8. Theacquiree’s revenue from the beginning of the period to the date of acquisition comprised US$ 1,629.0 million.In August 2008, the Group acquired a 100.0% stake in TOO Semgeo, operating a gold mine Balazhal in EastKazakhstan for a total consideration of US$ 38.9 million. Management determined that the fair value of the netidentifiable assets and liabilities acquired was substantially the same as the book value.The acquiree’s profit since the acquisition date included in the Group’s profit for the period, as well as the revenueand profit from the beginning of the period to the date of acquisition are insignificant to the Group’s revenue andprofit for the period.In November 2008, the Group acquired a 100.0% stake in PBS Coals Ltd, a U.S. coal mining company, for a total cashconsideration of US$ 876.8 million. Management has not yet completed the estimation of fair values of the acquiredassets and liabilities and, accordingly, does not currently possess all necessary information to disclose the effect ofthis acquisition on the Group’s financial position or results of operations. Final purchase price allocation is expectedto be completed within one year starting from the date of acquisition.The acquiree’s profit from the beginning of the period to the date of acquisition comprised US$ 8.4 million. Losssince the acquisition date included in the Group’s profit for the period amounted to US$ 5.7 million. In addition animpairment loss of US$ 361.1 million has been recognized and was allocated fully to goodwill, as discussed in Note8. The acquiree’s revenue from the beginning of the period to the date of acquisition comprised US$ 184.9 million.In November 2008, the Group acquired a 53.8% stake in High River Gold Mines Ltd. for a total cash considerationof US$ 62.5 million. High River is a gold company with interests in producing mines, mines under development andadvanced exploration projects in Burkina Faso and Russia. Two producing mines, Zun-Holba and Irokinda (“OJSC“Buryatzoloto”) , are situated in the Lake Baikal region of Russia. Two new open pit gold mines, Taparko-Bouroum(Societe Des Mines de Taparko) in Burkina Faso, and Berezitovy (Berezitovy Rudnik LLC) in Russia, have beenconstructed and are currently being put into full production. Management has not yet completed the estimationof fair values of the acquired assets and liabilities and, accordingly, does not currently possess all necessaryinformation to disclose the effect of this acquisition on the Group’s financial position or results of operations. Finalpurchase price allocation is expected to be completed within one year starting from the date of acquisition.The acquiree’s loss from the beginning of the period to the date of acquisition comprised US$ 38.9 million. Losssince the acquisition date included in the Group’s profit for the period amounted to US$ 6.6 million. The acquiree’srevenue from the beginning of the period to the date of acquisition comprised US$ 177.0 million.In December 2008, the Group acquired a 61.5% stake in African Iron Ore Group Ltd (re-named to <strong>Severstal</strong> LiberiaIron Ore Ltd) for a total cash consideration of US$ 32.0 million. <strong>Severstal</strong> Liberia Iron Ore Ltd. is performinggeological survey and exploration of the iron ore deposits in Putu Range, Liberia. Management has not yet completedthe estimation of fair values of the acquired assets and liabilities and, accordingly, does not currently possessall necessary information to disclose the effect of this acquisition on the Group’s financial position or results ofoperations. Final purchase price allocation is expected to be completed within one year starting from the date ofacquisition.The acquiree’s profit since the acquisition date included in the Group’s profit for the period, as well as the revenueand profit from the beginning of the period to the date of acquisition are insignificant to the Group’s revenue andprofit for the period.A summary of assets and liabilities acquired from third and other related parties excluding acquisitions from theMajority Shareholder during 2008, 2007 and 2006 is presented below:2008 2007 2006Cash and cash equivalents 180,153 26,480 5,875Trade accounts receivable 580,490 19,772 26,463Inventories 1,399,875 64,296 18,841Deferred tax assets 17,180 11,208 -Property, plant and equipment 2,708,822 185,054 93,982Intangible assets 707,768 474,509 -Assets held for sale - 18,789 -Other current assets 146,164 76,162 7,601Other non-current assets 53,253 - -Trade accounts payable (584,405) (16,213) (33,557)Other taxes and social security payable - (5,466) (70)Deferred tax liabilities (397,127) (122,484) (10,421)Retirement benefit liability (410,532) - (10,762)Debt finance (574,030) (63,223) (8,623)Other current liabilities (286,196) (41,906) (6,387)Other non-current liabilitites (242,360) (16,715) -Net identifiable assets and liabilities acquired 3,299,055 610,263 82,942Minority interest (156,482) (45,662) (17,792)<strong>Severstal</strong>’s share of net identifiable assets and liabilitiesacquired 3,142,573 564,601 65,150Investments in Mountain State Carbon at equity (112,809) - -Fair value revaluation of investment in Mountain StateCarbon (33,020) - -Consideration:Consideration in cash (3,255,971) (669,759) (63,500)Consideration of other financial assets (17,600) (33,321) -Consideration payable 7,230 - -Positive goodwill on acquisition of subsidiaries (569,512) (150,702) -Negative goodwill on acquisition of subsidiaries 292,685 12,223 1,650Negative goodwill on minority buy-out - - 2,563Net change in cash and cash equivalents (3,068,588) (643,279) (57,625)Included in negative goodwill is US$ 197 million which is the difference between purchase price and fair marketvalue of the acquired net assets of Sparrows Point LLC. This difference arose primarily due to <strong>Severstal</strong>’s competitiveposition in negotiations based on exclusive USW’s (United Steelworkers of America) support in bidding and timerestrictions in the administered sales process.162163
OAO <strong>Severstal</strong> and subsidiariesOAO <strong>Severstal</strong> and subsidiariesNotes to the consolidated financial statementsfor the years ended December 31, 2008, 2007 and 2006(Amounts expressed in thousands of US dollars, except as stated otherwise)Notes to the consolidated financial statementsfor the years ended December 31, 2008, 2007 and 2006(Amounts expressed in thousands of US dollars, except as stated otherwise)Also included in negative goodwill is US$ 78 million which is the difference between the purchase price andprovisionally defined fair value of the acquired consolidated net assets of High River Gold Mines Ltd. This differencearose primarily due to a lack of High River`s and its prior shareholders’ ability to service its debt.Final purchase price allocationDuring the year ended December 31, 2008, management completed the purchase price allocation of ZAO Neva-Metal, ZAO Neva-Metal-Trans, OOO Nerengi-Metallik, ZAO Mine Aprelkovo and Celtic Resources Holdings Plcacquired during May – December 2007. The effect of the final purchase price allocation on these consolidatedfinancial statements is the following:In May 2007, the Group completed the acquisition of a 100.0% stake in ZAO Severgal by acquiring the remaining25.01% stake for a total consideration of US$ 20 million.In June 2007, the Group acquired a 1.9%, a 0.6%, a 3.6%, a 1.2%, and a 1.0% stake in OAO Karelsky Okatysh, OAOOlkon, OAO Vorkutaugol, OAO Mine Vorgashorskaya, and in OAO Mine Berezovskaya for a total consideration ofUS$ 23.5 million, US$ 1.9 million, US$ 29.3 million, US$ 0.6 million, and US$ 0.7 million, respectively.In January 2008, the Group completed the acquisition of a 100% stake in Celtic Resources Holdings Plc by acquiringthe remaining 13.7% stake in the company for a total consideration of US$ 44.0 million.Increase/(decrease) compared to theprovisional purchase price allocation atDecember 31, 2007 US$, thousandCash and cash equivalents 815Trade accounts receivable (262)Inventories 18,398Assets held for sale 4,145Property, plant and equipment 38,267Intangible assets 75,186Deferred tax assets 7,446Other assets (5,527)Trade accounts payable (1,237)Other taxes and social security payable (3,223)Deferred tax liabilities 122,732Other liabilities 417Retained earnings (554)Minority interest 20,333During April – August 2008, the Group acquired additional stakes in SeverCorr LLC from the former management andOAO Dneprometiz from third parties for a total consideration of US$ 56 million, increasing its ownership to 91.8%and 96.8% respectively.In August - September 2008, the Group acquired a 0.9% stake in OAO Vorkutaugol for a total consideration ofUS$ 5.3 million.In August - October 2008, the Group completed the acquisition of 100% stakes in OAO Karelsky Okatysh, OAOOlkon and in OAO <strong>Severstal</strong>-Metiz by acquiring the remaining 5.2%, 7.3% and 3.0% stakes in entities for a totalconsideration of US$ 70.6 million, US$ 32.7 million and US$ 9.7 million, respectively.Disposals of subsidiariesIn June 2007, the Group sold 100.0% (effective ownership was 79.8%) of Lucchini Sidermeccanica SpA and itswholly owned subsidiaries (Lucchini UK Ltd, Lucchini Sweden AB and Lucchini Poland Spzoo) to members of thefounding Lucchini family for a total consideration of 127.8 million (US$ 172.5 million at the transaction dateexchange rate).The comparative information at December 31, 2007, has been restated as if the accounting for the businesscombination had been completed at the acquisition date.Acquisitions of minority interestDuring 2006, the Group bought additional 3.8% of OAO <strong>Severstal</strong>-Metiz for US$ 6.3 million and participated in theadditional share issue by OAO <strong>Severstal</strong>-Metiz, increasing its ownership to 97.0% at December 31, 2006. The fairvalue of net assets of OAO <strong>Severstal</strong>-Metiz at the time of acquisition was US$ 214.3 million, resulting in recognitionof US$ 1.8 million of negative goodwill.In July 2007, the Group sold 100.0% (effective ownership was 79.8%) of Nitruvid SAS to a third party for a totalconsideration of 6.5 million (US$ 8.9 million at the transaction date exchange rate).In October 2007, the Group sold 100.0% (effective ownership was 79.8%) participation in Ascoforge Safe SAS to athird party for a total consideration of one Euro (US$ 1.3 at the transaction date exchange rate).In November 2007, the Group sold its 73.1% participation in OAO Metallurgical Commercial Bank to a companycontrolled by <strong>Severstal</strong>’s Majority Shareholder for a total consideration of US$ 43.0 million.In December 2006, the Group completed the acquisition of a 100.0% stake in <strong>Severstal</strong> North America Inc byacquiring the remaining 7.0% stake for a total consideration of US$ 54.5 million.In December 2007, the Group sold 100.0% of OOO URALMASH-Metallurgicheskoe Oborudovanie to a third party fora total consideration of US$ 14.9 million.In March 2007, the Group acquired a 2.01%, a 0.04%, and a 0.05% stake in OAO Karelsky Okatysh, OAO Olkon, andin OAO Vorkutaugol for a total consideration of US$ 35.4 million, US$ 0.1 million, and US$ 0.4 million, respectively.In May 2007, the Group acquired an additional 9.0% stake in Lucchini SpA from a Lucchini family company for a totalconsideration of 85.2 million (US$ 114.8 million at the transaction date exchange rate). After the acquisition, theGroup’s share in the capital of Lucchini SpA was 79.8%.As part of the realization of the disposal plan identified in 2003, in August, 2005 the Group sold interest in HutaLW Spzoo and its subsidiaries to Arcelor. The proceeds comprised an immediate cash payment and a deferredconsideration of 61.4 million (US$ 73.0 million at December 31, 2005 exchange rate). In August 2007, the Groupreceived a payment in the amount of US$ 83.8 million.In February 2008, the Group sold 100.0% of OOO Georesurs to a third party for a total consideration of RUR100,000 (US$ 4 thousands at the transaction date exchange rate).164165
OAO <strong>Severstal</strong> and subsidiariesOAO <strong>Severstal</strong> and subsidiariesNotes to the consolidated financial statementsfor the years ended December 31, 2008, 2007 and 2006(Amounts expressed in thousands of US dollars, except as stated otherwise)In April 2008, the Group sold its 97.9%, 99.5% and 100.0% participation in OAO Mine Berezovskaya, OAO MinePervomaiskaya and ZAO Zhernovskaya-3 respectively to ArcelorMittal for a total consideration of US$ 652 million.In June 2008, the Group sold its 100% and 40.0% participation in Relco Spzoo and Coimpex Spzoo respectively for atotal consideration of 12 million (US$ 18 million at the transaction date exchange rate).In December 2008, the Group sold its 59.4% participation in OAO Metallurgremont to a company controlled by<strong>Severstal</strong>’s Majority Shareholder for a total consideration of RUR 75.9 million (US$ 2.7 million at the transaction dateexchange rate).A summary of assets and liabilities disposed during 2008, 2007 and 2006 is presented below:2008 2007 2006Cash and cash equivalents (1,498) (235,220) -Trade accounts receivable (3,885) (151,658) -Inventories (7,725) (108,238) (476)Financial investments (551) (237,408) -Other assets (13,470) (30,537) (531)Property, plant and equipment (7,700) (158,890) (20)Intangible assets (3,621) (3,105) -Deferred tax assets - (759) -Assets held for sale (443,021) - -Trade accounts payable 4,833 205,171 -Bank customer accounts - 345,753 -Income tax payable - 9,375 -Other taxes and social security payable 945 13,369 57Deferred tax liabilities 27 9,250 -Retirement benefit liability 1,117 23,490 -Debt finance 3,150 66,108 -Liabilities held for sale 88,942 - -Other liabilities 21,635 30,743 74Net identifiable assets (360,822) (222,556) (896)Minority interest 2,042 16,315 154Sub-total (358,780) (206,241) (742)Consideration in cash 673,215 239,308 1,588Selling costs - (1,560) -Net gain on disposal 314,435 31,507 846Deferred consideration received - 83,842 -Group’s cash and cash equivalents in Metcombank - 149,608 -Net change in cash and cash equivalents 671,717 235,978 1,588Dilution of Group ownershipDuring 2005 <strong>Severstal</strong> transferred to OAO <strong>Severstal</strong>-Metiz its ownership interests in the metalware companiesOAO Cherepovets Steel Rolling Mill (“ChSPZ”) and OAO Orlovsky Steel Rolling Mill (“OSPaZ”). Effective January 1,2006, ChSPZ and OSPaZ legal entities were merged into OAO <strong>Severstal</strong>-Metiz. As a result of this merger, <strong>Severstal</strong>’sownership in OAO <strong>Severstal</strong>-Metiz reduced on January 1, 2006 from 100% to 92.8%.Notes to the consolidated financial statementsfor the years ended December 31, 2008, 2007 and 2006(Amounts expressed in thousands of US dollars, except as stated otherwise)31. Segment informationSegmental balance sheets as at December 31, 2008:AssetsCurrent assets:MiningsegmentRussianSteelsegmentLucchinisegment<strong>Severstal</strong>NorthAmericaIPMMetalwaresegmentIntersegmentbalancesConsolidatedCash and cash equivalents 151,976 1,505,928 663,171 295,380 4,484 32,803 - 2,653,742Short-term bank deposits 147 812,598 - 5,800 - - - 818,545Short-term financial investments 4,476 423,240 6,163 - - 9,735 (330,832) 112,782Trade accounts receivable 89,613 399,806 695,522 347,415 300,555 109,357 - 1,942,268Amounts receivable from relatedparties 62,978 239,530 8,286 7,041 33 2,647 (256,684) 63,831Inventories 267,813 1,050,401 893,736 1,696,077 335,889 133,646 (99,008) 4,278,554VAT recoverable 50,632 151,117 77,042 - 49,715 32,332 - 360,838Income tax recoverable 16,489 132,268 7,508 11,392 1,971 3,319 - 172,947Other current assets 45,529 105,158 19,099 82,991 16,515 10,790 - 280,082Assets held for sale - - - - - 8,872 - 8,872Total current assets 689,653 4,820,046 2,370,527 2,446,096 709,162 343,501 (686,524) 10,692,461Non-current assets:Long-term financial investments 27,041 5,263,546 10,993 - - 1,683 (5,233,281) 69,982Investment in associates andjoint ventures - 10,223 2,112 91,807 - - - 104,142Property, plant and equipment 1,520,939 3,066,402 1,597,947 3,313,302 241,691 154,992 (26,968) 9,868,305Intangible assets 1,170,505 78,333 25,744 132,830 136 46,938 - 1,454,486Restricted cash 12,734 - - 8,969 - - - 21,703Deferred tax assets 25,753 15,400 29,369 146,533 10,437 - - 227,492Other non-current assets 67 15,090 3,521 19,583 - 3,354 - 41,615Total non-current assets 2,757,039 8,448,994 1,669,686 3,713,024 252,264 206,967 (5,260,249) 11,787,725Total assets 3,446,692 13,269,040 4,040,213 6,159,120 961,426 550,468 (5,946,773) 22,480,186Liabilities and shareholders’ equityCurrent liabilities:Trade accounts payable 125,037 305,391 529,653 506,846 17,104 42,787 - 1,526,818Amounts payable to relatedparties 3,921 128,153 4,875 16,120 141,630 18,394 (241,133) 71,960Short-term debt finance 227,513 860,023 247,014 438,663 444,634 94,451 (334,785) 1,977,513Income taxes payable 12,948 8,549 24,354 - - 1,107 - 46,958Other taxes and social securitypayable 55,949 56,687 74,890 16,315 1,631 5,520 - 210,992Dividends payable 33 128,682 - - - - - 128,715Other current liabilities 91,297 237,603 141,279 293,118 17,926 24,396 - 805,619Liabilities related to assets heldfor sale - - - - - 4 - 4Total current liabilities 516,698 1,725,088 1,022,065 1,271,062 622,925 186,659 (575,918) 4,768,579Non-current liabilities:Long-term debt finance 851,968 3,730,217 1,069,548 1,452,437 142,245 60,033 (1,028,444) 6,278,004Deferred tax liabilities 337,269 112,918 75,514 - - 419 (16,793) 509,327Retirement benefit liability 50,504 113,564 132,246 473,587 - 9,395 - 779,296Other non-current liabilities 153,765 802 125,543 303,953 - 7,227 - 591,290Total non-current liabilities 1,393,506 3,957,501 1,402,851 2,229,977 142,245 77,074 (1,045,237) 8,157,917Equity 1,536,488 7,586,451 1,615,297 2,658,081 196,256 286,735 (4,325,618) 9,553,690Total equity and liabilities 3,446,692 13,269,040 4,040,213 6,159,120 961,426 550,468 (5,946,773) 22,480,186166167
OAO <strong>Severstal</strong> and subsidiariesOAO <strong>Severstal</strong> and subsidiariesNotes to the consolidated financial statementsfor the years ended December 31, 2008, 2007 and 2006(Amounts expressed in thousands of US dollars, except as stated otherwise)Notes to the consolidated financial statementsfor the years ended December 31, 2008, 2007 and 2006(Amounts expressed in thousands of US dollars, except as stated otherwise)Segmental balance sheets as at December 31, 2007: Segmental balance sheets as at December 31, 2006:168AssetsCurrent assets:MiningsegmentRussianSteelsegmentLucchinisegment<strong>Severstal</strong>NorthAmericaIPMMetalwaresegmentIntersegmentbalancesConsolidatedCash and cash equivalents 142,063 850,706 507,714 72,991 2,195 46,873 - 1,622,542Short-term bank deposits 350 665,977 - - - - - 666,327Short-term financial investments 126,403 876,567 23,127 - - 435 (811,038) 215,494Trade accounts receivable 57,383 408,649 813,534 152,925 280,862 55,685 - 1,769,038Amounts receivable from relatedparties 91,523 95,594 2,836 2,831 101 2,671 (148,363) 47,193Inventories 162,682 1,267,694 694,939 530,016 51,477 102,821 (88,995) 2,720,634VAT recoverable 36,643 179,022 32,384 - 5,565 30,508 - 284,122Income tax recoverable 17,066 39,643 12,245 12,504 - 505 - 81,963Other current assets 57,958 166,061 35,169 23,393 17,389 18,991 - 318,961Assets held for sale 440,686 448 17,718 - - 6,489 - 465,341Total current assets 1,132,757 4,550,361 2,139,666 794,660 357,589 264,978 (1,048,396) 8,191,615Non-current assets:Long-term financial investments 2,772 2,465,273 21,656 - - 738 (2,377,480) 112,959Investment in associates and jointventures - 7,530 1,278 194,179 - - - 202,987Property,plant and equipment 1,319,991 3,460,345 1,495,614 1,551,552 307,577 178,562 (24,525) 8,289,116Intangible assets 526,378 133,379 19,045 6,485 272 1,508 - 687,067Restricted cash - - - 13,810 - - - 13,810Deferred tax assets 16,048 10,194 37,943 - - - - 64,185Other non-current assets 1,008 4,225 2,948 17,710 5 13,188 - 39,084Total non-current assets 1,866,197 6,080,946 1,578,484 1,783,736 307,854 193,996 (2,402,005) 9,409,208Total assets 2,998,954 10,631,307 3,718,150 2,578,396 665,443 458,974 (3,450,401) 17,600,823Liabilities and shareholders’ equityCurrent liabilities:Trade accounts payable 52,242 213,741 610,982 302,131 7,250 25,027 - 1,211,373Amounts payable to related parties 2,788 171,979 5,766 18,395 31,884 14,302 (153,567) 91,547Short-term debt finance 707,900 576,015 328,391 16,293 70,455 34,198 (604,036) 1,129,216Income taxes payable 8,729 9,440 15,065 - 2,301 5,788 - 41,323Other taxes and social security payable57,798 44,775 87,071 1,662 3,333 4,710 - 199,349Dividends payable - 107,485 - - - - - 107,485Other current liabilities 79,440 341,265 130,020 30,379 3,000 35,636 629 620,369Liabilities related to assets held forsale 91,599 - 151 - - - - 91,750Total current liabilities 1,000,496 1,464,700 1,177,446 368,860 118,223 119,661 (756,974) 3,492,412Non-current liabilities:Long-term debt finance 391,878 945,331 650,105 843,495 414,344 6,213 (438,200) 2,813,166Deferred tax liabilities 160,629 217,244 85,194 60,843 158 4,386 (19,045) 509,409Retirement benefit liability 71,821 118,701 138,504 48,601 - 9,771 - 387,398Other non-current liabilities 140,319 1,674 79,471 103,188 - - - 324,652Total non-current liabilities 764,647 1,282,950 953,274 1,056,127 414,502 20,370 (457,245) 4,034,625Equity 1,233,811 7,883,657 1,587,430 1,153,409 132,718 318,943 (2,236,182) 10,073,786Total equity and liabilities 2,998,954 10,631,307 3,718,150 2,578,396 665,443 458,974 (3,450,401) 17,600,823AssetsCurrent assets:MiningsegmentRussianSteelsegmentLucchinisegment<strong>Severstal</strong>NorthAmericaIPMMetalwaresegmentFinancingsegmentIntersegmentbalancesConsolidatedCash and cash equivalents87,203 1,241,872 225,854 32,392 11,799 9,584 309,674 (174,983) 1,743,395Short-term bankdeposits 7 1,292,345 - - 1,019 41,092 - (187,193) 1,147,270Short-term financialinvestments 77,839 260,384 6,587 - 3,798 1,598 191,358 (235,279) 306,285Trade accounts receivable36,806 322,436 843,737 131,572 16 62,577 - - 1,397,144Amounts receivable fromrelated parties 61,927 79,870 9,601 1,184 4 7,009 - (85,976) 73,619Inventories 122,712 1,016,999 695,041 427,602 45,732 102,320 - (68,308) 2,342,098VAT recoverable 45,188 206,838 49,476 - 25,150 30,436 - - 357,088Income tax recoverable 1,787 13,553 8,404 16,361 - 294 - - 40,399Other current assets 50,701 131,620 29,320 20,082 5,273 16,091 13,138 - 266,225Total current assets 484,170 4,565,917 1,868,020 629,193 92,791 271,001 514,170 (751,739) 7,673,523Non-current assets:Long-term financialinvestments 2,682 1,677,814 31,934 78 - 42,183 25,705 (1,665,463) 114,933Investment in associatesand joint ventures - 7,155 2,656 212,154 - 865 - - 222,830Property, plant andequipment 1,286,768 3,079,224 1,519,357 627,723 292,420 177,808 475 (12,910) 6,970,865Intangible assets 35,746 7,087 17,408 - - 1,418 7 - 61,666Restricted cash - - - 57,406 - - - - 57,406Deferred tax assets - 4,285 29,926 - - - - - 34,211Other non-current assets 1,185 1 2,659 16,171 - - - - 20,016Assets held for sale - - 113,516 - - - - - 113,516Total non-current assets 1,326,381 4,775,566 1,717,456 913,532 292,420 222,274 26,187 (1,678,373) 7,595,443Total assets 1,810,551 9,341,483 3,585,476 1,542,725 385,211 493,275 540,357 (2,430,1 12) 15,268,966Liabilities and shareholders’ equityCurrent liabilities:Trade accounts payable 60,712 249,065 620,668 147,450 7,113 23,823 - - 1,108,831Amounts payable torelated parties 13,900 163,280 36,651 17,303 15,937 21,460 74,623 (82,345) 260,809Short-term debt finance 99,606 584,892 414,480 10,024 1,737 18,999 17,755 (65,528) 1,081,965Income taxes payable 6,506 28,906 8,921 474 - 15 - - 44,822Other taxes and socialsecurity payable 69,851 39,980 85,952 2,357 471 3,127 5 - 201,743Dividends payable - 23,243 - - - - - - 23,243Other current liabilities 53,911 252,017 108,472 34,393 42,263 35,320 396,362 (368,194) 554,544Total current liabilities 304,486 1,341,383 1,275,144 212,001 67,521 102,744 488,745 (516,067) 3,275,957Non-current liabilities:Long-term debt finance 242,470 1,041,145 605,827 420,546 267,099 55,423 23 (368,342) 2,264,191Deferred tax liabilities 59,789 183,977 89,662 74,805 - 7,308 1,152 (18,529) 398,164Retirement benefitliability 73,056 133,854 167,855 43,574 - 24,615 - - 442,954Other non-current liabilities199,693 29,646 81,872 48,387 - - - - 359,598Liabilities related to assetsheld for sale - - 1,792 - - - - - 1,792Total non-current labilities575,008 1,388,622 947,008 587,312 267,099 87,346 1,175 (386,871) 3,466,699Equity 931,057 6,611,478 1,363,324 743,412 50,591 303,185 50,437 (1,527,174) 8,526,310Total equity and liabilities 1,810,551 9,341,483 3,585,476 1,542,725 385,211 493,275 540,357 (2,430,112) 15,268,966169
OAO <strong>Severstal</strong> and subsidiariesOAO <strong>Severstal</strong> and subsidiariesNotes to the consolidated financial statementsfor the years ended December 31, 2008, 2007 and 2006(Amounts expressed in thousands of US dollars, except as stated otherwise)Notes to the consolidated financial statementsfor the years ended December 31, 2008, 2007 and 2006(Amounts expressed in thousands of US dollars, except as stated otherwise)Segmental income statements for the year ended December 31, 2008: Segmental income statements for the year ended December 31, 2007:SalesMining segmentRussianSteel segmentLucchinisegment<strong>Severstal</strong>NorthAmericaIPMMetalwaresegmentIntersegmenttransactionsConsolidatedSales - external 1,069,261 9,888,271 3,975,893 5,242,531 823,703 1,138,759 - 22,138,418Sales - to related parties 1,383,443 1,357,433 13,599 76,912 - 36,096 (2,613,184) 254,2992,452,704 11,245,704 3,989,492 5,319,443 823,703 1,174,855 (2,613,184) 22,392,717Cost of sales (1,371,347) (6,984,874) (3,372,444) (5,841,559) (537,666) (985,266) 2,607,126 (16,486,030)Gross profit 1,081,357 4,260,830 617,048 (522,116) 286,037 189,589 (6,058) 5,906,687General and administrativeexpenses (177,381) (434,977) (176,477) (173,810) (12,266) (59,937) 4,708 (1,030,140)Distribution expenses (180,911) (718,265) (122,044) (16,401) (41,208) (46,080) 7,133 (1,117,776)Indirect taxes and contributions(78,793) (66,254) (25,815) - (3,566) (4,401) - (178,829)Share of associates’prolit/(loss) - 3,632 (713) (6,319) - - - (3,400)Net gain/(loss) from securitiesoperations 2,607 (82,155) 3,064 - - (68) (20,201) (96,753)(Loss)/gain on disposal ofproperty, plant and equipment(8,157) (39,089) 484 (6,453) (2) 9,256 135 (43,826)Net other operating (expenses)/income(32,306) 12,163 (27,283) 870,443 (28,206) 8,843 (13,474) 790,180Profit from operations 606,416 2,935,885 268,264 145,344 200,789 97,202 (27,757) 4,226,143Impairment of non-currentassets (489,874) (34,897) (3,870) (1,004,418) - (7,204)-(1,540,263)Negative goodwill 80,221 - - 212,464 - - - 292,685Net other non-operatingincome/(expenses) 293,797 (55,063) - - (54) (4,387) 4,652 238,945Profit before financing andtaxation 490,560 2,845,925 264,394 (646,610) 200,735 85,611 (23,105) 3,217,510Interest income 16,320 203,429 25,244 6,287 94 1,944 (98,085) 155,233Interest expense (102,431) (238,410) (73,046) (122,900) (52,460) (9,554) 93,085 (505,716)Foreign exchange difference92,925 (344,788) (12,151) 5 (8,154) (6,905) - (279,068)Profit before income tax 497,374 2,466,156 204,441 (763,218) 140,215 71,096 (28,105) 2,587,959Income tax (expense)/benefit (186,233) (595,065) (72,634) 390,211 (30,415) (23,961) (2,276) (520,373)Profit from continuingoperations 311,141 1,871,091 131,807 (373,007) 109,800 47,135 (30,381) 2,067,586Profit/(loss) from discontinuedoperations - - 4,652 - - - (4,652) -Profit for the year 311,141 1,871,091 136,459 (373,007) 109,800 47,135 (35,033) 2,067,586Additional information:depreciation and amortizationexpense 231,948 414,291 162,056 225,293 26,220 25,972 - 1,085,780capital expenditures 414,643 669,41 1 337,828 693,926 8,335 31,541 (3,289) 2,152,395intersegment sales (incl. insales to related part 1,379,629 1,189,990 13,599 - - 29,966 (2,613,184) -SalesMining segmentLucchinisegment<strong>Severstal</strong>NorthAmericaIPMMetal waresegmentFinancingsegmentRussianSteel segmentIntersegmenttransactionsConsolidatedSales - external 732,620 7,683,273 3,624,913 1,805,390 550,715 955,493 - - 15,352,404Sales - to related parties 1,116,448 752,276 131,595 53 - 56,216 - (1,905,604) 150,9841,849,068 8,435,549 3,756,508 1,805,443 550,715 1,011,709 - (1,905,604) 15,503,388Cost of sales (1,182,055) (5,234,432) (3,194,377) (1,848,282) (379,824) (862,367) - 1,879,755 (10,821,582)Gross profit 667,013 3,201,117 562,131 (42,839) 170,891 149,342 - (25,849) 4,681,806General and administrativeexpenses (136,810) (318,496) (188,016) (70,808) (9,509) (46,462) - 3,211 (766,890)Distribution expenses (163,673) (590,890) (117,998) (2,152) (29,075) (44,341) - 5,596 (942,533)Indirect taxes andcontributions (64,617) (47,566) (32,188) - (4,440) (5,259) - - (154,070)Share of associates’ (loss)/profit - - (548) 5,338 - 1,450 - - 6,240Net gain from securities operations33 21,164 10,827 - - 22 - (6,482) 25,564(Loss)/gain on disposal of property,plant and equipment (12,118) (32,145) (508) (3,485) (53) 12,283 - 501 (35,525)Net other operating (expenses)/income (7,833) 9,571 (17,343) 2,556 (692) 8,857 - (2,382) (7,266)Profit from operations 281,995 2,242,755 216,357 (111,390) 127,122 75,892 - (25,405) 2,807,326Impairment of non-currentassets (3,059) (5,236) (15,895) - - (4,705) - - (28,895)Negative goodwill - - 507 - - 117 - 11,599 12,223Net other non-operating (expenses)/income(20,492) (39,394) 24,374 - (18) (2,828) - (20,318) (58,676)Profit before financing andtaxation 258,444 2,198,125 225,343 (111,390) 127,104 68,476 - (34,124) 2,731,978Interest income 14,530 182,638 21,978 4,811 45 823 - (58,186) 166,639Interest expense (69,026) (141,941) (72,793) (37,500) (27,601) (7,649) - 30,930 (325,580)Foreign exchange difference (3,089) 10,497 (535) (5) (2,850) (1,096) - 284 3,206Profit before income tax 200,859 2,249,319 173,993 (144,084) 96,698 60,554 - (61,096) 2,576,243Income tax (expense)/benefit (47,050) (558,250) (64,808) 9,470 (20,080) (22,312) - 2,877 (700,153)Profit from continuing operations 153,809 1,691,069 109,185 (134,614) 76,618 38,242 - (58,219) 1,876,090(Loss)/prolit from discontinuedoperations - - (15,660) - - - 16,093 - 433Profit for the year 153,809 1,691,069 93,525 (134,614) 76,618 38,242 16,093 (58,219) 1,876,523Additional information:depreciation and amortizationexpense 207,093 335,337 199,155 57,541 23,424 23,712 - - 846,262capital expenditures 384,281 513,335 199,267 977,948 23,335 29,965 - - 2,128,131intersegment sales (incl. insales to related part 1,098,011 647,717 131,595 - - 28,281 - (1,905,604) -170171
OAO <strong>Severstal</strong> and subsidiariesOAO <strong>Severstal</strong> and subsidiariesNotes to the consolidated financial statementsfor the years ended December 31, 2008, 2007 and 2006(Amounts expressed in thousands of US dollars, except as stated otherwise)Notes to the consolidated financial statementsfor the years ended December 31, 2008, 2007 and 2006(Amounts expressed in thousands of US dollars, except as stated otherwise)Segmental income statements for the year ended December 31, 2006:MiningsegmentRussianSteel segment<strong>Severstal</strong>NorthAmericaIPMMetalwaresegmentLucchini segmentFinancingsegmentIntersegmenttransactionsConsolidatedIn August 2008, the scrap businesses were transferred from the Mining segment to the Russian Steel segmentfollowing a change in the Group management structure. The comparative information has been presented as ifthe transfer occurred at the beginning of the earliest comparative period presented. The effect on segments’ 2007balance sheets and income statements is summarized below:SalesSales - external 520,921 6,159,993 3,182,119 1,868,442 - 780,086 - - 12,511,561Sales - to related parties 943,555 479,594 175,347 - - 58,837 - (1,446,058) 211,2751,464,476 6,639,587 3,357,466 1,868,442 - 838,923 - (1,446,058) 12,722,836Cost of sales (946,514) (4,112,651) (2,825,133) (1,712,555) (24) (723,500) - 1,446,824 (8,873,553)Gross profit 517,962 2,526,936 532,333 155,887 (24) 115,423 - 766 3,849,283General and administrativeexpenses (134,428) (240,559) (173,359) (38,330) (2,879) (44,150) - - (633,705)Distribution expenses (92,966) (492,136) (101,243) (1) - (43,560) - - (729,906)Indirect taxes and contributions(48,369) (53,117) (37,190) - (826) (2,982) - - (142,484)Share of associates’profit/(loss) - - 202 2,971 - (1,722) - - 1,451Net gain/(loss) from securitiesoperations 6,934 20,766 3,713 - (80) 314 - (3,376) 28,271(Loss)/gain on disposal ofproperty, plant and equipment (11,642) (23,379) (3,412) 469 (407) (153) - - (38,524)Net other operating (expenses)/income(492) (8,992) (13,141) 1,649 2,440 5 - (4,643) (23,174)Profit from operations 236,999 1,729,519 207,903 122,645 (1,776) 23,175 - (7,253) 2,311,212Impairment of non-currentassets (16,372) (8,306) (9,778) - - (23,364) - - (57,820)Net gain on restructuringoftaxliabilities 14,669 - - - - - - - 14,669Negative goodwill 224 (187) - - - 1,650 - 2,526 4,213Net other non-operatingexpenses (11,332) (40,958) - - - (1,261) - - (53,551)Profit before financing andtaxation 224,188 1,680,068 198,125 122,645 (1,776) 200 - (4,727) 2,218,723Interest income 11,090 99,982 11,589 11,637 67 898 _ (25,167) 110,096Interest expense (48,525) (146,529) (58,778) (15,938) - (7,306) - 21,114 (255,962)Foreign exchange difference (3,203) 37,289 1,63 8 - (1,445) (1,225) - - 33,054Profit before income tax 183,550 1,670,810 152,574 118,344 (3,154) (7,433) - (8,780) 2,105,911Income tax (expense)/benefit (81,937) (459,713) (53,790) (41,355) 87 1,440 - 174 (635,094)Profit from continuing operations101,613 1,211,097 98,784 76,989 (3,067) (5,993) - (8,606) 1,470,817Profit from discontinuedoperations - - 22,212 - - - 6,565 4,072 32,849Profit for the year 101,613 1,211,097 120,996 76,989 (3,067) (5,993) 6,565 (4,534) 1,503,666Additional information:depreciation and amortizationexpense 192,423 252,880 124,690 8,938 724 25,262 - - 604,917capital expenditures 350,863 569,212 126,687 478,540 127,413 10,144 60 20 1,662,939intersegment sales (incl. insales to related part 853,045 392,710 169,371 - - 30,932 - (1,446,058) -Increase/(decrease) compared to previously reported segment informationMining segment Russian Steel segment Intersegment balancesand transactionsCurrent assets 62,006 72,061 (134,067)Non-current assets (79,115) 79,115 -Liabilities 15,679 (149,746) 134,067Equity 1,430 (1,430) -Sales (347,797) 302,991 44,806Cost of sales 321,365 (276,660) (44,705)Profit for the year (4,343) (4,645) (8,988)No effect was recognized in respect of 2006 as the scrap business was acquired in 2007.32. Financial instrumentsThe Group’s risk management policies are established to identify and analyze the risks faced by the Group, to setappropriate risk limits and controls, and to monitor risks and adherence to limits. Risk management policies andsystems are reviewed regularly to reflect changes in market conditions and the Group’s activities.The Group’s Board of Directors oversees how management monitors compliance with the Group’s risk managementpolicies and procedures and reviews the adequacy of the risk management framework in relation to the risks facedby the Group.Exposure to credit, liquidity, interest rate and currency risk arises in the normal course of the Group’s business. TheRussian Steel, Metalware, IPM and Mining segments of the Group have not used derivative financial instrumentsto reduce exposure to fluctuations in foreign exchange rates and interest rates. The use of <strong>Severstal</strong> North Americaand Lucchini segments of derivatives to hedge their interest rates, commodity inputs and foreign exchange rateexposures were not material to these consolidated financial statements. As at December 31, 2006, the Financingsegment had no outstanding derivatives.172173
OAO <strong>Severstal</strong> and subsidiariesOAO <strong>Severstal</strong> and subsidiariesNotes to the consolidated financial statementsfor the years ended December 31, 2008, 2007 and 2006(Amounts expressed in thousands of US dollars, except as stated otherwise)Notes to the consolidated financial statementsfor the years ended December 31, 2008, 2007 and 2006(Amounts expressed in thousands of US dollars, except as stated otherwise)Management believes that the fair value of its financial assets and liabilities approximates their carrying amountsexcept for the following borrowings:The maximum exposure to credit risk for financial instruments including accounts receivable from related partieswas:December 31, 2008Market value Book value DifferenceEurobonds 2009 325,858 325,000 858Eurobonds 2013 689,584 1,250,000 (560,416)Eurobonds 2014 197,048 375,000 (177,952)Bank financing 5,570,558 5,941,200 (370,642)6,783,048 7,891,200 (1,108,152)December 31, 2007Market value Book value DifferenceEurobonds 2009 330,513 325,000 5,513Eurobonds 2014 398,781 375,000 23,781729,294 700,000 29,294December 31, 2006Market value Book value DifferenceEurobonds 2009 337,857 325,000 12,857Eurobonds 2014 407,616 375,000 32,616745,473 700,000 45,473The above amounts exclude accrued interest.The market value of the Group’s Eurobonds was determined based on London Stock Exchange quotations.Credit riskThe maximum exposure to credit risk is represented by the carrying amount of each financial asset in the balancesheet and guarantees (see note 33e). The Group has developed policies and procedures for the management ofcredit exposures, including the establishment of credit committees that actively monitors credit risk.December 31,2008 2007 2006Available-for-sale financial assets 55,206 23,266 11,134Held-to-maturity securities and deposits 829,375 729,086 1,197,421Held-for-trading securities 72,471 156,308 152,716Loans and receivables 2,158,142 1,982,931 1,691,740Restricted cash 21,703 13,810 57,406Cash and cash equivalents 2,653,742 1,622,542 1,743,3955,790,639 4,527,943 4,853,812The maximum exposure to credit risk for trade receivables including trade receivables from related parties bygeographic region was:December 31,2008 2007 2006Europe 878,778 981,178 921,789Russian Federation 601,754 520,922 264,512North America 395,736 173,021 165,700The Middle East 27,040 38,397 23,241Africa 24,178 34,343 17,814China and Central Asia 32,564 19,018 19,084Central and South America 7,879 1,604 6,678South-East Asia 3,353 13,214 4,2931,971,282 1,781,697 1,423,111The maximum exposure to credit risk for trade receivables including trade receivables from related parties by type ofcustomer was:December 31,2008 2007 2006Wholesale customers 296,016 294,720 257,923Retail customers 5,813 1,289 7,705Industrial consumers 1,633,509 1,442,890 1,134,032Other customers 35,944 42,798 23,4511,971,282 1,781,697 1,423,111The Group holds bank and other guarantees provided as collateral for financial assets. Amount of collateral helddoes not fully cover Group’s exposure to credit risk.174175
OAO <strong>Severstal</strong> and subsidiariesOAO <strong>Severstal</strong> and subsidiariesNotes to the consolidated financial statementsfor the years ended December 31, 2008, 2007 and 2006(Amounts expressed in thousands of US dollars, except as stated otherwise)Impairment lossesThe aging of trade receivables including trade receivables from related parties was:December 31,2008 2007 2006Gross Impairment Gross Impairment Gross ImpairmentNot past due 1,302,520 (2,238) 1,070,031 (2,731) 893,689 (3,128)Past due 0-30 days 376,301 (2,854) 549,362 (4,758) 377,445 (8,203)Past due 31-90 days 247,305 (36,976) 131,164 (3,507) 134,267 (5,205)Past due 91-180 days 84,930 (12,650) 34,701 (20,908) 25,476 (9,700)Past due 180-365 days 11,310 (2,275) 13,844 (1,811) 14,422 (2,033)More than one уear 50,280 (44,371) 29,565 (13,255) 13,034 (6,953)2,072,646 (101,364) 1,828,667 (46,970) 1,458,333 (35,222)The impairment allowance at December 31, 2008 included in impairment allowance in respect of trade receivablesfrom related parties for the total amount of US$ 10.8 million (December 31, 2007: US$ 9.2 million; December 31,2006: nil).At December 31, 2008 trade receivables included accounts in the amount of US$ 170.2 million (December 31, 2007:nil; December 31, 2006: nil) which terms of settlements were renegotiated during 2008. Management of the Groupbelieves that receivables will be repaid in full, thus no impairment loss was recognized as at December 31, 2008.The movement in allowance for impairment in respect of trade receivables including trade receivables from relatedparties during the years was as follows:Year ended December 31,2008 2007 2006Balance at 1 January (46,970) (35,222) (47,458)Impairment loss recognised (72,802) (15,033) (13,868)Impairment loss reversed 23,654 1,352 32,334Foreign exchange difference (5,246) 1,933 (6,230)Balance at 31 December (101,364) (46,970) (35,222)The allowance account in respect of trade receivables including trade receivables from related parties is used torecord impairment losses unless the Group is satisfied that no recovery of the amount owing is possible; at thatpoint the amount is considered irrecoverable and is written off against the financial asset directly.The allowance for doubtful debts contains primarily individually impaired trade receivables from debtors placedunder liquidation or companies which are in breach of contract terms.Notes to the consolidated financial statementsfor the years ended December 31, 2008, 2007 and 2006(Amounts expressed in thousands of US dollars, except as stated otherwise)to long-term financial investments in 2008.Liquidity riskThe Group manages liquidity risk with the objective of ensuring that funds will be available at all times to honor allcash flow obligations as they become due by preparing an annual budgets, by continuously monitoring forecast andactual cash flows and matching the maturity profiles of financial assets and liabilities.The following are the contractual maturities of financial liabilities, excluding estimated interest payments andexcluding the impact of netting agreements:December 31, 2008Carryingamount*Contractual cashflows*less than 1year1-2 years 2-5 years More than 5yearsNon-derivative financial liabilitiesDebt finance 8,143,427 (8,143,427) (1,868,843) (1,004,455) (4,385,353) (884,776)Lease liabilities 76,661 (76,661) (23,182) (12,198) (40,086) (1,195)Trade and other payables 1,811,639 (1,811,639) (1,769,610) (5,156) (34,999) (1,874)Derivative financial liabilities30,293 (30,293) (19,110) (4,473) (6,710) -10,062,020 (10,062,020) (3,680,745) (1,026,282) (4,467,148) (887,845)December 31, 2007December 31, 2006Carryingamount** The above exclude accured interestCarryingamount*Contractual cashflows*Contractual cashflows*less than 1yearless than 1year1-2 years 2-5 years More than 5yearsNon-derivative financial liabilitiesDebt finance 3,900,575 (3,900,575) (1,093,511) (815,776) (1,102,844) (888,444)Lease liabilities 24,268 (24,268) (9,753) (8,765) (4,042) (1,708)Trade and other payables 1,548,831 (1,548,831) (1,469,195) (79,636) - -5,473,674 (5,473,674) (2,572,459) (904,177) (1,106,886) (890,152)1-2 years 2-5 years More than 5yearsNon-derivative financial liabilitiesDebt finance 3,289,464 (3,289,464) (1,026,400) (285,186) (1,256,991) (720,887)Lease liabilities 16,321 (16,321) (2,579) (3,406) (8,602) (1,734)Trade and other payables 1,476,119 (1,476,119) (1,422,930) (38,697) (14,492) -Bank customer accounts 31,143 (31,143) (31,143) - - -4,813,047 (4,813,047) (2,483,052) (327,289) (1,280,085) (722,621)No impairment allowance was recognized by the Group in respect of other financial assets.Concentration of credit riskThe Group has a concentration of cash and short-term bank deposits with a related party commercial bank that atDecember 31, 2008 represented US$ 384.0 million (December 31, 2007: US$ 258.9 million, December 31, 2006: US$0.5 million) of total cash and bank deposit balance. The Group has a concentration of long-term bank deposits with arelated party non-state pension fund that at December 31, 2007 represented US$ 62.4 million (December 31, 2006:US$ 50.1 million) of total long-term financial investments. There was no significant concentration of risk in relationAt December 31, 2008, the Group has a concentration of bank financing with Deutsche Bank AG of US$ 1,201.5million and with European Bank for Reconstruction and Development of US$ 848.5 million. There was no significantconcentration of risk in relation to bank financing in 2007 and 2006.176177
OAO <strong>Severstal</strong> and subsidiariesOAO <strong>Severstal</strong> and subsidiariesNotes to the consolidated financial statementsfor the years ended December 31, 2008, 2007 and 2006(Amounts expressed in thousands of US dollars, except as stated otherwise)Notes to the consolidated financial statementsfor the years ended December 31, 2008, 2007 and 2006(Amounts expressed in thousands of US dollars, except as stated otherwise)Currency riskCurrency risk arises when a Group entity enters into transactions and balances not denominated in its functionalcurrency. The Group has assets and liabilities denominated in several foreign currencies. Foreign currency riskarises when the actual or forecasted assets in a foreign currency are either greater or less than the liabilities in thatcurrency.Sensitivity analysisA 10 percent strengthening of the following currencies against the functional currency at December 31, 2008 wouldhave increased/(decreased) profit and equity by the amounts shown below. This analysis assumes that all othervariables, in particular interest rates, remain constant and no translation difference into the presentation currency isincluded. The analysis is performed on the same basis for 2007 and 2006.The Group’s exposure to foreign currency risk was as follows based on notional amounts:December 31, 2008Euro USD GBP CHF CAD OtherAvailable-for-sale financial assets - 3,994 350 - 284 -Held-to-maturity securities and deposits 275,898 259,678 - - - 147Loans and receivables 177,151 64,066 7,005 - 4,223 8,721Cash and cash equivalents 367,549 713,667 353 16,795 895 1,075Debt finance (1,263,411) (3,635,805) - - - (19)Finance lease liabilities (1,870) (5,888) - - - -Trade and other payables (39,497) (65,297) (260) (10) (2,567) (687)Derivative financial liabilities - (11,490) - - - -Net exposure (484,180) (2,677,075) 7,448 16,785 2,835 9,237December 31, 2007Euro USD GBP CHF CAD OtherAvailable-for-sale financial assets - 530 - - - -Held-to-maturity securities and deposits 373,225 104,316 - - - -Held-for-trading securities - 210 - - - -Loans and receivables 108,018 150,063 14,265 1,326 5,192 14Cash and cash equivalents 185,692 348,020 115 734 2,045 2,680Debt finance (453,993) (1,318,029) - - - -Finance lease liabilities (1,396) (7,080) - - - -Trade and other payables (17,879) (97,717) (13,001) (4,249) (5,829) (346)Net exposure 193,667 (819,687) 1,379 (2,189) 1,408 2,348Year ended December 31,2008 2007 2006Net profitEuro (36,798) 14,331 8,561USD (203,458) (65,482) (46,160)GBP 566 (22) 1,415CHF 1,276 (166) (116)CAD 215 94 1,010Other 702 178 148A 10 percent weakening of the following currencies against the functional currency at December 31, 2008 wouldhave had the equal but opposite effect on the above currencies to the amounts shown above, on the basis that allother variables remain constant.Interest rate riskInterest rates on the Group’s debt finance are either fixed or variable, at a fixed spread over LIBOR or Euribor for theduration of each contract. Changes in interest rates impact primarily loans and borrowings by changing either theirfair value (fixed rate debt) or their future cash flows (variable rate debt). Management does not have a formal policyof determining how much of the Group’s exposure should be to fixed or variable rates. However, at the time of raisingnew loans or borrowings management uses its judgment to decide whether it believes that a fixed or variable ratewould be more favorable to the Group over the expected period until maturity.December 31, 2006Euro USD GBP CHF CAD OtherAvailable-for-sale financial assets - 70 - - - -Held-to-maturity securities and deposits 351,448 192,119 - - - -Loans and receivables 61,593 91,403 37,689 1,051 14,156 -Cash and cash equivalents 158,841 432,877 983 356 2,815 2,894Debt finance (428,811) (1,200,729) - - - -Finance lease liabilities (685) (3,161) - - - -Trade and other payables (28,126) (124,671) (17,994) (2,937) (1,891) (943)Net exposure 114,260 (612,092) 20,678 (1,530) 15,080 1,951The Group’s interest-bearing financial instruments at variable rates were:December 31,2008 2007 2006Financial assets 414,398 434,600 383,058Financial liabilities (4,915,823) (2,357,826) (1,654,697)(4,501,425) (1,923,226) (1,271,639)Other Group’s interest-bearing financial assets and liabilities are at fixed rate.178179
OAO <strong>Severstal</strong> and subsidiariesOAO <strong>Severstal</strong> and subsidiariesNotes to the consolidated financial statementsfor the years ended December 31, 2008, 2007 and 2006(Amounts expressed in thousands of US dollars, except as stated otherwise)Fair value sensitivity analysis for fixed rate instrumentsThe Group does not account for any fixed rate financial assets and liabilities at fair value through profit or loss.Therefore a change in interest rates would not affect profit or loss.Cash flow sensitivity analysis for variable rate instrumentsA change of 100 basis points in interest rates would have increased/(decreased) profit and equity by the amountsshown below. This analysis assumes that all other variables, in particular foreign currency rates, remain constant. Theanalysis is performed on the same basis for 2007 and 2006.Net profit100 bp increase 100 bp decreaseDecember 31, 2008Financial assets 3,149 (3,149)Financial liabilities (37,360) 37,360Cash flow sensitivity (net) (34,211) 34,211December 31, 2007Financial assets 2,912 (2,912)Financial liabilities (13,636) 13,636Cash flow sensitivity (net) (10,724) 10,724December 31, 2006Financial assets 2,745 (2,745)Financial liabilities (10,601) 10,601Cash flow sensitivity (net) (7,856) 7,856Notes to the consolidated financial statementsfor the years ended December 31, 2008, 2007 and 2006(Amounts expressed in thousands of US dollars, except as stated otherwise)outflow of financial sources to settle such claims, if any. Management believes that it has made adequate provisionsfor other possible tax claims.b. Long term purchase and sales contractsIn the normal course of business group companies enter into long term purchase contracts for raw materials, andlong term sales contracts. These contracts allow for periodic adjustments in prices dependent on prevailing marketconditions.c. Capital commitmentsAt the balance sheet date the Group had contractual capital commitments of US$ 1,275.3 million (December 31,2007: US$ 472.7 million; December 31, 2006: US$ 491.1 million).d. InsuranceThe Group has insured its property and equipment to compensate for expenses arising from accidents. In addition,the Group has insurance for business interruption on a basis of reimbursement of certain fixed costs. The Group hasalso insured third party liability in respect of property or environmental damage. However, the Group does not havefull insurance coverage.e. Guarantees33. Commitments and contingenciesa. For litigation, tax and other liabilitiesAt the balance sheet date the Group had US$ 42.3 million (December 31, 2007: US$ 143.2 million; December 31,2006: US$ 22.2 million) of guarantees issued.34. Subsequent eventsThe taxation system and regulatory environment of the Russian Federation are relatively new and characterized bynumerous taxes and frequently changing legislation, which is often unclear, contradictory and subject to varyinginterpretations between the differing regulatory authorities and jurisdictions, who are empowered to imposesignificant fines, penalties and interest charges. Events during the recent years suggest that the regulatoryauthorities within the Russian Federation are adopting a more assertive stance regarding the interpretation andenforcement of legislation. This situation creates substantial tax and regulatory risks. Management believes that ithas complied in all material respects with all relevant legislation.In February 2009, the Group has repaid its US$ 325 million Eurobonds – 2009. Repayment was financed by theCompany’s own sources.In February, the Group announced the temporary stoppage of operations of the steel galvanizing line at its <strong>Severstal</strong>Warren facility. Both the galvanizing line and the mill, which has been offline since October, will remain inoperativewhile the company balances production volume to match current demand.At the balance sheet date, the Russian tax authorities had made claims for taxes, fines and penalties in the amountof approximately US$ 4 million (December 31, 2007: US$ 32 million, (December 31, 2006: US$ 60 million), mostlyrelated to mineral extraction tax and water usage tax by certain of the Group’s entities in the Mining segment.Management does not agree with the tax authorities’ claims and believes that the Group has complied with existinglegislation in all material respects. Management is unable to assess the ultimate outcome of the claims and the180181
Shareholder informationand financial calendarContacts<strong>Severstal</strong>Legal address: 30 Mira St. CherepovetsVologda Region, 162600, RussiaPostal address: 2/3 K. Tsetkin StreetMoscow, 127299, RussiaTel/Fax: +7 (495) 926 7766/67www.severstal.comCorporate SecretaryOleg TsvetkovTel: +7 (8202) 53 0900Fax: +7 (8202) 53 2159E-mail: corporate_secretary@severstal.comPress serviceHead of Press ServiceOlga AntonovaTel/Fax: +7 (495) 926 7766/67E-mail: antonova@severstal.ruAuditorZAO KPMGLegal address:18, Krasnopresnenskaya Naberezhnaya,Block C, floor 31, Moscow, 123317, RussiaTel: +7 (495) 937 4477Fax: +7 (495) 937 4499RegistratorPartnerAddress: 22, Pobedy Ave., Cherepovets162606, Vologda Region, RussiaTel: +7 (8202) 53 6021Fax: +7 (8202) 55 3335Licence no.: 10-000-1-00287Date of issue: 04.04.2003 r.Expiry date: no expiry dateIssued by: FSFM of RussiaInvestor relationsHead of Investor RelationsDmitry DruzhininTel: +7 (495) 926 7766Fax: +7 (495) 150 8800E-mail: druzhinin@severstal.ru2009 IR calendarDateEvent11 March 2009 - Full year 2008 IFRS financial statements15 May 2009 - Q1 2009 IFRS financial statements15 June 2009 - 2008 Shareholders’ Annual General Meeting8 September 2009 - H1 2009 IFRS financial statements19 November 2009 - Q3 2009 IFRS financial statementsMarch 2010 - Full year 2009 IFRS financial statements182