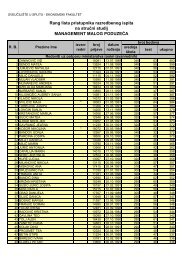
TESTING VRIN FRAMEWORK: RESOURCE VALUE AND ...
TESTING VRIN FRAMEWORK: RESOURCE VALUE AND ...
TESTING VRIN FRAMEWORK: RESOURCE VALUE AND ...
- No tags were found...

You also want an ePaper? Increase the reach of your titles
YUMPU automatically turns print PDFs into web optimized ePapers that Google loves.
Management, Vol. 17, 2012, 2, pp. 51-64A. Talaja: Testing <strong>VRIN</strong> framework: Resource value and rareness as sources of competitive…of which 46 (17.4%) companies are in the foreign and 219 (82.6%) in thedomestic ownership.According to Makadok (2001), no matter how outstanding company’scapabilities are, they do not generate economic profits if the company fails toacquire the resources which will enhance the productivity of these capabilities.Similarly, Newbert (2008) argues that even if a company possesses resourcesthat have the potential to create competitive advantage, that potential will not berealized if the company does not possess capabilities for resource exploitation.Therefore, Newbert (2008) does not examine the characteristics of individualresources and capabilities, but the characteristics of relevant groups of resourcesand capabilities of enterprises. In the operationalization of valuable resourcesand capabilities, recommendations from Makadok (2001) and Newbert (2008)are adopted, as well as previously mentioned Barney’s (1992, 1995) definitionand classification of resources and capabilities.This means that value, or contribution in neutralizing threats and exploitingopportunities that arise in a business environment of physical (VA_PH), human(VA_HU), organizational (VA_OR) intellectual (VA_IN) and financial(VA_FI) resources and capabilities is examined. In addition, rareness ofphysical (RA_PH), human (RA_HU), organizational (RA_OR), intellectual(RA_IN) and financial (RA_FI) resources and capabilities is analyzed. Both,value and rareness, were assessed on a five-point scale ranging from 1 = not atall to 5 = entirely.Competitive advantage is operationalized through manager’s perceptionsof the company's success in comparison to major competitors, according to thefollowing elements: a general advantage (or disadvantage) over competitors(CA1); sustainability of acquired advantage (CA2); the product/service qualityand image (CA3); price of products/services (CA4); the production cost ofproduct or cost of service delivery (CA5) and customer satisfaction withproduct/service (CA6), that are in accordance with the definition of competitiveadvantage given by Peteraf and Barney (2003). The scale was assessed on afive-point Likert-type scale ranging from 1 (much worse than competitors) to 5(much better than competitors).Performance is operationalized through managers’ perceptions of mainperformance categories: sales (PERF1); sales growth (PERF2); profitability(PERF3); market share (PERF4), increase in market share (PERF5) andsustainability of achieved performance (PERF6), given that the perceptualmeasures of performance correlate with objective measures (Powell, 1992).57