

System Level Modeling and Optimization of the LTE Downlink
System Level Modeling and Optimization of the LTE Downlink
System Level Modeling and Optimization of the LTE Downlink
- No tags were found...

Create successful ePaper yourself
Turn your PDF publications into a flip-book with our unique Google optimized e-Paper software.
Dissertation<strong>System</strong> <strong>Level</strong> <strong>Modeling</strong> <strong>and</strong> <strong>Optimization</strong> <strong>of</strong> <strong>the</strong><strong>LTE</strong> <strong>Downlink</strong>ausgeführt zum Zwecke der Erlangung des akademischen Gradeseines Doktors der technischen Wissenschafteneingereicht an der Technischen Universität WienFakultät für Elektrotechnik und InformationstechnikvonJosep Colom Ikunogeboren am 27. Februar 1984 in BarcelonaMatrikelnummer: 0627675Wien, im März 2012
Begutachter:Univ. Pr<strong>of</strong>. Dr.-Ing. Markus RuppInstitut <strong>of</strong> TelecommunicationsTechnische Universität WienÖsterreichUniv. Pr<strong>of</strong>. Dr.-Ing. Thomas KürnerInstitute for Communications TechnologyTechnische Universität BraunschweigDeutschl<strong>and</strong>
I hereby certify that <strong>the</strong> work reported in this <strong>the</strong>sis is my own,<strong>and</strong> <strong>the</strong> work done by o<strong>the</strong>r authors is appropriately cited.Josep Colom IkunoVienna, March 1, 2013
AbstractThis <strong>the</strong>sis presents <strong>the</strong> design <strong>and</strong> application <strong>of</strong> a Link-to-<strong>System</strong> (L2S) model capable<strong>of</strong> predicting <strong>the</strong> downlink throughput performance <strong>of</strong> cellular mobile networksbased on <strong>the</strong> 3GPP Long Term Evolution (<strong>LTE</strong>) st<strong>and</strong>ard. The aim <strong>of</strong> a L2S modelis to accurately abstract <strong>the</strong> physical layer at a fraction <strong>of</strong> <strong>the</strong> complexity <strong>of</strong> detailedlink level simulations. Thus, it dramatically reduces <strong>the</strong> necessary simulation runtime <strong>and</strong> by extension enables <strong>the</strong> simulation <strong>of</strong> much more complex scenarios.The <strong>the</strong>sis is divided in four main parts. First, <strong>the</strong> basics <strong>of</strong> <strong>the</strong> <strong>LTE</strong> st<strong>and</strong>ard arepresented, with <strong>the</strong> link abstraction model being presented afterwards. Extensionsfor <strong>the</strong> L2S model for <strong>the</strong> cases <strong>of</strong> Hybrid Automatic Repeat reQuest (HARQ) <strong>and</strong>imperfect channel state information are presented in <strong>the</strong> third section. In <strong>the</strong> lastchapter, <strong>the</strong> performance <strong>of</strong> <strong>the</strong> application <strong>of</strong> Fractional Frequency Reuse (FFR)to <strong>LTE</strong> is evaluated by means <strong>of</strong> <strong>the</strong> developed model.The presented <strong>LTE</strong> link abstraction model employs a zero-forcing receiver <strong>and</strong> isbased on <strong>the</strong> calculation <strong>of</strong> <strong>the</strong> post-equalization Signal to Interference <strong>and</strong> NoiseRatio (SINR), which for <strong>the</strong> Closed Loop Spatial Multiplexing (CLSM) MIMO transmitmode employs a high-Signal to Noise Ratio (SNR) precoder approximation.The designed model is capable <strong>of</strong> accurately predicting <strong>the</strong> throughput performance<strong>of</strong> <strong>the</strong> following <strong>LTE</strong>-defined transmit modes <strong>and</strong> antenna configurations, as validatedagainst link level simulations: Single transmit antenna with MRC combining;2×2 Transmit Diversity (TxD); 2×2, 4×2, <strong>and</strong> 4×4 Open Loop Spatial Multiplexing(OLSM); <strong>and</strong> 2×2, 4×2, <strong>and</strong> 4×4 CLSM.The results presented in this <strong>the</strong>sis have been obtained by <strong>the</strong> Matlab implementation<strong>of</strong> <strong>the</strong> L2S model, which is released including its source code as <strong>the</strong> Vienna<strong>LTE</strong> <strong>System</strong> <strong>Level</strong> Simulator. Reproducibility scripts for each <strong>of</strong> <strong>the</strong> previous workson which this <strong>the</strong>sis is based are also available for download, which enables <strong>the</strong>presented results to be independently replicated. As <strong>of</strong> March 2013, <strong>the</strong> simulatorhas already been downloaded more than 22 000 times <strong>and</strong> is being used both byuniversities <strong>and</strong> industry.i
KurzfassungDie vorliegende Arbeit präsentiert den Entwurf und die Anwendung eines Link-zu-<strong>System</strong> Modells (L2S), das es erlaubt, die Durchsatzleistung in der Abwärtsstreckevon zellularen Funknetzen basierend auf den 3GPP St<strong>and</strong>ards vorauszusagen. Zieldes L2S Modells ist es die physikalische Übertragungsebene mit geringerer Komplexitätals im Link-<strong>Level</strong> Fall genauestens zu abstrahieren, somit also die Simulationszeitendramatisch zu reduzieren. Die Arbeit ist in vier Teile gegliedert. Zunächstwerden die benötigten Grundlagen des Long Term Evolution (<strong>LTE</strong>) St<strong>and</strong>ards vorgestellt,gefolgt vom Link-Abstaktionsmodell. Erweiterungen für das L2S Modell fürHybrid Automatic Repeat reQuest (HARQ) und ungenauer Kanalinformation werdenim dritten Teil erläutert. Im letzten Kapitel wird das Leistungsvermögen beiFractional Frequency Reuse (FFR) mithilfe des vorgeschlagenen Modells ermittelt.Das vorgeschlagene Link-Abstraktionsmodell verwendet einen Zero-Forcing Empfängerund basiert auf der Berechnung des Signal zu Interferenz- und Rauschverhaltens(SINR) hinter dem Entzerrer. Im Falle von Closed Loop Spatial Multiplexing(CLSM) Multiple-Input Multiple-Output (MIMO) Vorkodierung wird ein hohesSNR angenommen. Die Anwendung des präsentierten Modells erlaubt die Simulationvon Szenarien, die wesentlich komplexer sind, als jene die durch Link-<strong>Level</strong> Modelleberechenbar sind und dies zu einem Bruchteil der Komplexität. Das entworfeneModell kann die Duchsatzleistung der folgenden <strong>LTE</strong> Übertragungsmodi und Antennenkonfigurationenexakt schätzen und wurde gegenüber einer Link-<strong>Level</strong> Smulationvalidiert: Single Transmit Antenne mit MRC Empfänger, 2×2 Transmit Diversität,2×2,4×2 und 4×4 Open Loop Spatial Multiplexing (OLSM), sowie 2×2, 4×2 und4×4 CLSM.Die Matlab Implementierung des präsentierten Modells wurde in der vorliegendenArbeit durchgängig verwendet und wurde als Vienna <strong>LTE</strong> <strong>System</strong> <strong>Level</strong> Simulatormit dem gesamten Code freigegeben, um vollständige Reproduzierbarkeit zu gewährleisten.Bis März 2013 wurde der Simulator mehr als 22 000 mal heruntergeladen undwird sowohl von Universitäten als auch Industrie verwendet.iii
AcknowledgmentsThis <strong>the</strong>sis would not have been possible, would Pr<strong>of</strong>. Markus Rupp not have givenme <strong>the</strong> chance to do a PhD at <strong>the</strong> Vienna University <strong>of</strong> Technology, <strong>and</strong> <strong>of</strong> coursewithout his continuous support. For this, I would like him to be <strong>the</strong> first one towhom I extend my gratitude.I would like to thank many for <strong>the</strong>ir direct contribution to <strong>the</strong> <strong>the</strong>sis as well as thosewho influenced me at a personal level. Those two are one, as during <strong>the</strong> course <strong>of</strong>my PhD much has changed, <strong>and</strong> this <strong>the</strong>sis reflects also this evolution.Thanks for introducing me to <strong>LTE</strong> goes to Christian Mehlfürer <strong>and</strong> Martin Wrulich,who started <strong>the</strong> <strong>LTE</strong> simulator project <strong>and</strong> with it, <strong>the</strong> so-called <strong>LTE</strong> group. Thanksto Michal Šimko, Qi Wang <strong>and</strong> Sebastian Caban, with whom I had <strong>the</strong> pleasure toshare <strong>of</strong>fice space in <strong>the</strong> MIMO lab during most <strong>of</strong> my PhD. Not only from what Ilearned from you but also for making <strong>the</strong> <strong>of</strong>fice a place I was looking forward to goevery day. Thanks also to Stefan Schwarz, Martin Taranetz, <strong>and</strong> Philipp Svoboda.I had <strong>the</strong> tremendous luck to be able to learn a lot from you. The more I learned,<strong>the</strong> better I knew that I do not know much. That enough is a reason to continuemoving forward.I would also like to thank <strong>the</strong> members <strong>of</strong> <strong>the</strong> (by some people) so-called “spanishmafia”. Specially Javier Moreno, who also very well underst<strong>and</strong>s <strong>the</strong> sometimes longdays needed during a PhD, as well as <strong>the</strong> need for some beers after <strong>the</strong>m, <strong>and</strong> als<strong>of</strong>or support during some bad times. Also, without Raúl Ramos <strong>and</strong> Thomas Herbst,my life in Vienna would not have been as enjoyable <strong>and</strong> fun as it has been.Although I left my home city <strong>of</strong> Barcelona quite some years ago, I would like tothank David Reynés, Daniel Belascoain, Joan Amell, <strong>and</strong> Davi Ariño for reaffirmingthrough <strong>the</strong>ir actions my conviction that if you are motivated, persevere, <strong>and</strong> havetalent, you will achieve your objectives in life, whichever those are.I would also want to extend my gratitude to Pr<strong>of</strong>. Thomas Kürner, from <strong>the</strong> TUBraunschweig for accepting my invitation to be my second examiner.Thank you, Katharina Meidinger, for having given me <strong>the</strong> best moments in <strong>the</strong> lasttwo years. Even when you are angry (most <strong>of</strong> <strong>the</strong> times, it was very probably mewho made you angry, though), you still put a smile in my face :)Finally, I would like to thank my parents, Hifuya Ikuno <strong>and</strong> Juan Colom, withoutwhose support over all <strong>of</strong> <strong>the</strong>se years I would not be where I am now.v
ContentsContents1 Motivation <strong>and</strong> Scope <strong>of</strong> Work 11.1 Outline . . . . . . . . . . . . . . . . . . . . . . . . . . . . . . . . . . 31.2 List <strong>of</strong> Related Publications . . . . . . . . . . . . . . . . . . . . . . . 72 3GPP Long Term Evolution 92.1 Network Architecture . . . . . . . . . . . . . . . . . . . . . . . . . . 112.2 <strong>LTE</strong> Physical Layer . . . . . . . . . . . . . . . . . . . . . . . . . . . 142.2.1 MIMO Transmission . . . . . . . . . . . . . . . . . . . . . . . 152.2.1.1 Transmit Diversity . . . . . . . . . . . . . . . . . . . 162.2.1.2 Open Loop Spatial Multiplexing . . . . . . . . . . . 162.2.1.3 Closed Loop Spatial Multiplexing . . . . . . . . . . 172.2.2 Layer-to-Codeword Mapping . . . . . . . . . . . . . . . . . . 172.2.3 Channel Coding . . . . . . . . . . . . . . . . . . . . . . . . . 182.2.4 Channel Adaptive Feedback . . . . . . . . . . . . . . . . . . . 192.2.4.1 Channel Quality Indicator Feedback . . . . . . . . . 192.2.4.2 Precoding Matrix <strong>and</strong> Rank Feedback . . . . . . . . 202.3 MAC Layer . . . . . . . . . . . . . . . . . . . . . . . . . . . . . . . . 213 Physical Layer <strong>Modeling</strong> <strong>and</strong> <strong>LTE</strong> <strong>System</strong> <strong>Level</strong> Simulation 233.1 <strong>System</strong> Model . . . . . . . . . . . . . . . . . . . . . . . . . . . . . . . 243.1.1 Link Quality Model . . . . . . . . . . . . . . . . . . . . . . . 283.1.1.1 Post-equalization SINR <strong>and</strong> Trace Generation . . . 293.1.1.2 On <strong>the</strong> <strong>Modeling</strong> <strong>of</strong> OLSM <strong>and</strong> Block Fading . . . . 313.1.1.3 Channel Trace Generation . . . . . . . . . . . . . . 323.1.1.4 Macro-scale Fading . . . . . . . . . . . . . . . . . . 343.1.1.5 Shadow Fading . . . . . . . . . . . . . . . . . . . . . 363.1.2 Link Performance Model . . . . . . . . . . . . . . . . . . . . . 38vii
Contents3.2 Link-to-<strong>System</strong> Model Validation . . . . . . . . . . . . . . . . . . . . 413.2.1 Interference-free . . . . . . . . . . . . . . . . . . . . . . . . . 433.2.1.1 Complexity Evaluation . . . . . . . . . . . . . . . . 463.2.2 Multi-cell . . . . . . . . . . . . . . . . . . . . . . . . . . . . . 473.2.3 Comparison with o<strong>the</strong>r MIMO <strong>LTE</strong> L2S Model Results . . . 494 Extensions to <strong>the</strong> L2S Model 514.1 Hybrid ARQ . . . . . . . . . . . . . . . . . . . . . . . . . . . . . . . 514.1.1 <strong>LTE</strong> HARQ . . . . . . . . . . . . . . . . . . . . . . . . . . . . 514.1.2 HARQ <strong>Modeling</strong> . . . . . . . . . . . . . . . . . . . . . . . . . 534.1.3 Application to <strong>LTE</strong> . . . . . . . . . . . . . . . . . . . . . . . 544.2 Channel Estimation Error . . . . . . . . . . . . . . . . . . . . . . . . 584.2.1 Model Accuracy . . . . . . . . . . . . . . . . . . . . . . . . . 605 Performance Evaluation <strong>of</strong> Fractional Frequency Reuse in <strong>LTE</strong> 655.1 Principles <strong>of</strong> Fractional Frequency Reuse . . . . . . . . . . . . . . . . 665.2 Previous Work . . . . . . . . . . . . . . . . . . . . . . . . . . . . . . 675.3 <strong>System</strong> Model . . . . . . . . . . . . . . . . . . . . . . . . . . . . . . . 685.4 Round Robin Simulation Results <strong>and</strong> Fairness Metric . . . . . . . . . 715.5 Proportional Fair Simulation Results . . . . . . . . . . . . . . . . . . 765.6 Side-to-side Comparison <strong>and</strong> Multi-User Gain Results . . . . . . . . 776 Summary <strong>and</strong> Outlook 816.1 Summary . . . . . . . . . . . . . . . . . . . . . . . . . . . . . . . . . 816.2 Outlook . . . . . . . . . . . . . . . . . . . . . . . . . . . . . . . . . . 83A SNR-independence <strong>of</strong> <strong>the</strong> CLSM Precoder Choice 85A.1 Simulation Results . . . . . . . . . . . . . . . . . . . . . . . . . . . . 87B Correlation Matrices for Shadow Fading Generation 91C Taylor Expansion <strong>of</strong> <strong>the</strong> ZF MSE 93D Evaluation <strong>of</strong> Multi-User Gain 97Abbreviations <strong>and</strong> Acronyms 101Bibliography 107viii
Contentsix
Contentsx
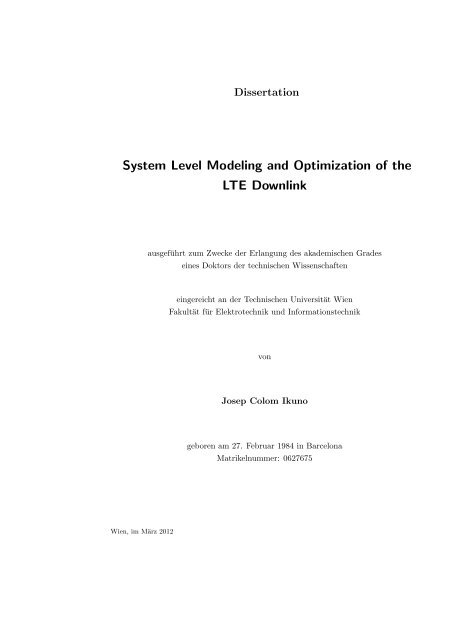
1. Motivation <strong>and</strong> Scope <strong>of</strong> Work1. Motivation <strong>and</strong> Scope <strong>of</strong> WorkInternet traffic has, since 1997, been more than doubling yearly, with an estimated1.3 exabyte 1 /month <strong>of</strong> Internet traffic as <strong>of</strong> Dec. 2012 [1]. As users increasinglyturn to mobile broadb<strong>and</strong>, wireless cellular networks have been steadily evolvingfrom being voice-traffic-driven to <strong>the</strong> actual situation, where mobile traffic representsmore than four times that <strong>of</strong> voice traffic, as seen in Figure 1.1 (left). Although notgrowing at <strong>the</strong> same pace as overall traffic, mobile traffic is expected to grow tenfoldby 2017, compared to 2012 results [2]. Comparing <strong>the</strong> growth in mobile traffic to<strong>the</strong> number <strong>of</strong> reported active sites, shown in Figure 1.1 (right) [3], it is clear thatmost <strong>of</strong> <strong>the</strong> growth has not been achieved by an increased number <strong>of</strong> sites but by acontinuous improvement <strong>of</strong> <strong>the</strong> st<strong>and</strong>ards in use.UL+DL monthly traffic (Petabytes)1,000Voice Data80060040020002007 2008 2009 2010 2011 2012Millions <strong>of</strong> Gigabytes in 6 months700600500400300200TrafficCell sites1002009 2010 2011 20121600140012001000800600400200Cell sites in service [thous<strong>and</strong>s]Figure 1.1: Left: Global total traffic in mobile networks, 2007-2012 [2]. Right: Total Wirelessdata traffic <strong>and</strong> cell site count, Used with <strong>the</strong> permission <strong>of</strong> CTIA-The WirelessAssociation® [3].1 1 exabyte = 10 18 byte1
1. Motivation <strong>and</strong> Scope <strong>of</strong> WorkAs shown in Table 1.1, wireless st<strong>and</strong>ards have been steadily evolving, improving<strong>the</strong> achievable throughput, improving latency [4], <strong>and</strong> utilizing larger spetra moreefficiently with each evolutionary step.Table 1.1.: Evolution <strong>of</strong> <strong>the</strong> maximum download throughput <strong>and</strong> latency for several 3GPPst<strong>and</strong>ards, as defined by <strong>the</strong>ir respective maximum mobile equipment capabilities(2000-2010)Year Max. DL speed Latency SpectrumUMTS 2000 0.384 Mbit/sHSDPARel’5 2002 14 Mbit/sRel’7 2007 28 Mbit/sRel’8 2009 42.2 Mbit/sRel’9 2010 84.4 Mbit/s∼70 ms∼25 ms5 MHz10 MHz<strong>LTE</strong> Rel’8 2009 300 Mbit/s 15 ms-20 ms 20 MHzWith <strong>the</strong> addition <strong>of</strong> Adaptive Modulation <strong>and</strong> Coding (AMC) <strong>and</strong> Multiple-InputMultiple-Output (MIMO) spatial multiplexing [5], <strong>the</strong> last iteration <strong>of</strong> 3GPP cellularwireless systems, named Long Term Evolution (<strong>LTE</strong>), is capable <strong>of</strong> reaching aspectral efficiency <strong>of</strong> up to 15 bit/s/Hz.This <strong>the</strong>sis is motivated by <strong>the</strong> need <strong>of</strong> modeling <strong>the</strong> performance <strong>of</strong> <strong>LTE</strong> networks,which feature a new Physical (PHY) layer based on Orthogonal Frequency-DivisionMultiplexing (OFDM) [6], as opposed to <strong>the</strong> Wideb<strong>and</strong> Code Division MultipleAccess (W-CDMA) PHY <strong>of</strong> UMTS-based systems [7].The new PHY <strong>of</strong>fers a higher number <strong>of</strong> degrees <strong>of</strong> freedom that can be exploited,which albeit <strong>of</strong>fering a more flexible system, increase <strong>the</strong> complexity <strong>of</strong> feedback<strong>and</strong> resource allocation. Scheduling is performed over time <strong>and</strong> frequency, <strong>and</strong> dynamicallyadjusts <strong>the</strong> per-user allocated physical resources according to <strong>the</strong> receivedchannel quality (CQI) <strong>and</strong> MIMO feedback (PMI <strong>and</strong> RI). All in order to fur<strong>the</strong>rincrease <strong>the</strong> spectral efficiency improvements <strong>of</strong> <strong>the</strong> PHY with a more efficientexploitation <strong>of</strong> multi-user gain.In order to evaluate <strong>the</strong> opportunities <strong>of</strong>fered by <strong>the</strong> combination <strong>of</strong> <strong>the</strong> <strong>LTE</strong> PHY<strong>and</strong> Medium Access Control (MAC) layers, complex scenarios consisting <strong>of</strong> multipleeNodeBs <strong>and</strong> users need to be simulated, which unless proper modeling <strong>of</strong> <strong>the</strong> PHYlayer is applied, is computationally very costly or very inaccurate if over-simplifiedscenarios are employed.The main objective <strong>of</strong> this <strong>the</strong>sis is to describe a link abstraction model, also alternativelyreferred to as Link-to-<strong>System</strong> (L2S) model or L2S interface, for <strong>LTE</strong> Release8, with particular focus on <strong>the</strong> MIMO capabilities <strong>of</strong> <strong>the</strong> PHY. It aims at accuratelymodeling link performance without <strong>the</strong> need to simulate all <strong>of</strong> <strong>the</strong> involved PHY2
1. Motivation <strong>and</strong> Scope <strong>of</strong> Worklayer procedures, thus significantly decreasing simulation complexity <strong>and</strong> enabling<strong>the</strong> simulation <strong>of</strong> more complex scenarios <strong>and</strong> <strong>the</strong> evaluation <strong>of</strong> Multi-User (MU)gain at <strong>the</strong> network level.The proposed model serves as basis for a Matlab-implemented <strong>LTE</strong> system levelsimulation tool [8], openly available for free for academic, non-commercial use, whichenables <strong>the</strong> reproducibility <strong>of</strong> <strong>the</strong> results in this <strong>the</strong>sis, as well as <strong>the</strong> prior work onwhich it is based upon.1.1. OutlineThe main sections <strong>of</strong> this <strong>the</strong>sis, which span Chapters 2 to 5, comprise a description<strong>of</strong> <strong>the</strong> relevant aspects <strong>of</strong> <strong>LTE</strong> necessary for L2S modeling, a description <strong>and</strong>validation <strong>of</strong> <strong>the</strong> proposed model, extensions for imperfect channel knowledge <strong>and</strong>HARQ, <strong>and</strong> finally an application <strong>of</strong> <strong>the</strong> L2S model to evaluate <strong>the</strong> performance <strong>of</strong>Fractional Frequency Reuse (FFR) jointly with scheduling in <strong>LTE</strong> networks.A short summary <strong>of</strong> each <strong>of</strong> <strong>the</strong> core sections <strong>of</strong> this <strong>the</strong>sis, as well as its relation to<strong>the</strong> publications listed in Section 1.2, can be found in <strong>the</strong> subsections below.Chapter 2: 3GPP Long Term EvolutionIn <strong>the</strong> first chapter, heavily based on <strong>the</strong> contribution in [1], a very brief overview <strong>of</strong><strong>the</strong> reasons behind <strong>the</strong> creation <strong>of</strong> <strong>the</strong> <strong>LTE</strong> st<strong>and</strong>ard is given, as well as an overview<strong>of</strong> <strong>the</strong> network structure <strong>LTE</strong> defines. The bulk <strong>of</strong> <strong>the</strong> chapter is devoted to <strong>the</strong>description <strong>of</strong> <strong>the</strong> PHY <strong>and</strong> MAC layers, with special attention to <strong>the</strong> followingtopics, relevant for L2S modeling:ˆ Structure <strong>of</strong> <strong>the</strong> OFDM-based PHY layer.ˆ Defined MIMO transmit modes, as well as <strong>the</strong> feedback required for each <strong>of</strong> <strong>the</strong>m.ˆ Channel coding <strong>and</strong> Hybrid Automatic Repeat reQuest (HARQ) procedures.ˆ Degrees <strong>of</strong> freedom at <strong>the</strong> scheduler level to exploit multi-user diversity <strong>and</strong> adaptto <strong>the</strong> channel conditions: frequency, time, AMC, as well as spatial multiplexing.Chapter 3: Physical Layer <strong>Modeling</strong> <strong>and</strong> <strong>LTE</strong> <strong>System</strong> <strong>Level</strong> SimulationIn this section, <strong>the</strong> importance <strong>of</strong> system level simulations is highlighted, as it allowsfor simulation <strong>of</strong> scenarios where ra<strong>the</strong>r than that <strong>of</strong> a single link, <strong>the</strong> performance<strong>of</strong> a complex network layout can be evaluated. It begins by, based on <strong>the</strong> Bit-Interleaved Coded Modulation (BICM) model, modeling a single <strong>LTE</strong> TX-RX linkwith <strong>the</strong> structure presented in Chapter 2. The link model is progressively developed3
1. Motivation <strong>and</strong> Scope <strong>of</strong> Workinto a combination <strong>of</strong> a link quality model <strong>and</strong> a link performance model, basedon <strong>the</strong> calculation <strong>of</strong> <strong>the</strong> post-equalization Signal to Interference <strong>and</strong> Noise Ratio(SINR) <strong>and</strong> Additive White Gaussian Noise (AWGN) Block Error Ratio (BLER)curves obtained from link level simulations.This chapter describes <strong>the</strong> functional separation <strong>of</strong> <strong>the</strong> L2S model into its two components:<strong>the</strong> link quality <strong>and</strong> <strong>the</strong> link performance model, which perform <strong>the</strong> followingfunctions:ˆ The link quality model encompasses <strong>the</strong> calculation <strong>of</strong> <strong>the</strong> post-equalization SINRbased on a Zero Forcing (ZF) receiver model on a per-subcarrier basis, thus incorporating<strong>the</strong> OFDM-based PHY <strong>and</strong> MIMO processing <strong>of</strong> <strong>LTE</strong> into its design. Itis in this stage <strong>of</strong> <strong>the</strong> modeling that a MIMO channel model <strong>and</strong> <strong>the</strong> network layoutis incorporated, <strong>the</strong> latter <strong>of</strong> which based on pathloss maps, space-correlatedshadow fading, antenna radiation patterns <strong>and</strong> <strong>the</strong> radiated transmit power.ˆ The link performance model, which takes as input <strong>the</strong> output <strong>of</strong> <strong>the</strong> link qualitymodel, compresses <strong>the</strong> subcarrier SINRs into a single value by means <strong>of</strong> MutualInformation Effective SINR Mapping (MIESM), thus quantifying <strong>the</strong> quality <strong>of</strong><strong>the</strong> OFDM frequency-selective signal with a single AWGN-equivalent SINR value.This allows for <strong>the</strong> usage <strong>of</strong> a single set <strong>of</strong> link-level-obtained performance curves,independent <strong>of</strong> <strong>the</strong> channel. The link performance model finally outputs <strong>the</strong> linkthroughput <strong>and</strong> BLER.To fur<strong>the</strong>r reduce run time complexity, part <strong>of</strong> <strong>the</strong> most computationally-intensiveprocessing necessary during system level simulations can be performed <strong>of</strong>f-line once<strong>and</strong> <strong>the</strong>n reused in subsequent simulations:ˆ Link level AWGN BLER curves for each Modulation <strong>and</strong> Coding Scheme (MCS)need be produced once <strong>and</strong> are reused at every simulation. As MIESM enables<strong>the</strong> link performance model to be fading-insensitive, <strong>the</strong> same BLER curves canemployed independently <strong>of</strong> <strong>the</strong> channel type.ˆ As MU-MIMO is not in <strong>the</strong> scope <strong>of</strong> this model, it is possible with negligible loss <strong>of</strong>precision to precalculate <strong>the</strong> optimum precoder choice (shown in Appendix A) <strong>and</strong>store it as fading parameters in a pregenerated channel trace. This <strong>of</strong>floads <strong>the</strong>computationally-intensive complex-valued matrix multiplications <strong>and</strong> inversionsrequired by <strong>the</strong> MIMO processing <strong>and</strong> SINR calculations <strong>and</strong> substitutes <strong>the</strong>mwith simple scalar products at run-time.ˆ Network layouts as well as user spatial distributions can be cached <strong>and</strong> stored,thus reducing <strong>the</strong> need to re-generate commonly-employed simulation scenarios<strong>and</strong> enabling <strong>the</strong> reproduction <strong>of</strong> specific scenarios in a reproducible manner.However well-elaborated <strong>and</strong> sophisticated, any such link abstraction models needsto be compared to link level results, as <strong>the</strong> validity <strong>of</strong> performance evaluations4
1. Motivation <strong>and</strong> Scope <strong>of</strong> Workperformed via abstraction models is only as accurate as <strong>the</strong> abstraction model itselfis. In <strong>the</strong> second part <strong>of</strong> this chapter, <strong>the</strong> results <strong>of</strong> <strong>the</strong> link abstraction modelare compared to link level simulations, both at <strong>the</strong> simplest level (single-cell, singleuser), as well as in multi-cell setups.The following scenarios are considered for <strong>the</strong> link-to-system validation:ˆ A single-cell, single-user scenario, analogous to link level simulations over aSignal to Noise Ratio (SNR) range validates whe<strong>the</strong>r (i) with <strong>the</strong> only link levelinput <strong>of</strong> AWGN BLER curves, <strong>the</strong> throughput <strong>of</strong> time-<strong>and</strong>-frequency selectivechannels can be accurately modeled, (ii) <strong>the</strong> accuracy <strong>of</strong> <strong>the</strong> MIMO precoderprecalculation, <strong>and</strong> (iii) <strong>the</strong> accuracy <strong>of</strong> <strong>the</strong> system level feedback calculation.ˆ A multi-user scenario, comparing <strong>the</strong> multi-user gain observed at link level <strong>and</strong>at system level.Additionally, a brief complexity analysis is also provided, comparing <strong>the</strong> simulationrun-time <strong>of</strong> system level simulations compared to that <strong>of</strong> link level simulations, thushighlighting <strong>the</strong> advantages <strong>of</strong> employing a L2S model for more complex simulationscenarios.Related workThis chapter represents <strong>the</strong> basis <strong>of</strong> <strong>the</strong> <strong>LTE</strong> L2S model. Published work on whichthis chapter is based include [2], where <strong>the</strong> <strong>LTE</strong> MIMO link abstraction was presented.The creation <strong>of</strong> <strong>the</strong> model would not have been possible without <strong>the</strong> priorwork on <strong>LTE</strong> link level simulation, which was presented on [3]. A first validation <strong>of</strong>link-to-system simulation results was first presented on [4], although for this <strong>the</strong>sis amore complex multi-cell scenario with different penetration losses has been additionallyconsidered. Additionally linked to this chapter are <strong>the</strong> contents <strong>of</strong> appendices A,B <strong>and</strong> D. While <strong>the</strong> contents <strong>of</strong> <strong>the</strong> multi-user gain analysis <strong>of</strong> <strong>the</strong> <strong>LTE</strong> downlink inAppendix D are contained in [5], <strong>the</strong> contents <strong>of</strong> appendices A <strong>and</strong> D are, as <strong>of</strong> <strong>the</strong>finishing date <strong>of</strong> this <strong>the</strong>sis, not contained in any peer-reviewed publication.Chapter 4: Extensions to <strong>the</strong> L2S ModelIn addition to <strong>the</strong> <strong>LTE</strong> L2S model presented in Chapter 3, this chapter presents fur<strong>the</strong>renhancements to <strong>the</strong> link quality <strong>and</strong> link performance models that enable <strong>the</strong>L2S model to take into account imperfect channel knowledge <strong>and</strong> HARQ combining.In <strong>the</strong> first part <strong>of</strong> <strong>the</strong> chapter, an extension to <strong>the</strong> link performance model isintroduced. This extended model takes into account <strong>the</strong> gain introduced by <strong>the</strong>HARQ MAC layer retransmission scheme <strong>of</strong> <strong>LTE</strong> <strong>and</strong> is based on a separation <strong>of</strong><strong>the</strong> HARQ gain into a coding gain <strong>and</strong> a repetition gain. A metric based on5
1. Motivation <strong>and</strong> Scope <strong>of</strong> WorkMutual Information (MI) is employed to quantify <strong>the</strong> amount <strong>of</strong> information inafter N retransmissions, while an effective SINR <strong>of</strong> <strong>the</strong> received combined packetis calculated <strong>and</strong> combined with link-level-generated BLER to curves to calculate<strong>the</strong> final BLER. Results are shown to be accurate for all <strong>of</strong> <strong>the</strong> retransmissionsrealistically used by <strong>the</strong> eNodeBs in an <strong>LTE</strong> deployment.In <strong>the</strong> second part <strong>of</strong> <strong>the</strong> chapter, an extension to <strong>the</strong> post-equalization SINR calculationis presented. This extension, based on a Taylor expansion <strong>of</strong> <strong>the</strong> postequalizationSINR expression for <strong>the</strong> ZF receiver, introduces channel estimationerrors in <strong>the</strong> calculation <strong>of</strong> <strong>the</strong> SINR <strong>and</strong> thus, enables <strong>the</strong> L2S model to add it tonetwork performance evaluations.Related workThe extension <strong>of</strong> <strong>the</strong> link quality model to HARQ was presented in [6], but wouldnot have been possible without <strong>the</strong> analysis <strong>of</strong> <strong>LTE</strong> rate matching procedures necessaryfor [7]. The extension <strong>of</strong> <strong>the</strong> link quality model for imperfect channel stateinformation in this chapter <strong>and</strong> Appendix C contains <strong>the</strong> work presented in [8], <strong>and</strong>employs <strong>the</strong> modeling <strong>of</strong> <strong>the</strong> channel estimation noise developed in [9].Chapter 5: Performance Evaluation <strong>of</strong> Fractional Frequency Reuse in <strong>LTE</strong>In <strong>the</strong> last chapter, system level simulations are employed to evaluate <strong>the</strong> performance<strong>of</strong> FFR applied to <strong>LTE</strong> networks. The application <strong>of</strong> <strong>the</strong> developed L2S modelenables FFR performance to be evaluated in terms <strong>of</strong> throughput, as opposite to <strong>the</strong>capacity-based metrics commonly employed in literature. The considered scenariois that <strong>of</strong> a fully-loaded hexagonal cell setup <strong>and</strong> a 4×4 Closed Loop Spatial Multiplexing(CLSM) transmission, combined with round robin <strong>and</strong> proportional fairscheduling.Initial results showed that <strong>the</strong> usual mean/peak/edge throughput performance metricsto be insufficient, thus a new metric additionally taking fairness into considerationis also introduced.After <strong>the</strong> introduction <strong>of</strong> a fairness measure, it is shown that, if a suboptimal schedulersuch as round robin is employed, throughput <strong>and</strong> fairness gains can be extractedby means <strong>of</strong> FFR. However, such gains are shown to disappear if proportional fairscheduling is employed.Related workThis performance evaluation <strong>of</strong> FFR applied to <strong>LTE</strong> is based on <strong>the</strong> previous workpresented on [10], in which <strong>the</strong> potential <strong>of</strong> FFR for throughput increase was shown.6
BibliographyThe combined throughput-<strong>and</strong>-fairness metric, as well as <strong>the</strong> subsequent simulationbasedanalysis is performed, are contained in [11], where <strong>the</strong> <strong>LTE</strong> L2S model isapplied to <strong>the</strong> performance evaluation <strong>of</strong> FFR.1.2. List <strong>of</strong> Related Publications[1] J. C. Ikuno, UMTS Long-Term Evolution. in Evaluation <strong>of</strong> HSDPA <strong>and</strong> <strong>LTE</strong>: FromTestbed Measurements to <strong>System</strong> <strong>Level</strong> Performance, S. Caban, C. Mehlführer, M.Rupp, <strong>and</strong> M. Wrulich, Eds. John Wiley & Sons, Ltd, 2012.[2] J. C. Ikuno, M. Wrulich, <strong>and</strong> M. Rupp, “<strong>System</strong> level simulation <strong>of</strong> <strong>LTE</strong> networks,” in71st Vehicular Technology Conference (VTC2010-Spring), Taipei, Taiwan, May 2010.[3] C. Mehlführer, M. Wrulich, J. C. Ikuno, D. Bosanska, <strong>and</strong> M. Rupp, “Simulating<strong>the</strong> Long Term Evolution physical layer,” in European Signal Processing Conference(EUSIPCO2009), Glasgow, Scotl<strong>and</strong>, Aug. 2009.[4] C. Mehlführer, J. C. Ikuno, M. Šimko, S. Schwarz, M. Wrulich, <strong>and</strong> M. Rupp, “The Vienna<strong>LTE</strong> simulators - enabling reproducibility in wireless communications research,”EURASIP Journal on Advances in Signal Processing, 2011.[5] S. Schwarz, J. Colom Ikuno, M. Šimko, M. Taranetz, Q. Wang, <strong>and</strong> M. Rupp, “Pushing<strong>the</strong> Limits <strong>of</strong> <strong>LTE</strong>: A Survey on Research Enhancing <strong>the</strong> St<strong>and</strong>ard,” arXiv e-prints,Dec. 2012.[6] J. C. Ikuno, C. Mehlführer, <strong>and</strong> M.Rupp, “A novel LEP model for OFDM systemswith HARQ,” in IEEE International Conference on Communications (ICC2011), Kyoto,Japan, June 2011.[7] J. C. Ikuno, S. Schwarz, <strong>and</strong> M. Šimko, “<strong>LTE</strong> rate matching performance with codeblock balancing,” in 17th European Wireless Conference (EW2011), Vienna, Austria,Apr. 2011.[8] J. C. Ikuno, S. Pendl, M. Simko, <strong>and</strong> M. Rupp, “Accurate SINR estimation modelfor system level simulation <strong>of</strong> <strong>LTE</strong> networks,” in IEEE International conference onCommunications 2011 (ICC2012), Ottawa, Canada, June 2012.[9] M. Šimko, S. Pendl, S. Schwarz, Q. Wang, J. C. Ikuno, <strong>and</strong> M. Rupp, “Optimal pilotsymbol power allocation in <strong>LTE</strong>,” in IEEE 74th Vehicular Technology Conference(VTC2011-Fall), San Francisco, California, Sept. 2011.[10] M. Taranetz <strong>and</strong> J. C. Ikuno, “Capacity density optimization by fractional frequencypartitioning,” in 45th Annual Asilomar Conference on Signals, <strong>System</strong>s, <strong>and</strong> Computers(ASILOMAR2011), Pacific Grove, California, Nov. 2011.[11] J. C. Ikuno, M. Taranetz, <strong>and</strong> M. Rupp, “A fairness-based performance evaluation<strong>of</strong> fractional frequency reuse in <strong>LTE</strong>,” in 17th International ITG Workshop on SmartAntennas (WSA2013), Stuttgart, Germany, Mar. 2013.7
Bibliography8
2. 3GPP Long Term Evolution2. 3GPP Long Term EvolutionIn its Release 8, Long Term Evolution (<strong>LTE</strong>) was st<strong>and</strong>ardized by <strong>the</strong> 3rd GenerationPartnership Project (3GPP) as <strong>the</strong> successor <strong>of</strong> <strong>the</strong> Universal Mobile Telecommunications<strong>System</strong> (UMTS) st<strong>and</strong>ard. <strong>LTE</strong> was designed from <strong>the</strong> start with<strong>the</strong> assumption that all <strong>of</strong> <strong>the</strong> services would be packet-switched ra<strong>the</strong>r than circuitswitched, thus continuing <strong>the</strong> trend set from <strong>the</strong> evolution <strong>of</strong> Global <strong>System</strong>for Mobile communications (GSM), to General Packet Radio Service (GPRS), EnhancedData Rates for GSM Evolution (EDGE), UMTS, <strong>and</strong> High-Speed PacketAccess (HSPA). During this evolution, it has been seen how <strong>the</strong> focus has beenmoving towards providing ubiquitous availability <strong>of</strong> broadb<strong>and</strong> communications, aswell as <strong>the</strong> classical voice/text communication capabilities. From <strong>the</strong> early mobilepacket services, not only has throughput been dramatically increased, but also latencygreatly decreased [4, 9, 10]. Early 2G-based systems such as GPRS were ableto <strong>of</strong>fer data transfer rates in <strong>the</strong> order <strong>of</strong> 10 kbit/s, while in its latest current iteration,HSPA can <strong>the</strong>oretically reach peak speeds <strong>of</strong> 80 Mbit/s by combining multiple5 MHz carriers <strong>and</strong> Multiple-Input Multiple-Output (MIMO) techniques [11–13].The combination <strong>of</strong> higher throughput requirements, lower latency, as well as affordability,given <strong>the</strong> needed non-linear evolution between traffic volume <strong>and</strong> cost [14],contributed to <strong>the</strong> requirements specified for <strong>LTE</strong> by 3GPP, which are summarizedin <strong>the</strong> following points [15–17]:ˆ Increased peak data rates <strong>of</strong> 100 Mbit/s in <strong>the</strong> <strong>Downlink</strong> (DL) <strong>and</strong> 50 Mbit/s in<strong>the</strong> Uplink (UL), as well as improvements in cell edge <strong>and</strong> spectrum efficiency.ˆ Scalable b<strong>and</strong>widthˆ Easy interworking with existing 3GPP systems <strong>and</strong> cost-effective migration to<strong>LTE</strong>, resulting in a reduced CAPital EXpenditure (CAPEX).ˆ Simplified network architecture allowing for a lower OPerational EXpenditure9
2. 3GPP Long Term EvolutionTable 2.1.: 3GPP requirements for E-UTRAN [15].Requirementspeak data rate 100 Mbit/sDL UE throughput 5% point <strong>of</strong> cdf 3x-4x Rel’6 HSDPAavg. throughput 3x-4x Rel’6 HSDPAspectral efficiency3x-4x Rel’6 HSDPApeak data rate 50 Mbit/sUL UE throughput 5% point <strong>of</strong> cdf 2x-3x Rel’6 HSDPAavg. throughput 2x-3x Rel’6 HSDPAspectral efficiencyspectrum allocation2x-3x Rel’6 HSDPAConfigurations2 TX×2 RXantennas,20 MHz DL1 TX×2 RXantennas,20 MHz UL1.4, 3, 5, 10, 15, 20 MHz possible(OPEX) <strong>and</strong> support for high user mobility.Table 2.1 lists <strong>the</strong> 3GPP requirements for <strong>the</strong> <strong>LTE</strong> Radio Access Network (RAN),termed Evolved UMTS Terrestrial Radio Access Network (E-UTRAN). The finalcapabilities <strong>of</strong> <strong>LTE</strong>, however go beyond those <strong>of</strong> <strong>the</strong> defined target requirements. Forinstance, although, <strong>the</strong> targets for DL <strong>and</strong> UL peak data rate were set to 100 Mbit/s<strong>and</strong> 50 Mbit/s respectively [18], <strong>LTE</strong> users, termed User Equipments (UEs), supportup to 300 Mbit/s DL <strong>and</strong> 75 Mbit/s UL peak data rates.Diverging from <strong>the</strong> previous UMTS st<strong>and</strong>ard, which is based on Wideb<strong>and</strong> CodeDivision Multiple Access (W-CDMA), <strong>the</strong> <strong>LTE</strong> PHY is based on OrthogonalFrequency-Division Multiple Access (OFDMA) [19] in <strong>the</strong> DL, <strong>and</strong> Single-carrierFDMA (SC-FDMA) [20] in <strong>the</strong> UL [21–24], which both convert <strong>the</strong> wide-b<strong>and</strong> frequencyselective channel into a set <strong>of</strong> flat fading subchannels by means <strong>of</strong> a CyclicPrefix (CP) [25]. The flat fading subchannels have <strong>the</strong> advantage that even in <strong>the</strong>case <strong>of</strong> MIMO transmission, optimum receivers can be implemented with reasonablecomplexity, as opposed to W-CDMA systems, where time-domain equalization isneeded [26]. OFDMA additionally allows for frequency domain scheduling, makingit possible to assign PHY resources to users with optimum channel conditions. This<strong>of</strong>fers large potential throughput gains in <strong>the</strong> DL due to multi-user diversity [27, 28].<strong>LTE</strong> also includes an interface for communication between base stations (eNodeBsin <strong>LTE</strong> nomenclature), named X2-interface, which can be used for interference management<strong>and</strong> eNodeB coordination, aiming at decreasing inter-cell interference.Regardless <strong>of</strong> <strong>the</strong> network capabilities, <strong>the</strong> system is never<strong>the</strong>less constrained by <strong>the</strong>actual capabilities <strong>of</strong> <strong>the</strong> receiver mobile equipment. That is, <strong>the</strong> UE capabilities.<strong>LTE</strong> defines five UE radio capability categories, to which a given UE has to conformto [29]. These range from a UE not capable <strong>of</strong> MIMO transmission with a maximumthroughput <strong>of</strong> 10 Mbit/s DL <strong>and</strong> 5 Mbit/s UL to a 4×4-capable MIMO terminal with10
2. 3GPP Long Term Evolutionup to 300 Mbit/s DL <strong>and</strong> 70 Mbit/s UL. Table 2.2 details <strong>the</strong> maximum throughputfor both DL <strong>and</strong> UL, as well as <strong>the</strong>ir MIMO Spatial Multiplexing (SM) capabilities.Table 2.2.: <strong>LTE</strong> UE categories [29]. Each UE category constrains <strong>the</strong> maximum throughput<strong>and</strong> SM capabilities supported in DL <strong>and</strong> UL.UE CategoryDLUL1 2 3 4 5peak throughput [Mbit/s] 10.3 51 102 150.8 302.8max. number <strong>of</strong> supported layers for SM 1 2 2 2 4max. number <strong>of</strong> supported streams for SM 1 2 2 2 2peak throughput [Mbit/s] 5.2 25.5 51 51 75.4support for 64-QAM No No No No Yes2.1. Network ArchitectureThe basic network architecture <strong>of</strong> <strong>LTE</strong> remains comprised <strong>of</strong> three parts: (i) <strong>the</strong>mobile terminal, termed UE, which is connected, <strong>the</strong> (ii) E-UTRAN radio accessnetwork, <strong>and</strong> (iii) <strong>the</strong> core network, termed <strong>System</strong> Architecture Evolution (SAE),<strong>the</strong> main component <strong>of</strong> which is <strong>the</strong> Evolved Packet Core (EPC). Figure 2.1 depictsboth <strong>the</strong> elements comprising each <strong>of</strong> <strong>the</strong> parts from <strong>the</strong> network <strong>and</strong> its interconnectionto 2G/3G network elements.In <strong>the</strong> now-all-IP SAE architecture <strong>the</strong> core network provides access to externalpacket networks based on IP <strong>and</strong> performs a number <strong>of</strong> functions for idle <strong>and</strong> activeterminals. Connected to <strong>the</strong> core network, <strong>the</strong> RAN performs all radio interfacerelatedfunctions for terminals in active mode [30].In contrast to prior architectures, <strong>the</strong> <strong>LTE</strong> RAN is a meshed network where <strong>the</strong> functionspreviously fulfilled by <strong>the</strong> Radio Network Controller (RNC) in UMTS <strong>and</strong>/or<strong>the</strong> Base Station Controller (BSC) in GSM are integrated into <strong>the</strong> eNodeB. In orderto enable a meshed RAN topology, <strong>the</strong> eNodeBs are now not only hierarchically connectedto <strong>the</strong> core network but are also able to communicate with each o<strong>the</strong>r, whichmakes it potentially possible to employ eNodeB cooperation schemes to increase networkperformance. eNodeBs implements <strong>the</strong> following RAN functionalities, whichare shown in Figure 2.2:ˆ All PHY <strong>and</strong> MAC layer procedures, including link adaptation, Hybrid AutomaticRepeat reQuest (HARQ), <strong>and</strong> cell search.ˆ Radio Link Control (RLC): Segmentation <strong>and</strong> Automatic Repeat reQuest (ARQ)control <strong>of</strong> <strong>the</strong> radio bearers.11
2. 3GPP Long Term Evolution2G/3G networkUMTS RANUTRANGERANGSM/EDGE RANSGSNcontrol plane (C-plane)user plane (U-plane)HSS<strong>LTE</strong> networkUEeNodeB<strong>LTE</strong> RANMMEservinggatewayPDNgatewayPCRFoperator’sIP servicese.g. internetMobileUserRadio AccessNetwork (RAN)Core NetworkExternalIP servicesFigure 2.1: Overall <strong>LTE</strong> architecture [31–33]. The solid lines interconnecting <strong>LTE</strong> <strong>and</strong>2G/3G network elements denote U-Plane traffic, while <strong>the</strong> dotted lines C-Planetraffic.ˆ Packet Data Convergence Protocol (PDCP): IP header compression by means<strong>of</strong> RObust Header Compression (ROHC) [34] <strong>and</strong> encryption <strong>of</strong> <strong>the</strong> user datastreams.ˆ Radio Resource Control (RRC): at <strong>the</strong> C-Plane level, it controls <strong>the</strong> h<strong>and</strong>over,manages Quality <strong>of</strong> Service (QoS), establishes <strong>and</strong> maintains radio bearers, manageskeys (security), <strong>and</strong> controls/reports UE measurements.ˆ Radio Resource Management (RRM): ensures that radio resources are assignedefficiently <strong>and</strong> meeting <strong>the</strong> QoS constraints imposed by <strong>the</strong> core network. TheRRM layer achieves it by means <strong>of</strong> controlling radio admission <strong>and</strong> bearers, connectionmobility, <strong>and</strong> UL/DL scheduling.ˆ Selection <strong>of</strong> a Mobility Management Entity (MME) at UE attachment.ˆ Routing <strong>of</strong> <strong>the</strong> U-Plane data towards <strong>the</strong> Serving Gateway (S-GW).The SAE core network is responsible <strong>of</strong> Non-Access Stratum (NAS) procedures [36],which include UE mobility, IP session management, <strong>and</strong> security to those. Also providedby <strong>the</strong> SAE are packet routing, <strong>and</strong> network management. The most importantelements <strong>of</strong> <strong>the</strong> EPC are <strong>the</strong> MME, S-GW, <strong>and</strong> PDN Gateway (P-GW) [32, 37],which perform <strong>the</strong> following functions:The MME supports subscriber <strong>and</strong> session management at <strong>the</strong> C-Plane level:ˆ S-GW <strong>and</strong> P-GW selection, as well as idle state mobility control <strong>and</strong> roaming.ˆ Ciphering <strong>and</strong> integrity protection <strong>of</strong> NAS signalling.ˆ Distribution <strong>of</strong> paging messages to <strong>the</strong> Evolved Node Bs (eNodeBs).12
2. 3GPP Long Term EvolutionNAS procedures IP packet routing network managementRB control broadcast, paging h<strong>and</strong>over, cell selection QoSROHCsecurityCore network (SAE)RRCPDCPsegmentationARQscheduling/priority h<strong>and</strong>lingmultiplexing at UE levelHARQlink adaptation power control cell searchRLCMACPHYRANFigure 2.2: Layer structure for <strong>LTE</strong> [31, 35].ˆ Signaling between nodes <strong>of</strong> different core networks for mobility between 3GPPaccess networks including Serving-General packet radio service Support Node(SGSN) selection for h<strong>and</strong>overs to 2G or 3G 3GPP networks.ˆ Security control toge<strong>the</strong>r with <strong>the</strong> Home Subscriber Server (HSS), which supports<strong>the</strong> database containing <strong>the</strong> user subscription information.The Serving Gateway (S-GW) is <strong>the</strong> termination point towards <strong>the</strong> RAN. It supports<strong>the</strong> termination <strong>of</strong> U-Plane packets <strong>and</strong> its switching when UE mobility requiresit, as well as packet routing <strong>and</strong> forwarding. For UTRAN (3G) mobility,<strong>the</strong> U-Plane connection is done directly with <strong>the</strong> UMTS RAN, while <strong>the</strong> signalinggoes through <strong>the</strong> SGSN. For GSM EDGE Radio Access Network (GERAN) (2G)mobility, both C-Plane <strong>and</strong> U-Plane are routed through <strong>the</strong> SGSN, as shown inFigure 2.1.Lastly, <strong>the</strong> PDN Gateway (P-GW) serves as an anchor point for sessions towardsexternal Packet Data Networks (PDNs). It supports:ˆ Packet filtering <strong>and</strong>/or marking <strong>and</strong> DHCP functionality (IP address allocation).ˆ Service level charging <strong>and</strong> rate enforcing, toge<strong>the</strong>r with <strong>the</strong> Policy <strong>and</strong> ChargingRules Function (PCRF).This functional split <strong>of</strong> <strong>the</strong> SAE elements allows for a more specialized implementation<strong>of</strong> <strong>the</strong> MME, S-GW, <strong>and</strong> P-GW. Thus, <strong>the</strong> MME is optimized for C-Planeprocessing, while <strong>the</strong> S-GW is optimized to process high-throughput U-Plane data.The P-GW performs functions analogous to those <strong>of</strong> an exit edge router in <strong>the</strong>commonly-used IP DiffServ architecture [38] for <strong>the</strong> <strong>LTE</strong> core network.13
2. 3GPP Long Term Evolution2.2. <strong>LTE</strong> Physical LayerThe <strong>LTE</strong> PHY layer substitutes <strong>the</strong> Code-Division Multiple Access (CDMA) accesstechnology employed in 3G st<strong>and</strong>ards with a new Orthogonal Frequency-DivisionMultiplexing (OFDM) PHY layer, which implies that <strong>the</strong> PHY resources no longerspan in <strong>the</strong> code <strong>and</strong> time domain, but ra<strong>the</strong>r <strong>the</strong> frequency <strong>and</strong> time domain (inboth cases additionally <strong>the</strong> spatial domain if MIMO is applied).1 frame: 10 ms1 subframe: 1ms1 2 3 4 5 6 7 8 9 101 subframe: 14 OFDM symbols1 2 3 4 5 6 7 1 2 3 4 5 6 7cyclic prefix: *slot: 0.5 msFigure 2.3: <strong>LTE</strong> frame structure (FDD mode).*: OFDM symbol nr. 1 employsIn <strong>LTE</strong>, DL transmissions are organized into radio frames with a duration <strong>of</strong> 10 ms,both for <strong>the</strong> Time Division Duplex (TDD) <strong>and</strong> Frequency Division Duplex (FDD)modes. Focusing just on <strong>the</strong> FDD case, each radio frame is subdivided into ten subframes<strong>of</strong> 1 ms each, subsequently divided into two slots <strong>and</strong> seven OFDM symbolseach. In order to avoid inter-symbol interference, a CP is added to <strong>the</strong> beginning <strong>of</strong>each symbol, with a length <strong>of</strong> 5.21 µs for <strong>the</strong> first symbol or 4.7 µs for <strong>the</strong> remainingsix symbols (Figure 2.3). A longer CP configuration is also st<strong>and</strong>ardized, but is notconsidered in this work [39].Table 2.3.: Available <strong>LTE</strong> system b<strong>and</strong>widths <strong>and</strong> available resource blocks [40].Channel b<strong>and</strong>width (B channel ) [MHz] 1.4 3 5 10 15 20Number <strong>of</strong> RBs ( NRBDL )6 15 25 50 75 100Number <strong>of</strong> data subcarriers 72 180 300 600 900 1200Transmission b<strong>and</strong>width (B TX ) [MHz] 1.08 2.7 4.5 9 13.5 18B<strong>and</strong>guard size [% <strong>of</strong> B channel ] 23% 10% 10% 10% 10% 10%In <strong>the</strong> frequency domain, <strong>the</strong> available b<strong>and</strong>width is divided into equally-spacedorthogonal subcarriers. The typical subcarrier spacing, which is employed in this<strong>the</strong>sis, is 15 kHz, although a smaller 7.5 kHz spacing is also possible. Subcarriers areorganized in groups <strong>of</strong> NscRB consecutive subcarriers, which is 12 for <strong>the</strong> normal-lengthCP <strong>and</strong> 24 when employing a 7.5 kHz subcarrier spacing. Each <strong>of</strong> <strong>the</strong> subcarriergroups, spanning 180 kHz, is referred to as a Resource Block (RB), as depicted inFigure 2.4.The <strong>LTE</strong> st<strong>and</strong>ard defines a set <strong>of</strong> possible b<strong>and</strong>widths [40], which14
2. 3GPP Long Term Evolutionchannel b<strong>and</strong>width:resource blocks:1 RB:180 kHzb<strong>and</strong>guard: typically10% <strong>of</strong>zero DC subcarriersubcarriers: 1 RBFigure 2.4: <strong>LTE</strong> frequency spectrum distribution for a channel b<strong>and</strong>width (B channel ) <strong>of</strong>3 MHz <strong>and</strong> a 15 kHz subcarrier spacing: NRB DLRB= 15 <strong>and</strong> Nsc = 12.determine <strong>the</strong> number <strong>of</strong> RBs, data subcarriers <strong>and</strong> b<strong>and</strong>guard size, as listed inTable 2.3.Combining <strong>the</strong> time <strong>and</strong> frequency partitioning, a time-frequency grid such as <strong>the</strong>one shown in Figure 2.5 is obtained. Each element resulting from this time-frequencyseparation is termed a Resource Element (RE), <strong>and</strong> defines <strong>the</strong> positions in which<strong>the</strong> transmitted data, be it reference symbols or data/control channels are placed in<strong>the</strong> DL frame.Resource Block (180 kHz)subcarrier (15 kHz)subframe: 1ms14 OFDM symbols......1 2 3 4 5 6 7 8 9 10 1112 1 2 3 4 12 1 2 3 4 5 6 7 8 9 10 1112slot (0.5ms)Resource ElementFigure 2.5: <strong>LTE</strong> time-frequency grid: allocation <strong>of</strong> <strong>the</strong> resource elements in an <strong>LTE</strong> subframeover time (14 OFDM symbols) <strong>and</strong> frequency (NscRB × NRB DL subcarriers).2.2.1. MIMO TransmissionMIMO techniques are one <strong>of</strong> <strong>the</strong> main enablers to achieve <strong>the</strong> throughput requirementsfor E-UTRAN listed in Table 2.1. The <strong>LTE</strong> st<strong>and</strong>ard defines support for one,two, <strong>and</strong> four transmit antennas. The supported multi-antenna transmit modesemploy ei<strong>the</strong>r a Transmit Diversity (TxD) or SM transmission scheme in order toincrease diversity, data rate, or both. These are described in detail for <strong>the</strong> twotransmit antenna case to illustrate <strong>the</strong> concepts behind <strong>the</strong>m, considering <strong>the</strong> fourtransmit antenna case as an extension <strong>of</strong> this case. SM can be operated in twomodes: Open Loop Spatial Multiplexing (OLSM) <strong>and</strong> Closed Loop Spatial Multiplexing(CLSM). While both require feedback regarding <strong>the</strong> number <strong>of</strong> spatiallayers employed, in OLSM no precoding matrix feedback is employed (hence <strong>the</strong>15
2. 3GPP Long Term Evolution“open loop” terming), while in CLSM, <strong>the</strong> optimum precoding matrix informationis additionally fed back to <strong>the</strong> eNodeB by <strong>the</strong> UE.2.2.1.1. Transmit DiversityThe TxD mode provides transmit diversity by means <strong>of</strong> an Alamouti Space-TimeBlock Code (STBC) [41]. For <strong>the</strong> two transmit antenna case, <strong>the</strong> transmit vectorx = [x 0 , x 1 ] T , is mapped to <strong>the</strong> output [ from]each antenna y, which is sent over twox 0 −x ∗ 1time slots (column-wise), as y =x 1 x ∗ [39].02.2.1.2. Open Loop Spatial MultiplexingIn a SM scheme, <strong>the</strong> transmit vector x containing <strong>the</strong> modulated data symbols ismultiplied by a precoding matrix W, generating <strong>the</strong> output vector y to be sent over<strong>the</strong> antennas. Thus, y = Wx.In <strong>LTE</strong>, <strong>the</strong> length <strong>of</strong> <strong>the</strong> vector x is referred to as <strong>the</strong> number <strong>of</strong> layers (denoted asν), <strong>and</strong> is <strong>the</strong> number <strong>of</strong> symbols simultaneously transmitted over <strong>the</strong> available N Ttransmit antennas. Thus, <strong>the</strong> precoding matrix W generates ν spatial beams thatare sent x over <strong>the</strong> N T transmit antennas.OLSM employs a fixed precoder (or a cyclical set <strong>of</strong> precoders in <strong>the</strong> case withfour transmit antennas) <strong>and</strong> allows for <strong>the</strong> number <strong>of</strong> layers ν to be configured. Tocompensate for <strong>the</strong> suboptimal precoder choice, OLSM additionally applies CyclicDelay Diversity (CDD) to <strong>the</strong> transmit symbol vector [42]. CDD shifts <strong>the</strong> transmitsignal in <strong>the</strong> time direction <strong>and</strong> transmits <strong>the</strong>se modified signal copies over separatetransmit antennas.The time shifts are inserted in cyclically (hence <strong>the</strong> name),thus not affecting Inter-Symbol Interference (ISI).This results in increasing <strong>the</strong>number <strong>of</strong> resolvable channel propagation paths, <strong>and</strong> thus increased diversity withno additional receiver complexity [43].For <strong>the</strong> two transmit antenna case, <strong>and</strong> at a time instant k, <strong>the</strong> transmission <strong>of</strong> asymbol vector x k <strong>of</strong> length ν symbols, can be formulated asy k = WD k Ux k , (2.1)where D k cyclically shifts <strong>the</strong> delay depending on <strong>the</strong> time index k, <strong>and</strong> W, U <strong>and</strong>D k are defined as [39]:[ ][ ]W = √ 1 1 0, U = 1 1 1√2 0 12 1 e −i2π/2 , D k =[ ]1 00 e −i2πk/2 . (2.2)16
2. 3GPP Long Term EvolutionSince <strong>the</strong> CDD matrix cycles with a period <strong>of</strong> two, D k can be expressed as D k mod 2for <strong>the</strong> two transmit antenna case. For ν = 1, OLSM is not defined.In <strong>the</strong> case <strong>of</strong> four transmit antennas, instead <strong>of</strong> a fixed W matrix, a different precoderis applied after ν vectors, as well as D k mod 4 instead <strong>of</strong> D k mod 2 . AppropriateU, D k , <strong>and</strong> W matrices are defined for ν = 3, 4 in [39].2.2.1.3. Closed Loop Spatial MultiplexingUnless <strong>the</strong> feedback is invalidated by a rapidly changing channel, gains can be obtainedin comparison to OLSM by signaling <strong>the</strong> eNodeB an optimum precodingmatrix W in combination with <strong>the</strong> number <strong>of</strong> desired layers ν instead <strong>of</strong> employingCDD. Thus, expressing <strong>the</strong> output symbol vector y as y = Wx.In order to simplify signaling, instead <strong>of</strong> feedbacking <strong>the</strong> actual optimum precodermatrix [44], a precoder is chosen from a predefined codebook, <strong>the</strong> index <strong>of</strong> whichis sent to <strong>the</strong> eNodeB as feedback. For N TX = 2, <strong>the</strong> <strong>LTE</strong> codebook is comprised<strong>of</strong> four (ν = 1) <strong>and</strong> two (ν = 2) precoders, which are listed in Table 2.6. For fourtransmit antennas, <strong>the</strong> codebook spans 15 precoding choices for ν ∈ {1, 2, 3, 4}.2.2.2. Layer-to-Codeword MappingThe <strong>LTE</strong> st<strong>and</strong>ard allows for up to two parallel data streams, termed codewords,to be simultaneously transmitted. As seen in Section 2.2.1, up to four symbolscan be simultaneously transmitted when using ei<strong>the</strong>r OLSM or CLSM. While <strong>the</strong>precoding-related procedures work on a per-layer basis, <strong>the</strong> channel coding <strong>and</strong>channel quality reporting procedures work on a per-codeword basis.1 or 2 codewords layers <strong>of</strong> equal size: 1, 2, 3, or 4 layerschannelcodingscramblingscramblingmodulation mappermodulation mapperlayermapperRE mapperOFDM signal generationinsert CPprecodingRE mapperOFDM signal generationinsert CP1, 2, 3, or 4 layers antenna ports: 1, 2, or 4 antennasFigure 2.6: Modulation <strong>and</strong> layer mapping procedures [39]. The one or two codewords outputby <strong>the</strong> channel coding procedures are scrambled, mapped to complex symbols,distributed in ν layers (layer mapping), mapped to N TX transmit antennaports <strong>and</strong> converted to <strong>the</strong> time domain.17
2. 3GPP Long Term EvolutionAs shown in Figure 2.6, <strong>the</strong> one or two codewords <strong>of</strong> coded data bits output by <strong>the</strong>channel coding procedures are mapped to ν spatial layers via a layer mapping <strong>and</strong><strong>the</strong>n to <strong>the</strong> N T transmit antenna ports via <strong>the</strong> precoding (when applicable) [39].Table 2.4 describes <strong>the</strong> <strong>LTE</strong> codeword-to-layer mapping employed by <strong>the</strong> OLSM <strong>and</strong>CLSM modes for <strong>the</strong> allowed combinations <strong>of</strong> number <strong>of</strong> codewords <strong>and</strong> number <strong>of</strong>layers ν. No layer mapping is required in non-SM modes.layers → codewordsTable 2.4.: Layer mapping for spatial multiplexing [39]codeword-to-layer mapping1 → 1 codeword 1 → layer 12 → 2 codeword 1 → layer 1 codeword 2 → layer 22 → 1 codeword 1 → layers 1,23 → 2 codeword 1 → layer 1 codeword 2 → layers 2, 34 → 2 codeword 1 → layers 1,2 codeword 2 → layer 3, 42.2.3. Channel Coding<strong>LTE</strong>, as well as HSPA, relies on Adaptive Modulation <strong>and</strong> Coding (AMC) in order toprovide adaptability to <strong>the</strong> channel conditions. In order to match <strong>the</strong> radio channelcapacity <strong>and</strong> Block Error Ratio (BLER) requirements for each UE, <strong>the</strong> eNodeBdynamically adjusts both <strong>the</strong> applied code rate <strong>and</strong> modulation.The <strong>LTE</strong> channel coding procedures [45, 46] specify a per-user <strong>and</strong> per-codewordcoding <strong>and</strong> modulation chain, which according to <strong>the</strong> signaling passed down from <strong>the</strong>MAC layer (see Section 2.2.4), applies an appropriate coding rate <strong>and</strong> modulationalphabet to <strong>the</strong> data bits.+24 bits if >1: +24 bitsdata bitsTransport BlockCRC attachmentSegmentation<strong>and</strong> Code BlockCRC attachmentCBsbitsTurbo codingTurbo codingRate matchingRate matchingConcatenationcoded bits+ 12 bits bits bitsFigure 2.7: <strong>LTE</strong> channel coding procedures for <strong>the</strong> DLSCH for one codeword [45]. For <strong>the</strong>N TB bits, error detection is provided by means <strong>of</strong> one or more 24-bit CRCs ,while error correction is provided by a rate-matched turbo code with variablebit rate.18
2. 3GPP Long Term EvolutionThe channel coding procedures are depicted in Figure 2.7, <strong>and</strong> describe for eachcodeword, <strong>the</strong> encoding <strong>of</strong> N TB bits into a Transport Block (TB) <strong>of</strong> size G bits[45].The channel coding procedures implement error-detecting capabilities by means <strong>of</strong>one or several 24-bit CRCs <strong>and</strong> error correction with a turbo code [47]. Since <strong>the</strong>turbo coder interleaver has a maximum size <strong>of</strong> Z = 6 144 bits, <strong>the</strong> N TB bits aresegmented into C Code Blocks (CBs) <strong>of</strong> up to Z bits, each with an additional CBCRC. Each CB is coded by means <strong>of</strong> a rate one-third turbo encoder [ with two ]8-state constituent encoders with generator polynomial G (D) =1+D+D1, 3,1+D 2 +D 3identical to <strong>the</strong> one used in W-CDMA [48]. Per-CB rate matching is <strong>the</strong>n appliedto adapt <strong>the</strong> overall resulting bits to <strong>the</strong> TB size <strong>of</strong> G bits. The rate matching blockis also tasked with generating different redundancy versions <strong>of</strong> <strong>the</strong> CB bits neededfor HARQ retransmission operation [49, 50] (see Section 4.1 for a more detaileddescription <strong>of</strong> <strong>the</strong> HARQ-related procedures).2.2.4. Channel Adaptive Feedback<strong>LTE</strong> implements AMC, as well as closed-loop MIMO in order to adapt <strong>the</strong> transmissionrate to <strong>the</strong> instantaneous channel conditions reported by <strong>the</strong> feedback. Dependingon <strong>the</strong> transmission mode, <strong>LTE</strong> requires <strong>the</strong> calculation <strong>of</strong> up to three differentfeedback values at <strong>the</strong> receiver, which are explained in <strong>the</strong> subsections below.2.2.4.1. Channel Quality Indicator FeedbackThe Channel Quality Indicator (CQI) signals on a per-codeword basis <strong>the</strong> highest <strong>of</strong><strong>the</strong> 15 Modulation <strong>and</strong> Coding Schemes (MCSs) specified in Table 2.5 that ensures,given measured actual channel conditions, a BLER lower or equal to 10 % [51, 52].Table 2.5.: Modulation scheme, Effective Code Rate (ECR) <strong>of</strong> <strong>the</strong> channel encoder, <strong>and</strong> data(coded) bits per modulated symbol for each <strong>of</strong> <strong>the</strong> <strong>LTE</strong>-defined CQIs.CQI Modulation ECR bits/symb CQI Modulation ECR bits/symb0 out <strong>of</strong> range 8 16-QAM 0.48 1.911 4-QAM 0.08 0.15 9 16-QAM 0.60 2.412 4-QAM 0.12 0.23 10 64-QAM 0.46 2.733 4-QAM 0.19 0.38 11 64-QAM 0.55 3.324 4-QAM 0.30 0.60 12 64-QAM 0.65 3.905 4-QAM 0.44 0.88 13 64-QAM 0.75 4.526 4-QAM 0.59 1.18 14 64-QAM 0.85 5.127 16-QAM 0.37 1.48 15 64-QAM 0.93 5.55The CQIs specify code rates between 0.08 <strong>and</strong> 0.92, <strong>and</strong> employ 4-QAM, 16-QAM,or 64-QAM modulation alphabets. This is translated into an effective number <strong>of</strong>data bits per modulated symbol ranging from 0.15 to 5.55, as listed in Table 2.5. As19
2. 3GPP Long Term EvolutionBLERAWGN BLER for CQIs 1 to 1510% BLER10 −110 −210 −3−10 −5 0 5SNR10[dB]15 20 2510 0CQI15131197531SNR-to-CQI mapping−10 0 10 20SNR [dB]4-QAM 16-QAM 64-QAMCQI 1CQI 2CQI 3CQI 4CQI 5CQI 6CQI 7CQI 8CQI 9CQI 10CQI 11CQI 12CQI 13CQI 14CQI 15Figure 2.8: SNR-to-CQI mapping. Left: CQI BLER curves. Right: CQI mapping obtainedfrom <strong>the</strong> 10 % BLER points.such, for <strong>the</strong> MCS defined by each CQI, a mapping between <strong>the</strong> 10% BLER point<strong>the</strong> BLER curve <strong>of</strong> <strong>the</strong> corresponding MCS <strong>and</strong> each CQI value can be utilized,which is depicted in Figure 2.8. It should be noted, however, that such a Signalto Interference <strong>and</strong> Noise Ratio (SINR)-to-CQI mapping depends on <strong>the</strong> type <strong>of</strong>receiver. In <strong>the</strong> same channel conditions, a better receiver (for example a receiverimplementing interference cancellation) would be able to report a higher CQI thana simpler or poorly-implemented one.2.2.4.2. Precoding Matrix <strong>and</strong> Rank FeedbackThe MIMO spatial multiplexing modes <strong>of</strong> <strong>LTE</strong>, which comprise <strong>the</strong> OLSM <strong>and</strong>CLSM transmit modes, require <strong>of</strong> additional feedback compared to <strong>the</strong> single transmitantenna <strong>of</strong> TxD cases. Rank Indicator (RI) feedback is required by both OLSM<strong>and</strong> CLSM, while Precoding Matrix Indicator (PMI) feedback is employed just by<strong>the</strong> CLSM mode [53] (see Section 2.2.1).The feedback strategy is designed to calculate <strong>the</strong> PMI <strong>and</strong> RI combination thatmaximizes <strong>the</strong> number <strong>of</strong> receivable bits by <strong>the</strong> UE, which can be obtained by maximizing<strong>the</strong> sum Mutual Information (MI) for all possible PMI <strong>and</strong> RI combinations<strong>and</strong>, due to <strong>the</strong> constraint <strong>of</strong> a wideb<strong>and</strong> RI, choosing that with <strong>the</strong> rank choicewith <strong>the</strong> highest sum MI over all RBs [51, 54].Since in OLSM <strong>the</strong> precoder choice is predetermined, <strong>the</strong> feedback calculation can,in this case, be shortened to <strong>the</strong> search <strong>of</strong> <strong>the</strong> RI that maximizes <strong>the</strong> sum MI overall RBs.20
2. 3GPP Long Term EvolutionTable 2.6.: <strong>LTE</strong> codebook for CLSM mode <strong>and</strong> two transmit antennas for each <strong>of</strong> <strong>the</strong> possiblenumber <strong>of</strong> layers (ν) [39].Layers (ν)12[ ]1 1√ , 2 1Precoder codebook] ], ,[1√21−1[1 1 12 1 −1],1√2[1i12[ 1 1i −i[1 1√2 −i]]Although desirably <strong>the</strong> PMI <strong>and</strong> RI feedback combination would be sent for eachsubcarrier, one PMI value is sent per RB (12 subcarriers), while for <strong>the</strong> RI, just asingle wide-b<strong>and</strong> value for <strong>the</strong> whole b<strong>and</strong>width is transmitted. These reductionswere imposed by <strong>the</strong> need <strong>of</strong> reducing signaling traffic.Table 2.6 lists <strong>the</strong> available precoders for <strong>the</strong> two-transmit-antenna case. For <strong>the</strong>four-antenna case, <strong>the</strong> codebook size increases to sixteen precoders, supporting upto four layers.2.3. MAC LayerThe Medium Access Control (MAC) layer controls <strong>the</strong> access to <strong>the</strong> transmissionmedium. It provides data transfer <strong>and</strong> radio resource allocation services to upperlayers, while <strong>the</strong> physical layer provides it with lower level data transfer services,signaling (HARQ feedback <strong>and</strong> scheduling requests), as well as channel measurementssuch as PMI, RI, <strong>and</strong> CQI reports [55]. Implementation-wise, <strong>the</strong> MAC layeris realized by a scheduler, which discretionally decides <strong>the</strong> PHY resource allocationfor each UE according to its applied scheduling algorithm <strong>and</strong> <strong>the</strong> channel stateinformation received from <strong>the</strong> PHY layer, as shown in Figure 2.9.1 RBfrequency1 TTIcommon values per UE <strong>and</strong> TTI- code rate & modulation- number <strong>of</strong> spatial layers (rank)**: when applicabletimeUE 1 UE 2 UE 3Figure 2.9: Example time-<strong>and</strong>-frequency domain scheduling in <strong>LTE</strong>. On a given TTI, eachUE can be assigned a set <strong>of</strong> RBs, which is coded employing a common singleMCS. If SM is employed, while <strong>the</strong> precoder choice can be frequency-selective, acommon rank (number <strong>of</strong> layers) is employed over <strong>the</strong> whole set <strong>of</strong> RBs scheduledto <strong>the</strong> UE.21
2. 3GPP Long Term EvolutionIn <strong>LTE</strong>, multi-user diversity is exploited in both <strong>the</strong> time <strong>and</strong> frequency domains.UEs are assigned a set <strong>of</strong> RBs over time, thus exploiting both degrees <strong>of</strong> freedom(individual subcarrier allocation would require an excessive amount <strong>of</strong> signaling).While <strong>the</strong> exact RB allocation mechanism can vary between different modes [53],<strong>the</strong> procedure comprises <strong>the</strong> allocation <strong>of</strong> frequency resources to one or more UEs,as well <strong>the</strong> number <strong>of</strong> spatial layers, precoding, <strong>and</strong> MCS [56]. In <strong>the</strong> time domain,a scheduling granularity <strong>of</strong> one millisecond, corresponding to <strong>the</strong> subframe duration,is applied.According to <strong>the</strong> feedback received from <strong>the</strong> UEs, a scheduler must appropriatelyassign transmit mode, MCS, PHY resource allocation, <strong>and</strong>, if applicable, a suitablenumber <strong>of</strong> spatial layers <strong>and</strong> precoding matrix. Exploiting <strong>the</strong>se degrees <strong>of</strong> freedom,<strong>the</strong> goal <strong>of</strong> a scheduler is typically to try to achieve maximum throughput whilemaintaining a certain degree <strong>of</strong> fairness [56–59].22
3. Physical Layer <strong>Modeling</strong> <strong>and</strong> <strong>LTE</strong> <strong>System</strong> <strong>Level</strong> Simulation3. Physical Layer <strong>Modeling</strong> <strong>and</strong> <strong>LTE</strong><strong>System</strong> <strong>Level</strong> SimulationIn order to evaluate <strong>the</strong> system level performance <strong>of</strong> a wireless network, complexsimulations encompassing a high number <strong>of</strong> network elements <strong>and</strong> its interconnectinglinks are employed. By upscaling <strong>the</strong> number <strong>of</strong> simulated links <strong>and</strong> networkelements, it is not only possible to assert if link level improvements do also improvenetwork performance, but also to test <strong>and</strong> evaluate <strong>the</strong> algorithms controlling <strong>the</strong>PHY <strong>and</strong> MAC layers. Most commonly, system level simulations are employed toevaluate <strong>the</strong> performance <strong>of</strong> scheduling <strong>and</strong> PHY resource allocation [59–61], <strong>the</strong>impact <strong>of</strong> traffic models [62], or multi-user gain [63].A straightforward <strong>and</strong> conceptually simple approach to system level performanceevaluation would be to, for each link, perform all <strong>of</strong> <strong>the</strong> PHY <strong>and</strong> MAC layer procedures.Despite being simple, this approach does not scale well <strong>and</strong> results in impracticalsimulation times due to <strong>the</strong> high computational complexity <strong>of</strong> <strong>the</strong> channelcoding/decoding procedures <strong>and</strong> specially <strong>the</strong> MIMO receiver [64–66].Link level simulations are normally evaluated for a range <strong>of</strong> Signal to Noise Ratios(SNRs) or similar measures such as E b /N 0 [67], for which link performance isevaluated in terms <strong>of</strong> throughput. For <strong>the</strong> smallest defined <strong>LTE</strong> system b<strong>and</strong>width<strong>of</strong> 1.4 MHz, which results in smallest possible simulation run time, a typical link levelsimulation lasts in <strong>the</strong> order <strong>of</strong> hours, depending on <strong>the</strong> employed MCSs employed,MIMO configuration <strong>and</strong> receiver [68].In order to generate an interference-limited scenario analogous to a network deployment,typically a tri-sectorized hexagonal cell layout with no less than two rings <strong>of</strong>sites, each with three sectors is employed [69], such as <strong>the</strong> setup depicted in Figure3.1. However, in order to correctly capture <strong>the</strong> effects <strong>of</strong> Multi-User (MU) gain23
3. Physical Layer <strong>Modeling</strong> <strong>and</strong> <strong>LTE</strong> <strong>System</strong> <strong>Level</strong> Simulationboth due to <strong>the</strong> OFDMA resource allocation <strong>the</strong> spatial UE distribution, simulationswith a higher b<strong>and</strong>width (<strong>LTE</strong> supports a transmission b<strong>and</strong>width <strong>of</strong> up to20 MHz) <strong>and</strong> a high per-cell UE count are necessary, fur<strong>the</strong>r increasing <strong>the</strong> potentialcomputational complexity <strong>of</strong> system level simulations relative to a single-linksimulation.1000ROI500eNodeB sitey pos [m]0−500eNodeB 3eNodeB 1eNodeB 2−1000UEs−1000 −500 0 500 1000x pos [m]Figure 3.1: Typical system level simulation setup consisting <strong>of</strong> an hexagonal grid <strong>of</strong> 19 sites,each containing three eNodeBs (sectors). Users are placed r<strong>and</strong>omly over <strong>the</strong>Region Of Interest (ROI), covering in this case a rectangle <strong>of</strong> roughly 2 500×2 200meters. In this example, two UEs are placed per eNodeB.Without taking into account extra complexity overhead, a simple simulation employing<strong>the</strong> aforementioned cell layout with two UEs per cell <strong>and</strong> a 20 MHz b<strong>and</strong>widthwould have a complexity 950 times higher than a 1.4 MHz single-user link level simulationdue to <strong>the</strong> increase <strong>of</strong> <strong>the</strong> number <strong>of</strong> RBs from 6 to 100 <strong>and</strong> <strong>the</strong> number <strong>of</strong>eNodeBs from one to 57 (19 sites, 3 eNodeBs/site) 1 . If implemented via link levelsimulations, such a typical <strong>LTE</strong> system level simulation would require a simulationtime in <strong>the</strong> order <strong>of</strong> months, which is clearly not practical.3.1. <strong>System</strong> ModelAs in o<strong>the</strong>r contemporary communication systems, such as W-CDMA or IEEE802.11n, <strong>LTE</strong> employs Bit-Interleaved Coded Modulation (BICM), which has beenshown to improve performance compared to systems employing symbol-wise interleaving[70]. Conceptually, <strong>the</strong> PHY layer procedures described in Chapter 2 can be1 Although <strong>the</strong> feedback would still need to be computed for <strong>the</strong> whole b<strong>and</strong>width by each UE, ithas here been assumed that overall complexity is determined by <strong>the</strong> MIMO receiver complexity.As <strong>the</strong> cell PHY resources are shared by all attached UEs, <strong>the</strong> UE count is thus ignored in <strong>the</strong>calculation.24
3. Physical Layer <strong>Modeling</strong> <strong>and</strong> <strong>LTE</strong> <strong>System</strong> <strong>Level</strong> Simulationdescribed as a BICM system comprised <strong>of</strong> <strong>the</strong> elements listed below [71, 72], whichare also shown in Figure 3.2:ˆ A transmitter, comprised <strong>of</strong> a channel coder, a bit interleaver (Π), <strong>and</strong> a modulator(M). It maps <strong>the</strong> input bit stream b to <strong>the</strong> transmit vector x.ˆ A channel, which outputs <strong>the</strong> symbol vector y <strong>and</strong> defines a transition probabilitydensity function (pdf) p θ (y|x) depending on <strong>the</strong> channel state, which is denotedas θ.ˆ A receiver, which outputs <strong>the</strong> received bit stream ˆb. It is comprised <strong>of</strong> an equalizer<strong>and</strong> demodulator ( M −1) , de-interleaver ( Π −1) , <strong>and</strong> channel decoder.encodingdecodingTransmitter Channel ReceiverFigure 3.2: BICM transmission model. The model comprises bit coding/decoding, bit interleaving/deinterleaving,<strong>and</strong> symbol mapping/demapping, as well as a channel,modeled as a transition probability density function.As shown in Chapter 2, bit coding <strong>and</strong> interleaving in provided by a turbo codercombined with rate matching. The symbol mapping M is implemented by means<strong>of</strong> a 4, 16, or 64-QAM constellation with Gray mapping [39].The channel over which <strong>the</strong> symbol vector x is transmitted is modeled as a combination<strong>of</strong> a channel impulse response <strong>and</strong> Additive White Gaussian Noise (AWGN).Assuming an <strong>LTE</strong> system with N TX transmit antennas <strong>and</strong> N RX receive antennas,<strong>the</strong> signal received at <strong>the</strong> r-th antenna, denoted as y r , can be expressed in <strong>the</strong> timedomain as <strong>the</strong> sum <strong>of</strong> <strong>the</strong> signal received from each <strong>of</strong> <strong>the</strong> N TX transmit antennaswith a later addition <strong>of</strong> AWGN noise:y r =N TX ∑t=1(h t,r ∗ x t ) + n r , (3.1)where <strong>the</strong> signal from <strong>the</strong> t-th transmit antenna, denoted as x t is convolved (∗)with <strong>the</strong> channel impulse response <strong>of</strong> length τ between <strong>the</strong> t-th transmit to <strong>the</strong> r-threceive antenna, denoted as h t,r .Assuming a CP at least as long as <strong>the</strong> length <strong>of</strong> <strong>the</strong> channel (τ), <strong>the</strong> CP introduced in<strong>the</strong> OFDM signal generation (see Figure 2.6 in Section 2.2) eliminates inter-symbolinterference <strong>and</strong> allows for <strong>the</strong> channel impulse response h t,r for each OFDM symbolto be expressed as a complex-valued scalar. Stacking <strong>the</strong> h t,r values into a N RX ×N TXmatrix H, <strong>the</strong> received symbol vector y <strong>of</strong> length N RX can be expressed asy = Hx + n, (3.2)25
3. Physical Layer <strong>Modeling</strong> <strong>and</strong> <strong>LTE</strong> <strong>System</strong> <strong>Level</strong> Simulationwhere H is <strong>the</strong> effective channel matrix mapping <strong>the</strong> transmitted data symbols to<strong>the</strong> received data symbols (i.e., it includes, if present, <strong>the</strong> precoding, as shown inSection 2.2.1). The vector <strong>of</strong> length N TX containing <strong>the</strong> modulated data symbolsis denoted as x, while <strong>the</strong> vector <strong>of</strong> length N RX containing <strong>the</strong> per-receive-antennaAWGN noise is denoted as n.Thus, <strong>and</strong> in a very simplified way, <strong>the</strong> equivalent BICM transmission-receptionchain from Figure 3.2 can be rewritten for <strong>the</strong> <strong>LTE</strong> case as shown in Figure 3.3.data bitsturbo coderturbo decoderdecoded bitsFigure 3.3: Equivalent <strong>LTE</strong> BICM transmitter-receiver chain.The objective <strong>of</strong> <strong>the</strong> Link-to-<strong>System</strong> (L2S) model is, given a parametrization <strong>of</strong> <strong>the</strong>inputs, to predict <strong>the</strong> performance <strong>of</strong> <strong>the</strong> link; in this case, <strong>the</strong> achieved throughputover <strong>the</strong> link.In order to simplify this problem, it can be divided in two parts, which jointly model<strong>the</strong> performance <strong>of</strong> <strong>the</strong> link [73, 74]: a link quality model (alternatively referred toin literature as link measurement model) <strong>and</strong> a link performance model.The link quality model, as its name implies, outputs a metric quantifying <strong>the</strong> quality<strong>of</strong> <strong>the</strong> received signal after reception <strong>and</strong> equalization. Since this metric has to reflect<strong>the</strong> quality <strong>of</strong> <strong>the</strong> input to <strong>the</strong> turbo decoder, a straightforward choice is <strong>the</strong> postequalizationSINR [75]. With <strong>the</strong> post-equalization SINR, <strong>the</strong> link performancemodel maps this received signal quality measure into BLER <strong>and</strong> throughput basedon <strong>the</strong> code rate <strong>and</strong> <strong>the</strong> MCS employed for <strong>the</strong> transmission.Figure 3.4 illustrates <strong>the</strong> separation <strong>of</strong> <strong>the</strong> link into a link quality <strong>and</strong> a link performancemodel, as well as <strong>the</strong> inputs necessary to perform each step. Since <strong>the</strong>actual output <strong>of</strong> <strong>the</strong> demapper are Log-Likelihood Ratios (LLRs) <strong>and</strong> not postequalizationSINRs, <strong>the</strong> M −1 block is separated into an equalization block, denotedas H −1 , <strong>and</strong> a demapping block, denoted as D, pertaining to <strong>the</strong> link quality <strong>and</strong>link performance models, respectively.Link quality modelLink performance modeldata bitsturbo coderturbo decoderdecoded bitscodingparamsmodulationparamschannelparamsequalizerfiltermod.paramscodingparamsFigure 3.4: Separation <strong>of</strong> <strong>the</strong> <strong>LTE</strong> link into link quality <strong>and</strong> link performance model. Theinputs parametrize <strong>the</strong> modeled PHY procedures <strong>of</strong> each <strong>of</strong> <strong>the</strong> steps.26
3. Physical Layer <strong>Modeling</strong> <strong>and</strong> <strong>LTE</strong> <strong>System</strong> <strong>Level</strong> SimulationThe model depicted in Figure 3.4 is, however, a simplification <strong>of</strong> <strong>the</strong> actual L2Smodel. While Equation (3.2) does depict a single link, it does not take into accountmultiple interfering eNodeBs. To include multiple base stations, we can express y 0asN∑inty 0 = H 0 x 0 + n + H i x i , (3.3)where <strong>the</strong> subindex i denotes for i = 0 <strong>the</strong> desired signal <strong>and</strong> for i = 1 . . . N int <strong>the</strong>signal from each <strong>of</strong> <strong>the</strong> N int eNodeBs. For system level simulation, a set <strong>of</strong> eNodeBsare spatially distributed over an area, each <strong>of</strong> <strong>the</strong>m communicating to <strong>the</strong>ir attachedUEs via a link, which is modeled after <strong>the</strong> steps shown in Figure 3.4.Thus, exp<strong>and</strong>ing <strong>the</strong> model depicted in Figure 3.3 to <strong>the</strong> whole network <strong>and</strong> adding<strong>the</strong> PHY layer procedures described in Chapter 2, we can identify <strong>the</strong> followingcomponents <strong>of</strong> <strong>the</strong> L2S model, as well as its connections to <strong>the</strong> link quality model(post-equalization SINR) <strong>and</strong> <strong>the</strong> link performance model (BLER <strong>and</strong> throughput):ˆ Network layout:i=1The network layout describes where all <strong>of</strong> <strong>the</strong> transmittingeNodeBs are located relative to <strong>the</strong> receiver, as well as how <strong>the</strong>y are configured.This includes not only <strong>the</strong> position, but also <strong>the</strong> azimuth <strong>and</strong> antennatype/tilt. Due to <strong>the</strong> decomposition <strong>of</strong> <strong>the</strong> fading experienced on <strong>the</strong> link intospatially-dependent <strong>and</strong> time-dependent parts (see Section 3.1.1), <strong>the</strong> networklayout determines <strong>the</strong> macroscopic fading factors, which scale <strong>the</strong> received power.The network layout is incorporated into <strong>the</strong> link quality model <strong>and</strong> is separatedinto a pathloss, shadow fading, <strong>and</strong> antenna gain components.ˆ Small scale fading: Assumed independent <strong>of</strong> <strong>the</strong> position, small-scale fading representsfast, frequency-selective channel variations over time <strong>and</strong> is incorporatedinto <strong>the</strong> link quality model.ˆ Scheduling: The scheduler implements <strong>the</strong> MAC resource allocation proceduresdetailed in Section 2.3. For link modeling purposes, <strong>the</strong> PHY resource allocation<strong>and</strong> precoder choice applied to each <strong>of</strong> <strong>the</strong> links alter <strong>the</strong> set <strong>of</strong> subcarriers whichare to be taken into account by <strong>the</strong> link measurement model, as well as <strong>the</strong>effective channel matrix H employed in <strong>the</strong> equalizer filter, <strong>and</strong> thus are part <strong>of</strong><strong>the</strong> link-measurement model. On <strong>the</strong> link performance side, <strong>the</strong> MCS requiredto map <strong>the</strong> post-equalization SINR value to <strong>the</strong> appropriate modulation-<strong>and</strong>coderate-dependentperformance curves, as well as <strong>the</strong> RBs where <strong>the</strong> assigned TBis allocated. On <strong>the</strong> link quality model side, knowledge <strong>of</strong> <strong>the</strong> applied precodingis required to calculate <strong>the</strong> post-equalization SINR.Figure 3.5 describes <strong>the</strong> aforementioned inputs to <strong>the</strong> link quality <strong>and</strong> link performancemodels, which are described in detail in Sections 3.1.1 <strong>and</strong> 3.1.2, respectively.27
3. Physical Layer <strong>Modeling</strong> <strong>and</strong> <strong>LTE</strong> <strong>System</strong> <strong>Level</strong> Simulationposition-dependentpathlosstime-dependentnetwork layoutshadow fadingsmall-scale fadingantenna gainprecodingtraffic modelQoSlinkadaptationstrategyschedulingpower allocationassigned PHYresourcesmodulation& codingHARQlink qualitymodellink performancemodelpost-equalization SINRBLERBlock SizethroughputFigure 3.5: <strong>LTE</strong> Link-to-<strong>System</strong> model.3.1.1. Link Quality ModelThe formal definition <strong>of</strong> <strong>the</strong> link quality model is that it models <strong>the</strong> measurementsused for link adaptation <strong>and</strong> resource allocation [73]. It can be interpreted as ameasure <strong>of</strong> <strong>the</strong> quality <strong>of</strong> <strong>the</strong> signal being received, for which <strong>the</strong> post-equalizationSINR <strong>of</strong> <strong>the</strong> data symbols is employed as metric in this L2S model with a blockfading assumption (i.e., <strong>the</strong> channel is assumed constant over <strong>the</strong> duration <strong>of</strong> each1 ms-long subframe). With <strong>the</strong> block fading assumption, <strong>the</strong> per-subcarrier-<strong>and</strong>subframepost-equalization SINR requirements are 12 000 SINR points/TTI for <strong>the</strong>20 MHz <strong>LTE</strong> b<strong>and</strong>width case (100 RBs, 12 subcarriers/RB). However, complexitycan be fur<strong>the</strong>r reduced by only considering a subset <strong>of</strong> <strong>the</strong> subcarriers [76].In order for <strong>the</strong> necessary assumption <strong>of</strong> a flat channel per subcarrier, <strong>the</strong> maximumchannel length, denoted as τ max , cannot exceed that <strong>of</strong> <strong>the</strong> Cyclic Prefix (CP). For<strong>the</strong> normal CP configuration <strong>and</strong> subcarrier spacing <strong>of</strong> 15 kHz, <strong>the</strong> maximum CPlength is <strong>of</strong> 4.7 µs (5.2 µs for <strong>the</strong> first symbol, 4.7 µs for <strong>the</strong> o<strong>the</strong>r symbols, but <strong>the</strong>worst-case scenario is considered). The minimum possible <strong>LTE</strong> coherence b<strong>and</strong>wid<strong>the</strong>mploying <strong>the</strong> normal-length CP is thusB <strong>LTE</strong> = 1/τ max ≈ 212 kHz ≈ 1.2 B RB , (3.4)which is rounded to one RB (180 kHz) due to <strong>the</strong> need to have at least one feedbackvalue per RB for CQI reporting. In terms <strong>of</strong> L2S modeling, one subcarrier per RBwould be enough, but planning for future extensions <strong>of</strong> <strong>the</strong> L2S modeling that couldmodel <strong>the</strong> degradation when employing longer channels, it was decided to employ28
3. Physical Layer <strong>Modeling</strong> <strong>and</strong> <strong>LTE</strong> <strong>System</strong> <strong>Level</strong> Simulationa decimation factor <strong>of</strong> six, which results in 2 · N RB SINR values for <strong>the</strong> whole <strong>LTE</strong>system b<strong>and</strong>width shown in Table 3.1. Additionally, due to <strong>the</strong> averaging nature <strong>of</strong><strong>the</strong> rank <strong>and</strong> precoding feedback algorithms [51, 54], at least two subcarrier SINRvalues per RB are desirable.Table 3.1.: Number <strong>of</strong> calculated SINR samples for <strong>the</strong> different <strong>LTE</strong> b<strong>and</strong>widths.Channel b<strong>and</strong>width (B channel ) [MHz] 1.4 3 5 10 15 20Number <strong>of</strong> SINR samples (2 · N RB ) 12 30 50 100 150 2003.1.1.1. Post-equalization SINR <strong>and</strong> Trace GenerationAs aforementioned, <strong>the</strong> complexity <strong>of</strong> <strong>the</strong> link quality model can be reduced byconsidering only a subset <strong>of</strong> <strong>the</strong> total post-equalization SINRs. For <strong>the</strong> calculation <strong>of</strong><strong>the</strong> SINR itself, a simple linear receiver, <strong>the</strong> Zero Forcing (ZF) receiver, is considered.Since system level simulations are to be used where Multi-User (MU) diversity is alsoexpected to be exploited (for single-link simulations one would ra<strong>the</strong>r employ linklevel simulations), it can be argued that for a large number <strong>of</strong> users, <strong>the</strong> ZF receiverapproaches <strong>the</strong> average performance <strong>of</strong> <strong>the</strong> optimal receiver, since MU diversityeffect can compensate for poorly conditioned channel matrices [77].Assuming perfect channel knowledge, where <strong>the</strong> accent mark [ˆ] denotes a receiverestimate, <strong>the</strong> estimated received symbol vector ˆx can be expressed as()N∑intˆx = Gy = G H 0 x 0 + n + H i x i , (3.5)where G is <strong>the</strong> receive filter, which for <strong>the</strong> ZF receiver is calculated as <strong>the</strong> pseudoinverse<strong>of</strong> H <strong>and</strong> expressed asi=1H + = ( H H H ) -1H H , (3.6)where H H denotes <strong>the</strong> Hermitian transpose <strong>of</strong> H.For <strong>the</strong> cases where a spatial multiplexing (OLSM or CLSM) or TxD (based on <strong>the</strong>Alamouti STBC [41]) mode is employed, H denotes <strong>the</strong> effective channel matrix.For <strong>the</strong> SM cases, it can be calculated as <strong>the</strong> combination <strong>of</strong> <strong>the</strong> actual channelmatrix <strong>and</strong> <strong>the</strong> linear precoder W that maps <strong>the</strong> ν transmitted symbols 2 to <strong>the</strong>N TX transmit antennas. For TxD, <strong>the</strong> precoding-equivalent operation is shown for2 In <strong>the</strong> <strong>LTE</strong> st<strong>and</strong>ard, <strong>the</strong> number <strong>of</strong> simultaneously transmitted symbols is referred to as <strong>the</strong>number <strong>of</strong> layers, <strong>and</strong> is denoted as ν (see Chapter 2 <strong>and</strong> Section 2.2.2).29
3. Physical Layer <strong>Modeling</strong> <strong>and</strong> <strong>LTE</strong> <strong>System</strong> <strong>Level</strong> Simulation<strong>the</strong> N TX = 2 example <strong>and</strong> is expressed as[y 0y ∗ 1]} {{ }ỹ=[]h (0) h (1)h (1)∗ −h (0)∗} {{ }˜H·[ ]x 0x 1} {{ }˜x+[ ]n 0, (3.7)n 1} {{ }ñwhere h (0) <strong>and</strong> h (1) contain <strong>the</strong> channel coefficients from <strong>the</strong> first <strong>and</strong> second transmitantennas to <strong>the</strong> N RX receive antennas.Denoting as γ i <strong>the</strong> post-equalization SINR <strong>of</strong> <strong>the</strong> i-th layer (ν symbols are simultaneouslytransmitted), A = H + 0 H 0, B 0 = H + <strong>and</strong> C l = H + 0 H l (l-th interferer),<strong>and</strong> denoting <strong>the</strong> matrix elements as a ij A[i, j], we can alternatively express <strong>the</strong>post-equalization SINR <strong>of</strong> <strong>the</strong> i-th layer (γ i ) [78] as:γ i =∑|a ij | 2 P j,0 + σn2j≠i|a ii | 2 P i,0ν∑N∑int|b ik | 2 +k=1l=1 m=1, (3.8)ν∑|c l,i,m | 2 P l,mwhere P i,m is <strong>the</strong> average received power at layer i from <strong>the</strong> m-th eNodeB (m = 0is <strong>the</strong> eNodeB from which <strong>the</strong> data transmission is received, while m = 1, . . . , N intcorrespond to interfering eNodeBs) <strong>and</strong> σ 2 n <strong>the</strong> receiver noise, assumed uncorrelated<strong>and</strong> after scaling with <strong>the</strong> receiver noise figure. Assuming a homogeneous per-layerpower distribution P L = P TX /ν, which is <strong>the</strong> case in <strong>the</strong> <strong>LTE</strong> st<strong>and</strong>ard, we define<strong>the</strong> ζ i , ξ i , ψ i , <strong>and</strong> θ i fading parameters for <strong>the</strong> i-th layer asζ i = |a ii | 2 ,ξ i = ∑ |a ij | 2 , ψ i =j≠iν∑ν∑|b ik | 2 , θ i,l = |c l,i,m | 2 , (3.9)k=1m=1where for each layer i, ζ i represents <strong>the</strong> fraction <strong>of</strong> P L going to <strong>the</strong> signal part <strong>of</strong><strong>the</strong> SINR, ξ i <strong>the</strong> inter-layer interference, ψ i <strong>the</strong> noise enhancement, <strong>and</strong> θ i,l <strong>the</strong>interference from <strong>the</strong> l-th interfering eNodeBs.To fur<strong>the</strong>r ease <strong>the</strong> L2S modeling, <strong>the</strong> fading experienced by <strong>the</strong> transmitted signalis decomposed into a macro-scale loss <strong>and</strong> a small-scale loss. The average receivesignal power between <strong>the</strong> t-th transmit antenna <strong>and</strong> <strong>the</strong> r-th receive antenna (P r,t )is thus expressed by <strong>the</strong> following link budget:P r,t}{{}receivedpower= |h r,t | 2} {{ }small-scalefading· L shadow · L pathloss · G antenna} {{ }macro-scalefading· P TX /N} {{ TX}. (3.10)per-antennatransmit powerIn Equation (3.10), <strong>the</strong> transmit power P t is scaled by <strong>the</strong> following factors:ˆ G antenna : Antenna directivity. An analytical or measured radiation pattern that30
3. Physical Layer <strong>Modeling</strong> <strong>and</strong> <strong>LTE</strong> <strong>System</strong> <strong>Level</strong> Simulationcan be ei<strong>the</strong>r a 2D or a 3D pattern. In <strong>the</strong> last case, it combines a horizontal <strong>and</strong>vertical component with an optional mechanical/electrical tilt [79].ˆ L pathloss : A distance-dependent pathloss between <strong>the</strong> transmitter <strong>and</strong> <strong>the</strong> receiver.ˆ L shadow : Shadow fading, which models slow-changing deviations from <strong>the</strong> averagepathloss values that model irregularities such as geographical features. Modeledas a zero-mean space-correlated lognormal distribution.ˆ |h r,t | 2 : Assumed to be a χ 2 distribution with a number <strong>of</strong> degrees <strong>of</strong> freedom N<strong>of</strong> two, as <strong>the</strong> underlying distribution <strong>of</strong> h is assumed to be circular symmetriccomplex normal with an average power <strong>of</strong> one.As <strong>the</strong> macro-scale parameters are scalars applied to all <strong>of</strong> <strong>the</strong> entries <strong>of</strong> <strong>the</strong> MIMOchannel matrix, it can be trivially decomposed into a normalized 3 channel matrix Hmultiplied by <strong>the</strong> factors L pathloss , L shadow , <strong>and</strong> G antenna . Applying <strong>the</strong> link budget<strong>of</strong> Equation (3.10) to Equation (3.9) we can rewrite Equation (3.9), expressing <strong>the</strong>subcarrier post-equalization SINR for layer i asγ i =ζ i P ′ L,0ξ i P ′ L,0 + ψ iσ 2 n +N int ∑m=1θ i,m P ′ L,m, (3.11)where PL,m ′ = P L,m · G antenna,m · L pathloss,m · L shadown,m , <strong>and</strong> <strong>the</strong> index m denotes <strong>the</strong>transmitting eNodeB (m = 0 for <strong>the</strong> target transmitter <strong>and</strong> m = 1, . . . , N int for <strong>the</strong>interferers).Decomposing <strong>the</strong> combined fading experienced over <strong>the</strong> link into a slowly-changingposition-dependent macro-scale component <strong>and</strong> a faster-changing small-scale [80]enables to model <strong>the</strong> fading as two separate <strong>of</strong>fline-computable components: oneposition-dependent <strong>and</strong> one time-dependent.3.1.1.2. On <strong>the</strong> <strong>Modeling</strong> <strong>of</strong> OLSM <strong>and</strong> <strong>the</strong> Block Fading AssumptionOver <strong>the</strong> course <strong>of</strong> this chapter, it has been stressed that block fading is assumed,i.e., unchanging channel conditions for <strong>the</strong> duration <strong>of</strong> a TTI, <strong>and</strong> this assumptionis applied to <strong>the</strong> calculation <strong>of</strong> <strong>the</strong> post-equalization SINR in Section 3.1.1.1.However, it is clearly mentioned in Section 2.2.1.2 that <strong>the</strong> OLSM transmit mode isbased on cyclically applying a set <strong>of</strong> precoders, as well as a shift <strong>of</strong> <strong>the</strong> signal, to eachmodulated symbol during one TTI. Thus, even if a constant channel is considered,<strong>the</strong> effective channel, i.e., <strong>the</strong> combination <strong>of</strong> <strong>the</strong> channel <strong>and</strong> <strong>the</strong> precoder is notconstant during a TTI due to <strong>the</strong> applied CDD <strong>and</strong> cyclical precoding.3 Through <strong>the</strong> course <strong>of</strong> this <strong>the</strong>sis, a normalized channel matrix refers to one in which all <strong>of</strong> itsentries have a mean power <strong>of</strong> one.31
3. Physical Layer <strong>Modeling</strong> <strong>and</strong> <strong>LTE</strong> <strong>System</strong> <strong>Level</strong> SimulationFor <strong>the</strong> two transmit antenna case, <strong>the</strong> precoder set consists <strong>of</strong> a single precoder,<strong>and</strong> only two possible values for D are possible. For <strong>the</strong> L2S model, <strong>and</strong> for <strong>the</strong> sake<strong>of</strong> simplicity, <strong>the</strong> time-variability <strong>of</strong> D has been discarded, thus effectively obtaininga block fading scenario.However, for <strong>the</strong> case <strong>of</strong> four transmit antennas, <strong>the</strong> precoder set consists <strong>of</strong> fourprecoders, with <strong>the</strong> added three or four (for three <strong>and</strong> four layers, respectively)possibilities for D. To take into account <strong>the</strong> use <strong>of</strong> multiple precoders, for eachsubcarrier sample, a different precoder is assigned, such that <strong>the</strong> employed precoderW is <strong>the</strong> i-th one in <strong>the</strong> precoder set, where i = mod (subcarrier index, 4). As in<strong>the</strong> prior case, D is is treated as constant.The impact <strong>of</strong> <strong>the</strong>se simplifications in <strong>the</strong> accuracy <strong>of</strong> <strong>the</strong> link abstraction modelcompared to link level results is shown in Section 3.2.1. Results show that, althoughas expected model accuracy for <strong>the</strong> OLSM mode with four transmit antennas isworse than that obtained with <strong>the</strong> o<strong>the</strong>r modes/antenna configurations, significantthroughput degradation is limited to <strong>the</strong> high-SNR 4×2 case.3.1.1.3. Channel Trace GenerationFrom <strong>the</strong> decomposition <strong>of</strong> <strong>the</strong> channel in a small-scale fading component H <strong>and</strong> amacro-scale component, it becomes possible to precompute <strong>the</strong> fading parameters ζ,ξ, ψ, <strong>and</strong> θ <strong>of</strong>fline from a normalized channel matrix H, a task <strong>of</strong> high computationalcost due to <strong>the</strong> involved complex-valued matrix multiplications <strong>and</strong> inversions. Atrun time, only simple scalar multiplications will <strong>the</strong>n be needed, significantly reducingcomplexity compared to link level simulations.Fur<strong>the</strong>r decreasing complexity, individual traces for each <strong>of</strong> <strong>the</strong> links can be obtainedby choosing independent r<strong>and</strong>om starting points from a single trace. As long as <strong>the</strong>original trace is <strong>of</strong> sufficient length, <strong>the</strong> individual sub-traces can be assumed to beindependent [74].As noted in Section 3.1.1.1, H refers to <strong>the</strong> effective channel matrix. While for <strong>the</strong>TxD mode this represents no change in terms <strong>of</strong> additional complexity 4 , for <strong>the</strong>OLSM <strong>and</strong> CLSM modes, fur<strong>the</strong>r complexity due to <strong>the</strong> rank (OLSM <strong>and</strong> CLSM)<strong>and</strong> precoder selection (CLSM) is present.The trace generation for CLSM is detailed below. As OLSM can be considered asimplified case <strong>of</strong> CLSM with no PMI feedback (although with <strong>the</strong> addition <strong>of</strong> CDD),<strong>the</strong> CLSM trace generation procedure applies also for <strong>the</strong> OLSM case.4 As all <strong>of</strong> <strong>the</strong> layers will experience <strong>the</strong> same fading due to <strong>the</strong> STBC, only a one-layer trace needsto be stored.32
3. Physical Layer <strong>Modeling</strong> <strong>and</strong> <strong>LTE</strong> <strong>System</strong> <strong>Level</strong> SimulationAs detailed in Section 2.2.1.3, a UE reporting feedback in <strong>the</strong> CLSM mode willreport <strong>the</strong> PMI-RI combination that maximizes its throughput, <strong>and</strong> will employfor <strong>the</strong> feedback calculation <strong>the</strong> estimated channel matrix calculated from <strong>the</strong> pilotsymbols transmitted by <strong>the</strong> eNodeB.For each RI choice, <strong>and</strong> as shown in Appendix A, <strong>the</strong> optimum PMI <strong>and</strong> RI canbe calculated <strong>of</strong>fline indepenently <strong>of</strong> <strong>the</strong> SNR. However, as <strong>the</strong> RI is wideb<strong>and</strong> <strong>and</strong>not RB-wise, it needs to be calculated at run-time to optimize <strong>the</strong> sum capacityover <strong>the</strong> whole b<strong>and</strong>width or part <strong>of</strong> it. The latter setup allows <strong>the</strong> model to dealwith cases where <strong>the</strong> total b<strong>and</strong>width is partitioned, such as in Fractional FrequencyReuse (FFR).The channel trace memory requirements are as follow: <strong>the</strong> fading parameters arestored for each TTI (block fading), thus resulting in four scalars per TTI, layeroption, <strong>and</strong> subcarrier sample. As <strong>the</strong> parameters ζ <strong>and</strong> ξ are known to be one <strong>and</strong>zero, respectively, due to <strong>the</strong> ZF receiver <strong>and</strong> perfect channel knowledge assumption,<strong>the</strong>y can be omitted from <strong>the</strong> trace, effectively halving <strong>the</strong> trace size.Assuming single-precision floating-point scalars, <strong>the</strong> memory requirements per TTI<strong>and</strong> RB, denoted as B TTI,RB , areB TTI,RB =ν∑maxν=1⎛⎝ν · }{{} 32 · }{{} 232 bits/scalar· }{{} 2✁❆ ζ, ✁❆ ξ,ψ,θ2 samples/RB⎞⎠ , (3.12)where ν are all <strong>of</strong> <strong>the</strong> possible rank choices, from one to ν max = min (N TX , N RX ).For each <strong>of</strong> <strong>the</strong> two required parameters ψ <strong>and</strong> θ, two values/RB are stored, eachrequiring 32 bits <strong>of</strong> memory are required in single-precision floating point, reflectedon <strong>the</strong> parameters in Equation (3.12). Although <strong>the</strong> optimum precoder choice is precalculated,at run time <strong>the</strong> rank choice has still to be performed. Thus, <strong>the</strong> channeltrace includes values for each <strong>of</strong> <strong>the</strong> ν max rank possibilites. For <strong>the</strong> calculation <strong>of</strong> <strong>the</strong>optimum precoder, a mutual-information-maximizing algorithm is employed [51, 54].Table 3.2 lists <strong>the</strong> channel trace memory requirements per second <strong>of</strong> stored trace for<strong>the</strong> b<strong>and</strong>widths defined in <strong>the</strong> <strong>LTE</strong> st<strong>and</strong>ard.Table 3.2.: Channel trace memory requirements in MByte per second <strong>of</strong> stored trace[MByte/s] for several <strong>LTE</strong> antenna <strong>and</strong> channel b<strong>and</strong>width configurations.min (N TX , N RX )Channel b<strong>and</strong>width [MHz]1.4 3 5 10 15 201 0.73 1.83 3.05 6.10 9.16 12.212 2.20 5.49 9.16 18.31 27.47 36.624 7.32 18.31 30.52 61.04 91.55 122.0733
3. Physical Layer <strong>Modeling</strong> <strong>and</strong> <strong>LTE</strong> <strong>System</strong> <strong>Level</strong> Simulation3.1.1.4. Macro-scale FadingThe distance-dependent macro-scale fading parameters can be precomputed <strong>of</strong>fline<strong>and</strong> stored on a pixel map with a given resolution <strong>of</strong> p m/pixel, thus each pixelrepresenting a square <strong>of</strong> p × p meters in <strong>the</strong> simulated ROI. The stored pathlossvalues are <strong>the</strong>n applied at run time accordingly depending on <strong>the</strong> positions <strong>of</strong> <strong>the</strong>transmitter, receiver, <strong>and</strong> interferers. As listed in Section 3.1.1.1, <strong>the</strong> time-invariant<strong>and</strong> position-dependent macro-scale parameters are <strong>the</strong> pathloss, antenna gain, <strong>and</strong>shadow fading.For <strong>the</strong> pathloss <strong>and</strong> antenna gain, typical scenarios <strong>and</strong> models are already wellknown <strong>and</strong> applied in st<strong>and</strong>ardized simulation scenarios for <strong>LTE</strong> [69].The st<strong>and</strong>ard 2D radiation pattern G, dependent on <strong>the</strong> azimuth angle θ is[ ( )]θG (θ) = − min 1265 ◦ , 20 dB , where − 180 ◦ ≤ θ ≤ 180 ◦ , (3.13)with an antenna gain <strong>of</strong> 15 dB. Although <strong>the</strong> radiation pattern <strong>of</strong> any real antenna,such as <strong>the</strong> pattern shown in Figure 3.6 (right) can also alternatively be employed.Pathloss [dB]1501301109070500 500 1000 1500 2000 2500 3000 3500Distance [m]120° 0-390°60°150° -630°-9180°dBi -120°210°240°270°300°330°Figure 3.6: Left: Urban pathloss (2 000 MHz, 15 m base station antenna height over ro<strong>of</strong>top),as <strong>of</strong> [69]. Right: measured horizontal/vertical antenna radiation pattern froma KATHREIN 742212 antenna with no electrical tilt.For <strong>the</strong> pathloss, known models already exist, such as [69, 81–83]. The followingformula models <strong>the</strong> pathloss, denoted as L, for an urban or suburban area outside<strong>of</strong> <strong>the</strong> high-rise core [69], <strong>and</strong> is commonly employed in literature for system levelsimulations:L = 40 · (1− 4 · 10 −3 )· M TX · log10 (R) − 18 · log 10 (M TX ) + 21 · log 10 (f) + 80 dB,(3.14)where M TX is <strong>the</strong> antenna pole height in meters, as measured from <strong>the</strong> averagero<strong>of</strong>top level, R is <strong>the</strong> base station-UE separation in kilometers, <strong>and</strong> f is <strong>the</strong> carrierfrequency in MHz.34
3. Physical Layer <strong>Modeling</strong> <strong>and</strong> <strong>LTE</strong> <strong>System</strong> <strong>Level</strong> SimulationFor an example case considering a carrier frequency <strong>of</strong> 2 000 MHz <strong>and</strong> a base stationantenna height <strong>of</strong> 15 m above average ro<strong>of</strong>top level, <strong>the</strong> propagation model formulais simplified to <strong>the</strong> well known formula [69]L = 128.1 + 37.6 · log 10 (R) , (3.15)which is shown in Figure 3.6 (left).Combining <strong>the</strong> pathloss, antenna gain, <strong>and</strong> Minimum Coupling Loss (MCL) 5 , aposition-dependant macro-scale fading map depicting <strong>the</strong> losses from a given transmittersuch as that in Figure 3.7 (left) can be obtained. The cell partitioning can bevisualized by plotting <strong>the</strong> wideb<strong>and</strong> SINR <strong>of</strong> <strong>the</strong> strongest signal on each point, denotedas Γ <strong>and</strong> not to be confused with <strong>the</strong> post-equalization SINR. The wideb<strong>and</strong>SINR, depicted in Figure 3.6 (right), is calculated asΓ = G antenna L macro,0 P TX0. (3.16)N∑intσn 2 + L macro,l P TXmm=1The wideb<strong>and</strong> SINR, also when applicable including shadow fading, can be employedas a measure <strong>of</strong> how close a UE is to <strong>the</strong> transmit antenna relative to <strong>the</strong> interferers,<strong>and</strong> is employed as such over <strong>the</strong> course <strong>of</strong> this <strong>the</strong>sis, especially in Chapter 5.y pos [m]pathloss [dB]10008006004002000−200−400−600−800−1000−1000 −500 0 500 1000x pos [m]18016014012010080cell SINR [dB]−1000 −500 0 500 1000x pos [m]20151050−5Figure 3.7: Left: pathloss <strong>and</strong> antenna gain map in dB. Pathloss <strong>and</strong> antenna gain as inEquation (3.15) <strong>and</strong> Figure 3.6. Antenna gain <strong>of</strong> 15 dBi. Right: resulting cellwideb<strong>and</strong> SINR in dB.5 The MCL describes <strong>the</strong> minimum loss in signal between eNodeB <strong>and</strong> UE or UE <strong>and</strong> UE in <strong>the</strong>worst case <strong>and</strong> is defined as <strong>the</strong> minimum distance loss including antenna gains measured betweenantenna connectors. [69] defines it as 70 dB for urban cell deployments <strong>and</strong> 80 dB for rural celldeployments.35
3. Physical Layer <strong>Modeling</strong> <strong>and</strong> <strong>LTE</strong> <strong>System</strong> <strong>Level</strong> Simulation3.1.1.5. Shadow FadingShadow fading is modeled to represent <strong>the</strong> deviations from <strong>the</strong> average pathloss valuesdue to geographical features such as terrain changes or buildings. It is generallymodeled as a log-normal distribution with zero mean, which although could also betreated as a time-dependent process, is preferable to treat as position-dependent dueto <strong>the</strong> convenience <strong>of</strong> storing it in map form.A typical st<strong>and</strong>ardized cell layout sets a log-normal distribution with a st<strong>and</strong>arddeviation <strong>of</strong> 10 dB, as well as an inter-site correlation <strong>of</strong> 0.5 [69]. Since <strong>the</strong> shadowfading is interpreted as geographical variations, as sectors share <strong>the</strong> same site (i.e.,geographical location), an inter-sector correlation factor <strong>of</strong> one is assumed.In order to introduce spatial correlation to <strong>the</strong> points on each map, a method basedon <strong>the</strong> Cholesky decomposition <strong>of</strong> <strong>the</strong> correlation matrix R is employed. Thismethods allows us to introduce spatial correlation to an uncorrelated log-normallydistributedvector.Given an initial vector a <strong>of</strong> length K with a correlation matrix R a = E { aa H}equal to <strong>the</strong> identity matrix <strong>of</strong> size K (I K ), a correlated vector s with a predefinedcorrelation matrix R s can be obtained by performings = L s a, (3.17)where L s is <strong>the</strong> lower-triangular Cholesky decomposition <strong>of</strong> R s <strong>and</strong> <strong>the</strong> correlationmatrix <strong>of</strong> s is E { ss H} = L s L H s = R s .The values <strong>of</strong> <strong>the</strong> correlation coefficients in R s follow an exponential model wherecorrelation diminishes with distance, expressed as r(x) = e −αx [84, 85], with <strong>the</strong>distance x in meters, <strong>and</strong> a typical value for α <strong>of</strong> 1/20 [86].As with <strong>the</strong> pathloss map, <strong>the</strong> shadow fading map is stored as pixels, with eachpixel representing a square <strong>of</strong> p × p meters. Thus, for a map <strong>of</strong> size M × N pixels,a correlation matrix <strong>of</strong> size M · N × M · N is required. As an example, <strong>the</strong> pathlossmap in Figure 3.7 encompasses an area <strong>of</strong> 2 080 × 2 402 m, with a resolution <strong>of</strong>5 m/pixel, resulting in a 416 × 481 matrix. The resulting correlation matrix wouldbe 200 096 × 200 096, requiring around 300 GB <strong>of</strong> memory for <strong>the</strong> correlation matrixR s alone assuming double-precision storage (8 bytes/value).In order to reduce complexity, an extension <strong>of</strong> <strong>the</strong> method proposed in [87] is employed.In order to calculate <strong>the</strong> value <strong>of</strong> <strong>the</strong> space-correlated value s n , just a set<strong>of</strong> neighboring pixels is taken into account. Since <strong>the</strong> correlated pixels have to begenerated following a certain order, only <strong>the</strong> previously processed pixels are takeninto account for <strong>the</strong> calculation <strong>of</strong> s n . For a neighbor count <strong>of</strong> 12 <strong>and</strong> a row-wiseprocessing order, <strong>the</strong> set <strong>of</strong> neighboring pixels s n−1 . . . s n−12 is depicted in Figure 3.836
3. Physical Layer <strong>Modeling</strong> <strong>and</strong> <strong>LTE</strong> <strong>System</strong> <strong>Level</strong> Simulationfor <strong>the</strong> case <strong>of</strong> n = 13. Starting from an uncorrelated set a, a correlated set s with acorrelation matrix close to R s can be obtained, with <strong>the</strong> correlation difference beingdue to taking into account <strong>the</strong> closest pixels instead <strong>of</strong> <strong>the</strong> whole map..........Figure 3.8: Generation <strong>of</strong> <strong>the</strong> space-correlated shadow fading map values (s) from uncorrelatedvalues (a) for n = 13. Based on <strong>the</strong> previously-calculated correlated valuess 1 -s 12 , a value s 13 that satisfies <strong>the</strong> correlation matrix R s is obtained.As in [87], we define <strong>the</strong> vector ˜s containing <strong>the</strong> already-processed neighbor positionss 1 . . . s 12 , which have a correlation matrix ˜R. For s = L s a to be satisfied,] [˜L −1s ˜ss = L s . (3.18)a nAs <strong>the</strong> value we are interested in is s n (s n−1 . . . s n−12 have already been obtained),just <strong>the</strong> last row <strong>of</strong> L is needed. Denoting it as λ n , s n can be expressed ass n = λ T n] [˜L −1s ˜s, (3.19)a nfollowed by an additional re-normalization step <strong>of</strong> s with a factor σ a /σ s in order tore-scale <strong>the</strong> power <strong>of</strong> <strong>the</strong> distribution.The actual values <strong>of</strong> <strong>the</strong> correlation matrix R s can be found in Appendix B.In order to additionally introduce inter-site correlation, for <strong>the</strong> K sites, a ′ 1 . . . a′ Kinitial log-normal uncorrelated maps are generated, plus an extra set a ′ 0 .Given a fixed inter-site correlation factor r site , <strong>the</strong> inter-correlated but spatiallyuncorrelatedmaps a i can be obtained asa i = √ r site a ′ 0 + (1 − √ r site ) a ′ i. (3.20)A resulting shadow fading map is depicted in Figure 3.9, as well as <strong>the</strong> resulting cellwideb<strong>and</strong> SINR after combination with <strong>the</strong> pathloss <strong>and</strong> antenna gain macro-scalefading parameters. A st<strong>and</strong>ard deviation <strong>of</strong> σ = 10 dB is employed.The depicted shadow fading map in Figure 3.9 (left) is one <strong>of</strong> <strong>the</strong> 19 maps (1map/site) generated for a system level simulation scenario. They are generated37
3. Physical Layer <strong>Modeling</strong> <strong>and</strong> <strong>LTE</strong> <strong>System</strong> <strong>Level</strong> Simulationy pos [m]shadow fading [dB]10008006004002000−200−400−600−800−1000−1000 −500 0 500 1000x pos [m]403020100−10−20−30−40cell SINR [dB]−1000 −500 0 500 1000x pos [m]20151050−5Figure 3.9: Left: shadow fading map in dB (µ = 0 dB, σ = 10 dB). Zommed: detail <strong>of</strong> <strong>the</strong>introduced spatial correlation. Right: resulting cell wideb<strong>and</strong> SINR in dB.employing <strong>the</strong> 12-neighbor correlation matrix in Appendix B <strong>and</strong> an inter-site correlation<strong>of</strong> 0.5. Despite <strong>the</strong> introduced spatial correlation, <strong>the</strong> overall log-hormaldistribution <strong>of</strong> each map is not altered. Figure 3.10 depicts <strong>the</strong> overlapped pdfs <strong>of</strong>each <strong>of</strong> <strong>the</strong> 19 shadow fading maps (in black), compared to <strong>the</strong> analytical pdf. Theright plot depicts <strong>the</strong> inter-site correlation matrix, with (excluding <strong>the</strong> diagonal) amean value <strong>of</strong> 0.5009 dB <strong>and</strong> a st<strong>and</strong>ard deviation <strong>of</strong> <strong>the</strong> mean values <strong>of</strong> 0.0042 dB.0.050.040.030.020.01Normal distributionCorrelated shadow fading maps0−60 −40 −20 0 20 40 60shadow fading [dB]246810121416182 4 6 8 10 12 14 16 1810.950.90.850.80.750.70.650.60.550.5Figure 3.10: Left: comparison <strong>of</strong> <strong>the</strong> pdf <strong>of</strong> <strong>the</strong> obtained shadow fading maps in dB witha normal distribution with µ = 0 dB, σ = 10 dB. Right: inter-site correlationmatrix.3.1.2. Link Performance ModelThe channel quality measure output by <strong>the</strong> link quality model serves as input to <strong>the</strong>link performance model. As detailed in Section 3.1.1 <strong>and</strong> depicted in Figure 3.5, asubset <strong>of</strong> <strong>the</strong> subcarrier post-equalization SINRs parametrize <strong>the</strong> channel conditionson a per-spatial-layer basis.For <strong>the</strong> RB set in which <strong>the</strong> UE is scheduled (if scheduled), <strong>the</strong> link performance38
3. Physical Layer <strong>Modeling</strong> <strong>and</strong> <strong>LTE</strong> <strong>System</strong> <strong>Level</strong> Simulationmodel combines <strong>the</strong> output <strong>of</strong> <strong>the</strong> link quality model with that <strong>of</strong> <strong>the</strong> applied modulationorder <strong>and</strong> code rate <strong>and</strong> predicts <strong>the</strong> BLER <strong>of</strong> <strong>the</strong> received TB. Ultimately,given this frame error probability, <strong>the</strong> successful or erroneous receiving <strong>of</strong> <strong>the</strong> TB isr<strong>and</strong>omly decided via a coin toss corresponding to <strong>the</strong> BLER probability. Combinedwith <strong>the</strong> TB size throughput is <strong>the</strong>n determined, as depicted in Figure 3.11.throughputlink quality model......link performance modelBLERsubcarrier SINR vectormodulation & code rateallocated RBsTB sizeFigure 3.11: Link performance model. The output <strong>of</strong> <strong>the</strong> link quality model is combined withinformation regarding <strong>the</strong> allocated RBs, <strong>and</strong> <strong>the</strong> employed modulation/coderate.The SINR-to-BLER mapping comprises an (n + 1)-dimensional mapping <strong>of</strong> n postequalizationsubcarrier SINRs values (γ 1 , . . . , γ n ) <strong>and</strong> <strong>the</strong> modulation <strong>and</strong> codingemployed to a single BLER value.While <strong>the</strong>oretically possible, it is in practice unfeasibly complex to obtain a mappingtable <strong>of</strong> <strong>the</strong> possible combinations <strong>of</strong> <strong>the</strong> n SINR values to a BLER value for eachMCS. Additionally, <strong>the</strong> length <strong>of</strong> γ varies depending on <strong>the</strong> number <strong>of</strong> RBs scheduledto <strong>the</strong> UE, with a maximum value restricted by <strong>the</strong> <strong>LTE</strong> channel b<strong>and</strong>width (seeTable 3.1).Over time, several methods to first map <strong>the</strong> sub-carrier post-equalization SINRvector, denoted as γ to an effective SINR value (γ eff ) have been proposed [88–91].While different names, such as Actual Value Interface (AVI) <strong>and</strong> Effective SINRMapping (ESM) exist, both relate to <strong>the</strong> same concept <strong>of</strong> mapping γ to an effectiveSINR value γ eff .In order to compress <strong>the</strong> SINR vector γ into a single value γ eff , Mutual InformationEffective SINR Mapping (MIESM) [90, 91] is employed, as it does not require an empiricalcalibration step such as previous methods as long as codes that perform closeto capacity are employed. The non-linear ESM averaging <strong>of</strong> MIESM is expressed asγ eff = I −1k(1N)N∑I k (γ n ) , (3.21)where N is <strong>the</strong> length <strong>of</strong> <strong>the</strong> SINR vector <strong>and</strong> I k <strong>the</strong> BICM capacity for <strong>the</strong> chosenmodulation at <strong>the</strong> given value γ n . The BICM capacity (I k ) for a modulationn=139
3. Physical Layer <strong>Modeling</strong> <strong>and</strong> <strong>LTE</strong> <strong>System</strong> <strong>Level</strong> Simulationencoding k bits per symbol [92] is expressed as⎧⎪⎨1I k (γ) = k − Ek⎪⎩k∑i=1 b=0 z∈Xbi∑1∑ ∑ˆx∈Xlog ∑˜x∈X i bexp(− |Y − √ γ (ˆx − z)| 2)⎫⎪ ⎬exp(− |Y − √ γ (˜x − z)| 2) , (3.22)⎪ ⎭where X is <strong>the</strong> set <strong>of</strong> 2 k constellation symbols, Xb i is <strong>the</strong> set <strong>of</strong> symbols for which biti equals b <strong>and</strong> Y is complex normal with zero mean <strong>and</strong> unit variance. Figure 3.12(left), depicts <strong>the</strong> BICM capacity curves for <strong>the</strong> 4-, 16-, <strong>and</strong> 64-QAM modulationsemployed in <strong>LTE</strong>.Thus, MIESM effectively averages <strong>the</strong> subcarriers in <strong>the</strong> MI domain <strong>and</strong> <strong>the</strong>n remaps<strong>the</strong> average MI value to SINRThe main limitation <strong>of</strong> this method is that all <strong>of</strong> <strong>the</strong> subcarriers in a TB need toemploy <strong>the</strong> same modulation alphabet, which is fulfilled in <strong>the</strong> case <strong>of</strong> <strong>LTE</strong> transmissions[39, 45, 53].The effective SINR (γ eff ) is <strong>the</strong>n mapped by means <strong>of</strong> an AWGN BLER curve <strong>of</strong><strong>the</strong> corresponding MCS to a BLER value. The AWGN BLER curves, obtained from<strong>LTE</strong> link level simulations, are shown in Figure 3.12 (right).Mutual Information [bit/cu]65432164-QAM16-QAM4-QAM0−20 −10 0 10 20 30SNR [dB]MCS 1MCS 2MCS 3BLER10 −110 −210 −3−10 −5 0 5SNR10[dB]15 20 2510 04-QAM 16-QAM 64-QAMMCS 4 MCS 7 MCS 10 MCS 13MCS 5 MCS 8 MCS 11 MCS 14MCS 6 MCS 9 MCS 12 MCS 15Figure 3.12: Left: BICM capacity curves for <strong>the</strong> 4-, 16-, <strong>and</strong> 64-QAM modulations employedin <strong>LTE</strong>. Right: AWGN SNR-to-BLER curves for <strong>the</strong> 15 MCSs defined inTable 2.5.With <strong>the</strong> presented L2S interface, <strong>the</strong> link between link level simulations <strong>and</strong> <strong>the</strong>model applied at system level is reduced to simple precomputed AWGN BLERcurves for each <strong>of</strong> <strong>the</strong> employed MCSs.The AWGN-equivalent γ eff represents an average SINR <strong>of</strong> <strong>the</strong> SINR vector γ interms <strong>of</strong> MI, thus avoiding <strong>the</strong> need for a multi-dimensional SINR mapping, as well40
3. Physical Layer <strong>Modeling</strong> <strong>and</strong> <strong>LTE</strong> <strong>System</strong> <strong>Level</strong> Simulationproblems related to <strong>the</strong> variable-length <strong>of</strong> γ due to <strong>the</strong> RB scheduling assignmentor <strong>the</strong> b<strong>and</strong>width configuration. As a result, 15 AWGN link level simulations, onefor each <strong>of</strong> <strong>the</strong> defined MCSs <strong>and</strong> each outputting an AWGN SNR-to-BLER curve,are <strong>the</strong> only computationally costly link level simulations required for <strong>the</strong> <strong>LTE</strong> L2Smodel. The full structure <strong>of</strong> <strong>the</strong> link performance model for <strong>the</strong> <strong>LTE</strong> L2S model isdepicted in Figure 3.13.subcarrier SINR vectorlink performance modelthroughputlink qualitymodel......discardunallocatedsubcarriers...SINRcompresion(MIESM)AWGNBLERcurvesBLERallocated RBsmodulationcode rateTB sizeFigure 3.13: Link performance model for <strong>the</strong> <strong>LTE</strong> L2S model detailing <strong>the</strong> SINR compressionstep in <strong>the</strong> link performance model.3.2. Link-to-<strong>System</strong> Model ValidationThe objective <strong>of</strong> <strong>the</strong> link quality <strong>and</strong> link performance models, detailed in Sections3.1.1 <strong>and</strong> 3.1.2, respectively, is to provide an accurate link throughput predictionwhich is fading-independent, <strong>and</strong> which requires <strong>of</strong> only <strong>the</strong> input <strong>of</strong> anAWGN mapping. This link-to-system structure [73] is applied to <strong>LTE</strong> MIMO transmissionsemploying a ZF receiver. With a negligible loss <strong>of</strong> accuracy, <strong>the</strong> morecomputationally-intensive MIMO precoder feedback is additionally performed <strong>of</strong>fline,speeding-up simulation run-time, as detailed in Appendix A.As accurate link abstraction models are laborious to design <strong>and</strong> implement, it iscommon to employ much simpler link abstraction models for system level simulation,such as capacity-based model suggested in <strong>the</strong> <strong>LTE</strong> st<strong>and</strong>ard [69]. Unless <strong>the</strong> focusis on link abstraction, it is <strong>of</strong>ten preferred to employ <strong>the</strong>se much simpler capacitybasedSNR-to-throughput mappings (in full or scaled <strong>and</strong>/or truncated form), suchas in <strong>the</strong> cases <strong>of</strong> [93–95] (more focused on upper-layer protocols) <strong>and</strong> [96] (focusedon h<strong>and</strong>over).As a throughput approximation for link abstraction purposes, [69] suggests to employan approximation <strong>of</strong> <strong>the</strong> throughput obtained by means <strong>of</strong> AMC over an AWGN41
3. Physical Layer <strong>Modeling</strong> <strong>and</strong> <strong>LTE</strong> <strong>System</strong> <strong>Level</strong> Simulationchannel by scaling <strong>and</strong> truncating <strong>the</strong> Shannon formula so that⎧0, γ < −10 dB⎪⎨C Shannon (γ) = 0.75 log 2 (1 + γ) , −10 dB < γ < 17 dB , (3.23))⎪⎩ max(C AWGN , γ > 17 dB)where γ is <strong>the</strong> SNR <strong>and</strong> max(C AWGN<strong>the</strong> maximum spectral efficiency from aSingle-Input Single-Output (SISO) AWGN <strong>LTE</strong> link level simulation with AMC.Figure 3.14 depicts (from top to bottom) <strong>the</strong> difference in spectral efficiency betweenthat <strong>of</strong> <strong>the</strong> unscaled, untruncated Shannon formula; <strong>the</strong> proposal in [69]; thatobtained from single-user AWGN simulations with AMC; <strong>and</strong> that obtained on amore realistic frequency-selective ITU Pedestrian-A (5 km/h) channel [97].spectral efficiency [bit/s/Hz]10987654321Shannon capacityTruncated Shannon capacityTruncated Shannon capacityAWGN with AMCPed-A, 5Km/h with AMC0−10 −5 0 5 10 15 20 25 30SNR [dB]Figure 3.14: SNR-to-throughput mapping according to several assumptions <strong>and</strong> comparedto Pedestrian-B 5 km/h results.The results in Figure 3.14 depict <strong>the</strong> obvious statement that, in order to fit <strong>the</strong>Shannon capacity curve to more realistic channel conditions, ad hoc scaling <strong>and</strong>calibration <strong>of</strong> it for each specific channel characteristics are needed if significantdeviations are to be avoided.Thus, <strong>the</strong> first verification step <strong>of</strong> <strong>the</strong> link abstraction model is whe<strong>the</strong>r <strong>the</strong> throughput<strong>of</strong> a frequency-selective channel can be accurately modeled by means <strong>of</strong> <strong>the</strong> L2Smodel, when compared to link level results 6 .6 In order to make comparisons <strong>of</strong> simulation run time meaningful, all <strong>of</strong> <strong>the</strong> simulations have beenperformed on <strong>the</strong> same hardware, a six-core single-CPU Intel Core i7-3930K@3.20 GHz, equippedwith 32 GB <strong>of</strong> DDR3 1333 quad-channel RAM, with simulations making use <strong>of</strong> parfor parallelexecution via <strong>the</strong> Matlab Parallel Toolbox when possible.42
3. Physical Layer <strong>Modeling</strong> <strong>and</strong> <strong>LTE</strong> <strong>System</strong> <strong>Level</strong> Simulation3.2.1. Interference-freeIn <strong>the</strong> first step <strong>of</strong> verification <strong>of</strong> <strong>the</strong> L2S model, a single-cell scenario is considered.This case is equivalent to a throughput evaluation over an SNR range, <strong>and</strong> aims atreproducing a typical link level simulation. As in Section 3.2.2, results obtained with<strong>the</strong> Vienna <strong>LTE</strong> system level simulator [78], which implements <strong>the</strong> presented linkabstraction model, are compared with link level results obtained with <strong>the</strong> Vienna<strong>LTE</strong> link level simulator [98].In this scenario, we compare <strong>the</strong> throughput performance <strong>of</strong> different <strong>LTE</strong> transmissionmodes <strong>and</strong> antenna configurations over a range <strong>of</strong> SNRs, such as in [67, 99],performed both by means <strong>of</strong> link level simulations <strong>and</strong> system level simulations.In <strong>LTE</strong>, <strong>the</strong> data subcarriers are recovered after a Fast Fourier Transform (FFT),discarding <strong>the</strong> adjacent guard b<strong>and</strong> subcarriers, including any noise <strong>the</strong>re. As <strong>the</strong>proportion <strong>of</strong> guard b<strong>and</strong> subcarriers is not constant over <strong>the</strong> range <strong>of</strong> possible <strong>LTE</strong>b<strong>and</strong>widths (see Table 2.3), employing a pre-FFT SNR would make <strong>the</strong> allocatedb<strong>and</strong>width a parameter to take into account when comparing SNR results. Thus,<strong>the</strong> choice <strong>of</strong> employing a post-FFR SNR, denoted as γ post-FFT , which directly refersto <strong>the</strong> SNR level <strong>of</strong> <strong>the</strong> data subcarriers (here denoted for a single subcarrier):{NFFTγ post-FFT = EN toty H yN RX σ 2 n}= N FFT 1N tot σn2 , (3.24)where N FFT are <strong>the</strong> total number <strong>of</strong> <strong>LTE</strong> subcarriers (including b<strong>and</strong>guard), N tot<strong>the</strong> number <strong>of</strong> data subcarriers, <strong>and</strong> σ 2 n <strong>the</strong> mean noise power per receive antenna,<strong>and</strong> y <strong>the</strong> received signal, as in Equation (3.2).In order to reproduce an SNR range with system level simulations, a single cell isplaced, <strong>and</strong> a decreasing SNR value is accomplished by positioning <strong>the</strong> UE far<strong>the</strong>raway from <strong>the</strong> cell center. Note that in <strong>the</strong> pathloss model, transmit power or noisespectral density values are actually irrelevant. Ra<strong>the</strong>r, it is <strong>the</strong> relation between <strong>the</strong>UE distance, which scales <strong>the</strong> received signal power, <strong>and</strong> <strong>the</strong> resulting SNR what isimportant, so as to be able to compare link <strong>and</strong> system level results with a commonSNR definition.Table 3.3 lists <strong>the</strong> employed configuration parameters, which result in <strong>the</strong> SNR distributionsurrounding a single cell shown in Figure 3.15 (left). This setup consists <strong>of</strong>a single eNodeB with an omnidirectional antenna <strong>and</strong> depicts <strong>the</strong> SNR distribution,as defined in Equation (3.24), around <strong>the</strong> cell center. Being circularly-symmetric, itis thus possible to map <strong>the</strong> distance from <strong>the</strong> cell center to an SNR value, which isshown on Figure 3.15 (right).The aforementioned scenario has been simulated at both link <strong>and</strong> system level bymeans <strong>of</strong> <strong>the</strong> Vienna <strong>LTE</strong> link level simulator [68, 98] <strong>and</strong> <strong>the</strong> Vienna <strong>LTE</strong> system43
3. Physical Layer <strong>Modeling</strong> <strong>and</strong> <strong>LTE</strong> <strong>System</strong> <strong>Level</strong> SimulationTable 3.3.: Simulation parameters employed for <strong>the</strong> validation <strong>of</strong> <strong>the</strong> L2S model in <strong>the</strong> singlecell,single-user scenario.Frequency(2.14 GHz( ) 4π d f 3Pathloss [dB]max 10 log 10 , 0)cB<strong>and</strong>width1.4 MHzTX power, antenna5 W, omnidirectionallyNoise spectral density-160 dBm/HzChannel model ITU-R Pedestrian-A [97], block fadingChannel knowledgePerfectFeedback delaynoneNumber <strong>of</strong> eNodeBs 1Number <strong>of</strong> UEs 1y pos [m]4003002001000−100−200−300−400ROI SNR [dB]−300 −100 100 300x pos [m]20151050−5distance [m]45040035030025020015010050SNR vs. distance to eNodeB0−10 0 10 20 30 40SNR [dB]Figure 3.15: Left: SNR map over <strong>the</strong> simulated ROI (color scale limited to a [-5,20] dB SNRrange). Right: Relation between <strong>the</strong> distance from <strong>the</strong> eNodeB site <strong>and</strong> <strong>the</strong>post-FFT SNR. Simulation parameters listed in Table 3.3.level simulator [78], which implements <strong>the</strong> PHY layer abstraction models presentedin Chapter 3. As performance measure, throughput has been chosen, as it is ultimately<strong>the</strong> metric <strong>of</strong> interest.The following transmit modes defined in [39], as well as antenna configurations, havebeen evaluated, in all cases under a Ped-A channel at 5 km/h:ˆ Single transmit antenna (mode 1): 1 × 1 (SISO), 1 × 2 (SIMO).ˆ Transmit Diversity (mode 2): 2×2.ˆ Open Loop Spatial Multiplexing (mode 3): 2×2, 4×2, 4×4.ˆ Closed Loop Spatial Multiplexing (mode 4): 2×2, 4×2, 4×4.For all <strong>of</strong> <strong>the</strong> listed configurations, link level <strong>and</strong> system level results are shownin Figures 3.16 <strong>and</strong> 3.17. For <strong>the</strong> SNR range between -10 <strong>and</strong> 40 dB, each plot44
3. Physical Layer <strong>Modeling</strong> <strong>and</strong> <strong>LTE</strong> <strong>System</strong> <strong>Level</strong> Simulationdepicts throughput results for each <strong>of</strong> <strong>the</strong> four transmit modes considered: (i) singletransmit antenna, (ii) TxD, (iii) OLSM, <strong>and</strong> (iv) CLSM. <strong>System</strong> level results (solidline) are plotted overlapped to link level ones (dashed line).6655throughput [Mbit/s]4321x2 MRC (link level)11x2 MRC (system level)SISO (link level)SISO (system level)0−10 0 10 20 30 40SNR [dB]throughput [Mbit/s]4321TxD 2x2 (link level)0−10 0TxD 2x2 (system level)10 20 30 40SNR [dB]Figure 3.16: Link level <strong>and</strong> system level simulation results, single cell scenario. Left: Singleantenna transmit mode (SISO <strong>and</strong> 1×2 with MRC). Right: TxD transmitmode (2×2).throughput [Mbit/s]20OLSM 2x2 4x4 (link level)18OLSM 2x2 4x4 (system level)OLSM 4x2 (link level)16OLSM 4x2 (system level)14OLSM 4x4 2x2 (link level)OLSM 4x4 2x2 (system level)121086420−10 0 10 20SNR [dB]30 40throughput [Mbit/s]2018161412CLSM 4x4 (link level)CLSM 4x4 (system level)CLSM 4x2 (link level)CLSM 4x2 (system level)CLSM 2x2 (link level)CLSM 2x2 (system level)1086420−10 0 10 20SNR [dB]30 40Figure 3.17: Link level <strong>and</strong> system level simulation results, single cell scenario. Left: OLSMtransmit mode (2×2, 4×2, <strong>and</strong> 4×4). Right: CLSM transmit mode (2×2, 4×2,<strong>and</strong> 4×4).As observed from <strong>the</strong> results in Figures 3.16 <strong>and</strong> 3.17, <strong>the</strong> results <strong>of</strong> <strong>the</strong> link abstractionmodel can be considered accurate with some deviation in <strong>the</strong> four-transmitantenna configuration <strong>of</strong> OLSM. As explained in Section 3.1.1.2, <strong>the</strong> block fadingassumption is actually not valid for <strong>the</strong> OLSM case, but a reduced-complexity approximationis employed so as to still be able to calculate a single value per TTI.As expected, accuracy is highest for <strong>the</strong> two transmit antenna case, where only oneprecoder is employed. From <strong>the</strong> observed results, it is concluded that for <strong>the</strong> highSNR regime, <strong>the</strong> 4×2 OLSM link abstraction should not be employed, as significantdeviations are present due to <strong>the</strong> inconsistency <strong>of</strong> <strong>the</strong> block fading assumption.45
3. Physical Layer <strong>Modeling</strong> <strong>and</strong> <strong>LTE</strong> <strong>System</strong> <strong>Level</strong> SimulationOf special interest is <strong>the</strong> feedback-wise more complex case <strong>of</strong> CLSM, where <strong>the</strong>optimum precoder is precalculated at trace generation <strong>and</strong> <strong>the</strong> optimum rank chosenat run time, for which <strong>the</strong> L2S model closely approximates link level results.3.2.1.1. Complexity EvaluationIn this section, <strong>the</strong> run-time complexity <strong>of</strong> system level simulations is compared tothat <strong>of</strong> link level simulations, showing a significant reduction in simulation run timewhen employing <strong>the</strong> L2S model. Hence, it validates <strong>the</strong> statement, much-emphasizedin this <strong>the</strong>sis, that a link abstraction model allows for significantly faster simulationtimes compared to detailed link level simulations.The same single-user, single-cell described above is simulated for <strong>the</strong> <strong>LTE</strong> channelb<strong>and</strong>widths <strong>of</strong> 1.4, 3, 5, <strong>and</strong> 10 MHz (link <strong>and</strong> system level), <strong>and</strong> additionally for<strong>the</strong> 20 MHz b<strong>and</strong>width case for system level. As from <strong>the</strong> values, listed in Table 3.4,link level simulation run times scale linearly with <strong>the</strong> number <strong>of</strong> RBs, <strong>the</strong> link levelsimulation time for <strong>the</strong> 20 MHz case has been extrapolated from <strong>the</strong> existing values.Table 3.4.: Simulation run time comparison in seconds. Marked in bold face are <strong>the</strong> systemlevel simulation times, followed by <strong>the</strong> link level simulation times.Single TX1.4 MHz 3 MHz 5 MHz 10 MHz 20 MHz6 RBs 15 RBs 25 RBs 50 RBs 100 RBs1×1 28/282 28/703 28/1 115 28/2 300 30/-1×2 30/278 28/666 28/1 089 27/2 248 32/-TxD 2×2 27/614 28/1 542 29/2 552 28/5 086 29/-OLSMCLSM2×2 32/1 308 33/3 287 34/5 446 39/10 978 33/-4×2 32/1 426 32/3 842 33/6 598 35/15 040 36/-4×4 33/2 203 37/6 029 36/10 428 40/24 531 44/-2×2 33/358 32/901 33/1 509 32/3 399 34/-4×2 31/493 35/1 257 34/2 020 33/4 394 34/-4×4 37/874 34/2 310 36/3 563 38/7 535 42/-The almost constant simulation run time <strong>of</strong> <strong>the</strong> system level simulator can be explainedby <strong>the</strong> <strong>of</strong>floading <strong>of</strong> <strong>the</strong> most computationally-intensive task, which is <strong>the</strong>channel trace generation. Although a detailed complexity analysis <strong>of</strong> <strong>the</strong> system levelsimulator has not been performed, <strong>the</strong> shown simulation results indicate that, whensimulating larger b<strong>and</strong>widths, <strong>the</strong> complexity increase <strong>of</strong> <strong>the</strong> b<strong>and</strong>width-dependentpart <strong>of</strong> <strong>the</strong> L2S model (in this scenario <strong>the</strong> link quality model <strong>and</strong> <strong>the</strong> CQI <strong>and</strong>,when applicable, RI feedback 7 ) are almost negligible in comparison to <strong>the</strong> overallrun time.7 In a single-user scenario, no actual scheduling is performed. However, scheduling algorithms do46
3. Physical Layer <strong>Modeling</strong> <strong>and</strong> <strong>LTE</strong> <strong>System</strong> <strong>Level</strong> Simulationrun time [s]10 410 310 2link levelsystem levelSISOSIMO 1x2TxD 2x2OLSM 2x2OLSM 4x2OLSM 4x4CLSM 2x2CLSM 4x2CLSM 4x41.4MHz 5MHz 10MHz 20MHzFigure 3.18: Simulation run time. Legend <strong>and</strong> colors as in Figures 3.16 <strong>and</strong> 3.17.While for OLSM <strong>the</strong> gains are higher (up to a 1 150x speed-up, as shown in Table3.5), significant gains can be achieved for CLSM, <strong>of</strong> high interest due to <strong>the</strong>employed more elaborate MIMO feedback <strong>and</strong> higher model accuracy. In this case,a speed-up gain <strong>of</strong> up to 359x can be obtained when considering a 20 MHz b<strong>and</strong>width.Such a computational complexity reduction enables performing multi-usersimulations with high channel b<strong>and</strong>widths, necessary to evaluate complex schedulingscenarios or multi-user gain with more practical simulation time durations, such asin <strong>the</strong> example in Appendix D.Table 3.5.: Calculated system level simulator speed-up compared to link level simulation runtime, 20 MHz b<strong>and</strong>width scenario.Single TX TxD OLSM CLSM1×1 1×2 2×2 2×2 4×2 4×4 2×2 4×2 4×4speed-up 153x 140x 351x 665x 836x 1 150x 200x 259x 359x3.2.2. Multi-cellThe L2S model presented in this <strong>the</strong>sis, on which <strong>the</strong> <strong>LTE</strong> system level simulatoris based, enables simple simulation <strong>of</strong> dense networks. As such, it is an idealtool for performance modeling <strong>of</strong> heterogeneous networks, where an <strong>LTE</strong> macrocelllayer is coupled with a tier <strong>of</strong> smaller, low-power cells (e.g., pico-, or femto-cells).Although issues related to <strong>LTE</strong> femtocell deployment are currently already beinginvestigated [100–102], results commonly lack accurate link abstraction modelingdue to <strong>the</strong> extra overhead necessary for it.increase in complexity with <strong>the</strong> number <strong>of</strong> PHY resources (RBs) <strong>the</strong>y allocate. In multi-usersimulations scenarios where scheduling algorithms are applied, simulation run time may not,depending on <strong>the</strong> complexity <strong>of</strong> <strong>the</strong> scheduling algorithm, stay constant over b<strong>and</strong>width.47
3. Physical Layer <strong>Modeling</strong> <strong>and</strong> <strong>LTE</strong> <strong>System</strong> <strong>Level</strong> SimulationAs such, <strong>the</strong> scenario chosen for cross-comparison with link level results extends <strong>the</strong>scenario in Section 3.2.1 <strong>and</strong> depicts an interference situation inspired by a small-celldeployment. In this case, a pico- or femto-cell with low transmit power is deployedin a low-coverage zone [103], thus resulting in <strong>the</strong> situation depicted in Figure 3.19.Interfering eNodeB 1 Interfering eNodeB 21 2UE0Target eNodeB (pico- or femto-cell)3wall loss, X dBInterfering eNodeB 3L dB pathloss from each transmitterFigure 3.19: Multi-cell scenario link-<strong>and</strong>-system level simulation cross-comparison scenario.For cross-comparison, ∆ PRX = 15 dB <strong>and</strong> ∆ PRX = 20 dB have been employed.The target UE is attached to this low-power cell which transmits with power P femtowith a pathloss L femto to <strong>the</strong> UE. Equivalently, P macro <strong>and</strong> L macro characterize each<strong>of</strong> <strong>the</strong> interfering links. To characterize <strong>the</strong> different received power levels due to <strong>the</strong>difference in transmit power, pathloss, <strong>and</strong> wall loss in a femtocell deployment [104],an average receive power <strong>of</strong>fset, denoted as ∆ PRX has been defined. Because <strong>of</strong>implementation limitations <strong>of</strong> <strong>the</strong> link level simulator, <strong>the</strong> same power <strong>of</strong>fset foreach <strong>of</strong> <strong>the</strong> interfering signals had to be chosen. Offset values <strong>of</strong> 15 dB <strong>and</strong> 20 dBhave been employed, simulating a case where <strong>the</strong> same received power would bereceived with <strong>the</strong> addition <strong>of</strong> wall isolating <strong>the</strong> femtocell surroundings [104].cell throughput [Mbit/s]6543210SISO15 dB power difference 20 dB power difference9system level resultssystem level results8link level resultslink level results72x2 TxD2x2 OLSM2x2 CLSM4x4 CLSMcell throughput [Mbit/s]6543210SISO2x2 TxD2x2 OLSM2x2 CLSM4x4 CLSMFigure 3.20: Multi-cell scenario throughput results. Left: 15 dB pathloss difference. Right:20 dB pathloss difference. Blue: system level results, Red: link level results.48
3. Physical Layer <strong>Modeling</strong> <strong>and</strong> <strong>LTE</strong> <strong>System</strong> <strong>Level</strong> SimulationIn Figure 3.19, <strong>the</strong> pathloss L dB from <strong>the</strong> attached eNodeB is shown green, while <strong>the</strong>pahtloss from <strong>the</strong> three interferers are marked red (L + X dB pathloss). Thermalnoise is considered negligible compared to <strong>the</strong> received interferer power <strong>and</strong> setaccordingly in <strong>the</strong> link level simulator.Figure 3.20 shows <strong>the</strong> throughput results for <strong>the</strong> described scenarios, both for systemlevel (blue), <strong>and</strong> link level (red). With <strong>the</strong> addition <strong>of</strong> a power <strong>of</strong>fset between <strong>the</strong>target eNodeB <strong>and</strong> <strong>the</strong> interferers, <strong>and</strong> <strong>the</strong> consideration <strong>of</strong> negligible <strong>the</strong>rmal noise,<strong>the</strong> employed simulation parameters are analogous to those in Section 3.2.1. Relativethroughput difference results compared to link level throughput results are listed inTable 3.6, for both <strong>the</strong> with 15 dB <strong>and</strong> 20 dB <strong>of</strong>fset cases.Table 3.6.: Relative throughput difference (compared to link level results).SISO 2×2 TxD 2×2 OLSM 2×2 CLSM 4×4 CLSM15 dB <strong>of</strong>fset 12.15% 10.20% 5.28% 15.41% 4.54%20 dB <strong>of</strong>fset 8.75% 7.28% 2.96% 2.81% 4.18%3.2.3. Comparison with o<strong>the</strong>r MIMO <strong>LTE</strong> Link-to-system Model ResultsPublished throughput results <strong>of</strong> <strong>LTE</strong> MIMO L2S models such as those presentedin this work, employed in a well-defined scenario <strong>and</strong> with a well-described set <strong>of</strong>simulation parameters are not easy to find.While some comparisons <strong>of</strong> resultsfrom different 3GPP member companies for simple 1×2 scenarios can be foundin [105, 106], no analogous MIMO results could be found. Open source simulatorssuch as [93, 95] could not be used because <strong>of</strong> <strong>the</strong>ir lack <strong>of</strong> detailed MIMO modeling.Unfortunately, <strong>the</strong> only similar results found, to <strong>the</strong> author’s knowledge, are thosein [107], with which a throughput results comparison in shown in Figure 3.21.F(x)10.90.80.70.60.50.40.30.20.10DOCOMOVienna UT0 1 2 3 4 5 6UE throughput [Mbit/s]Figure 3.21: Throughput ecdf results on <strong>the</strong> scenario defined in [107]. Red line: resultsfrom [107]. Black line: results from <strong>the</strong> Vienna system level simulator.49
3. Physical Layer <strong>Modeling</strong> <strong>and</strong> <strong>LTE</strong> <strong>System</strong> <strong>Level</strong> SimulationThe paper presents (among o<strong>the</strong>r results) <strong>LTE</strong> CLSM system level simulation resultsfor an uncorrelated 4×2 antenna configuration in a well-defined scenario, describedin Table 3.7.Table 3.7.: Scenario parameters employed for comparison with <strong>the</strong> results in [107].Carrier frequency2 GHzChannel b<strong>and</strong>width10 MHzCell layout Hexagonal grid, 19 sites, 3 cells/siteAntenna pattern70 degree, 14 dBiInter-site distance500 mTransmission power46 dBmPathloss128.1 + 37.6 log 10 (r)Penetration loss20 dBShadow fading σ8 dBShadow fading correlation 0.5 (inter-site), 1.0 (intra-site)Channel modelITU-T Typical UrbanAntenna configuration 4×2Transmit modeCLSMSchedulingProportional FairUEs/cell 10Deviations are actually expected, caused by differences in implementation <strong>of</strong> channelmodels, receiver models, link adaptation, <strong>and</strong> link-to-system interfaces [106]. Regrettably,an in-depth analysis <strong>of</strong> <strong>the</strong> causes <strong>of</strong> <strong>the</strong> deviations is not possible due to<strong>the</strong> closed nature <strong>of</strong> <strong>the</strong> tools employed to generate <strong>the</strong> results in [107]. However,when comparing <strong>the</strong> deviation between <strong>the</strong> two ecdf curves shown in Figure 3.21,we can state that <strong>the</strong> deviations is in <strong>the</strong> same order <strong>of</strong> magnitude as those acceptedfor use in <strong>LTE</strong> st<strong>and</strong>ardization for <strong>the</strong> Single-Input Multiple-Output (SIMO) case.50
4. Extensions to <strong>the</strong> L2S Model4. Extensions to <strong>the</strong> L2S ModelThis chapter details extensions to include Hybrid Automatic Repeat reQuest(HARQ) <strong>and</strong> channel estimation errors, both aiming at more realistic modelingcapabilities <strong>of</strong> <strong>LTE</strong> systems <strong>and</strong> extending <strong>the</strong> L2S model described in Chapter 3beyond its basic capabilities.These two extensions apply to different parts <strong>of</strong> <strong>the</strong> L2S model. The HARQ modelapplies to <strong>the</strong> link performance model, described in Section 3.1.2, while <strong>the</strong> channelestimation errors applies to <strong>the</strong> link quality model only, which is described inSection 3.1.1.4.1. Hybrid ARQHARQ is part <strong>of</strong> <strong>the</strong> <strong>LTE</strong> MAC layer <strong>and</strong> provides retransmission capabilities aimedat improving link reliability. It consists <strong>of</strong> <strong>the</strong> retransmission <strong>of</strong> erroneously-receivedTBs <strong>and</strong> a joint decoding <strong>of</strong> <strong>the</strong> received retransmissions. It is implemented in <strong>the</strong>rate matching module, which also adjusts <strong>the</strong> rate matching target code rate, asmentioned in Section 2.2.3. The rate matching module is capable <strong>of</strong>, for a giventarget code rate, generating up to four versions <strong>of</strong> a TB. The different TB versions,indicated in <strong>the</strong> <strong>LTE</strong> st<strong>and</strong>ard by a redundancy version index, denoted as rv idx(rv 0 , . . . , rv 3 ), <strong>and</strong> when possible composed <strong>of</strong> a different subset <strong>of</strong> <strong>the</strong> original turboencodedbits, are combined at bit level <strong>and</strong> jointly decoded once received.4.1.1. <strong>LTE</strong> HARQAfter turbo encoding (see Section 2.2.3), <strong>the</strong> rate-1/3-encoded bits, consisting <strong>of</strong>systematic <strong>and</strong> parity bits, are placed in a circular buffer, from which <strong>the</strong> bits for51
4. Extensions to <strong>the</strong> L2S Modeleach <strong>of</strong> <strong>the</strong> TB rv idx are extracted.Given D original data bits, <strong>the</strong> rate matching process outputs a TB <strong>of</strong> size G bits,where G > D. After <strong>the</strong> rate 1/3 turbo code, <strong>the</strong> bits are placed on a circular buffer,with <strong>the</strong> systematic bits being placed consecutively <strong>and</strong> <strong>the</strong> parity bits interleavedone-to-one, as depicted in Figure 4.1.... ......: starting pointsystematic bits (v (0) )...1st parity bits (v (1) )2nd parity bits (v (2) )Figure 4.1: Positioning <strong>of</strong> <strong>the</strong> turbo-encoded bits (both systematic <strong>and</strong> parity) in <strong>the</strong> ratematching circular buffer. The output bits are obtained by setting a startingpoint k 0 <strong>and</strong> extracting G bits. The systematic bits are placed consecutively in<strong>the</strong> buffer, while <strong>the</strong> parity bits are interleaved.In order to generate different TB versions for different values <strong>of</strong> rv idx , a differentstarting point k 0 , based on <strong>the</strong> value <strong>of</strong> rv idx , is calculated for each retransmission.Two modes <strong>of</strong> HARQ exist, which are depicted in Figure 4.2: in Chase Combining(CC) [108] (named after David Chase, its inventor), each retransmission is identicalto <strong>the</strong> original transmission, while in Incremental Redundancy (IR) each retransmissionconsists <strong>of</strong> new redundancy bits from <strong>the</strong> channel encoder. With <strong>the</strong>aforementioned circular buffer setup, <strong>and</strong> assuming k 0 advances exactly D/3 positionsfor each retransmission, full IR is only possible if G < rv max+1 · D.In both cases, <strong>the</strong> received retransmissions are combined <strong>and</strong> <strong>the</strong> resulting packet isjointly decoded. <strong>LTE</strong> HARQ applies a hybrid CC/IR approach, in which a mixture<strong>of</strong> repeated <strong>and</strong> new bits are sent during <strong>the</strong> retransmissions, corresponding to <strong>the</strong>right figure in Figure 4.2.original code blockequalretransmissionscombined bits punctured bitsreconstructed code block (chase combining)original code blockdifferentversionscombined bitsreconstructed code block (<strong>LTE</strong> incremental redundancy)Figure 4.2: Chase combining (left) <strong>and</strong> <strong>the</strong> partial incremental redundancy (combining CCbits <strong>and</strong> IR bits) employed in <strong>LTE</strong> HARQ (right).52
4. Extensions to <strong>the</strong> L2S Model4.1.2. HARQ <strong>Modeling</strong>In this section, <strong>the</strong> concepts presented in Section 3.1.2 for <strong>the</strong> calculation <strong>of</strong> <strong>the</strong>effective post-equalization SINR (γ eff ) are extended to <strong>the</strong> modeling <strong>of</strong> <strong>the</strong> combininggain due to <strong>the</strong> use <strong>of</strong> HARQ in constant channels. The model is based on a MIbasedinterpretation <strong>of</strong> HARQ combining <strong>and</strong> adapts <strong>the</strong> MIESM SINR averagingprocedure to take into account <strong>the</strong> total MI <strong>of</strong> <strong>the</strong> combined TB [109].As detailed in Section 4.1, <strong>the</strong> combined HARQ TB combines both repeated <strong>and</strong>newly-transmitted bits. This combining <strong>of</strong> new <strong>and</strong> repeated information can beexpressed in terms <strong>of</strong> Accumulated Mutual Information (ACMI) [110, 111], whichwe denote as I ∗ .In <strong>the</strong> CC case, as <strong>the</strong> same bits are retransmitted M times, it can be interpretedas an increase in <strong>the</strong> receive SNR. With every retransmission, energy is added, butno new information is sent. Thus, <strong>the</strong> CC ACMI <strong>of</strong> a set <strong>of</strong> M retransmissions sentover SNR γ, can be expressed as( M)∑I∗CC (γ) = I n γ , (4.1)m=0where m denotes <strong>the</strong> m-th retransmission (m = {0, 1, . . . , M}, with m = 0 correspondingto <strong>the</strong> initial transmission) <strong>and</strong> I n denotes <strong>the</strong> BICM capacity for <strong>the</strong>employed MCS which n bits per symbol [72], shown in Equation (3.22).For IR, if only new parity bits are sent in subsequent retransmissions, <strong>the</strong> result isan increase in <strong>the</strong> amount <strong>of</strong> information, thus increasing <strong>the</strong> ACMI such thatI IR∗ (γ) =M∑I n (γ) . (4.2)m=0For <strong>the</strong> combined CC-IR HARQ scheme employed in <strong>LTE</strong>, we define G HARQ =(M + 1) G as <strong>the</strong> total number <strong>of</strong> received bits after M retransmissions <strong>and</strong> separateinto G CC <strong>and</strong> G IR , which represent <strong>the</strong> set <strong>of</strong> repeated <strong>and</strong> non-repeated bits,respectively, where G HARQ = G CC + G IR . In this case, I ∗ results in a combination<strong>of</strong> Equations (4.1) <strong>and</strong> (4.2), which we denote as I∗<strong>LTE</strong> (γ):I∗<strong>LTE</strong> (γ) = G ((IRn · I n 1 + G ) )CC· γ , (4.3)G HARQas G IR unique bits are sent, repeated on average(1 + G )CCtimes.G HARQ53
4. Extensions to <strong>the</strong> L2S Model4.1.3. Application to <strong>LTE</strong>The <strong>LTE</strong> channel coding procedures (see Section 2.2.3) employ a turbo code <strong>of</strong> rater c = 1/3, followed by rate matching, which adjusts <strong>the</strong> output ECR (r eff ) to that <strong>of</strong>any <strong>of</strong> <strong>the</strong> defined MCSs (between 0.08 <strong>and</strong> 0.93, as listed in Table 2.5). The channelcoding procedures for each <strong>of</strong> <strong>the</strong> (re)transmitted TBs is depicted in Figure 4.4.data bitsChannel code:rateRate matchingcoded bitsFigure 4.3: <strong>LTE</strong> rate matching procedure. The output <strong>of</strong> a turbo code <strong>of</strong> rate r c = 1/3 israte-matched in order to obtain <strong>the</strong> coded bits with <strong>the</strong> target rate r eff . Theretransmission index m, parametrizes exact bit subset <strong>of</strong> G.To allow for an ACMI representation <strong>of</strong> <strong>the</strong> combined TB, <strong>the</strong> HARQ-combined TBis modeled as resulting from <strong>the</strong> combination <strong>of</strong> an inner code <strong>of</strong> rate r m <strong>and</strong> anouter repetition code <strong>of</strong> rate 1/Nrep, m where r m is in <strong>the</strong> range 1/3 ≤ r m ≤ 1 <strong>and</strong> <strong>the</strong>retransmission index m in <strong>the</strong> range m = {0, 1, 2, 3}. In this model, <strong>the</strong> output from<strong>the</strong> inner code represent <strong>the</strong> IR bits, while <strong>the</strong> outer repetition code represents <strong>the</strong>CC bits. The process is depicted in Figure 4.4.data bitsChannel code:Repetition code:coded bitsFigure 4.4: The combined TB is modeled as a combination <strong>of</strong> an inner channel code with arate r m between 1/3 <strong>and</strong> 1 (IR bits) <strong>and</strong> an outer repetition code <strong>of</strong> rate N m rep(CC bits).If a capacity-approaching channel code with suitably long block length is used, itis well known that <strong>the</strong> BLER can be approximated by <strong>the</strong> MI outage probability[25, 112, 113]. In <strong>the</strong> case <strong>of</strong> a system with HARQ, equivalent expressions canbe derived by using ACMI. Under this assumption, <strong>the</strong> outage probability ε is <strong>the</strong>probability P that I ∗ < D. Thus, for <strong>the</strong> case where <strong>the</strong> SNR γ is constant over <strong>the</strong>retransmissions, we obtain:[GIRε = Pn · I (n Nmrep · γ ) ]< D . (4.4)In order to extend <strong>the</strong> presented model for application to OFDM, MIESM is appliedto compress <strong>the</strong> SINR vector γ into an AWGN-equivalent effective SINR value γ eff ,which can <strong>the</strong>n be plugged into Equation (4.4).54
4. Extensions to <strong>the</strong> L2S ModelTo accomplish this, <strong>the</strong> subcarrier SINR vectors γ 0,...,M <strong>of</strong> each (re)transmission arestacked into a vector γ <strong>of</strong> length (M + 1) · N SCsγ = vec (γ 0 , γ 1 , . . . γ M ) , (4.5)which is <strong>the</strong>n compressed into an effective SNR value γ eff by means <strong>of</strong> MIESM:γ eff (γ) = I −1n()1 ∑I n (γ(M + 1) N i ) , (4.6)SCswhere, N SCs is <strong>the</strong> total number <strong>of</strong> subcarriers. Adapting Equation (4.4), <strong>the</strong> outageprobability ε can be calculated as:⎡⎢ε = P ⎣ G IRn· I (n Nmrep · γ eff (γ) )} {{ }γ AWGNi⎤⎥< D⎦ , (4.7)where γ AWGN is denoted as <strong>the</strong> AWGN-equivalent SINR <strong>of</strong> <strong>the</strong> combined TB including<strong>the</strong> repetition gain.In order to consider <strong>the</strong> non-ideal behaviour <strong>of</strong> <strong>the</strong> channel coding <strong>and</strong> <strong>the</strong> loss inperformance due to <strong>the</strong> rate matching process, AWGN BLER curves are employedinstead <strong>of</strong> <strong>the</strong> outage probability. Thus, ε is approximated as:ε ≈ BLER AWGN (r m , n, γ AWGN ) . (4.8)In <strong>LTE</strong>, <strong>the</strong> values for r m cannot simply be obtained from <strong>the</strong> final code rate appliedby <strong>the</strong> rate matching [45]. However, by using <strong>the</strong> implementation <strong>of</strong> <strong>the</strong> rate matcherin [98], <strong>the</strong> equivalent puncturing matrices applied to <strong>the</strong> mo<strong>the</strong>r code <strong>of</strong> rate r c =1/3 can be extracted <strong>and</strong> employed to obtain <strong>the</strong> outer turbo coding rate r m <strong>and</strong><strong>the</strong> inner repetition coding rate 1/Nrep m for each <strong>of</strong> <strong>the</strong> HARQ retransmission index<strong>and</strong> MCS value pairs.For each MCS <strong>and</strong> retransmission index m, <strong>the</strong> obtained effective turbo code rates(r m ) <strong>and</strong> repetition rates (Nrep) m are shown in Figure 4.5. The r m code rates requiredfor each <strong>of</strong> <strong>the</strong> modulations defined for <strong>the</strong> <strong>LTE</strong> data channel are listed in Table 4.1.Model accuracy is evaluated by means <strong>of</strong> link level simulations with <strong>the</strong> Vienna <strong>LTE</strong>simulator [98] for both AWGN <strong>and</strong> time-correlated ITU Pedestrian-B channels [114–116].For each <strong>of</strong> <strong>the</strong> 15 <strong>LTE</strong> MCSs, <strong>the</strong> BLER curves from <strong>the</strong> simulation <strong>and</strong> from <strong>the</strong>proposed model are compared at <strong>the</strong> 10% BLER point, which is known to lead tonear-optimal performance [113] <strong>and</strong> is thus also <strong>the</strong> target BLER for link adaptation.55
4. Extensions to <strong>the</strong> L2S Model1140.94-QAM16-QAM64-QAM124-QAM16-QAM64-QAM0.80.7108m=0m=1m=2m=30.660.540.420.31 2 3 4 5 6 7 8 9 10 11 12 13 14 15MCS01 2 3 4 5 6 7 8 9 10 11 12 13 14 15MCSFigure 4.5: Inner (r m ) <strong>and</strong> outer (N m rep) code rates for HARQ modeling.Table 4.1.: Turbo code code rates (r m ) for HARQ modeling.Modulation Total r m4-QAM 4 1/1.70, 1/2.29, 1/2.44, 1/3.0016-QAM 6 1/1.67, 1/2.09, 1/2.42, 1/2.72, 1/2.83, 1/3.0064-QAM 161/1.08, 1/1.18, 1/1.34, 1/1.53, 1/1.81, 1/1.83,1/1.93, 1/2.08, 1/2.21, 1/2.28, 1/2.56, 1/2.58,1/2.68, 1/2.83, 1/2.96, 1/3.0026Figure 4.6 shows, for MCS 6, a BLER comparison after each retransmission <strong>and</strong> <strong>the</strong>coding/repetition gain (10% BLER points marked). It is seen that most <strong>of</strong> <strong>the</strong> codinggain is always concentrated on <strong>the</strong> first retransmissions, while for retransmissionindexes higher than rv 1 , almost no r c -encoded bits remain to be transmitted. whilewith a repetition code, a gain <strong>of</strong> 3 dB would be obtained, due to <strong>the</strong> coding gain <strong>of</strong><strong>the</strong> IR bits, a higher 5.7 dB gain is obtained.As new r c -encoded bits become depleted, r m converges to r c = 1/3, as observed on<strong>the</strong> second <strong>and</strong> third retransmissions.The accuracy <strong>of</strong> <strong>the</strong> model is evaluated, for each MCS, in terms <strong>of</strong> <strong>the</strong> deviation<strong>of</strong> <strong>the</strong> simulated <strong>and</strong> modeled 10 % BLER points. It is evaluated for AWGN <strong>and</strong>ITU Pedestrian-B channels <strong>and</strong> is depicted in Figure 4.7. Alternatively, Table 4.2lists <strong>the</strong> average deviation in dB obtained for each retransmission index <strong>and</strong> MCS,grouped by modulation alphabet.Focusing on <strong>the</strong> more realistic frequency selective case, it is observed that exceptfor <strong>the</strong> case <strong>of</strong> 64-QAM <strong>and</strong> rv idx > 2, <strong>the</strong> predicted BLER values show an averagedeviation lower than 0.4 dB. However, as in <strong>the</strong> case <strong>of</strong> <strong>the</strong> precoder precalculationshown in Appendix A, what is important is an analysis <strong>of</strong> <strong>the</strong> relevance <strong>of</strong> <strong>the</strong>56
4. Extensions to <strong>the</strong> L2S ModelBLER10 010 −110 −210 −310% BLER.. . .m=0m=1m=2m=3m=0, modelm=1, modelm=2, modelm=3, model−10 −5 0 5 10 15SNR [dB]coding gain+small rep. gainsmall cod. gain+repetition gainrepetition gainHARQgain5.7 dB2.5 dB1.4 dBFigure 4.6: MCS 6 BLER, ITU Pedestrian-B 5 km/h. Solid line: simulation, Dashed line:model. Marked: BLER=10% points.SNR [dB]20151050−5−10−154-QAM 16-QAM 64-QAM1 2 3 4 5 6 7 8 9 10 11 12 13 14 15MCSSNR [dB]35302520151050−5−10−154-QAM16-QAMm=0m=164-QAMm=2m=31 2 3 4 5 6 7 8 9 10 11 12 13 14 15MCSFigure 4.7: Model accuracy for <strong>the</strong> BLER=10% points, m = {0, 1, 2, 3}. Solid line: model,Dashed line: simulations results. Left: AWGN results. Right: ITU Ped-B5 km/h results.inaccuracies in those specific ill-conditioned cases.An analysis <strong>of</strong> <strong>the</strong> distribution <strong>of</strong> <strong>the</strong> HARQ gain between each retransmission, measuredat <strong>the</strong> BLER=10 % point <strong>and</strong> detailed in Table 4.3, shows that: (i) effectively,most <strong>of</strong> <strong>the</strong> gain occurs during <strong>the</strong> first retransmissions (ii) for higher MCSs, a highercoding gain fur<strong>the</strong>r increases <strong>the</strong> overall HARQ gain <strong>of</strong> <strong>the</strong> first retransmission.The existence <strong>of</strong> a second retransmission implies that <strong>the</strong> MI gain <strong>of</strong> <strong>the</strong> first retransmissionwas not high enough to correctly receive <strong>the</strong> TB. In <strong>the</strong> low MCSset (1-6, employing 4-QAM modulation), <strong>the</strong> first retransmission introduces a gainbetween 3.56 dB <strong>and</strong> 5.3 dB. However, <strong>the</strong> same retransmission number translatesinto an average gain between 6.38 dB <strong>and</strong> 14.28 dB.Assuming a correctly-functioning channel quality feedback <strong>and</strong> AMC algorithm, as57
4. Extensions to <strong>the</strong> L2S ModelTable 4.2.: Average deviation <strong>of</strong> <strong>the</strong> modeled 10% BLER points [dB].mAWGNPed-B0 1 2 3 0 1 2 34-QAM 0.02 0.11 0.06 0.03 0.11 0.22 0.14 0.2016-QAM 0.04 0.40 0.16 0.22 0.02 0.23 0.58 0.9864-QAM 0.07 0.30 0.29 0.79 0.11 0.39 0.85 2.59well as <strong>the</strong> coherence time assumptions in Section 3.1.1, <strong>the</strong> impact <strong>of</strong> <strong>the</strong> modelinaccuracies at high MCS <strong>and</strong> retransmission count is significantly reduced due to<strong>the</strong> improbability <strong>of</strong> such retransmissions. This assumption is also backed by <strong>the</strong>results in [109], in which it is shown that, for a MIMO cell setup such as that shownin Figure 3.7, 64-QAM retransmissions account for less than 0.05% <strong>of</strong> <strong>the</strong> totalnumber <strong>of</strong> TBs 1 .Table 4.3.: Minimum <strong>and</strong> maximum SNR gain due to <strong>the</strong> m-th HARQ retransmission withrespect to <strong>the</strong> previous retransmission for each <strong>of</strong> <strong>the</strong> employed modulations.ITU Pedestrian-B channel (5 km/h).4-QAM 16-QAM 64-QAM1st re-tx 3.56 dB - 5.3 dB 4.79 dB - 6.13 dB 6.38 dB - 14.28 dB2nd re-tx 1.98 dB - 2.77 dB 2.19 dB - 2.85 dB 2.53 dB - 4.19 dB3rd re-tx 1.11 dB - 1.6 dB 1.27 dB - 1.78 dB 1.68 dB - 2.89 dB4.2. Channel Estimation ErrorThis section extends <strong>the</strong> ZF-receiver-based post-equalization SINR to <strong>the</strong> case <strong>of</strong>imperfect channel knowledge, adding to <strong>the</strong> model detailed in Section 3.1.1.1 [117].Analogously to Equation (3.8), <strong>the</strong> post-equalization SINR for <strong>the</strong> i-th layer, denotedas γ i , is expressed asγ i =P TX[ MSE ] ii, (4.9)where P TX denotes <strong>the</strong> signal sum power sent over <strong>the</strong> transmit antennas, denotedas σx 2 0in <strong>the</strong> remaining expressions in this chapter for ma<strong>the</strong>matical consistencywith <strong>the</strong> transmitted symbol vector x, MSE <strong>the</strong> R ν×ν Mean Square Error (MSE)matrix, <strong>and</strong> [·] ii<strong>the</strong> i-th element <strong>of</strong> <strong>the</strong> matrix diagonal.1 In CLSM/OLSM, <strong>the</strong> level <strong>of</strong> spatial multiplexing can be adjusted, in addition to <strong>the</strong> MCS. As inSISO, varying <strong>the</strong> MCS is <strong>the</strong> only available rate-adjusting mechanism, <strong>the</strong> ratio would be higherfor SISO transmissions, but never<strong>the</strong>less <strong>of</strong> minor impact.58
4. Extensions to <strong>the</strong> L2S ModelThe MSE is calculated based on <strong>the</strong> actual transmitted signal (x 0 ) <strong>and</strong> <strong>the</strong> estimatedreceive symbols (ˆx 0 ) as{MSE = E (ˆx 0 − x 0 ) (ˆx 0 − x 0 ) H} , (4.10)The estimated receive symbol vector ˆx 0 is, as previously shown in Equation (3.5),obtained as()N∑intˆx 0 = Gy = G H 0 x 0 + n + H i x i , (4.11)where <strong>the</strong> ZF receive filter G is calculated as) −1G =(ĤĤ 0 Ĥ 0 ĤH 0 , (4.12)Ĥ 0 = H 0 + E, (4.13)e ij ∼ CN ( 0, σe) 2 . (4.14)i=1The estimated channel (Ĥ 0 ) is modeled as <strong>the</strong> actual channel plus an error matrixE whose entries (e ij ) are modeled as complex-normal with mean power σ 2 e [118].Applying a Taylor series expansion at E = 0, i.e., assuming a small channel estimationnoise variance σ 2 e [119], <strong>the</strong> following MSE expression is obtained:MSE = E{(ˆx 0 − x 0 ) (ˆx 0 − x 0 ) H}{} ( ) H≈ ˜H −10 E EW 0 x 0 x H 0 W0 H E H ˜H −10{ } ( ) {H+ ˜H −10 E nn H ˜H −10 + ˜H −10 E EW 0 ˜H ( ) } H ( −10 nnH ˜H −10 WH0 E H ˜H −10N int∑+i=0[˜H −10 E {˜H i x i x H i ˜H H i} ( ) H˜H −10{+ ˜H −10 E EW 0 ˜H −1 ˜H( ) } H ( ) ] HH0 i x i x i˜H H i ˜H −10 W H E H ˜H −10(( (H= σeσ 2 x 2 0+ σv 2 + σvσ 2 eTr2 )H −1)) (0 H 0 ˜H H ˜H) −10 0+I∑[ (˜H −10 σx 2 iH i W i Wi H H H ii=1where H denotes <strong>the</strong> channel matrix,(+ σx 2 iσeTr2 H i H H i( )HH −1) ( ) )] H0 H 0 ˜H −10 ,(4.15)˜H <strong>the</strong> effective channel matrix (i.e., <strong>the</strong>precoder-<strong>and</strong>-channel-matrix combination HW), <strong>and</strong> E <strong>the</strong> channel estimation errormatrix. The full derivation <strong>of</strong> Equation (4.15) can be found in Appendix C.) H59
4. Extensions to <strong>the</strong> L2S ModelThe expression can be simplified by omitting <strong>the</strong> Tr () term [118], obtainingMSE = ( σ 2 eσ 2 x 0+ σ 2 v) ( ˜H H 0 ˜H 0) −1(4.16)N∑int[+i=1˜H −1 (0 σ2xiH i W i Wi H H H i) ( ) ] H˜H −10 , (4.17)where, assuming all <strong>of</strong> <strong>the</strong> entries <strong>of</strong> H i to have an average power <strong>of</strong> one, σ xi is <strong>the</strong>average receive power over all antennas for <strong>the</strong> i-th user (i.e., <strong>the</strong> transmit powerdivided by <strong>the</strong> pathloss).For <strong>the</strong> purpose <strong>of</strong> model validation, a fixed value for σ 2 e could be used. This settingwould, however, not be realistic. As <strong>the</strong> quality <strong>of</strong> <strong>the</strong> channel estimation varieswith <strong>the</strong> quality <strong>of</strong> <strong>the</strong> pilot symbols from which <strong>the</strong> estimation is achieved, it is<strong>the</strong>refore a function <strong>of</strong> <strong>the</strong> signal level <strong>of</strong> <strong>the</strong> pilots. Adapting from [120], we express<strong>the</strong> channel estimation error σ 2 e as:()σe 2 = c N∑inteσx 2 σn 2 + σx 2 i, (4.18)0i=1where a typical value for c e would be 0.0544 [120, 121] 2 .4.2.1. Model AccuracyThe model is validated in two scenarios: (i) over a SNR range, where no interferersare present <strong>and</strong> <strong>the</strong> noise level is varied <strong>and</strong> (ii) with six interferers placed on ahexagonal grid layout with omnidirectional antennas <strong>and</strong> evaluating <strong>the</strong> results on<strong>the</strong> points corresponding to <strong>the</strong> center cell, so as to avoid border map artifacts.In both cases, <strong>the</strong> model is validated for 2×2 <strong>and</strong> 4×4 antenna configurations employingCLSM <strong>and</strong> <strong>the</strong> st<strong>and</strong>ard-defined precoding codebook [39]. The model isvalidated for all <strong>the</strong> possible number <strong>of</strong> spatial layers for each antenna configuration,which comprise ν = {1, 2} for <strong>the</strong> 2×2 case <strong>and</strong> ν = {1, 2, 3, 4} for <strong>the</strong> 4×4 case.As <strong>the</strong> switching between number <strong>of</strong> layers RI needs to be performed at run-time,it is not in <strong>the</strong> scope <strong>of</strong> validating <strong>the</strong> accuracy <strong>of</strong> <strong>the</strong> model to show <strong>the</strong> combinedperformance when dynamically changing <strong>the</strong> number <strong>of</strong> employed layers ra<strong>the</strong>r thanto evaluate whe<strong>the</strong>r <strong>the</strong> prediction for any possible rank choice, whichever that onemay be, is accurate.In both cases, <strong>the</strong> channel matrix is obtained from an implementation <strong>of</strong> <strong>the</strong> WinnerPhase II channel model [122], <strong>and</strong> <strong>the</strong> precoding matrix chosen so as to maximize2 Assumes a pedestrian simulation <strong>and</strong> an LMMSE channel estimator.60
4. Extensions to <strong>the</strong> L2S Model<strong>the</strong> achievable capacity [54]. Since no interference coordination is assumed, eachinterferer is assigned a r<strong>and</strong>om precoder from <strong>the</strong> codebook.As accuracy metric, <strong>the</strong> post-equalization SINR output by <strong>the</strong> model <strong>and</strong> that <strong>of</strong>a simulated transmission are compared in <strong>the</strong> capacity domain, where <strong>the</strong> capacitymetric is expressed as <strong>the</strong> sum capacity over all streams <strong>and</strong> calculated asC sum =ν∑log 2 (1 + γ i ) . (4.19)i=1Figure 4.8 shows <strong>the</strong> results for <strong>the</strong> no-interference scenario for <strong>the</strong> 2×2 <strong>and</strong> 4×4antenna configuration cases respectively, with c e = 0.0544 [120].Achievable capacity [bit/s/Hz]181614121086421 layer2 layers00 5 10 15SNR [dB]20 25 30Achievable capacity [bit/s/Hz]302520151051 layer2 layers3 layers4 layers00 5 10 15SNR [dB]20 25 30Figure 4.8: 2 × 2 (left) <strong>and</strong> 4 × 4 (right) results. Solid line: modeled achievable capacity.Dashed line (totally overlapped by <strong>the</strong> solid line): calculated achievable capacity.This scenario, although at first glance suitable, is unable to depict <strong>the</strong> capacitydeviation between <strong>the</strong> predicted <strong>and</strong> <strong>the</strong> obtained value from <strong>the</strong> simulation. Asσe 2 is a linear function <strong>of</strong> σn, 2 <strong>the</strong> result is <strong>the</strong> channel estimation error is effectivelyalways 12 dB below <strong>the</strong> noise level, its influence in <strong>the</strong> MSE being thus negligible.Table 4.4.: Simulation parameters: model validation for <strong>the</strong> interference case.Inter-eNodeB distance500 mB<strong>and</strong>width 15 kHz (single subcarrier)Transmit power (P TX ): 17.7 dBm (43 dBm/5 MHz)Noise density-173 dBm/HzChannel model Winner Phase II [76, 122]Pathloss L = 128.1 + 37.6 log 10 (R) [69]Transmit mode:CLSMAntenna type Omnidirectional, 0 dB gainMinimum coupling loss 70 dB [69]Number <strong>of</strong> points in <strong>the</strong> target sector 8 65861
4. Extensions to <strong>the</strong> L2S ModelIn <strong>the</strong> next scenario, a simple hexagonal deployment <strong>of</strong> eNodeBs with omnidirectionalantennas has been employed. Although not representing a more complextri-sector cell layout such as in [69], it still validates whe<strong>the</strong>r <strong>the</strong> SINR model iscapable <strong>of</strong> predicting <strong>the</strong> average achievable capacity in an interference-limited scenario.The simulation parameters used in this simulation set are listed in Table 4.4.As SINR averaging is h<strong>and</strong>led by <strong>the</strong> link performance model, simulation results fora single-carrier setup are sufficient <strong>and</strong> reduce simulation time.Figure 4.9 depicts for <strong>the</strong> simulated area <strong>the</strong> wideb<strong>and</strong>, denoted as SINR Γ(x, y),<strong>and</strong> resulting from <strong>the</strong> simulation parameters listed in Table 4.4. For each point(x, y) <strong>of</strong> <strong>the</strong> ROI, <strong>the</strong> wideb<strong>and</strong> SINR corresponding to <strong>the</strong> closest cell SINR-wise,denoted as <strong>the</strong> i-th cell, is depicted.y pos [m]500400363002001000 257−100−200−300−40014−500−600 −400 −200 0 200 400 600x pos [m]4035302520151050Considered simulation area: center cellFigure 4.9: Network layout used for <strong>the</strong> multi-cell simulation. The center highlighted areashows <strong>the</strong> points taken into account for <strong>the</strong> simulation.Figure 4.10 show <strong>the</strong> results <strong>of</strong> <strong>the</strong> accuracy <strong>of</strong> <strong>the</strong> model for <strong>the</strong> 2×2 <strong>and</strong> 4×4antenna configuration cases, respectively.F(x)10.90.80.70.60.50.40.30.20.11 layer2 layers00 5 10 15Achievable capacity [bit/s/cu]F(x)10.90.80.70.60.50.40.30.21 layer2 layers0.13 layers4 layers00 5 10 15 20Achievable capacity [bit/s/cu]Figure 4.10: Achievable capacity results for <strong>the</strong> 2 × 2 (left) <strong>and</strong> 4 × 4 (right) antenna configurations.Solid line: modeled achievable capacity. Dashed line: calculatedachievable capacity.62
4. Extensions to <strong>the</strong> L2S ModelIn this case, <strong>and</strong> as opposed to <strong>the</strong> results in Figure 4.8, σ 2 e is is also influenced by<strong>the</strong> interfering cells, such that σe 2 = ce σn 2 + ∑ N inti=1 σ2 x i). Thus, more realisticallymodeling <strong>the</strong> distribution <strong>of</strong> σe 2 to that <strong>of</strong> a cellular network layout.σ 2 x 0(The results depicted on Figure 4.10 show <strong>the</strong> ecdf <strong>of</strong> <strong>the</strong> achievable rate empiricalover <strong>the</strong> cell area depicted in Figure 4.9. Results are shown for <strong>the</strong> 2×2 (left)<strong>and</strong> 4×4 (right) antenna configurations <strong>and</strong> for each case for all <strong>of</strong> <strong>the</strong> layer (RI)possibilities.Since <strong>the</strong> model is based on a Taylor approximation at E = 0, it is expected tobe less accurate <strong>the</strong> higher σe 2 is, as visible in Figure 4.10, where, specially for <strong>the</strong>four-layer 4×4 case, <strong>the</strong> model is pessimistic compared to <strong>the</strong> expected result dueto <strong>the</strong> application <strong>of</strong> <strong>the</strong> Taylor approximation, although still retaining a good level<strong>of</strong> accuracy.63
4. Extensions to <strong>the</strong> L2S Model64
5. Performance Evaluation <strong>of</strong> Fractional Frequency Reuse in <strong>LTE</strong>5. Performance Evaluation <strong>of</strong> FractionalFrequency Reuse in <strong>LTE</strong>Fractional Frequency Reuse (FFR) has been investigated as a method to combine<strong>the</strong> peak spectral efficiency <strong>of</strong> a reuse-1 scheme <strong>and</strong> <strong>the</strong> edge spectral efficiency performance<strong>of</strong> higher-order frequency reuse schemes [123] by simultaneously employingdifferent reuse factors within a cell. Ultimately, FFR aims at improving cell edgeperformance when compared to a reuse-1 scheme while maintaining cell center performance.Although <strong>LTE</strong> is a reuse-1 scheme, <strong>the</strong> use <strong>of</strong> OFDMA as <strong>the</strong> PHY layerin <strong>the</strong> st<strong>and</strong>ard enables easy implementation <strong>of</strong> frequency partitioning schemes suchas FFR.FFR performance is typically assessed in literature [124–131] by means <strong>of</strong> threeKey Performance Indicators (KPIs) derived from <strong>the</strong> throughput ecdf. These are (i)mean throughput, (ii) edge throughput, <strong>and</strong> (iii) peak throughput. Here, <strong>the</strong> terms“peak” <strong>and</strong> “edge” refer, as widely employed in literature, to <strong>the</strong> <strong>the</strong> 95% <strong>and</strong> 5%points <strong>of</strong> <strong>the</strong> UE throughput ecdf. These can be interpreted as <strong>the</strong> performance <strong>of</strong>an UE at <strong>the</strong> cell center <strong>and</strong> at cell edge, respectively.Over <strong>the</strong> course <strong>of</strong> this chapter, an analysis <strong>of</strong> <strong>the</strong> achievable throughput improvement<strong>of</strong> applying FFR to <strong>LTE</strong> is performed <strong>and</strong>, based on <strong>the</strong> results, argued that<strong>the</strong> mean, edge, <strong>and</strong> peak throughput KPIs need to be combined with a fairnessmeasure [57] to suitably be able to quantify <strong>the</strong> trade-<strong>of</strong>f between reuse-1 <strong>and</strong> <strong>the</strong>higher-order reuse in FFR.65
5. Performance Evaluation <strong>of</strong> Fractional Frequency Reuse in <strong>LTE</strong>5.1. Principles <strong>of</strong> Fractional Frequency ReuseFFR is based on dividing <strong>the</strong> cell into a center part, where interference is lower <strong>and</strong>reuse-1 is employed, <strong>and</strong> an outer part, where a higher frequency reuse factor isemployed (typically a reuse factor <strong>of</strong> three). This accomplishes an improvement <strong>of</strong><strong>the</strong> SINR at cell edge, while still allowing <strong>the</strong> UEs placed at <strong>the</strong> cell center to use<strong>the</strong> whole b<strong>and</strong>width.In this chapter, <strong>the</strong> assumed FFR scheme is <strong>the</strong> most commonly found scheme inliterature, which combines a reuse-1 center zone, denoted as <strong>the</strong> Full Reuse (FR)zone, <strong>and</strong> an outer zone employing reuse-3, denoted as <strong>the</strong> Partial Reuse (PR) zone.As shown on Figure 5.1 (from left to right): (i) <strong>the</strong> cells are divided into a centerFR <strong>and</strong> an edge PR zone. In <strong>the</strong> PR zones, three frequency b<strong>and</strong>s are cyclicallyallocated (reuse-3), while in <strong>the</strong> FR zones, <strong>the</strong> same frequency is reused. (ii) Afraction β FR <strong>of</strong> <strong>the</strong> total b<strong>and</strong>width is allocated to <strong>the</strong> frequency b<strong>and</strong> employedin <strong>the</strong> FR zones. The remaining b<strong>and</strong>width (a fraction <strong>of</strong> 1 − β FR <strong>of</strong> <strong>the</strong> total) isequally allocated to each <strong>of</strong> <strong>the</strong> three PR b<strong>and</strong>s. i.e., (1 − β FR )/3 to be assigned toeach PR zone.cell 1cell 1cell 3cell 2cell 2cell 3Frequency allocationFR Zone: reuse-1,PR Zone: reuse-3,Figure 5.1: Principles <strong>of</strong> FFR. Left: frequency allocation over <strong>the</strong> cells. Middle: separation<strong>of</strong> <strong>the</strong> cell into a Full Reuse (FR) <strong>and</strong> a PR zone, employing reuse-1 <strong>and</strong> reuse-3,respectively. Right: b<strong>and</strong>width allocation <strong>of</strong> <strong>the</strong> frequency b<strong>and</strong>s employed.Thus, two parameters configure <strong>the</strong> allocation <strong>of</strong> <strong>the</strong> PHY resources to <strong>the</strong> FR/PRzones: (i) <strong>the</strong> distribution <strong>of</strong> <strong>the</strong> b<strong>and</strong>width, <strong>and</strong> (ii) <strong>the</strong> cell area allocated to eachzone. The first parameter is defined by <strong>the</strong> b<strong>and</strong>width partitioning factor β FR , asshown in Figure 5.1. For <strong>the</strong> division <strong>of</strong> <strong>the</strong> cell area among <strong>the</strong> FR <strong>and</strong> PR zones,some prior work has proposed a distance-based metric [132]. However, such a metricis only meaningful for a circularly-symmetric case, <strong>and</strong> not applicable for <strong>the</strong> morerealistic sectorized case. Thus, in this case, <strong>the</strong> employed metric for dividing <strong>the</strong> cellinto <strong>the</strong> FR <strong>and</strong> PR zones is that <strong>of</strong> an SINR threshold, denoted as Γ thr , which isfur<strong>the</strong>r explained in Section 5.2.66
5. Performance Evaluation <strong>of</strong> Fractional Frequency Reuse in <strong>LTE</strong>This work assumes a hexagonal grid <strong>of</strong> sites with three cells per site, with a constantnumber <strong>of</strong> UEs per cell <strong>and</strong> a full-buffer traffic model assumption. This results ina cell layout such as that in <strong>the</strong> example in Figure 5.1, where each cell contains acenter area employing reuse-1 <strong>and</strong> an outer area employing reuse-3.5.2. Previous WorkWhile capacity is commonly employed to determine <strong>the</strong> switching point between <strong>the</strong>FR <strong>and</strong> PR zones (simplified into a distance metric for circularly symmetric cases<strong>and</strong> a SINR threshold for sectorized cases), such a capacity-based approach does nottake into account <strong>the</strong> presence <strong>of</strong> multiple UEs <strong>and</strong> is thus incomplete [133].With <strong>the</strong> premise that a UE should be assigned to <strong>the</strong> FR or PR zone so as tomaximize its throughput, <strong>and</strong> that <strong>the</strong> PHY resources are shared among all UEsin a cell, capacity density (analogous to UE throughput through <strong>the</strong> assumption<strong>of</strong> a uniform UE density over <strong>the</strong> cell area) was initially employed to evaluate <strong>the</strong>potential benefits <strong>of</strong> FFR.pos y [m]35030025020015010050FR zone PR zone Combined FR&PR (FFR)pos y [m]pos y [m]350300250200150100503503002502001501005050 100 150 200 250pos x [m]50 100 150 200 250pos x [m]50 100 150 200 250pos x [m]2520151050−5−109008007006005004003002001000Figure 5.2: Capacity density-based FFR results for β FR = 0.75 <strong>and</strong> Γ thr = 3.20 dB. The cellarea combines a reuse-1 zone (marked green) with a reuse-3 area (marked red).The FR <strong>and</strong> PR areas <strong>of</strong> <strong>the</strong> cell are depicted in terms <strong>of</strong> SINR (center row) <strong>and</strong>capacity density (bottom row). Column-wise, <strong>the</strong> spatial distribution is shownfor <strong>the</strong> FR zone (left), <strong>the</strong> PR zone (middle), <strong>and</strong> combined (right). FR <strong>and</strong> PRzone boundaries are marked with dashed lines.67
5. Performance Evaluation <strong>of</strong> Fractional Frequency Reuse in <strong>LTE</strong>Figure 5.2 shows example results for <strong>the</strong> FFR configuration employing β FR = 0.75<strong>and</strong> Γ thr = 3.20 dB FFR configuration. As presented in [133], this configuration wasfound to maximize capacity density <strong>and</strong> resulted in an improvement compared to<strong>the</strong> reuse-1 case <strong>of</strong>: 8.68 % in terms <strong>of</strong> average performance, 61.81 % in edge capacitydensity, <strong>and</strong> 5.21 % in peak capacity density. As <strong>the</strong> focus <strong>of</strong> this <strong>the</strong>sis is on L2Smodeling, <strong>the</strong> details on <strong>the</strong> previous work regarding <strong>the</strong> optimization <strong>of</strong> capacitydensity have been excluded from this chapter. However, <strong>the</strong> obtained results, whichemploy a β FR -dependent SINR threshold, are shown in Figure 5.3.capacity density gain over reuse−1 [%]120100806040200−20reuse-1 referencemaximum :+61.85%+8.68%+5.21%−400 0.2 0.4 0.6 0.8 1(edge)(peak)Figure 5.3: FFR mean, edge, <strong>and</strong> peak capacity density gains relative to reuse-1 [133].As seen in Figure 5.3, FFR can potentially be employed to simultaneously boostmean, edge, <strong>and</strong> peak throughput. However, results were based on capacity calculations,<strong>and</strong> not actual throughput. Fur<strong>the</strong>rmore, a homogeneous distribution <strong>of</strong>PHY resources was assumed, which may not be <strong>the</strong> case in a more realistic network,where typically proportional fair scheduling would be employed. In <strong>the</strong> remaining<strong>of</strong> this chapter, <strong>LTE</strong> FFR performance is analyzed in terms <strong>of</strong> throughput by means<strong>of</strong> <strong>LTE</strong> system level simulations, concluding that when combined with scheduling,FFR provides no tangible additional gains in terms <strong>of</strong> optimum performance.5.3. <strong>System</strong> ModelPerformance has been evaluated for a 4 × 4 MIMO antenna configuration employingCLSM. In order to be able to evaluate <strong>the</strong> complete space <strong>of</strong> FFR configurations,an exhaustive search over all possible FFR configurations has been performed. Theconfiguration parameters taken into consideration are as follows:ˆ B<strong>and</strong>width partitioning β FR : values from reuse-1 (β FR = 1) to practically reuse-3 (β FR = 0.01). As <strong>the</strong> frequency partitioning in <strong>LTE</strong> is based on RBs, <strong>the</strong>β FR frequency allocation is constrained to allocate an integer <strong>and</strong> zero-modulo-68
5. Performance Evaluation <strong>of</strong> Fractional Frequency Reuse in <strong>LTE</strong>three number <strong>of</strong> RBs to <strong>the</strong> FR zone <strong>and</strong> PR zone. Thus, <strong>the</strong> obtaining steppingβ FR = 0.01, 0.04, . . . , 1 (100 RBs cannot be equally distributed to three PR zones).ˆ FR-PR SINR threshold: <strong>the</strong> SINR threshold, denoted as Γ thr , specifies <strong>the</strong> wideb<strong>and</strong>SINR point at which <strong>the</strong> switching between FR <strong>and</strong> PR is performed. Aset ranging from <strong>the</strong> cell center (22.5 dB) to cell edge (-2 dB) has been taken intoaccount. The wideb<strong>and</strong> SINR Γ is defined, as in Equation (3.16), asΓ = G antenna L macro,0 P tx0.N∑intσn 2 + L macro,l P txll=1ˆ Scheduling: independent zone scheduling is applied. For each zone, <strong>the</strong> UEsareindependently scheduled. Two configurations having been analyzed, as listed inTable 5.1: (i) round robin <strong>and</strong> (ii) proportional fair scheduling [134], in both casesapplied to both <strong>the</strong> FR <strong>and</strong> PR zones.The full list <strong>of</strong> simulation parameters is detailed in Table 5.1.Table 5.1.: Simulation parameters employed for <strong>the</strong> <strong>LTE</strong> FFR simulations.Inter-eNodeB distance 500 m [83]Number <strong>of</strong> eNodeBs57 (two rings, 19 sites)UEs per eNodeB 30Considered UEsCenter 7 sites (21 cells): 630 UEsPathloss modelUrban area[69], 70 dB MCLShadow fadingnoneMinimum coupling loss 70 dB [69]Antennas (N TX × N RX ) 4 × 4Antenna radiation pattern KATHREIN 742 212Antenna downtilt8 ◦ , electricalTX power40 WMIMO mode CLSM [39]FeedbackAMC: CQI, MIMO: PMI <strong>and</strong> RIFeedback delay3 msChannel model Winner Phase II [76, 122]UE speed5 km/hTotal b<strong>and</strong>width20 MHz (100 RBs)Receiver modeling Zero Forcing [78]Noise spectral density N 0-174 dBm/HzSINR threshold Γ thr range-2:0.25:22.5 (99 values)B<strong>and</strong>width ratio β FR range0.01:0.03:1 (34 values)Total number <strong>of</strong> simulations 3 366Simulation length50 subframes (TTIs)Traffic modelFull bufferScheduling algorithm Round Robin <strong>and</strong> Proportional fair [134]69
5. Performance Evaluation <strong>of</strong> Fractional Frequency Reuse in <strong>LTE</strong>Combining <strong>the</strong> number <strong>of</strong> β FR values <strong>and</strong> Γ thr values taken into consideration, 3 366FFR simulations are required to evaluate throughput performance for each schedulerconfiguration. An example UE <strong>and</strong> eNodeB distribution from one <strong>of</strong> <strong>the</strong> 3 366 simulatedones in shown in Figure 5.4. The figure corresponds to <strong>the</strong> FFR configurationβ FR = 0.7, Γ thr = 12.75 dB. In blue are <strong>the</strong> UEs <strong>the</strong> results <strong>of</strong> which are takeninto account (center cells, grey-marked). In order to reduce simulation time <strong>and</strong>avoid border-map artifacts, UEs not attached to <strong>the</strong> center cells, marked pale-red,are skipped. Marked as blue dots, are <strong>the</strong> FR UEs, while crosses mark <strong>the</strong> PR UEs.As shown in Figure 5.2, <strong>the</strong> FR zone extends in <strong>the</strong> direction <strong>the</strong> antennas <strong>of</strong> <strong>the</strong>eNodeB radiate (marked with a line), extending in a petal-shape from each site.The same set <strong>of</strong> channel realizations have been employed by all simulations, so asto avoid a necessary averaging over channel realizations if independent ones wouldhave been taken into account. While employing <strong>the</strong> same channel realizations foreach simulation will not yield statistically significant throughput results, <strong>the</strong> relativedifference between FFR <strong>and</strong> reuse-1 will still be valid, which can equally answer <strong>the</strong>question <strong>of</strong> <strong>the</strong> usefulness <strong>of</strong> FFR applied to <strong>LTE</strong>.100080081318600400371217200y pos [m]0−200−400211651110161519−600−800−10004914−1000 −500 0 500 1000x pos [m]Figure 5.4: Network layout <strong>and</strong> UE distribution for one <strong>of</strong> <strong>the</strong> 3 366 <strong>LTE</strong> system levelsimulations employed in one FFR performance evaluation batch. β FR = 0.7,Γ thr = 12.75 dB. Marked grey are <strong>the</strong> cells taken into acocunt for <strong>the</strong> results.Outside <strong>of</strong> this area, UEs are not simulated (red UEs). In blue are <strong>the</strong> UEs in<strong>the</strong> considered cells (dots represent FR UEs, crosses PR UEs).70
5. Performance Evaluation <strong>of</strong> Fractional Frequency Reuse in <strong>LTE</strong>5.4. Round Robin Simulation Results <strong>and</strong> Fairness MetricThe UE throughput results for <strong>the</strong> round robin scheduling case, in which <strong>the</strong> PHYresources are equally distributed among <strong>the</strong> 30 UEs in <strong>the</strong> cell, are shown in Figure5.5. Every colored dot in each <strong>of</strong> <strong>the</strong> figures represents <strong>the</strong> average UE throughput(from left to right: mean, edge <strong>and</strong> peak throughput) obtained from an <strong>LTE</strong>system level simulation with β FR <strong>and</strong> Γ thr corresponding to <strong>the</strong> values in <strong>the</strong> x- <strong>and</strong>y-axis, respectively.In <strong>the</strong> upper row, mean, edge, <strong>and</strong> peak UE throughput in Mbit/s is depicted,while <strong>the</strong> lower row exhibits throughput gains (%) respective to <strong>the</strong> reuse-1 case.Additionally in <strong>the</strong> lower row, <strong>the</strong> area corresponding to an improvement <strong>of</strong> average<strong>and</strong> edge throughput are highlighted. As previous treatments <strong>of</strong> FFR focused on anoptimization <strong>of</strong> <strong>the</strong> average <strong>and</strong> edge throughput, this aims at visualizing a similarthroughput region <strong>of</strong> interest.SINR threshold [dB]20151050Mean throughput [Mbit/s] Edge throughput [Mbit/s] Peak throughput [Mbit/s]0.90.70.50.30.176543211.81.61.41.210.80.60.40.20.9 0.7 0.5 0.3 0.1 0.9 0.7 0.5 0.3 0.170605040302010SINR threshold [dB]20151050Mean throughput gain (%) Edge throughput gain (%) Peak throughput gain (%)120501004080306020401020000.9 0.7 0.5 0.3 0.1 0.9 0.7 0.5 0.3 0.1 0.9 0.7 0.5 0.3 0.1400350300250200150100500−50Figure 5.5: <strong>LTE</strong> FFR throughput results with round robin scheduling. Mean/edge/peakthroughput (Mbit/s) over <strong>the</strong> simulated β FR <strong>and</strong> Γ thr set (top row) <strong>and</strong> throughputgain relative to <strong>the</strong> reuse-1 case (%) for <strong>the</strong> area where mean <strong>and</strong> edgethroughput gain is positive (bottom row).Just taking into account <strong>the</strong>se metrics, results indicate <strong>the</strong> existence <strong>of</strong> FFR configurationsthat improve average, edge, <strong>and</strong> peak throughput, <strong>and</strong> thus <strong>of</strong>fer an apparentoverall performance increase. However, more careful examination <strong>of</strong> such cases showthat <strong>the</strong>se performance metrics do not properly reflect <strong>the</strong> throughput distribution.71
5. Performance Evaluation <strong>of</strong> Fractional Frequency Reuse in <strong>LTE</strong>Serving as an exemplifying point, <strong>the</strong> FFR configuration with frequency allocationβ FR = 0.31 <strong>and</strong> SINR threshold Γ thr = 18 dB yields seemingly all-improving UEthroughput results. For this case, <strong>the</strong> following UE throughputs are observed: meanUE throughput <strong>of</strong> 3.66 Mbit/s (+11.15 % compared to reuse-1), edge throughput <strong>of</strong>1.28 Mbit/s (+73.04 %), <strong>and</strong> peak throughput <strong>of</strong> 12.91 Mbit/s (+75.28 %). Do notethat this point does not correspond to <strong>the</strong> optimum point shown on Figure 5.3,but is ra<strong>the</strong>r an exemplifying FFR point. A more exhaustive examination <strong>of</strong> <strong>the</strong>simulation results <strong>of</strong>fers a complete view <strong>of</strong> <strong>the</strong> distribution <strong>of</strong> <strong>the</strong> UE throughput.In Figure 5.6, <strong>the</strong> UE throughput distribution, shown both as an ecdf (left) <strong>and</strong>a scatterplot over <strong>the</strong> FR wideb<strong>and</strong> SINR are shown (reuse-1 is considered for <strong>the</strong>calculation <strong>of</strong> Γ, hence <strong>the</strong> term “FR SINR”).In <strong>the</strong> right plot, <strong>the</strong> boundaryseparating <strong>the</strong> PR (left, low SINR range) <strong>and</strong> FR (high SINR range) UEs at Γ =18 dB is marked.Empirical CDF1UE average throughputWideb<strong>and</strong> SINR−to−throughput mapping700.90.8600.7500.6400.50.430PR zone FR zone0.3200.20.11000 10 20 300−5 0 5 10 15 20 25 30average UE throughput [Mbit/s]UE wideb<strong>and</strong> SINR [dB]average UE throughput [Mbit/s]Figure 5.6: UE throughput distribution for <strong>the</strong> β FR = 0.31 Γ thr = 18 dB FFR point. Left:UE throughput ecdf. Right: UE throughput over wideb<strong>and</strong> SINR (Γ).The ecdf shows that 80 % <strong>of</strong> <strong>the</strong> UEs experience low throughput, which albeit low, isstill higher than <strong>the</strong> reuse-1 edge throughput. This translates into an edge throughputincrease, which combined with a small group <strong>of</strong> UEs close to <strong>the</strong> cell centerthat obtain most <strong>of</strong> <strong>the</strong> throughput (peak throughput gain) that pushes <strong>the</strong> averagethroughput up, results in a gain in mean, edge, <strong>and</strong> peak throughput. However, anequally valid assertion is that <strong>the</strong> majority <strong>of</strong> UEs experience a performance degradation,despite what <strong>the</strong> throughput metrics may indicate, which obviously does notsound as desirable as <strong>the</strong> first assertion <strong>of</strong> overall gain.As shown, <strong>the</strong> typical metrics to evaluate FFR performance can lead to results which,albeit seemingly good, are undesirable. By combining <strong>the</strong> previously-mentionedthroughput metrics with a fairness metric, a better-suited performance evaluation<strong>of</strong> FFR performance is proposed [135].Fairness, as first introduced in [57], rates how equally a resource (in this case through-72
5. Performance Evaluation <strong>of</strong> Fractional Frequency Reuse in <strong>LTE</strong>put) is distributed over N users. It is defined as( ∑Ni=1 x i) 2J (x) =N ∑ , (5.1)Ni=1 x2 iwhere x is a vector <strong>of</strong> length N containing <strong>the</strong> resources obtained by each <strong>of</strong> <strong>the</strong>N users. Applied to <strong>the</strong> results shown in Figure 5.6, fairness can be interpretedas ei<strong>the</strong>r <strong>the</strong> steepness <strong>of</strong> <strong>the</strong> throughput ecdf or alternatively <strong>the</strong> flatness <strong>of</strong> <strong>the</strong>SINR-to-throughput mapping.Figure 5.7 depicts, employing <strong>the</strong> same visualization as in Figure 5.5, <strong>the</strong> obtainedfairness for all <strong>of</strong> <strong>the</strong> simulated β FR <strong>and</strong> Γ thr FFR value pairs, as well as <strong>the</strong> UEthroughput ecdf associated <strong>the</strong> following three points <strong>of</strong> interest in <strong>the</strong> plot: (i)reuse-1, (ii) reuse-3 (its closest FFR approximation, where β FR = 0.01), <strong>and</strong> (iii)β FR = 0.34, Γ thr = 10 dB, where a high fairness gain relative to reuse-1 is achieved.Empirical CDF0.91 reuse-10.80.70.60.50.40.30.20.100 1 2 3 4 5 6 7 8 9UE throughput [Mbit/s]SINR threshold [dB]20151050(i)0.90.7Fairness0.5(iii)0.30.1(ii)0.90.80.70.60.50.40.30.20.1Empirical CDFEmpirical CDF0.91 reuse-30.80.70.60.50.40.30.20.100.5 1 1.5 2 2.5 3 3.5 4UE throughput [Mbit/s]0.910.80.70.60.50.40.30.20.100 2 4 6 8 10UE throughput [Mbit/s]Figure 5.7: FFR fairness results employing round robin scheduling. The associated UEthroughput ecdf is shown for <strong>the</strong> (i) reuse-1 case, (ii) reuse3 case, <strong>and</strong> (iii)β FR = 0.34, Γ thr = 10 dB case.Ideally, an operator <strong>of</strong> an <strong>LTE</strong> network would find it desirable to obtain a fairnessgain (or at least not lose any fairness so as to avoid starvation <strong>of</strong> some UEs),while maintaining or ideally improving average throughput. Thus, ensuring that cellthroughput (i) is not reduced <strong>and</strong> (ii) is shared optimally among UEs.With this constraint, a fairness increase while maintaining average throughput impliesa throughput gain for <strong>the</strong> UEs with poor channel conditions, <strong>and</strong> vice versa.For <strong>the</strong> case depicted in Figure 5.6, a degradation in fairness from 0.69 (reuse-1fairness) to 0.32 was observed, which indicates that <strong>the</strong> observed throughput gain isdue to a more biased throughput distribution.If just <strong>the</strong> area where J FFR > J reuse1 is taken into account, <strong>the</strong> mean, edge, <strong>and</strong>73
5. Performance Evaluation <strong>of</strong> Fractional Frequency Reuse in <strong>LTE</strong>peak UE throughput results shown in Figure 5.8 are obtained.SINR threshold [dB]20151050Mean throughput gain (%) Edge throughput gain (%) Peak throughput gain (%)151501051000−550−10−150−20−25−50−300.9 0.7 0.5 0.3 0.1 0.9 0.7 0.5 0.3 0.1 0.9 0.7 0.5 0.3 0.1100−10−20−30−40−50Figure 5.8: From left to right: Mean, edge, <strong>and</strong> peak throughput gain (%). Depicted is only<strong>the</strong> area where fairness is improved compared to <strong>the</strong> reuse-1 case.Constraining fairness ensures that <strong>the</strong> plotted points have a throughput distributionthat is at least as fair as <strong>the</strong> one <strong>of</strong> reuse-1. Overall, <strong>the</strong> results show that in orderto improve edge throughput, one has to sacrifice from <strong>the</strong> peak UEs <strong>and</strong>, less butalso to some extent, average throughput.Out <strong>of</strong> <strong>the</strong> fairness-enhancing set, our interest lies in showing how optimal <strong>the</strong> trade<strong>of</strong>fbetween mean throughput <strong>and</strong> fairness can be: i.e., maximizing <strong>the</strong> fairness gainwhile minimizing mean throughput loss. Thus, we are interested in finding <strong>the</strong>points where: (i) fairness is maximum relative to mean throughput loss, <strong>and</strong> (ii) <strong>the</strong>maximum achievable fairness is obtained without incurring in mean throughput loss.Figure 5.9 depicts this trade-<strong>of</strong>f between fairness <strong>and</strong> mean throughput gain/loss.Considering <strong>the</strong> FFR points depicted in Figure 5.8 (i.e., FFR configurations in whichfairness is improved with respect to <strong>the</strong> reuse-1 case), a set <strong>of</strong> points with <strong>the</strong>following components is obtained: (i) β FR , (ii) Γ thr , (iii) J FFR , (iv) mean throughput,(v) edge throughput, <strong>and</strong> (vi) peak throughput.Plotting <strong>the</strong> relation between fairness <strong>and</strong> mean throughput yields <strong>the</strong> plot in Figure5.9. Only <strong>the</strong> FFR combinations improving fairness are considered, thus <strong>the</strong>lowest (y-axis-wise) point with a 0% mean throughput gain corresponds to <strong>the</strong> reuse-1 case. The envelope <strong>of</strong> scatterplot points corresponds to <strong>the</strong> FFR configurationsin which <strong>the</strong> trade-<strong>of</strong>f between mean throughput <strong>and</strong> fairness is optimum (markedred), with <strong>the</strong> following three significant performance points highlighted: (i) optimumtrade-<strong>of</strong>f between fairness <strong>and</strong> mean throughput, (ii) no mean throughput loss,but increased fairness, <strong>and</strong> (iii) no fairness loss, but increased mean throughput.Additionally, edge <strong>and</strong> peak throughput performance are also evaluated over meanthroughput performance gain, which is shown in Figure 5.10. There, <strong>the</strong> red pointsmark <strong>the</strong> same FFR configurations marked in Figure 5.9, i.e., <strong>the</strong> optimum trade-<strong>of</strong>fFFR configurations between mean average throughput <strong>and</strong> fairness. Combining <strong>the</strong>74
5. Performance Evaluation <strong>of</strong> Fractional Frequency Reuse in <strong>LTE</strong>results shown in Figures 5.8 <strong>and</strong> 5.9, <strong>the</strong> following conclusions are drawn:ˆ Without losing any mean throughput or fairness with respect to <strong>the</strong> reuse-1 case,it is possible to obtain obtain an additional 15% average throughput, 50% edgethroughput, <strong>and</strong> 10% peak throughput.ˆ Constrained to not losing any mean throughput, fairness can be improved to 0.85,which doubles edge throughput at <strong>the</strong> cost <strong>of</strong> a 20 % loss <strong>of</strong> peak throughput.ˆ It is possible to maximally increase fairness up to 0.93 by sacrificing 15% mean,<strong>and</strong> 45% peak throughput, as well as a being able to set fairness to a variety <strong>of</strong>points in-between.fairness0.950.90.850.8optimum trade-<strong>of</strong>f betweenfairness <strong>and</strong> mean throughputno mean throughput loss,increased fairness0.750.7−30 −25 −20−15 −10 −5 0 5 10 15Mean throughput gain (%)2.4 2.6 2.8 3 3.2 3.4 3.6 3.8Mean throughput (Mbit/s)no fairness loss,increased mean throughputFigure 5.9: Trade-<strong>of</strong>f between fairness <strong>and</strong> mean throughput for round robin scheduling.Red: optimum fairness-to-mean-throughput trade-<strong>of</strong>f envelope.Edge throughput (Mbit/s)1.81.61.41.210.80.60.40.2Edge throughput gain (%)150100500−50Edge-Mean throughput trade-<strong>of</strong>f−30 −25−20−15−10 −5 0 5 10 15Mean throughput gain (%)2.4 2.6 2.8 3 3.2 3.4 3.6 3.8Mean throughput (Mbit/s)Peak throughput (Mbit/s)87.576.565.554.543.5Peak throughput gain (%)100−10−20−30−40−50Peak-Mean throughput trade-<strong>of</strong>f−30−25−20−15−10 −5 0 5 10 15Mean throughput gain (%)2.4 2.6 2.8 3 3.2 3.4 3.6 3.8Mean throughput (Mbit/s)Figure 5.10: Left: Trade-<strong>of</strong>f between edge throughput <strong>and</strong> mean throughput (round robinscheduling). Left: Trade-<strong>of</strong>f between peak throughput <strong>and</strong> mean throughput.Marked red: optimum fairness-to-mean-throughput trade-<strong>of</strong>f.75
5. Performance Evaluation <strong>of</strong> Fractional Frequency Reuse in <strong>LTE</strong>5.5. Proportional Fair Simulation ResultsIt has been shown in Section 5.4 that a gain in throughput, as well as fairness, ispossible by means <strong>of</strong> applying FFR on top <strong>of</strong> round robin scheduling, compared to<strong>the</strong> case in which no FFR is applied. However, in practice, scheduling algorithmsmore elaborate than round robin are employed. A compromise between throughput<strong>and</strong> fairness, while still maximally exploiting multi-user diversity is desired.Thus, proportional fair scheduling [136] or more complex fairness-adjusting schedulingmechanisms [137] are routinely used instead. In order to analyze its impact ina more realistic setting, <strong>the</strong> performance <strong>of</strong> FFR when combined with ProportionalFair (PF) scheduling is analyzed in this section.Figure 5.11 shows fairness results for FFR with PF scheduling applied to <strong>the</strong> FR <strong>and</strong>PR zones. The main difference that can be observed compared to <strong>the</strong> round robinresults is that <strong>the</strong> achievable fairness values are much closer to those <strong>of</strong> <strong>the</strong> reuse-1case, which is equivalent to <strong>the</strong> FFR configuraiton with β FR = 1 <strong>and</strong> a minimumΓ thr SINR threshold point. In fact, <strong>the</strong>re is basically no possibility <strong>of</strong> increasingfairness relative to <strong>the</strong> reuse-1 case without losing mean throughput.SINR threshold [dB]201510500.90.7Fairness0.50.30.10.80.70.60.50.40.30.20.1fairness0.880.860.840.820.80.780.760.74−45 −40 −35 −30 −25 −20 −15 −10 −5 0Mean throughput gain (%)2.5 3 3.5 4 4.5Mean throughput (Mbit/s)Figure 5.11: Fairness results for FFR with proportional fair scheduling. Left: fairness resultsover β FR <strong>and</strong> Γ thr . Right: Trade-<strong>of</strong>f between fairness <strong>and</strong> mean UE throughput.The same can be observed from <strong>the</strong> distribution <strong>of</strong> <strong>the</strong> optimum fairness-to-meanthroughputtrade-<strong>of</strong>f points (marked red) in Figure 5.12. Although showing a similarshape, <strong>the</strong> results for edge throughput (left) <strong>and</strong> peak throughput (right), donot exhibit gains such as those in <strong>the</strong> round robin case. As PF scheduling is alreadypareto-optimal [137], FFR cannot extract fur<strong>the</strong>r gains from MU diversity.Although this results show that FFR cannot, in practice, be employed to simultaneouslyincrease throughput <strong>and</strong> fairness, it can still, be employed as a simple methodfor variably controlling <strong>the</strong> trade-<strong>of</strong>f between increased fairness <strong>and</strong> decreased cellthroughput.76
5. Performance Evaluation <strong>of</strong> Fractional Frequency Reuse in <strong>LTE</strong>Edge throughput (Mbps)21.81.61.41.210.80.60.40.2Edge throughput gain (%)200−20−40−60−80−45−40−35−30−25−20−15−10 −5 0Mean throughput gain (%)2.5 3 3.5 4 4.5Mean throughput (Mbit/s)Peak throughput (Mbps)9.598.587.576.565.554.5Peak throughput gain (%)−10−20−30−40−50−45−40−35−30−25−20−15−10 −5 0Mean throughput gain (%)2.5 3 3.5 4 4.5Mean throughput (Mbit/s)Figure 5.12: Left: Trade-<strong>of</strong>f between edge throughput <strong>and</strong> mean throughput (PF scheduling).Left: Trade-<strong>of</strong>f between peak throughput <strong>and</strong> mean throughput. Markedred: optimum fairness-to-mean-throughput trade-<strong>of</strong>f.5.6. Side-to-side Comparison <strong>and</strong> Multi-User Gain ResultsAs seen from <strong>the</strong> results shown in Figure 5.13, which combines <strong>the</strong> results from Sections5.4 <strong>and</strong> 5.5, FFR can increase <strong>the</strong> throughput without decreasing fairness onlyin <strong>the</strong> case <strong>of</strong> round robin scheduling, although <strong>the</strong> gain vanishes if it is employed ontop <strong>of</strong> proportional fair scheduling. However, tweaking <strong>the</strong> FFR parameters does allowfor a flexible trade-<strong>of</strong>f between fairness <strong>and</strong> throughput. Two operating points <strong>of</strong>interest for network deployments have been evaluated: (i) maximum mean throughputwithout fairness loss, <strong>and</strong> (ii) maximum achievable fairness while maintaining anoptimum mean-throughput-to-fairness trade-<strong>of</strong>f, which are marked in Figures 5.13<strong>and</strong> 5.14 as (i) <strong>and</strong> (ii), respectively.0.950.9(i)(i)round robin schedulingproportional fair schedulingFairness0.850.80.750.7opt. RR fairness trade-<strong>of</strong>fopt. PF fairness trade-<strong>of</strong>freuse-1throughput,increased fairnessreuse-1 throughput,(ii) no fairness gain2.5 3 3.5 4 4.5Mean throughput [Mb/s](ii)Figure 5.13: Trade-<strong>of</strong>f between fairness <strong>and</strong> mean UE throughput for round robin <strong>and</strong> proportionalfair scheduling. Performance points <strong>of</strong> interest additionally marked.77
5. Performance Evaluation <strong>of</strong> Fractional Frequency Reuse in <strong>LTE</strong>1.8(i)(i)Edge throughput [Mbit/s]1.61.41.210.80.6opt. RR fairnesstrade-<strong>of</strong>fopt. PF fairnesstrade-<strong>of</strong>f(ii)2.5 3 3.5 4 4.5Mean throughput [Mb/s](ii)Peak throughput [Mbit/s]98765opt. RR fairness trade-<strong>of</strong>f(i)opt. PF fairness trade-<strong>of</strong>f(i)(ii)(ii)4round robin schedulingproportional fair scheduling2.5 3 3.5 4 4.5Mean throughput [Mb/s]Figure 5.14: Edge (top) <strong>and</strong> peak (bottom) UE throughput vs. mean UE throughput: roundrobin <strong>and</strong> proportional fair scheduling.In Figure 5.14, analogous plots are shown for <strong>the</strong> relationship <strong>of</strong> <strong>the</strong> mean UEthroughput vs. edge <strong>and</strong> peak UE throughput, respectively. As expected from<strong>the</strong> relationship imposed between mean, edge, <strong>and</strong> peak throughput by <strong>the</strong> fairnessconstraint, <strong>the</strong> same effects observed in <strong>the</strong> results shown in Figure 5.13 are observedin Figure 5.14.The most desirable situation would be that <strong>of</strong> a “free” gain also for <strong>the</strong> proportionalfair scheduler, where <strong>the</strong> throughput accomplished in target (i) is higher than that<strong>of</strong> <strong>the</strong> reuse-1 case or when in (ii), higher fairness values can be achieved withoutdecreasing throughput. However, as seen from <strong>the</strong> results in Figures 5.13 <strong>and</strong> 5.14,this is not possible.While 30 UEs per cell can be considered a big enough number to be consideredanalogous to a continuous distribution, it is also necessary to evaluate <strong>the</strong> performance<strong>of</strong> FFR in less loaded situations. To this effect, for <strong>the</strong> optimum trade-<strong>of</strong>fpoints listed as (i) (maximum fairness) <strong>and</strong> (ii) (maximum throughput without fair-78
5. Performance Evaluation <strong>of</strong> Fractional Frequency Reuse in <strong>LTE</strong>ness loss), throughput <strong>and</strong> fairness performance has been evaluated over a range <strong>of</strong>number UEs/cell values. Small confidence intervals are ensured by averaging overenough independent different channel realization sets <strong>and</strong> UE positions such thateach plotted point is obtained from averaging at least 500 UE throughput points.The results, shown in Figure 5.15, depict on addition <strong>the</strong> MU-gain analysis resultsfrom Appendix D, so as to compare <strong>the</strong> FFR MU gain results to those <strong>of</strong> differentreuse-1 scheduling strategies. Results indicate that, in order for a static FFR schemesuch as <strong>the</strong> one assumed in this chapter to work, at least 5 UEs per cell are necessary.With less, throughput results do not converge to <strong>the</strong> FFR result. While for <strong>the</strong> roundrobin case, fairness can be consistently increased at no throughput cost, it is alsoclear that <strong>the</strong> same behavior does not hold for PFs. At <strong>the</strong> optimum trade-<strong>of</strong>f point,both cases do <strong>of</strong>fer similar results. While <strong>the</strong> achievable fairness is slightly lowerfor PF than round robin (<strong>the</strong> PF scheduling algorithm pushes aways from extremeresults), throughput is slightly better for PF, as demonstrated in Figure 5.13. BestCQI scheduler results are shown as comparison to <strong>the</strong> maximum achievable multiusergain, which <strong>of</strong> course comes also at <strong>the</strong> expense <strong>of</strong> fairness.Avg. cell throughput [Mbit/s]240220200180160140120100806040Throughput10.9Fairness <strong>of</strong> UE throughput0.80.70.60.50.40.30.20.105 10 15 20 25 30number <strong>of</strong> UEs/cellFairness5 10 15 20 25 30number <strong>of</strong> UEs/cellRound Robin Proportional fair Best CQIRR no cell thr. loss PF no cell thr. lossRR max. fairness PF max. fairnessFigure 5.15: Performance over number <strong>of</strong> UEs per cell for <strong>the</strong> following schedulers: roundrobin, proportional fair, best CQI, FFR-enabled round robin, <strong>and</strong> FFR-enabledproportional fair. The performance <strong>of</strong> <strong>the</strong> <strong>the</strong> FFR-enabled schedulers is evaluatedfor <strong>the</strong> FFR configurations were (i) <strong>the</strong> optimum trade-<strong>of</strong>f between fairness<strong>and</strong> mean throughput is achieved <strong>and</strong> (ii) for <strong>the</strong> case where no mean throughputloss occurs compared to <strong>the</strong> reuse-1 case. Left: cell throughput. Right: UEthroughput fairness. Vertical lines: 95 % confidence intervals.The conclusion <strong>of</strong> this chapter is that, taking into account that PF scheduling isanyway used, due to its increased throughput at <strong>the</strong> same fairness level compared toround robin scheduling, <strong>the</strong> usefulness <strong>of</strong> FFR is limited to allowing a flexible fairness79
5. Performance Evaluation <strong>of</strong> Fractional Frequency Reuse in <strong>LTE</strong>allocation in highly loaded networks. In a less loaded scenario, this could, however,only be accomplished with more complex dynamic coordinated FFR schemes. Forloads lower than 5 UEs per cell, FFR is outright unsuited, as results show alwayssevere throughput degradation compared to simple scheduling 1 .1 Fairness is evaluated network-wide, <strong>and</strong> not cell-wise. Thus, fairness results for <strong>the</strong> 1 UE/cellcase are not one.80
6. Summary <strong>and</strong> Outlook6. Summary <strong>and</strong> Outlook6.1. SummaryIn this <strong>the</strong>sis, an accurate, low-complexity link-to-system model for 3GPP <strong>LTE</strong>Release 8 is presented. The model is based on a ZF linear receiver <strong>and</strong> separates <strong>the</strong>link abstraction procedures into a link quality model <strong>and</strong> a link performance model.The link quality model outputs a per-subcarrier post-equalization SINR, which <strong>the</strong>link performance model compresses via MIESM to an AWGN-equivalent SINR value<strong>and</strong> is <strong>the</strong>n mapped to BLER by means <strong>of</strong> link-level-generated curves.Based one <strong>the</strong> presented L2S model, a complete <strong>LTE</strong> system level simulation hasbeen built, which also integrates <strong>the</strong> network layout (pathloss, shadow fading,eNodeB <strong>and</strong> UE placement), as well as a Winner Phase II channel model <strong>and</strong>appropriate MIMO feedback. This allows for performance evaluation <strong>of</strong> differentscheduling algorithms <strong>and</strong> interference coordination schemes such as FFR.In Chapter 3, <strong>the</strong> post-equalization SINR for each <strong>of</strong> <strong>the</strong> <strong>LTE</strong> transmit modes isderived <strong>and</strong> combined with all <strong>of</strong> <strong>the</strong> parameters characterizing an <strong>LTE</strong> networkdeployment. An extended correlation matrix for generation <strong>of</strong> spatially-correlatedshadow fading generation is also applied. As for <strong>the</strong> same correlation distance, asmaller pixel resolution in <strong>the</strong> pathloss maps requires <strong>of</strong> more neighbors for <strong>the</strong>spatial correlation computation, <strong>the</strong> applied extended correlation matrix increases<strong>the</strong> accuracy <strong>of</strong> <strong>the</strong> shadow fading maps in cases where more resolution is needed.For configurations <strong>of</strong> up to 4×4, <strong>the</strong> accuracy <strong>of</strong> <strong>the</strong> model is validated against linklevel simulations, confirming <strong>the</strong> accuracy <strong>of</strong> <strong>the</strong> L2S model in single- <strong>and</strong> multi-cellsimulation scenarios.Employing <strong>the</strong> maximum <strong>LTE</strong> channel b<strong>and</strong>width <strong>of</strong> 20 MHz, significant gains insimulation run-time are introduced by employing <strong>the</strong> presented link abstraction81
6. Summary <strong>and</strong> Outlookmodel. A run-time comparison has been carried out for a single-cell, single-userscenario, comparing link <strong>and</strong> system level simulator run times. The estimated simulationrun-time speed-ups for each <strong>of</strong> <strong>the</strong> implemented mode <strong>and</strong> antenna configurationare shown in Table 6.1 <strong>and</strong> range between 140x <strong>and</strong> 1 150x overall comparedto link level results. For <strong>the</strong> most complex case <strong>of</strong> CLSM, simulation run time gainhas been estimated at 359x.Table 6.1.: <strong>System</strong> level simulator speed-up compared to link level simulation run time,20 MHz b<strong>and</strong>width scenario.Single TX TxD OLSM CLSM1×1 1×2 2×2 2×2 4×2 4×4 2×2 4×2 4×4speed-up 153x 140x 351x 665x 836x 1 150x 200x 259x 359xIn Chapter 4, two enhancements to <strong>the</strong> L2S model are proposed. In <strong>the</strong> first part,<strong>the</strong> link performance model is extended to include HARQ in <strong>the</strong> BLER calculation.The joint processing <strong>of</strong> a received HARQ retransmission is modeled as a combination<strong>of</strong> an inner channel code <strong>and</strong> an outer repetition code, <strong>the</strong> rates <strong>of</strong> which are derivedfrom link level results. The model is based on <strong>the</strong> structure <strong>of</strong> <strong>the</strong> <strong>LTE</strong> rate matcher,as well as a mutual information-based combining <strong>of</strong> <strong>the</strong> post-equalization SINRs <strong>of</strong>each <strong>of</strong> <strong>the</strong> retransmissions to estimate <strong>the</strong> BLER <strong>of</strong> <strong>the</strong> combined data packet.Additionally, <strong>the</strong> link quality model is extended to take into account imperfect channelinformation into <strong>the</strong> calculation <strong>of</strong> <strong>the</strong> post-equalization SINR <strong>of</strong> <strong>the</strong> data symbolpositions. The model is also based on <strong>the</strong> ZF receiver <strong>and</strong> characterizes <strong>the</strong> totalchannel estimation error as a linear function <strong>of</strong> <strong>the</strong> sum received interference power<strong>and</strong> <strong>the</strong> noise level.In Chapter 5, <strong>the</strong> performance <strong>of</strong> FFR applied to <strong>LTE</strong> is evaluated. On a networklayout consisting <strong>of</strong> a hexagonal cell layout, all possible FFR configurations are testedcombined with (i) round robin scheduling <strong>and</strong> (ii) proportional fair scheduling. Inorder to avoid skewed throughput distributions, a fairness metric is introduced,which adds <strong>the</strong> constrain <strong>of</strong> no fairness loss with respect to <strong>the</strong> reuse-1 case.Simulation results show that, while with <strong>the</strong> round robin scheduler an overall increasein throughput <strong>and</strong> fairness is possible, with proportional fair scheduling, <strong>the</strong> gain islimited to <strong>the</strong> flexibility <strong>of</strong> exploiting a fairness-throughput trade-<strong>of</strong>f, without <strong>the</strong>possibility <strong>of</strong> a gain in both.In this static scenario, it is shown that FFR cannot properly function if less than5 UEs/cell are present, thus reducing its practical applicability to highly-loadedscenarios unless combined with dynamic allocation.82
6. Summary <strong>and</strong> Outlook6.2. OutlookWith <strong>LTE</strong>, as in <strong>the</strong> case <strong>of</strong> UMTS, enhancements to <strong>the</strong> st<strong>and</strong>ard began as soonas <strong>the</strong> first release (Release 8) was specified. Releases 10 <strong>and</strong> 11, termed <strong>LTE</strong>-Advanced, are already following a clear st<strong>and</strong>ardization path, with research proposalsfor Beyond-<strong>LTE</strong> (<strong>LTE</strong>-B) already trying to address future issues.The currently-implemented model is already adequate for single user MIMO <strong>and</strong>correctly scales for higher number <strong>of</strong> cells, which is expected as more dense cell deployments<strong>of</strong> small-cell sizes (pico-, femto-) are adopted to increase network throughput[138]. Minor enhancements to <strong>the</strong> model will allow it to evaluate energy efficiency<strong>and</strong> latency issues, already hot topics <strong>of</strong> discussion for <strong>LTE</strong>-A/B [139, 140],as well as Carrier Aggregation (CA), which can bring <strong>the</strong> usable b<strong>and</strong>width to upto 100 MHz [83, 141].However, improvements in <strong>the</strong> PHY will provide new modeling challenges, as MU-MIMO <strong>and</strong> interference-coordination schemes such as Interference Alignment (IA)or Cooperative Multi-Point (CoMP) need to be included into <strong>the</strong> L2S model as well.As <strong>the</strong> number <strong>of</strong> small cells becomes higher, cellular networks will, up to a certainpoint, stop being planned <strong>and</strong> will rely more on self-organizing spectrum allocationto avoid interference, for which an extra modeling layer <strong>of</strong> inter-cell coordination <strong>and</strong>communication could be designed. Additionally, new models may also be neededto include <strong>the</strong> effect <strong>of</strong> Machine-to-Machine (M2M) communications where up to1000+ machines/cell may be sporadically communicating.In prior st<strong>and</strong>ards, it remained <strong>the</strong> duty <strong>of</strong> <strong>the</strong> physical layer to provide a link with anever-increasing spectral efficiency. Currently, <strong>the</strong> importance <strong>of</strong> MAC <strong>and</strong> inter-cellcoordination schemes in order to exploit multi-user gain <strong>and</strong> spatial reuse (smallercells) has steadily increased. With it grows also <strong>the</strong> importance <strong>of</strong> accurate <strong>and</strong>low-complexity models such those presented in this <strong>the</strong>sis. Future link abstractionmodels will continue to allow performance evaluation <strong>of</strong> ever-more-complex networkdeployments with an ever-increasing degree <strong>of</strong> self-organization, interference coordination<strong>and</strong>, as a result, increased performance.83
6. Summary <strong>and</strong> Outlook84
A. SNR-independence <strong>of</strong> <strong>the</strong> CLSM Precoder ChoiceA. SNR-independence <strong>of</strong> <strong>the</strong> CLSMPrecoder ChoiceThis appendix justifies <strong>the</strong> assumption in Section 3.1.1.3 that <strong>the</strong> optimum precodermatrix choice can be performed independent <strong>of</strong> <strong>the</strong> SNR without any relevant loss<strong>of</strong> accuracy.Noting as ˜H <strong>the</strong> effective channel matrix, which is expressed as <strong>the</strong> channel matrixH multiplied by <strong>the</strong> precoder W, <strong>the</strong> post-equalization SINR (γ) for <strong>the</strong> k-thtransmitted symbol (k-th layer) is expressed asγ ZF,k =1[ ( ) ] −1ρ ˜H H ˜Hkk, (A.1)where ρ denotes <strong>the</strong> E b /N 0 divided by <strong>the</strong> number <strong>of</strong> receive antennas N RX , <strong>and</strong>[·] kk is <strong>the</strong> k-th diagonal element <strong>of</strong> <strong>the</strong> MSE matrix.The total spectral efficiency, denoted as C is <strong>the</strong> sum over <strong>the</strong> K layers, which isexpressed asK∑C = log 2 (1 + γ k ) .k=1(A.2)Via a Singular Value Decomposition (SVD) <strong>of</strong> H, we can express <strong>the</strong> effective channelmatrix product ( ˜H H ˜H) asW H H H HW = W H VΛU H UΛV H W = ( W H V )Λ 2 ( W H V ) H, (A.3)} {{ } } {{ }PP H85
A. SNR-independence <strong>of</strong> <strong>the</strong> CLSM Precoder Choicewhere Λ 2 contains <strong>the</strong> eigenvalues <strong>of</strong> H⎡λ 2 1 0 . . . 0Λ 2 0 λ=2 2 . . . 0⎢ .⎣ . . .. .0 0 . . . λ 2 K<strong>and</strong> P depends on <strong>the</strong> precoder. Thus,⎤⎥⎦ ,(A.4)γ ZF,k =1[ρ (PΛP H ) −1] , (A.5)kkFor <strong>the</strong> full-rank case, where H <strong>and</strong> W are square, P is unitary, <strong>and</strong> <strong>the</strong> per-layerpost-equalization SINR can be expressed asγ ZF,k =1ρ [PΛ −2 P H ] kk=1, (A.6)K∑ |p k,i | 2ρthus simplifying <strong>the</strong> matrix inverse, where p k,i [P] k,i. The spectral efficiency givena precoder W can <strong>the</strong>n be written asC = log 2K ∏k=1⎛⎜1 +⎝ρi=1λ 2 i1. (A.7)K∑ |p k,i | 2 ⎟⎠i=1λ 2 i⎞The optimum precoder choice employs an approximation for <strong>the</strong> high-SNR regime(1 + γ k ≈ γ k ) 1 . The rationale for applying <strong>the</strong> high-SNR regime approximation on<strong>the</strong> full SNR range <strong>and</strong> assuming independence <strong>of</strong> <strong>the</strong> noise value stems from <strong>the</strong>limited precoder choice. For <strong>the</strong> two-transmit antenna case, <strong>the</strong> codebook size islimited to four precoders, while for <strong>the</strong> four transmit antenna case, <strong>the</strong>re are sixteenpossible choices. Given such a small precoder codebook size, we argue that a goodprecoder choice would very probably remain good regardless <strong>of</strong> <strong>the</strong> noise level, whichwe show in <strong>the</strong> simulation results in <strong>the</strong> next section.[ (PΛ 1 For <strong>the</strong> non-full-rank cases, it will not be possible to write2 P H) ] −1kkform, thus <strong>the</strong> matrix product must be computed.in such a compact86
A. SNR-independence <strong>of</strong> <strong>the</strong> CLSM Precoder ChoiceA.1. Simulation ResultsFigure A.1 depicts, for a 4 × 4 antenna configuration, <strong>the</strong> overall spectral efficiencyfor all <strong>the</strong> combinations <strong>of</strong> precoder index (16 choices) <strong>and</strong> rank (4 choices). Theemployed channel matrix H is shown below, <strong>and</strong> has been purposely chosen to depicta case where relative precoder performance changes over SNR.⎡⎤−0.808 + 0.128i 0.921 − 1.557i 0.072 + 0.372i −0.606 − 0.226iH 4x4 =−0.442 + 0.896i −0.420 − 0.548i 0.846 + 1.077i −0.120 + 0.578i⎢⎣−0.827 − 0.178i 0.309 − 0.985i 0.085 + 1.272i −0.136 + 0.347i⎥⎦0.278 − 0.145i −0.357 − 0.273i −0.733 − 0.083i −0.612 + 0.541i(A.8)Sum capacity over layers [bit/cu]121086420204x4, rank 1 precoder 18 4x4, rank 2 precoder1614121086420Sum capacity over layers [bit/cu]Sum capacity over layers [bit/cu]2520151050184x4, rank 3 precoder 16 4x4, rank 4 precoder14121086420−5 0 5 10 15 20 25SNR [dB]Sum capacity over layers [bit/cu]−5 0 5 10 15 20 25SNR [dB]Figure A.1: Sum spectral efficiency for <strong>the</strong> channel matrix H shown in Equation (A.8) for <strong>the</strong>16 precoders defined for <strong>the</strong> four-transmit-antenna configuration defined by <strong>the</strong><strong>LTE</strong> st<strong>and</strong>ard [39]. Zommed (top-right): crossing in <strong>the</strong> mutual-informationwiseprecoder performance.In <strong>the</strong> high-SNR regime, <strong>the</strong> precedence in terms <strong>of</strong> performance between any twogiven precoders is independent <strong>of</strong> <strong>the</strong> SNR. However, at low SNR, crossings mayappear, such as for <strong>the</strong> rank 2 case at 5 dB SNR.The effect <strong>of</strong> applying <strong>the</strong> high-SNR approximation on <strong>the</strong> whole SNR range has87
A. SNR-independence <strong>of</strong> <strong>the</strong> CLSM Precoder Choicebeen quantified by simulation for <strong>the</strong> 4 × 4, 4 × 2, <strong>and</strong> 2 × 2 antenna configurations.For a set <strong>of</strong> 100 000 uncorrelated independent channel realizations, <strong>the</strong> sum spectralefficiency over all layers for each precoder is calculated <strong>and</strong> <strong>the</strong> deviation between<strong>the</strong> high-SNR approximation <strong>and</strong> <strong>the</strong> optimum choice calculated.Figure A.2 shows <strong>the</strong> results <strong>of</strong> <strong>the</strong> 4 × 4 antenna configuration. The left plotdepicts, for each SNR point, <strong>the</strong> failure ratio <strong>of</strong> <strong>the</strong> high-SNR approximation, whichas expected, decreases with SNR. Although for <strong>the</strong> higher ranks <strong>the</strong> probability <strong>of</strong>choosing a wrong precoder may seem high, it is not significant whe<strong>the</strong>r <strong>the</strong> precoderchoice was correct, ra<strong>the</strong>r than how inaccurate is <strong>the</strong> throughput result <strong>of</strong> <strong>the</strong> high-SNR approximation relative to <strong>the</strong> optimum choice.model failure ratio0.450.40.350.30.250.20.150.10.050−5 0 5 10 15 20 25SNR [dB]avg. rel. capacity deviation [%]1.81.61.41.210.80.60.40.204x4, rank 14x4, rank 24x4, rank 34x4, rank 4−5 0 5 10 15 20 25SNR [dB]Figure A.2: 4×4 antenna configuration: High-SNR CLSM precoder choice accuracy resultsfor each possible rank choice. Left: model failure rate. Right: deviation interms <strong>of</strong> capacity (% <strong>the</strong> optimum choice).model failure ratio0.250.20.150.10.050−5 0 5 10 15 20 25SNR [dB]avg. rel. capacity deviation [%]2.521.510.504x2, rank 14x2, rank 2−5 0 5 10 15 20 25SNR [dB]Figure A.3: 4×2 antenna configuration: High-SNR CLSM precoder choice accuracy resultsfor each possible rank choice. Left: model failure rate. Right: deviation interms <strong>of</strong> capacity (% <strong>the</strong> optimum choice).The right plot in Figure A.2 depicts <strong>the</strong> average relative capacity deviation thatresults from this error. Results for <strong>the</strong> 4 × 2 antenna configuration are provided inFigure A.3, <strong>and</strong> show results similar to those found for <strong>the</strong> 4 × 4 case. For <strong>the</strong> 2 × 2case, due to <strong>the</strong> smaller codebook size, <strong>the</strong> model was found to have a failure rate88
A. SNR-independence <strong>of</strong> <strong>the</strong> CLSM Precoder Choice<strong>of</strong> zero. The 95% confidence intervals are shown as vertical bars on <strong>the</strong> curves.The high-SNR approximation is shown to be always accurate for <strong>the</strong> rank-one transmission,with <strong>the</strong> ratio <strong>of</strong> a wrong optimum precoder choice growing with <strong>the</strong> number<strong>of</strong> layers. For <strong>the</strong> four-layer case, a suboptimal precoder was chosen in average between40% to 20% <strong>of</strong> <strong>the</strong> cases in <strong>the</strong> -5 dB-25 dB SNR range are observed, whichalbeit seemingly big, maps to an error between 1.6% to 0.6% in terms <strong>of</strong> sum spectralefficiency. For <strong>the</strong> 4×2 case, <strong>the</strong> worst-case deviation ranges from 2.3% to 0.4%.Fur<strong>the</strong>r decreasing <strong>the</strong> impact <strong>of</strong> <strong>the</strong> deviation is <strong>the</strong> fact that at low SNR, a highrankprecoder will very probably not be used. Figure A.4 depicts <strong>the</strong> average sumspectral efficiency for <strong>the</strong> optimum precoder choice over SNR for <strong>the</strong> 4×2 <strong>and</strong> 4×4antenna configurations for <strong>the</strong> low-SNR range <strong>of</strong> -5 dB to 5 dB SNR.avg. sum capacity [bit/cu]4.543.532.521.514x2, rank 14x2, rank 20.5−5 0 5SNR [dB]avg. sum capacity [bit/cu]76543214x4, rank 14x4, rank 24x4, rank 34x4, rank 40−5 0 5SNR [dB]Figure A.4: Sum-capacity over SNR with an optimum precoder choice for each possible rankchoice. Left: 4×2 antenna configuration. Right: 4×4 antenna configurationAs <strong>the</strong> UE feedback algorithm is to choose <strong>the</strong> PMI <strong>and</strong> RI combination maximizing<strong>the</strong> sum capacity, a low RI value is to be chosen at low SNR with high probability,which is exactly where <strong>the</strong> model is most precise.rank choice ratio10.90.80.70.60.50.40.30.20.104x2, rank 14x2, rank 2−5 0 5 10 15 20 25SNR [dB]rank choice ratio0.90.80.70.60.50.40.30.20.104x4, rank 14x4, rank 24x4, rank 34x4, rank 4−5 0 5 10 15 20 25SNR [dB]Figure A.5: Rank <strong>of</strong> <strong>the</strong> optimum precoder choice over SNR.This effect is shown in Figure A.5, where for each channel realization, <strong>the</strong> rankdistribution <strong>of</strong> <strong>the</strong> optimum PMI-RI combination is shown. For <strong>the</strong> 4 × 4 case, a89
A. SNR-independence <strong>of</strong> <strong>the</strong> CLSM Precoder Choicerank <strong>of</strong> four will not be employed in <strong>the</strong> low-SNR regime, while a rank <strong>of</strong> three willonly be employed in <strong>the</strong> SNR range where <strong>the</strong> deviation is already low. The sameapplies for <strong>the</strong> 4 × 2 case, thus confirming that a high-rank precoder choice on a lowSNR range, which suffers <strong>of</strong> model inaccuracy, is a negligible source <strong>of</strong> error..Hence <strong>the</strong> conclusion that <strong>the</strong> optimum precoder can be chosen independently <strong>of</strong><strong>the</strong> SNR (i.e., precalculated <strong>of</strong>fline) with no impact in <strong>the</strong> output <strong>of</strong> <strong>the</strong> L2S model.Accepting this negligible deviation in <strong>the</strong> L2S model allows for a drastic simplificationin runtime complexity, making it possible to substitute complex-valued matrixmultiplications <strong>and</strong> inverses with scalar products <strong>of</strong> precomputed fading parameters,as shown in Section 3.1.1.3.90
B. Correlation Matrices for Shadow Fading GenerationB. Correlation Matrices for ShadowFading GenerationThis appendix details <strong>the</strong> correlation matrix employed for <strong>the</strong> generation <strong>of</strong> <strong>the</strong>shadow fading traces, which is explained in Section 3.1.1.5. The <strong>LTE</strong> L2S modelpresented in Chapter 3 extends <strong>the</strong> model in [87] to twelve neighbors, employing <strong>the</strong>correlation matrix detailed below.The distance matrix (in pixels) between <strong>the</strong> current pixel, denoted as s n , <strong>and</strong> its 12neighbors s n−1 . . . s n−12 , is depicted in Figure 3.8:⎡ √ √ √ √ √ √ √ √ ⎤0 2 1 5 5 1 2 8 2 10 5 13 1√ √ √ √ √ √ 2 0 1 1 1 5 2 2 2 2 5 5 1√ √ √ √ √ √ 1 1 0 2 2 2 1 5 1 3 2 10 2√ √ √ √ √ √ √ 5 1 2 0 2 10 5 1 3 1 10 2 2√ √ √ √ √ √ 5 1 2 2 0 8 1 1 5 5 2 2 2√ √ √ √ √ √ √ √ 1 5 2 10 8 0 5 13 1 17 2 20 2√ √ √ √ √ √ X s =2 2 1 5 1 5 0 2 2 10 1 3 5√ √ √ √ √ √ √ .8 2 5 1 1 13 2 0 10 2 3 1 5√ √ √ √ √ √ 2 2 1 3 5 1 2 10 0 4 1 17 5√ √ √ √ √ √ √ 10 2 3 1 5 17 10 2 4 0 17 1 5√ √ √ √ √ √ 5 5 2 10 2 2 1 3 1 17 0 4 8⎢√ √ √ √ √ √ √ ⎥⎣ 13 5 10 2 2 20 3 1 17 1 4 0 8 ⎦√ √ √ √ √ √ √ √1 1 2 2 2 2 5 5 5 5 8 8 0(B.1)Assuming α = 1/20, as stated in Section 3.1.1.5, <strong>and</strong> a pixel resolution d <strong>of</strong> 5 m, <strong>the</strong>91
B. Correlation Matrices for Shadow Fading Generationcorrelation matrix R s can be expressed element-wise as()[R s ] i,j= exp −α · [X s ] i,j · d , (B.2)resulting in a correlation matrix R s⎡⎤1 0.7 0.78 0.57 0.57 0.78 0.61 0.49 0.7 0.45 0.57 0.41 0.780.7 1 0.78 0.78 0.78 0.57 0.7 0.7 0.61 0.61 0.57 0.57 0.780.78 0.78 1 0.61 0.7 0.7 0.78 0.57 0.78 0.47 0.7 0.45 0.70.57 0.78 0.61 1 0.7 0.45 0.57 0.78 0.47 0.78 0.45 0.7 0.70.57 0.78 0.7 0.7 1 0.49 0.78 0.78 0.57 0.57 0.61 0.61 0.610.78 0.57 0.7 0.45 0.49 1 0.57 0.41 0.78 0.36 0.61 0.33 0.61R s =0.61 0.7 0.78 0.57 0.78 0.57 1 0.61 0.7 0.45 0.78 0.47 0.57,0.49 0.7 0.57 0.78 0.78 0.41 0.61 1 0.45 0.7 0.47 0.78 0.570.7 0.61 0.78 0.47 0.57 0.78 0.7 0.45 1 0.37 0.78 0.36 0.570.45 0.61 0.47 0.78 0.57 0.36 0.45 0.7 0.37 1 0.36 0.78 0.570.57 0.57 0.7 0.45 0.61 0.61 0.78 0.47 0.78 0.36 1 0.37 0.49⎢⎥⎣0.41 0.57 0.45 0.7 0.61 0.33 0.47 0.78 0.36 0.78 0.37 1 0.49⎦0.78 0.78 0.7 0.7 0.61 0.61 0.57 0.57 0.57 0.57 0.49 0.49 1(B.3)where L s L H s = R s , <strong>and</strong> ˜L s can be obtained by removing <strong>the</strong> last row <strong>and</strong> column <strong>of</strong>L s .92
C. Taylor Expansion <strong>of</strong> <strong>the</strong> ZF MSEC. Taylor Expansion <strong>of</strong> <strong>the</strong> ZF MSE withImperfect Channel KnowledgeThis appendix details <strong>the</strong> derivation <strong>of</strong> <strong>the</strong> MSE expression in Equation (4.15), aswell as a more detailed view <strong>of</strong> <strong>the</strong> channel estimation model employed in Section 4.2.It refers to <strong>the</strong> work in [117] <strong>and</strong> extends <strong>the</strong> solutions found in [118, 119, 142, 143]for <strong>the</strong> case <strong>of</strong> additional interferers.The estimated channel matrix, denoted as Ĥ, is expressed as <strong>the</strong> sum <strong>of</strong> <strong>the</strong> channelmatrix H <strong>and</strong> an error matrix E:Ĥ = H + E,(C.1)where <strong>the</strong> error matrix E is composed <strong>of</strong> complex-gaussian elements e ij , i.e.,e ij ∼ CN ( 0, σ 2 e). (C.2)Taking into account <strong>the</strong> precoder matrix W, <strong>the</strong> effective channel matrix ˜H <strong>and</strong> <strong>the</strong>estimated effective channel matrix ˆ˜H are expressed asˆ˜H = HW,ˆ˜H = (H + E) W = HW } {{ } + EW }{{} . (C.3)˜H ẼAs <strong>the</strong> precoder does not change <strong>the</strong> overall transmit power when splitting it over<strong>the</strong> ν layers,W H W = I νν .(C.4)93
C. Taylor Expansion <strong>of</strong> <strong>the</strong> ZF MSEAdditionally, as each non-zero element <strong>of</strong> W has a power equally distributed overall <strong>the</strong> non-zero elements <strong>of</strong> W, each element <strong>of</strong> W has an average power <strong>of</strong>1Ẽ = EW,ẽ i,j ∼ CN(0, σ 2 e√NtxThe following notation is employed for <strong>the</strong> model parameters:ν),ˆ˜H = ˜H + Ẽ.σ 2 x = Average power allocated for transmission over all transmit antennas.σ 2 v = Average received noise power per antenna.σ 2 e = Average power <strong>of</strong> <strong>the</strong> elements <strong>of</strong> E ∼ CN ( 0, σ 2 e).σ 2 s = Average power <strong>of</strong> <strong>the</strong> transmitted symbols on each layer.ν N TX,(C.5)ν = Number <strong>of</strong> spatial layers being employed. i.e., ν symbols are being transmitted.H = Channel matrix ∈ N rx×Ntx .W = Precoding matrix ∈ R Ntx×ν .˜H = Effective channel matrix.˜H = HW ∈ C Nrx×ν .Denoting as H 0 <strong>the</strong> channel between <strong>the</strong> transmitter <strong>and</strong> receiver <strong>and</strong> as H i <strong>the</strong>channel for each <strong>of</strong> <strong>the</strong> I interferers, where i = 1, 2, . . . , I, <strong>the</strong> receiver filter G ZF isexpressed asG ZF =( ˆ˜HH 0ˆ˜H0) −1ˆ˜HH 0 =( (˜H0 + Ẽ) H (˜H0 + Ẽ) ) −1 (˜H0 + Ẽ) H, (C.6)while <strong>the</strong> difference between <strong>the</strong> receive symbol vector ŝ ZF = G ZF(˜H0 s 0 + v + ∑ Ii=1 ˜H i s i)<strong>and</strong> <strong>the</strong> transmitted symbol vector s isŝ ZF − s = G ZF(−EWs 0 + v +)I∑˜H i s ii=1(−1= − ((H 0 + E) W) H (H 0 + E) W)((H0 + E) W) H EW} {{ }(++) −1((H 0 + E) W) H (H 0 + E) W ((H0 + E) W) H v} {{ }NI∑i=0Ds 0(C.7)(−1((H 0 + E) W) H (H 0 + E) W)((H0 + E) W) H ˜Hi} {{ }I i =N ˜H is i , (C.8)where we separate <strong>the</strong> expression into a signal part (D), a noise part (N), <strong>and</strong> aninterference part (I i ).94
C. Taylor Expansion <strong>of</strong> <strong>the</strong> ZF MSEApplying a Taylor series expansion at E = 0, we obtain⎡ŝ ZF − s ≈ − ⎣ ∑ ∂D}}R{[E] nr,nt n r,n t ∂R{[E] nr,nt ∣E=0+ ∑ ∂D{ } ⎤}I [E] ⎦ nr,nt s 0n r,n t ∂I{[E] nr,nt ∣E=0⎡+ ⎣ ( ) −1˜HH 0 ˜H0 ˜HH 0 + ∑ ∂N}n r,n t ∂R{[E] nr,nt ∣E=0+ ∑ ∂N{ } ⎤}I [E] ⎦ nr,nt vn r,n t ∂I{[E] nr,nt ∣E=0⎡I∑+ ⎣ ( ) −1˜HH 0 ˜H0 ˜HH 0 ˜Hi + ∑ ∂I i}∣i=0n r,n t ∂R{[E] nr,nt + ∑ ∂I i{ } ⎤}∣ I [E] ⎦ nr,nt s i .n r,n t ∂I{[E] nr,nt ∣E=0}R{[E] nr,nt ∣E=0}R{[E] nr,nt (C.9)Extending <strong>the</strong> aforementioned solutions for <strong>the</strong> Taylor expansion in [118, 119, 142,143] to include interferers:ŝ ZF − s ≈ −(˜HH 0 ˜H0) −1˜HH 0 Ẽs 0 +(˜HH 0 ˜H0) −1 (˜HH 0 + ẼH) v−(˜HH 0 ˜H0) −1 (˜HH 0 Ẽ + ẼH ˜H0) (˜HH 0 ˜H0) −1˜HH 0 v+−I∑[ ( ) −1 (˜HH 0 ˜H0 ˜HH 0 + ẼH) ˜Hi s ii=1(˜HH 0 ˜H0) −1 (˜HH 0 Ẽ + ẼH ˜H0) (˜HH 0 ˜H0) −1˜HH 0 ˜Hi s i], (C.10)which expressed in shorter form,ŝ ZF − s = −−1 ˜H 0 Ẽs 0 +˜H−10v − ˜H−10−1Ẽ ˜H0 v + I∑i=1[ ˜H−1 0˜H i s i −]−1 −1 ˜H 0 Ẽ ˜H 0˜H i s i .(C.11)With <strong>the</strong> reasonable assumption that s i , s, <strong>and</strong> E are statistically independent, <strong>the</strong>95
C. Taylor Expansion <strong>of</strong> <strong>the</strong> ZF MSEMSE can be expressed asMSE ZF = E{(˜s − s) (˜s − s) H}≈˜H−10 E {Ẽs0 s H 0++( ) HẼH} ˜H−1 0(−1 ˜H 0 E{ vvH} ˜H−1 0I∑i=0[˜H −10 E {˜Hi s i s H i{−1+ ˜H 0 E −1Ẽ ˜H 0˜H i s i s H i) {H+ ˜H−1 0 E Ẽ˜H H i˜H H i} ( ) H ˜H−1 0 +˜H−10vvH(˜H−1( ) } H ( ) ] H ˜H−1 0 ẼH ˜H−1 00) HẼH} ( ˜H−1 0) H(C.12)ApplyingE { EE H} = σ 2 e N tx I Nrx ,(C.13)<strong>and</strong> applying from [118]E { EAE H} = Tr (A) σ 2 e I Nrx ,(C.14)<strong>the</strong> MSE in Equation (C.11) can be expressed as(( (H0MSE ZF = σeσ 2 x 2 0+ σv 2 + σvσ 2 eTr 2 H H ) −1)) ( ) −10 ˜HH 0 ˜H0[ (I∑ σ+ ˜H −12xi0 H i H H i + σ2 (x iσ 2N txi NeTr H i H H (i H0 H H 0txii=1as shown in Section 4.2.)]) −1) ( ) H ˜H−1 0 ,(C.15)96
D. Evaluation <strong>of</strong> Multi-User GainD. Evaluation <strong>of</strong> Multi-User GainSection 3.2.1.1 states that <strong>the</strong> reduction in simulation run time due to <strong>the</strong> application<strong>of</strong> a L2S model enables <strong>the</strong> analysis <strong>of</strong> more complex MU scenarios. One suchscenario is <strong>the</strong> evaluation <strong>of</strong> <strong>the</strong> MU gain <strong>of</strong> different scheduling strategies to schedule<strong>the</strong> UEs in a cell [144]. Without an in-depth analysis such as in Chapter 5, thisappendix presents such an example <strong>of</strong> MU performance evaluation.Beginning with <strong>the</strong> SISO case, as an upper performance limit, <strong>the</strong> best CQI scheduleris employed, which assigns each RB to <strong>the</strong> UE with <strong>the</strong> highest reported channelquality. As a lower performance threshold, <strong>the</strong> round robin scheduler is employed. Inround robin, each UE is assigned <strong>the</strong> same number <strong>of</strong> RBs, regardless <strong>of</strong> <strong>the</strong> reportedchannel conditions. Next to <strong>the</strong>se, an implementation <strong>of</strong> proportional fair schedulingfor OFDM [134] is compared. Results over UEs/cell are shown in Figure D.1.Avg. cell throughput [Mbit/s]90807060504030200Throughput 1x15 10 15 20 25 30number <strong>of</strong> UEs/cellFairness <strong>of</strong> UE throughput10.90.80.70.60.50.40.30.20.100Fairness 1x15 10 15 20 25 30number <strong>of</strong> UEs/cellRound Robin Proportional fair Best CQI fitFigure D.1: 1×1 Single transmit antenna transmit mode multi-user gain. Left: throughputresults. Right: fairness results. Vertical lines mark <strong>the</strong> 95% confidence intervals.97
D. Evaluation <strong>of</strong> Multi-User GainSimilar to <strong>the</strong> analysis in [63], this simulation extends <strong>the</strong> MIMO scenario describedin Table 5.1 (but without <strong>the</strong> addition <strong>of</strong> FFR). For <strong>the</strong>se results, we compare <strong>the</strong>throughput results with a log log fit. The reasoning for this fit is based on adapting<strong>the</strong> assumption that, for N TX transmit antennas at <strong>the</strong> eNodeB <strong>and</strong> N RX receiveantennas at each <strong>of</strong> <strong>the</strong> K UEs, cell capacity grown with N TX log log (KN RX ) [77,145, 146] to this cellular scenario in which each UE does not experience <strong>the</strong> sameSNR 1 .A metric a log log (K b) is adopted to quantify <strong>the</strong> maximum achievable MU gainin this scenario for different antenna configurations. Denoting as log log (K b 1×1 )<strong>the</strong> MU gain for <strong>the</strong> 1×1 case <strong>and</strong> accordingly normalizing, 2×2 <strong>and</strong> 4×4 CLSMconfigurations, shown in Figures D.2 <strong>and</strong> D.3 are compared to <strong>the</strong> SISO case. Weterm a as <strong>the</strong> multiplexing gain, while b is denoted as <strong>the</strong> multi-user gain flattening,as it depicts <strong>the</strong> reduction in <strong>the</strong> capacity <strong>of</strong> <strong>the</strong> scheduler to correctly extract multiusergain.Avg. cell throughput [Mbit/s]1401301201101009080706050400Throughput 2x25 10 15 20 25 30number <strong>of</strong> UEs/cellFairness <strong>of</strong> UE throughput10.90.80.70.60.50.40.30.20.100Fairness 2x25 10 15 20 25 30number <strong>of</strong> UEs/cellRound Robin Proportional fair Best CQI fitFigure D.2: 2×2 CLSM transmit mode multi-user gain results. Left: throughput results.Right: fairness results. Vertical lines mark <strong>the</strong> 95% confidence intervals.The values obtained from a log log MSE-minimizing fit are shown in Table D.1 for<strong>the</strong> SISO <strong>and</strong> 2×2 CLSM <strong>and</strong> 4×4 CLSM cases.Table D.1.: log log fit results for <strong>the</strong> 1×1, 2×2, <strong>and</strong> 4×4 antenna configurations.1×1 2×2 CLSM 4×4 CLSMMultiplexing gain a - 1.55 2.67MU-gain flattening b 5.6 7.07 10.33While <strong>the</strong> potential throughput <strong>of</strong> 4×4 is double that <strong>of</strong> 2×2, such gains are not1 The original expression is derived for MU-gain derived from <strong>the</strong> channel distribution, ra<strong>the</strong>r thanthat <strong>of</strong> <strong>the</strong> channel <strong>and</strong> <strong>the</strong> cell pathloss/layout.98
D. Evaluation <strong>of</strong> Multi-User GainAvg. cell throughput [Mbit/s]240220200180160140120100800Throughput 4x45 10 15 20 25 30number <strong>of</strong> UEs/cellFairness <strong>of</strong> UE throughput10.90.80.70.60.50.40.30.20.100Fairness 4x45 10 15 20 25 30number <strong>of</strong> UEs/cellRound Robin Proportional fair Best CQI fitFigure D.3: 4×4 CLSM transmit mode multi-user gain results. Left: throughput results.Right: fairness results. Vertical lines mark <strong>the</strong> 95% confidence intervals.achievable unless unrealistically high SNRs are present, even in <strong>the</strong> case <strong>of</strong> uncorrelatedchannels, as previously shown on Figure 3.17.An analysis such as <strong>the</strong> one conducted here also quantifies <strong>the</strong> reduction in multi-usergain seen between <strong>the</strong> round robin <strong>and</strong> proportional fair schedulers when switchingfrom a 2×2 to a 4×4 antenna configuration due to <strong>the</strong> higher suboptimality (dueto <strong>the</strong> higher number <strong>of</strong> degrees <strong>of</strong> freedom), <strong>of</strong> <strong>the</strong> PMI <strong>and</strong> RI feedback in 4×4MIMO.The results <strong>of</strong> practically-employed schedulers, such as round robin <strong>and</strong> proportionalfair can in this manner be compared to <strong>the</strong> upper threshold <strong>of</strong> <strong>the</strong> best CQI scheduler,which is not used due to it starving <strong>the</strong> majority <strong>of</strong> UEs in a cell.Alternately, <strong>and</strong> similarly to <strong>the</strong> evaluation in Chapter 5, throughput <strong>and</strong> fairness(see Section 5.4) results can be evaluated toge<strong>the</strong>r. As observed from Figures D.1 toD.3, proportional fair scheduling consistently converges to <strong>the</strong> same fairness value<strong>of</strong> roughly 0.7, with a decrease in multi-user gain for higher antenna counts, while<strong>the</strong> varying fairness results <strong>of</strong> round robin hint at it operating at different points <strong>of</strong><strong>the</strong> fairness-throughput trade-<strong>of</strong>f shown in Section 5.6.99
D. Evaluation <strong>of</strong> Multi-User Gain100
Abbreviations <strong>and</strong> AcronymsAbbreviations <strong>and</strong> Acronyms3GPPACMIAMCARQAVIAWGNBICMBLERBSCCACAPEXCBCCCDDcdfCDMACLSMCPC-PlaneCQI3rd Generation Partnership ProjectAccumulated Mutual InformationAdaptive Modulation <strong>and</strong> CodingAutomatic Repeat reQuestActual Value InterfaceAdditive White Gaussian NoiseBit-Interleaved Coded ModulationBlock Error RatioBase Station ControllerCarrier AggregationCAPital EXpenditureCode BlockChase CombiningCyclic Delay DiversityCumulative Density FunctionCode-Division Multiple AccessClosed Loop Spatial MultiplexingCyclic PrefixControl PlaneChannel Quality Indicator101
Abbreviations <strong>and</strong> AcronymsCRCCSICoMPDASDHCPDLDLSCHecdfECREDGEEESMeNodeBEPCESME-UTRANFDDFDMAFFRFFTFRGERANGPRSGSMHARQHSDPAHSPAHSSIAIRIPISICyclic Redundancy CheckChannel State InformationCooperative Multi-PointDistributed Antenna <strong>System</strong>sDynamic Host Configuration Protocol<strong>Downlink</strong><strong>Downlink</strong> Shared Channelempirical cdfEffective Code RateEnhanced Data Rates for GSM EvolutionExponential Effective SINR MappingEvolved Node BEvolved Packet CoreEffective SINR MappingEvolved UMTS Terrestrial Radio Access NetworkFrequency Division DuplexFrequency Division Multiple AccessFractional Frequency ReuseFast Fourier TransformFull ReuseGSM EDGE Radio Access NetworkGeneral Packet Radio ServiceGlobal <strong>System</strong> for Mobile communicationsHybrid Automatic Repeat reQuestHigh-Speed <strong>Downlink</strong> Packet AccessHigh-Speed Packet AccessHome Subscriber ServerInterference AlignmentIncremental RedundancyInternet ProtocolInter-Symbol Interference102
Abbreviations <strong>and</strong> AcronymsKPILLRL2S<strong>LTE</strong>M2MMACMCLMCSMIMIESMMIMOMMEMRCMSEMUNASOFDMOFDMAOLSMOPEXPCRFPDCPpdfPDNP-GWPHYPFPMIPRQAMQoSKey Performance IndicatorLog-Likelihood RatioLink-to-<strong>System</strong>Long Term EvolutionMachine-to-MachineMedium Access ControlMinimum Coupling LossModulation <strong>and</strong> Coding SchemeMutual InformationMutual Information Effective SINR MappingMultiple-Input Multiple-OutputMobility Management EntityMaximum Ratio CombiningMean Square ErrorMulti-UserNon-Access StratumOrthogonal Frequency-Division MultiplexingOrthogonal Frequency-Division Multiple AccessOpen Loop Spatial MultiplexingOPerational EXpenditurePolicy <strong>and</strong> Charging Rules FunctionPacket Data Convergence Protocolprobability density functionPacket Data NetworkPDN GatewayPhysicalProportional FairPrecoding Matrix IndicatorPartial ReuseQuadrature Amplitude ModulationQuality <strong>of</strong> Service103
Abbreviations <strong>and</strong> AcronymsRANRBRERIRLCRNCROHCROIRRCRRMSAESCSC-FDMASGSNS-GWSIMOSINRSISOSMSNRSTBCSUSU-MIMOSVDTBTDDTTITxDUEULUMTSRadio Access NetworkResource BlockResource ElementRank IndicatorRadio Link ControlRadio Network ControllerRObust Header CompressionRegion Of InterestRadio Resource ControlRadio Resource Management<strong>System</strong> Architecture EvolutionSubCarrierSingle-carrier FDMAServing-General packet radio service Support NodeServing GatewaySingle-Input Multiple-OutputSignal to Interference <strong>and</strong> Noise RatioSingle-Input Single-OutputSpatial MultiplexingSignal to Noise RatioSpace-Time Block CodeSingle-UserSingle User MIMOSingular Value DecompositionTransport BlockTime Division DuplexTransmission Time IntervalTransmit DiversityUser EquipmentUplinkUniversal Mobile Telecommunications <strong>System</strong>104
Abbreviations <strong>and</strong> AcronymsU-PlaneUTRANW-CDMAZFUser PlaneUMTS Terrestrial Radio Access NetworkWideb<strong>and</strong> Code Division Multiple AccessZero Forcing105
Abbreviations <strong>and</strong> Acronyms106
Abbreviations <strong>and</strong> AcronymsBibliography[1] “Cisco visual networking index: Global mobile data traffic forecast update, 2011-2016,”Cisco, Tech. Rep., 2012.[2] “Ericsson mobility report,” Ericsson, Tech. Rep., Nov. 2012.[3] “CTIA semi-annual wireless industry survey,” CTIA, Tech. Rep., 2012.[4] “The impact <strong>of</strong> latency on application performance,” Nokia Siemens networks, Tech. Rep.,2009.[5] G. Foschini, “Layered space-time architecture for wireless communication in a fading environmentwhen using multi-element antennas,” Bell labs technical journal, vol. 1, no. 2, pp.41–59, 1996.[6] S. Weinstein <strong>and</strong> P. Ebert, “Data transmission by frequency-division multiplexing using <strong>the</strong>discrete Fourier transform,” IEEE Transactions on Communication Technology, vol. 19, no. 5,pp. 628–634, 1971.[7] Technical Specification Group Radio Access Network, “Physical layer - general description,”3GPP, Tech. Rep. TS 25.201, Dec. 2009.[8] “Vienna <strong>LTE</strong> link <strong>and</strong> system level simulator download site.”http://www.nt.tuwien.ac.at/ltesimulator/[9] A. Gurtov, M. Passoja, O. Aalto, <strong>and</strong> M. Raitola, “Multi-layer protocol tracing in a GPRSnetwork,” in IEEE 56th Vehicular Technology Conference (VTC2002-Fall), Québec City,Canada, Sept. 2002.[10] H. Holma <strong>and</strong> J. Reunanen, “3GPP release 5 HSDPA measurements,” in IEEE 17th InternationalSymposium on Personal, Indoor <strong>and</strong> Mobile Radio Communications (PIMRC2006),Helsinki, Finl<strong>and</strong>, Sept. 2006.[11] S. Sesia, I. Toufik, <strong>and</strong> M. Baker, <strong>LTE</strong>, The UMTS Long Term Evolution: From Theory toPractice. John Wiley & Sons, Sept. 2011.[12] Technical Specification Group Radio Access Network, “E-UTRA; <strong>LTE</strong> physical layer – generaldescription,” 3GPP, Tech. Rep. TS 36.201, Mar. 2009.[13] H. Holma <strong>and</strong> A. Toskala, WCDMA for UMTS: HSPA Evolution <strong>and</strong> <strong>LTE</strong>. Wiley, Nov.2007.[14] Ericsson, “Mobile broadb<strong>and</strong>, busting <strong>the</strong> myth <strong>of</strong> <strong>the</strong> scissor effect,” White paper, Feb.2010.[15] Technical Specification Group Radio Access Network, “Requirements for evolved UTRA (E-UTRA) <strong>and</strong> evolved UTRAN (E-UTRAN),” 3rd Generation Partnership Project (3GPP),Tech. Rep. TR 25.913, Dec. 2009.[16] H. Holma, A. Toskala, K. Ranta-Aho, <strong>and</strong> J. Pirskanen, “High-speed packet access evolutionin 3GPP release 7,” IEEE Communications Magazine, vol. 45, no. 12, pp. 29–35, 2007.[17] J. C. Ikuno, UMTS Long-Term Evolution. in Evaluation <strong>of</strong> HSDPA <strong>and</strong> <strong>LTE</strong>: From Testbed107
BibliographyMeasurements to <strong>System</strong> <strong>Level</strong> Performance, S. Caban, C. Mehlführer, M. Rupp, <strong>and</strong> M.Wrulich, Eds. John Wiley & Sons, Ltd, 2012.[18] E. Dahlman, S. Parkvall, J. Skold, <strong>and</strong> P. Beming, 3G Evolution: HSDPA <strong>and</strong> <strong>LTE</strong> for MobileBroadb<strong>and</strong>. Academic Press, July 2007.[19] H. Yin <strong>and</strong> S. Alamouti, “OFDMA: A broadb<strong>and</strong> wireless access technology,” in IEEE 2006Sarn<strong>of</strong>f Symposium, Mar. 2006.[20] H. Myung, J. Lim, <strong>and</strong> D. Goodman, “Single carrier FDMA for uplink wireless transmission,”IEEE Vehicular Technology Magazine, vol. 1, no. 3, pp. 30–38, 2006.[21] E. Dahlman, H. Ekstrom, A. Furuskar, Y. Jading, J. Karlsson, M. Lundevall, <strong>and</strong> S. Parkvall,“The 3G Long-Term Evolution - radio interface concepts <strong>and</strong> performance evaluation,” in63rd IEEE Vehicular Technology Conference 2006 (VTC2006-Spring), Melbourne, Australia,May 2006.[22] H. Ekstrom, A. Furuskar, J. Karlsson, M. Meyer, S. Parkvall, J. Torsner, <strong>and</strong> M. Wahlqvist,“Technical solutions for <strong>the</strong> 3G Long-Term Evolution,” IEEE Communications Magazine,vol. 44, no. 3, pp. 38–45, Mar. 2006.[23] M. Tanno, Y. Kishiyama, N. Miki, K. Higuchi, <strong>and</strong> M. Sawahashi, “Evolved UTRA - physicallayer overview,” in IEEE 8th Workshop on Signal Processing Advances in Wireless Communications2007 (SPAWC2007), Helsinki, Finl<strong>and</strong>, June 2007.[24] J. J. Sánchez, D. Morales-Jiménez, G. Gómez, <strong>and</strong> J. T. Enbrambasaguas, “Physical layerperformance <strong>of</strong> Long Term Evolution cellular technology,” in 16th Mobile <strong>and</strong> WirelessCommunications Summit (IST2007), Budapest, Hungary, July 2007.[25] D. Tse <strong>and</strong> P. Viswanath, Fundamentals <strong>of</strong> Wireless Communication. Cambridge UniversityPress, June 2005.[26] C. Mehlführer <strong>and</strong> M. Rupp, “A robust MMSE equalizer for MIMO enhanced HSDPA,”in Conference Record <strong>of</strong> <strong>the</strong> 40th Asilomar Conference on Signals, <strong>System</strong>s <strong>and</strong> Computers(Asilomar2006), Pacific Grove, California, October 2006.[27] T. Tang <strong>and</strong> R. Heath, “Opportunistic feedback for downlink multiuser diversity,” IEEECommunications Letters, vol. 9, no. 10, pp. 948–950, Oct. 2005.[28] A. Gyasi-Agyei, “Multiuser diversity based opportunistic scheduling for wireless data networks,”IEEE Communications Letters, vol. 9, no. 7, pp. 670–672, July 2005.[29] Technical Specification Group Radio Access Network, “E-UTRA; user equipment (UE) radioaccess capabilities,” 3GPP, Tech. Rep. TS 36.306, Mar. 2010.[30] Ericsson, “SAE - <strong>the</strong> core network for <strong>LTE</strong>,” Apr. 2008.[31] Technical Specification Group Services <strong>and</strong> <strong>System</strong> Aspects, “General packet radio service(GPRS) enhancements for evolved universal terrestrial radio access network (E-UTRAN)access,” 3GPP, Tech. Rep. TS 23.401, Mar. 2010.[32] Technical Specification Group Services <strong>and</strong> <strong>System</strong> Aspects, “Architecture enhancements fornon-3GPP accesses,” 3GPP, Tech. Rep. TS 23.402, Mar. 2010.[33] Ericsson, “<strong>LTE</strong>-an introduction. 284 23-3124 Uen Rev B,” White paper, June 2009.[34] K. S<strong>and</strong>lund, G. Pelletier, <strong>and</strong> L.-E. Jonsson, “The RObust Header Compression (ROHC)framework,” Internet Engineering Task Force (IETF), Tech. Rep. RFC 5795, Mar. 2010.[35] Technical Specification Group Radio Access Network, “Evolved universal terrestrial radioaccess (E-UTRA) <strong>and</strong> evolved universal terrestrial radio access network (E-UTRAN); overall108
Abbreviations <strong>and</strong> Acronymsdescription; stage 2,” 3GPP, Tech. Rep. TS 36.300, Mar. 2009.[36] Technical Specification Group Core Network <strong>and</strong> Terminals, “Non-access-stratum (NAS)protocol for evolved packet system (EPS),” 3GPP, Tech. Rep. TS 23.301, Mar. 2012.[37] P. Lescuyer <strong>and</strong> T. Lucidarme, Evolved Packet <strong>System</strong> (EPS). John Wiley & Sons, Inc.,2008.[38] S. Blake, D. Black, M. Carlson, E. Davies, Z. Wang, <strong>and</strong> W. Weiss, “An architecture fordifferentiated service,” IETF, Tech. Rep. RFC 2475, Dec. 1998.[39] Technical Specification Group Radio Access Network, “E-UTRA; physical channels <strong>and</strong> modulation,”3GPP, Tech. Rep. TS 36.211, May 2009.[40] Technical Specification Group Radio Access Network, “Evolved universal terrestrial radioaccess (E-UTRA); base station (BS) radio transmission <strong>and</strong> reception,” 3GPP, Tech. Rep.TS 36.104, Mar. 2009.[41] S. Alamouti, “A simple transmit diversity technique for wireless communications,” IEEEJournal on Selected Areas in Communications, vol. 16, no. 8, pp. 1451–1458, Oct. 1998.[42] M. Bossert, A. Hübner, F. Schühlein, H. Haas, <strong>and</strong> E. Costa, “On cyclic delay diversity inOFDM based transmission schemes,” in 7th International OFDM Workshop (InOWo2002),Hamburg, Germany, Aug. 2002.[43] A. Dammann <strong>and</strong> S. Plass, “Cyclic delay diversity: Effective channel properties <strong>and</strong> applications,”in IEEE International Conference on Communications (ICC 2007), Glasgow,Scotl<strong>and</strong>, 2007.[44] E. Telatar, “Capacity <strong>of</strong> multi-antenna gaussian channels,” European Transactions onTelecommunications, vol. 10, no. 6, pp. 585–595, 1999.[45] Technical Specification Group Radio Access Network, “E-UTRA; multiplexing <strong>and</strong> channelcoding,” 3GPP, Tech. Rep. TS 36.212, Mar. 2009.[46] J. C. Ikuno, S. Schwarz, <strong>and</strong> M. Šimko, “<strong>LTE</strong> rate matching performance with code blockbalancing,” in 17th European Wireless Conference (EW2011), Vienna, Austria, Apr. 2011.[47] C. Berrou, A. Glavieux, <strong>and</strong> P. Thitimajshima, “Near shannon limit error-correcting coding<strong>and</strong> decoding: Turbo-codes,” in IEEE International Conference on Communications(ICC93), Geneva, Switzerl<strong>and</strong>, May 1993.[48] Technical Specification Group Radio Access Network, “Multiplexing <strong>and</strong> channel coding(FDD),” 3GPP, Tech. Rep. TS 25.212, Mar. 2010.[49] J. Hagenauer, “Rate-compatible punctured convolutional codes (RCPC codes) <strong>and</strong> <strong>the</strong>irapplications,” IEEE Transactions on Communications, vol. 36, no. 4, pp. 389–400, Apr.1988.[50] I. Sohn <strong>and</strong> S. C. Bang, “Performance studies <strong>of</strong> rate matching for WCDMA mobile receiver,”in IEEE 52nd Vehicular Technology Conference (VTC 2000-Fall), Boston, Massachusetts,Sept. 2000.[51] S. Schwarz, M. Wrulich, <strong>and</strong> M. Rupp, “Mutual information based calculation <strong>of</strong> <strong>the</strong> precodingmatrix indicator for 3GPP UMTS/<strong>LTE</strong>,” in 14th ITG Workshop on Smart Antennas(WSA2010), Bremen, Germany, Feb. 2010.[52] D. Love <strong>and</strong> R. Heath, “Limited feedback precoding for spatial multiplexing systems usinglinear receivers,” in IEEE Military Communications Conference (MILCOM2003), Monterrey,California, Oct. 2003.109
Bibliography[53] Technical Specification Group Radio Access Network, “E-UTRA; physical layer procedures,”3GPP, Tech. Rep. TS 36.213, Mar. 2009.[54] S. Schwarz, C. Mehlführer, <strong>and</strong> M. Rupp, “Calculation <strong>of</strong> <strong>the</strong> spatial preprocessing <strong>and</strong> linkadaption feedback for 3GPP UMTS/<strong>LTE</strong>,” in IEEE 6th Conference on Wireless Advanced(WiAD2010), London, United Kingdom, June 2010.[55] Technical Specification Group Radio Access Network, “E-UTRA; medium access control(MAC) protocol specification,” 3GPP, Tech. Rep. TS 36.321, June 2010.[56] R. Kwan, C. Leung, <strong>and</strong> J. Zhang, “Multiuser scheduling on <strong>the</strong> downlink <strong>of</strong> an <strong>LTE</strong> cellularsystem,” Research Letters in Communications, vol. 2008, Jan. 2008.[57] R. K. Jain, D.-M. W. Chiu, <strong>and</strong> W. R. Hawe, “A Quantitative Measure Of Fairness AndDiscrimination For Resource Allocation In Shared Computer <strong>System</strong>s,” Digital EquipmentCorporation, Tech. Rep., Sept. 1984.[58] P. Viswanath, D. Tse, <strong>and</strong> R. Laroia, “Opportunistic beamforming using dumb antennas,”IEEE Transactions on Information Theory, vol. 48, no. 6, pp. 1277–1294, June 2002.[59] S. Schwarz, C. Mehlführer, <strong>and</strong> M. Rupp, “Low complexity approximate maximum throughputscheduling for <strong>LTE</strong>,” in Conference Record <strong>of</strong> <strong>the</strong> 44th Asilomar Conference on Signals,<strong>System</strong>s <strong>and</strong> Computers (Asilomar2010), Pacific Grove, California, Nov. 2010.[60] C. Shuping, L. Huibinu, Z. Dong, <strong>and</strong> K. Asimakis, “Generalized scheduler providing multimediaservices over HSDPA,” in IEEE International Conference on Multimedia <strong>and</strong> Expo(ICME2007), Beijing, China, July 2007.[61] D. Skoutas, D. Komnakos, D. Vouyioukas, <strong>and</strong> A. Rouskas, “Enhanced dedicated channelscheduling optimization in WCDMA,” in 14th European Wireless Conference (EW2008),Prague, Czech Republic, June 2008.[62] M. Laner, P. Svoboda, <strong>and</strong> M. Rupp, “Measurement aided model design for WCDMA linkerror statistics,” in IEEE International Conference on Communications (ICC2011), Kyoto,Japan, June 2011.[63] R. Pupala, L. Greenstein, <strong>and</strong> D. Daut, “<strong>System</strong>-level impact <strong>of</strong> multi-user diversity in SISO<strong>and</strong> MIMO-based cellular systems,” Journal <strong>of</strong> Communications, vol. 6, no. 4, pp. 274–284,2011.[64] I. Medvedev, B. Bjerke, R. Walton, J. Ketchum, M. Wallace, <strong>and</strong> S. Howard, “A comparison<strong>of</strong> MIMO receiver structures for 802.11n WLAN-performance <strong>and</strong> complexity,” inIEEE 17th International Symposium on Personal, Indoor <strong>and</strong> Mobile Radio Communications(PIMRC2006), Sept. 2006.[65] A. Paulraj, D. Gore, R. Nabar, <strong>and</strong> H. Bolcskei, “An overview <strong>of</strong> MIMO communications-akey to gigabit wireless,” Proceedings <strong>of</strong> <strong>the</strong> IEEE, vol. 92, no. 2, pp. 198–218, Feb. 2004.[66] D. Gesbert, M. Shafi, D. shan Shiu, P. Smith, <strong>and</strong> A. Naguib, “From <strong>the</strong>ory to practice: anoverview <strong>of</strong> MIMO space-time coded wireless systems,” IEEE Journal on Selected Areas inCommunications, vol. 21, no. 3, pp. 281–302, Apr. 2003.[67] S. Schwarz, M. Simko, <strong>and</strong> M. Rupp, “On performance bounds for MIMO OFDM basedwireless communication systems,” in IEEE Signal Processing Advances in Wireless Communications(SPAWC2011), San Francisco, California, June 2011.[68] C. Mehlführer, J. C. Ikuno, M. Šimko, S. Schwarz, M. Wrulich, <strong>and</strong> M. Rupp, “The Vienna<strong>LTE</strong> simulators - enabling reproducibility in wireless communications research,” EURASIPJournal on Advances in Signal Processing, vol. 2011, no. 1, pp. 1–14, 2011.110
Abbreviations <strong>and</strong> Acronyms[69] Technical Specification Group Radio Access Network, “E-UTRA; <strong>LTE</strong> RF system scenarios,”3GPP, Tech. Rep. TR 36.942, Dec. 2008.[70] R. Ghaffar <strong>and</strong> R. Knopp, “Low complexity metrics for BICM SISO <strong>and</strong> MIMO systems,” inIEEE 71st Vehicular Technology Conference (VTC2010-Spring), Taipei, Taiwan, May 2010.[71] E. Zehavi, “8-PSK trellis codes for a rayleigh channel,” IEEE Transactions on Communications,vol. 40, no. 5, pp. 873–884, 1992.[72] G. Caire, G. Taricco, <strong>and</strong> E. Biglieri, “Bit-interleaved coded modulation,” IEEE Transactionson Information Theory, vol. 44, no. 3, pp. 927–946, 1998.[73] K. Brueninghaus, D. Astely, T. Salzer, S. Visuri, A. Alexiou, S. Karger, <strong>and</strong> G. Seraji, “Linkperformance models for system level simulations <strong>of</strong> broadb<strong>and</strong> radio access systems,” inIEEE 16th International Symposium on Personal, Indoor <strong>and</strong> Mobile Radio Communications(PIMRC2005), Berlin, Germany, Sept. 2005.[74] M. Wrulich, S. Eder, I. Viering, <strong>and</strong> M. Rupp, “Efficient link-to-system level model forMIMO HSDPA,” in 20008 IEEE GLOBECOM Workshops, New Orleans, Louisiana, 2008.[75] C. Mehlführer, S. Caban, M. Wrulich, <strong>and</strong> M. Rupp, “Joint throughput optimized CQI <strong>and</strong>precoding weight calculation for MIMO HSDPA,” in 42nd Asilomar Conference on Signals,<strong>System</strong>s <strong>and</strong> Computers (Asilomar2008), Pacific Grove, California, 2008.[76] Members <strong>of</strong> WINNER, “Assessment <strong>of</strong> advanced beamforming <strong>and</strong> MIMO technologies,”WINNER, Tech. Rep. IST-2003-507581, 2005.[77] R. Heath Jr, M. Airy, <strong>and</strong> A. Paulraj, “Multiuser diversity for MIMO wireless systems withlinear receivers,” in 35th Asilomar Conference on Signals, <strong>System</strong>s <strong>and</strong> Computers (Asilomar2001),vol. 2, Pacific Grove, California, 2001.[78] J. C. Ikuno, M. Wrulich, <strong>and</strong> M. Rupp, “<strong>System</strong> level simulation <strong>of</strong> <strong>LTE</strong> networks,” in 71stVehicular Technology Conference (VTC2010-Spring), Taipei, Taiwan, May 2010.[79] L. Thiele, T. Wirth, K. Börner, M. Olbrich, V. Jungnickel, J. Rumold, <strong>and</strong> S. Fritze,“<strong>Modeling</strong> <strong>of</strong> 3D field patterns <strong>of</strong> downtilted antennas <strong>and</strong> <strong>the</strong>ir impact on cellular systems,”in 13th ITG International ITG Workshop on Smart Antennas (WSA2009), Berlin,Germany, Feb. 2009.[80] N. Jaldén, P. Zetterberg, B. Ottersten, A. Hong, <strong>and</strong> R. Thoma, “Correlation properties <strong>of</strong>large scale fading based on indoor measurements,” in IEEE Wireless Communications <strong>and</strong>Networking Conference, (WCNC2007), Hong Kong, China, Mar. 2007.[81] Technical Specification Group Radio Access Network, “RF system scenarios,” 3GPP, Tech.Rep. TR 25.942, Dec. 2008.[82] Technical Specification Group Radio Access Network, “Physical layer aspects for E-UTRA,”3GPP, Tech. Rep. TR 25.814, 2006.[83] Technical Specification Group Radio Access Network, “E-UTRA; fur<strong>the</strong>r advancements forE-UTRA physical layer aspects,” 3GPP, Tech. Rep. TR 36.814, Mar. 2010.[84] M. Gudmundson, “Correlation model for shadow fading in mobile radio systems,” Electronicsletters, vol. 27, no. 23, pp. 2145–2146, 1991.[85] D. Giancrist<strong>of</strong>aro, “Correlation model for shadow fading in mobile radio channels,” ElectronicsLetters, vol. 32, no. 11, pp. 958–959, 1996.[86] R. Vijayan <strong>and</strong> J. Holtzman, “The dynamic behavior <strong>of</strong> h<strong>and</strong><strong>of</strong>f algorithms,” in 1st InternationalConference on Universal Personal Communications (ICUPC1992), Dallas, Texas,111
BibliographySept. 1992.[87] H. Claussen, “Efficient modelling <strong>of</strong> channel maps with correlated shadow fading in mobileradio systems,” in IEEE 16th International Symposium on Personal, Indoor <strong>and</strong> Mobile RadioCommunications (PIMRC2005), Berlin, Germany, Sept. 2005.[88] M. Moisio <strong>and</strong> A. Oborina, “Comparison <strong>of</strong> effective SINR mapping with traditional AVIapproach for modeling packet error rate in multi–state channel,” Next Generation Teletraffic<strong>and</strong> Wired/Wireless Advanced Networking, pp. 461–473, 2006.[89] Y. Blankenship, P. Sartori, B. Classon, V. Desai, <strong>and</strong> K. Baum, “Link error prediction methodsfor multicarrier systems,” in IEEE 60th Vehicular Technology Conference (VTC2004-Fall), Los Angeles, California, Sept. 2004.[90] L. Wan, S. Tsai, <strong>and</strong> M. Almgren, “A fading-insensitive performance metric for a unifiedlink quality model,” in IEEE Wireless Communications <strong>and</strong> Networking Conference (WCNC2006), Las Vegas, Nevada, Apr. 2006.[91] E. Tuomaala <strong>and</strong> H. Wang, “Effective SINR approach <strong>of</strong> link to system mapping inOFDM/multi-carrier mobile network,” in 2nd International Conference on Mobile Technology,Applications <strong>and</strong> <strong>System</strong>s (MC07), Boston, Massachusetts, Nov. 2005.[92] G. Caire, G. Taricco, <strong>and</strong> E. Biglieri, “Capacity <strong>of</strong> bit-interleaved channels,” ElectronicsLetters, vol. 32, no. 12, pp. 1060–1061, 1996.[93] G. Piro, L. Grieco, G. Boggia, F. Capozzi, <strong>and</strong> P. Camarda, “Simulating <strong>LTE</strong> cellular systems:An open-source framework,” IEEE Transactions on Vehicular Technology, vol. 60, no. 2, pp.498–513, 2011.[94] G. Piro, N. Baldo, <strong>and</strong> M. Miozzo, “An <strong>LTE</strong> module for <strong>the</strong> ns-3 network simulator,” in 4thInternational ICST Conference on Simulation Tools <strong>and</strong> Techniques (SIMUTools2011), 2011.[95] D. Bültmann, M. Muehleisen, K. Klagges, <strong>and</strong> M. Schinnenburg, “openwns - open wirelessnetwork simulator,” in 15th European Wireless Conference (EW2009), Aalborg, Denmark,May 2009.[96] D. Rose, T. Jansen, <strong>and</strong> T. Kurner, “<strong>Modeling</strong> <strong>of</strong> femto cells-simulation <strong>of</strong> interference<strong>and</strong> h<strong>and</strong>overs in <strong>LTE</strong> networks,” in IEEE 71st Vehicular Technology Conference (VTC2011-Spring), Budapest, Hungary, May 2011.[97] Members <strong>of</strong> ITU, “Recommendation ITU-R M.1225: Guidelines for evaluation <strong>of</strong> radiotransmission technologies for IMT-2000,” International Telecommunication Union (ITU),Tech. Rep., Feb. 1997.[98] C. Mehlführer, M. Wrulich, J. C. Ikuno, D. Bosanska, <strong>and</strong> M. Rupp, “Simulating <strong>the</strong> LongTerm Evolution physical layer,” in European Signal Processing Conference (EUSIPCO2009),Glasgow, Scotl<strong>and</strong>, Aug. 2009.[99] P. Mogensen, W. Na, I. Kovács, F. Frederiksen, A. Pokhariyal, K. Pedersen, T. Kolding,K. Hugl, <strong>and</strong> M. Kuusela, “<strong>LTE</strong> capacity compared to <strong>the</strong> Shannon bound,” in IEEE 65thVehicular Technology Conference (VTC2007-Spring), Dublin, Irel<strong>and</strong>, Apr. 2007.[100] A. Golaup, M. Mustapha, <strong>and</strong> L. Patanapongpibul, “Femtocell access control strategy inUMTS <strong>and</strong> <strong>LTE</strong>,” IEEE Communications Magazine, vol. 47, no. 9, pp. 117–123, 2009.[101] H. Zhang, X. Wen, B. Wang, W. Zheng, <strong>and</strong> Y. Sun, “A novel h<strong>and</strong>over mechanism betweenfemtocell <strong>and</strong> macrocell for <strong>LTE</strong> based networks,” in Second International Conference onCommunication S<strong>of</strong>tware <strong>and</strong> Networks (ICCSN2010), 2010.[102] P. Kulkarni, W. Chin, <strong>and</strong> T. Farnham, “Radio resource management considerations for <strong>LTE</strong>112
Abbreviations <strong>and</strong> Acronymsfemto cells,” ACM SIGCOMM Computer Communication Review, vol. 40, no. 1, pp. 26–30,2010.[103] V. Ch<strong>and</strong>rasekhar, J. Andrews, <strong>and</strong> A. Ga<strong>the</strong>rer, “Femtocell networks: a survey,” IEEECommunications Magazine, vol. 46, no. 9, pp. 59–67, 2008.[104] M. Taranetz, J. C. Ikuno, <strong>and</strong> M. Rupp, “Sensitivity <strong>of</strong> OFDMA-Based macrocellular <strong>LTE</strong>networks to femtocell deployment density <strong>and</strong> isolation,” in IEEE International Conferenceon Communications - Wireless Communications Symposium (ICC2013 WCS), Budapest,Hungary, June 2013.[105] Ericsson, “Outcome <strong>of</strong> adhoc discussion on refined simulation assumptions for calibration,”3GPP TSG RAN WG1, Tech. Rep. R1-092270, May 2009.[106] Ericsson, “Email discussion summary on calibration step 1c,” 3GPP TSG RAN WG1, Tech.Rep. R1-092742, June 2009.[107] K. Kusume, G. Dietl, T. Abe, H. Taoka, <strong>and</strong> S. Nagata, “<strong>System</strong> level performance <strong>of</strong> downlinkMU-MIMO transmission for 3GPP <strong>LTE</strong>-advanced,” in IEEE 71st Vehicular TechnologyConference (VTC2010-Spring), Taipei, Taiwan, May.[108] D. Chase, “Code combining–a maximum-likelihood decoding approach for combining anarbitrary number <strong>of</strong> noisy packets,” IEEE Transactions on Communications, vol. 33, no. 5,pp. 385–393, May 1985.[109] J. C. Ikuno, C. Mehlführer, <strong>and</strong> M.Rupp, “A novel LEP model for OFDM systems withHARQ,” in IEEE International Conference on Communications (ICC2011), Kyoto, Japan,June 2011.[110] J.-F. Cheng, “On <strong>the</strong> coding gain <strong>of</strong> incremental redundancy over chase combining,” inGlobal Telecommunications Conference (GLOBECOM2003), San Francisco, California, Dec.2003.[111] J.-F. Cheng, “Coding performance <strong>of</strong> hybrid ARQ schemes,” IEEE Transactions on CommunicationsCommunications, vol. 54, no. 6, pp. 1017–1029, Mar. 2006.[112] N. Prasad <strong>and</strong> M. K. Varanasi, “Outage <strong>the</strong>orems for MIMO block fading channels,” IEEETransactions on Information Theory, vol. 52, no. 12, pp. 5284–5296, 2006.[113] P. Wu <strong>and</strong> N. Jindal, “Performance <strong>of</strong> hybrid-ARQ in block-fading channels: A fixed outageprobability analysis,” IEEE Transactions on Communications, vol. 58, no. 4, pp. 1129–1141,Apr. 2010.[114] Y. R. Zheng <strong>and</strong> C. Xiao, “Simulation models with correct statistical properties for rayleighfading channels,” IEEE Transactions on Communications, vol. 51, no. 6, pp. 920–928, June2003.[115] T. Zemen <strong>and</strong> C. Mecklenbräuker, “Time-variant channel estimation using discrete prolatespheroidal sequences,” IEEE Transactions on Signal Processing, vol. 53, no. 9, pp. 3597–3607,Sept. 2005.[116] M. Šimko, C. Mehlführer, T. Zemen, <strong>and</strong> M. Rupp, “Inter-Carrier Interference Estimation inMIMO OFDM <strong>System</strong>s with Arbitrary Pilot Structure,” in IEEE 73rd Vehicular TechnologyConference (VTC2011-Spring), Budapest, Hungary, May 2011.[117] J. C. Ikuno, S. Pendl, M. Simko, <strong>and</strong> M. Rupp, “Accurate SINR estimation model for systemlevel simulation <strong>of</strong> <strong>LTE</strong> networks,” in IEEE International conference on Communications2011 (ICC2012), Ottawa, Canada, June 2012.[118] C. Wang, E. K. S. Au, R. D. Murch, W. H. Mow, R. S. Cheng, <strong>and</strong> V. K. N. Lau, “On113
Bibliography<strong>the</strong> performance <strong>of</strong> <strong>the</strong> MIMO zero-forcing receiver in <strong>the</strong> presence <strong>of</strong> channel estimationerror,” IEEE Transactions on Wireless Communications, vol. 6, no. 3, pp. 805–810, 2007.[119] T. Weber, A. Sklavos, <strong>and</strong> M. Meurer, “Imperfect channel-state information in MIMO transmission,”IEEE Transactions on Communications, vol. 54, no. 3, pp. 543–552, 2006.[120] M. Šimko, S. Pendl, S. Schwarz, Q. Wang, J. C. Ikuno, <strong>and</strong> M. Rupp, “Optimal pilot symbolpower allocation in <strong>LTE</strong>,” in IEEE 74th Vehicular Technology Conference (VTC2011-Fall),San Francisco, California, Sept. 2011.[121] M. Simko, C. Mehlführer, T. Zemen, <strong>and</strong> M. Rupp, “Inter-carrier interference estimation inMIMO OFDM systems with arbitrary pilot structure,” in IEEE 73rd Vehicular TechnologyConference (VTC2011-Spring), Budapest, Hungary, May 2011.[122] L. Hentilä, P. Kyösti, M. Käske, M. Nar<strong>and</strong>zic, <strong>and</strong> M. Alatossava, “MATLABimplementation <strong>of</strong> <strong>the</strong> WINNER phase II channel model ver1.1,” Dec. 2007.http://www.ist-winner.org/phase 2 model.html[123] G. Boudreau, J. Panicker, N. Guo, R. Chang, N. Wang, <strong>and</strong> S. Vrzic, “Interference coordination<strong>and</strong> cancellation for 4G networks,” IEEE Communications Magazine, vol. 47, no. 4,pp. 74–81, Apr. 2009.[124] T. Novlan, J. Andrews, I. Sohn, R. Ganti, <strong>and</strong> A. Ghosh, “Comparison <strong>of</strong> fractional frequencyreuse approaches in <strong>the</strong> OFDMA cellular downlink,” in Proceedings <strong>of</strong> <strong>the</strong> 2010 IEEE GlobalTelecommunications Conference (GLOBECOM2010), Baltimore, Maryl<strong>and</strong>, Dec. 2010.[125] M. Assaad, “Optimal fractional frequency reuse (FFR) in multicellular OFDMA system,” inIEEE 68th Vehicular Technology Conference (VTC2008-Fall), Calgary, Canada, Sept. 2008.[126] M. Rahman <strong>and</strong> H. Yanikomeroglu, “Enhancing cell-edge performance: a downlink dynamicinterference avoidance scheme with inter-cell coordination,” IEEE Transactions <strong>of</strong> WirelessCommunications, vol. 9, no. 4, pp. 1414–1425, Apr. 2010.[127] A. Najjar, N. Hamdi, <strong>and</strong> A. Bouallegue, “Efficient frequency reuse scheme for multi-cellOFDMA systems,” in IEEE Symposium on Computers <strong>and</strong> Communications (ISCC2009),Sousse, Tunisia, July 2009.[128] V. Jungnickel, M. Schellmann, L. Thiele, T. Wirth, T. Haustein, O. Koch, W. Zirwas, <strong>and</strong>E. Schulz, “Interference-aware scheduling in <strong>the</strong> multiuser MIMO-OFDM downlink,” IEEECommunications Magazine, vol. 47, no. 6, pp. 56–66, June 2009.[129] Z. Xie <strong>and</strong> B. Walke, “Frequency reuse techniques for attaining both coverage <strong>and</strong> high spectralefficiency in <strong>of</strong>dma cellular systems,” in IEEE Wireless Communications <strong>and</strong> NetworkingConference (WCNC2010), Sydney, Australia, Apr. 2010.[130] A. Simonsson, “Frequency reuse <strong>and</strong> intercell interference co-ordination in E-UTRA,” inIEEE 65th Vehicular Technology Conference (VTC2007-Spring), Dublin, Irel<strong>and</strong>, Apr. 2007.[131] L. Chen <strong>and</strong> D. Yuan, “Generalized frequency reuse schemes for OFDMA networks: <strong>Optimization</strong><strong>and</strong> comparison,” in IEEE 71st Vehicular Technology Conference (VTC2010-Spring), Taipei, Taiwan, May 2010.[132] B. Krasniqi, M. Wrulich, <strong>and</strong> C. Mecklenbräuker, “Network-load dependent partial frequencyreuse for lte,” in 9th International Symposium on Communications <strong>and</strong> Information Technology(ISCIT2009), Incheon, Korea, Sept. 2009.[133] M. Taranetz <strong>and</strong> J. C. Ikuno, “Capacity density optimization by fractional frequency partitioning,”in 45th Annual Asilomar Conference on Signals, <strong>System</strong>s, <strong>and</strong> Computers (ASILO-MAR2011), Pacific Grove, California, Nov. 2011.114
Abbreviations <strong>and</strong> Acronyms[134] Z. Sun, C. Yin, <strong>and</strong> G. Yue, “Reduced-complexity proportional fair scheduling for OFDMAsystems,” in 2006 International Conference on Communications, Circuits <strong>and</strong> <strong>System</strong>s (IC-CCAS2006), Guilin, China, June 2006.[135] J. C. Ikuno, M. Taranetz, <strong>and</strong> M. Rupp, “A fairness-based performance evaluation <strong>of</strong> fractionalfrequency reuse in <strong>LTE</strong>,” in 17th International ITG Workshop on Smart Antennas(WSA2013), Stuttgart, Germany, Mar. 2013.[136] A. Jalali, R. Padovani, <strong>and</strong> R. Pankaj, “Data throughput <strong>of</strong> CDMA-HDR a high efficiencyhighdata rate personal communication wireless system,” in IEEE 51st Vehicular Technology(VTC2000-Spring, Tokyo, Japan, 2000.[137] S. Schwarz, C. Mehlführer, <strong>and</strong> M. Rupp, “Throughput maximizing multiuser schedulingwith adjustable fairness,” in IEEE International Conference on Communications (ICC2011),Kyoto, Japan, June 2011.[138] M. Taranetz <strong>and</strong> M. Rupp, “Performance <strong>of</strong> femtocell access point deployments in user hotspotscenarios,” in Australasian Telecommunication Networks <strong>and</strong> Applications Conference(ATNAC2012), Nov. 2012.[139] F. Richter, A. Fehske, <strong>and</strong> G. Fettweis, “Energy efficiency aspects <strong>of</strong> base station deploymentstrategies for cellular networks,” in IEEE 70th Vehicular Technology Conference Fall(VTC2009-Fall), Anchorage, Alaska, Sept. 2009.[140] L. Correia, D. Zeller, O. Blume, D. Ferling, Y. Jading, I. Godor, G. Auer, <strong>and</strong> L. VanDer Perre, “Challenges <strong>and</strong> enabling technologies for energy aware mobile radio networks,”IEEE Communications Magazine, vol. 48, no. 11, pp. 66–72, 2010.[141] Technical Specification Group Radio Access Network, “E-UTRA; carrier aggregation; basestation (BS) radio transmission <strong>and</strong> reception,” 3GPP, Tech. Rep. TR 36.808, July 2012.[142] T. Weber, A. Sklavos, <strong>and</strong> M. Meurer, “Channel knowledge: A crucial prerequisite for MIMOtransmission?” in COST 273 TD(03)083, Paris, France, May 2003.[143] X. Jin, H. Jiang, J. Hu, Y. Yuan, C. Zhao, <strong>and</strong> J. Shi, “Maximum data rate power allocationfor MIMO spatial multiplexing systems with imperfect CSI,” in IEEE 69rd VehicularTechnology Conference (VTC2009-Spring), Apr. 2009.[144] S. Schwarz, J. Colom Ikuno, M. Šimko, M. Taranetz, Q. Wang, <strong>and</strong> M. Rupp, “Pushing <strong>the</strong>Limits <strong>of</strong> <strong>LTE</strong>: A Survey on Research Enhancing <strong>the</strong> St<strong>and</strong>ard,” arXiv e-prints, Dec. 2012.[145] M. Sharif <strong>and</strong> B. Hassibi, “A comparison <strong>of</strong> time-sharing, DPC, <strong>and</strong> beamforming for MIMObroadcast channels with many users,” Communications, IEEE Transactions on, vol. 55, no. 1,pp. 11–15, 2007.[146] M. Kountouris, “The cardinal role <strong>of</strong> scheduling in downlink multiuser MIMO systems,” May2007.115


