National Football League Game Summary
National Football League Game Summary
National Football League Game Summary

Create successful ePaper yourself
Turn your PDF publications into a flip-book with our unique Google optimized e-Paper software.
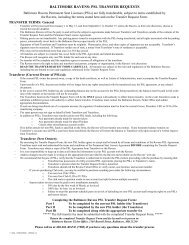
Carolina Panthers vs Baltimore Ravens8/22/2013 at M&T Bank StadiumFinal Team StatisticsVisitorPanthersHomeRavensTOTAL FIRST DOWNSBy RushingBy PassingBy PenaltyTHIRD DOWN EFFICIENCYFOURTH DOWN EFFICIENCYTOTAL NET YARDSTotal Offensive Plays (inc. times thrown passing)Average gain per offensive playNET YARDS RUSHINGTotal Rushing PlaysAverage gain per rushing playTackles for a loss-number and yardsNET YARDS PASSINGTimes thrown - yards lost attempting to passGross yards passingPASS ATTEMPTS-COMPLETIONS-HAD INTERCEPTEDAvg gain per pass play (inc.# thrown passing)KICKOFFS Number-In End Zone-TouchbacksPUNTS Number and AverageHad BlockedFGs - PATs Had BlockedNet Punting AverageTOTAL RETURN YARDAGE (Not Including Kickoffs)No. and Yards Punt ReturnsNo. and Yards Kickoff ReturnsNo. and Yards Interception ReturnsPENALTIES Number and YardsFUMBLES Number and LostTOUCHDOWNSRushingPassingInterceptionsFumblesPunt ReturnsEXTRA POINTS Made-AttemptsKicking Made-AttemptsFIELD GOALS Made-AttemptsRED ZONE EFFICIENCYGOAL TO GO EFFICIENCYSAFETIESFINAL SCORETIME OF POSSESSION14 274 116 124 44-13-31% 7-13-54%0-0-0% 0-0-0%173 35750 773.5 4.675 16924 433.1 3.92-9 6-2798 1883-21 3-14119 20223-12-0 31-22-33.8 5.57-7-2 6-5-46-48.3 2-52.00 00-0 0-027.3 15.0207 1062-74 4-1062-47 5-1313-133 0-012-133 9-900-0 1-14 30 20 12 01 01 04-4 3-34-4 3-32-2 2-20-0-0% 2-5-40%0-0-0% 2-2-100%0 034 2724:15 35:45