Making the Best of Both Worlds: Findings from a National Institution
Making the Best of Both Worlds: Findings from a National Institution
Making the Best of Both Worlds: Findings from a National Institution
- No tags were found...

Create successful ePaper yourself
Turn your PDF publications into a flip-book with our unique Google optimized e-Paper software.
This publication is part <strong>of</strong> The Dual Ladder in Higher Education—Research, Resources, and <strong>the</strong> Academic Workforce Dual Ladder Clearinghouseproject funded by <strong>the</strong> Alfred P. Sloan Foundation.Part I written by Jean Waltman. Part II written by Louise August.Project team membersCarol Hollenshead, CEW DirectorJean Waltman, Project ManagerLouise AugustJeanne MillerGilia SmithAllison BellPublished byThe Center for <strong>the</strong> Education <strong>of</strong> WomenUniversity <strong>of</strong> Michigan330 E. Liberty St.Ann Arbor, MI 48104734-764-6005www.cew.umich.edu© 2007 Regents <strong>of</strong> <strong>the</strong> University <strong>of</strong> Michigan
In Part One, we discuss findings, both <strong>from</strong> our own study and <strong>from</strong> o<strong>the</strong>r research, that1. highlight <strong>the</strong> numbers, working conditions, and perceived contributions <strong>of</strong> NTTF; and2. demonstrate how institutions can integrate NTTF as vital members <strong>of</strong> <strong>the</strong>ir pr<strong>of</strong>essionalteams.In Part Two, we present an overview <strong>of</strong> <strong>the</strong> research findings in chart and table format,in order to facilitate use <strong>of</strong> <strong>the</strong> extensive data ga<strong>the</strong>red <strong>from</strong> <strong>the</strong> CEW institutionalsurvey.Figures referred to in Part One are contained in Part Two.N O N - T E N U R E T R A C K FA C U LT Y T H R O U G H T H E E Y E S O FA D M I N I S T R AT O R SDiscussions about non-tenure track faculty <strong>of</strong>ten focus on <strong>the</strong> challenges <strong>the</strong>y present tohigher education and <strong>the</strong> effects <strong>the</strong>y have on students, departments, and <strong>the</strong> pr<strong>of</strong>essoriate.In <strong>the</strong> eyes <strong>of</strong> some, “The increase in contingent faculty is ano<strong>the</strong>r symptom <strong>of</strong> <strong>the</strong>sneak attack on academic values and stability <strong>of</strong> faculty as a whole.” 1Some recent studies, for example, suggest that non-tenure track faculty are associatedwith decreases in such desirable student outcomes as integration, retention, and graduation.2 O<strong>the</strong>rs posit that high-turnover NTTF positions contribute to a lack <strong>of</strong> continuitywithin departments. 3 In addition, tenure-track faculty may not trust NTTF to beinvolved in shared governance. The faculty may also believe that, due to <strong>the</strong> lack <strong>of</strong> jobsecurity and academic freedom, NTTF cannot honestly broach controversial issues. 4Ask administrators <strong>the</strong>ir perceptions about <strong>the</strong> non-tenure track faculty at <strong>the</strong>ir owninstitutions, however, and a much more positive picture emerges. When we askedadministrators “What do you believe are <strong>the</strong> most significant contributions that nontenuretrack faculty make to your institution?” over 80 percent <strong>of</strong> our survey respondentsanswered, giving strikingly positive opinions.2• Over a quarter <strong>of</strong> <strong>the</strong> administrators told us that <strong>the</strong>ir institutions benefit becausenon-tenure track instructors tend to be “superb teachers,” “committed to nurturingstudents,” “interested in pedagogy,” and “creatively engaged as key advisors andmentors.” In <strong>the</strong> words <strong>of</strong> one respondent, “Our NTTF are young and enthusiastic….They bring freshness, new and different opinions.” These positive impressions aresupported by o<strong>the</strong>r researchers’ findings that, although some may be concerned<strong>Making</strong> <strong>the</strong> <strong>Best</strong> <strong>of</strong> <strong>Both</strong> <strong>Worlds</strong>
about <strong>the</strong> quality <strong>of</strong> NTTF teaching, 5 many department chairs actually think that<strong>the</strong>se faculty provide more high-quality instruction than do tenured and tenure-trackfaculty. 6• A third <strong>of</strong> <strong>the</strong> administrators said <strong>the</strong>y hire and value non-tenure track faculty for <strong>the</strong>“specialized expertise and pr<strong>of</strong>essional perspectives” <strong>the</strong>y bring to <strong>the</strong> classroom.“Most <strong>of</strong> our non-tenure track faculty work in <strong>the</strong> fields related to what <strong>the</strong>y teach,”said one administrator. “It brings a more realistic atmosphere to <strong>the</strong> classroom.” Theybring, said ano<strong>the</strong>r, “<strong>the</strong> latest ideas <strong>from</strong> business, public service and private practices.”Ano<strong>the</strong>r administrator gave <strong>the</strong> example <strong>of</strong> being able to hire a NTTF “specialistin child abuse for our Social Work program or a marketing director for a course inour College <strong>of</strong> Business.”• Over a quarter <strong>of</strong> <strong>the</strong> survey respondents said that <strong>the</strong>ir non-tenure track faculty arevaluable for <strong>the</strong> flexibility <strong>the</strong>y provide in scheduling appropriate numbers <strong>of</strong> coursesections. In addition to staffing high demand core courses, NTTF enable departmentsto “<strong>of</strong>fer more and smaller class sections in high-demand areas,” and “fill <strong>the</strong> need forextra course <strong>of</strong>ferings on short notice.” As one administrator explained, “NTTF provideus <strong>the</strong> flexibility to respond to enrollment increases/decreases, changes in studentdemand for classes, and budgetary surprises <strong>from</strong> our legislature.”• Ano<strong>the</strong>r common response <strong>from</strong> <strong>the</strong> administrators we queried is that non-tenure trackfaculty are especially valuable because <strong>the</strong>y free <strong>the</strong> tenure-track faculty for o<strong>the</strong>r pursuits.They fill in for faculty on sabbaticals and leaves and, in <strong>the</strong> words <strong>of</strong> one respondent,“allow us to give our tenure-track faculty appropriate time <strong>of</strong>f to pursue <strong>the</strong>irresearch.”In o<strong>the</strong>r words, in <strong>the</strong> eyes <strong>of</strong> many administrators, non-tenure track faculty are very good,dedicated teachers who add value to curricula through <strong>the</strong>ir specialized knowledge andskills and whose presence adds security and flexibility to departmental plans. Given <strong>the</strong>contributions NTTF make to so many aspects <strong>of</strong> an academic department’s smooth and pr<strong>of</strong>essionalfunctioning, it makes sense to acknowledge and streng<strong>the</strong>n <strong>the</strong> partnershipbetween NTTF and traditional tenured and tenure-track faculty.–––––––––– ––––––––––“Our best new faculty arenon-tenure track faculty. Theyare dynamic and committed,interested in pr<strong>of</strong>essionaldevelopment and institutionalsuccess.”– Administrator at smallliberal arts collage–––––––––– ––––––––––3<strong>Making</strong> <strong>the</strong> <strong>Best</strong> <strong>of</strong> <strong>Both</strong> <strong>Worlds</strong>
T H E P R E VA L E N C E O F N O N - T E N U R E T R A C K FA C U LT Y I NT O D AY ’ S C O L L E G E S A N D U N I V E R S I T I E SAt least in part because <strong>of</strong> <strong>the</strong> valuable roles that non-tenure track faculty play, institutionshave been employing NTTF at growing rates. Nearly half <strong>of</strong> our survey respondentstold us <strong>the</strong>y have increased <strong>the</strong> number <strong>of</strong> NTTF at <strong>the</strong>ir institutions in <strong>the</strong> pastfive years, while only 13 percent said that <strong>the</strong> number <strong>of</strong> NTTF at <strong>the</strong>ir institutions hasdecreased (Figure 13).As part <strong>of</strong> our project, we also learned that in all regions <strong>of</strong> <strong>the</strong> country, in both publicand private four-year institutions, non-tenure track faculty make up nearly half <strong>of</strong> <strong>the</strong>faculty population. The percentage <strong>of</strong> non-tenure track faculty at a college or universityis more variable across Carnegie classifications: <strong>the</strong> highest percentage <strong>of</strong> NTTF is atDoctoral-Intensive institutions; <strong>the</strong> lowest, at Liberal Arts colleges (Figure 8).The percentage <strong>of</strong> non-tenure track faculty also varies somewhat by <strong>the</strong> location <strong>of</strong>an institution. For example, institutions in midsized or large cities employ a higherpercentage <strong>of</strong> NTTF than do those in small or large towns. Large cities likely havebigger pools <strong>of</strong> academics and experienced pr<strong>of</strong>essionals in specialized fields, thusallowing colleges and universities to call upon <strong>the</strong>m for all <strong>the</strong> reasons we discussedearlier (Figure 8).Recent analyses <strong>of</strong> national datasets also document <strong>the</strong> prevalence <strong>of</strong> non-tenure trackfaculty. Between 1987 and 2003, <strong>the</strong> number <strong>of</strong> non-tenure track faculty members(both full- and part-time) has grown annually and shows evidence <strong>of</strong> continuing to doso. In all types <strong>of</strong> four-year colleges and universities, between 18 and 33 percent <strong>of</strong> fulltimefaculty are in <strong>the</strong> NTTF ranks, and between 86 and 92 percent <strong>of</strong> part-time facultyin those institutions are in non-tenure track positions. 7 By 2003, full- and part-timenon-tenure track appointments accounted for three out <strong>of</strong> five (65%) faculty positionsin all types <strong>of</strong> institutions 8 and for three out <strong>of</strong> four new hires. 9 During <strong>the</strong> same time,one out <strong>of</strong> every seven full-time tenure-track positions disappeared 10 likely contributingto <strong>the</strong> increased use <strong>of</strong> NTTF.4An interesting finding <strong>from</strong> our survey is worth noting here. When we asked about<strong>the</strong> future, only 17 percent <strong>of</strong> our respondents predicted that <strong>the</strong> numbers <strong>of</strong> non-tenuretrack faculty on <strong>the</strong>ir campuses would increase in <strong>the</strong> next one to two years. Eightythreepercent predicted that <strong>the</strong> numbers would remain <strong>the</strong> same or decrease (Figure 13).<strong>Making</strong> <strong>the</strong> <strong>Best</strong> <strong>of</strong> <strong>Both</strong> <strong>Worlds</strong>
In o<strong>the</strong>r words, though <strong>the</strong> growth rate may be leveling <strong>of</strong>f, it is none<strong>the</strong>less true thatacross all types <strong>of</strong> four-year institutions non-tenure track faculty have become a sizableproportion <strong>of</strong> teaching faculty.T H E H E T E R O G E N E I T Y O F N O N - T E N U R E T R A C K FA C U LT YGiven all <strong>the</strong> contributions <strong>the</strong>y make, non-tenure track faculty are likely to remain essentialinstructional partners with <strong>the</strong>ir tenure-track colleagues. The important question <strong>the</strong>nbecomes “How do colleges and universities create environments that incorporate <strong>the</strong>talents <strong>of</strong> NTTF, <strong>the</strong>reby enhancing <strong>the</strong> benefits to <strong>the</strong>ir students, to <strong>the</strong>ir institutions,and to both tenure-track and non-tenure track faculty?”The challenge is complex, given <strong>the</strong> fact that non-tenure track faculty are a much moreheterogeneous group than <strong>the</strong>ir tenure-track colleagues. In order to understand how tomake <strong>the</strong> non-tenure track an attractive option, we need to be aware <strong>of</strong> <strong>the</strong> various kinds<strong>of</strong> people who take on such appointments and for what reasons.Some beliefs about non-tenure track faculty assume a simplicity that belies <strong>the</strong> true situation.<strong>Institution</strong>s <strong>of</strong> higher education differ in mission, size and procedures; and enormous variationexists among disciplines. NTTF are also a varied group <strong>of</strong> pr<strong>of</strong>essionals. Accordingto reports, <strong>the</strong>y work under a myriad <strong>of</strong> titles, contingencies and conditions. They are parttime or full time; <strong>the</strong>y work without contracts, with indefinite contracts, or with limitedcontracts. Their salaries come <strong>from</strong> different funding sources. They may maintain consistentworkloads, or <strong>the</strong>ir terms <strong>of</strong> employment may vary <strong>from</strong> term to term, based uponuniversity demand. They may wish to remain in <strong>the</strong>ir current employment status, or <strong>the</strong>ymay be seeking permanent, tenure-track appointments. They are given very differentdegrees <strong>of</strong> financial and resource support. One <strong>of</strong> <strong>the</strong> few constants about this group <strong>of</strong>university employees is that <strong>the</strong>y do not have <strong>the</strong> same opportunities, privileges and securitythat tenure provides. 11It is important to keep <strong>the</strong>se many variations in mind because <strong>the</strong>y influence both 1) <strong>the</strong>degree to which non-tenure track faculty are integrated into <strong>the</strong>ir institutions, and 2) <strong>the</strong>amount and kinds <strong>of</strong> support that NTTF receive and desire <strong>from</strong> <strong>the</strong>ir employers.5<strong>Making</strong> <strong>the</strong> <strong>Best</strong> <strong>of</strong> <strong>Both</strong> <strong>Worlds</strong>
The Differences Between Full-time and Part-time Non-tenure Track FacultyPerhaps <strong>the</strong> most important distinction is between full- and part-time non-tenure trackemployees. Discussions about NTTF can become complicated when <strong>the</strong> terms “non-tenuretrack” and “part-time” are used interchangeably to refer to that group <strong>of</strong> faculty employeeswho hold positions not leading to tenure or “permanence <strong>of</strong> position.” Or when “full-time”is used as a synonym for “tenure-track.” Of course, not everyone does so, but <strong>the</strong> researchand anecdotal literature <strong>of</strong>ten does not clearly distinguish between <strong>the</strong>se terms. The 2004NSOPF data point out <strong>the</strong> error <strong>of</strong> not distinguishing between <strong>the</strong> two types <strong>of</strong> positions,given that 18-33 percent <strong>of</strong> NTTF are full-time and 86-92 percent <strong>of</strong> NTTF are part-timefaculty. 12 Even more, <strong>the</strong> findings <strong>from</strong> our 2006 survey show that, among our respondinginstitutions, <strong>the</strong> average percentage <strong>of</strong> NTTF employed on a full-time basis is 43 percent(Figure 11).Our research also indicates that, while both groups tend to be hired to teach <strong>the</strong> same types<strong>of</strong> undergraduate core courses (Figure 37), part-time and full-time non-tenure track facultypositions are different in a number <strong>of</strong> ways. For one, full-time NTTF resemble tenured andtenure-track faculty more than do part-time NTTF, 13 as o<strong>the</strong>rs have also noted. The mostobvious difference between full- and part-time NTTF, <strong>of</strong> course, is <strong>the</strong> percentage <strong>of</strong> <strong>the</strong>irappointments. Our survey asked respondents to identify <strong>the</strong> criteria (number <strong>of</strong> coursestaught, number <strong>of</strong> credit hours taught, or percentage <strong>of</strong> full time equivalent/FTE) <strong>the</strong>irinstitutions use to determine part-time vs. full-time status for non-tenure track faculty.More than two thirds <strong>of</strong> respondents indicated that <strong>the</strong>y used multiple measures. Of thoseusing percentage <strong>of</strong> FTE, nearly three quarters grant full-time status only to facultyemployed at 100% FTE (Figure 10).6Full- and part-time non-tenure track faculty are also treated differently by <strong>the</strong>ir institutionsin many o<strong>the</strong>r respects, beginning with hiring standards and processes and carrying thoughto terms <strong>of</strong> employment, compensation, benefits and many o<strong>the</strong>r aspects <strong>of</strong> <strong>the</strong>ir pr<strong>of</strong>essionallives and duties. For example, though our survey respondents told us that priorteaching experience, pr<strong>of</strong>essional credentials and practical experiences are criteria for bothfull- and part-time NTTF job candidates, one in four administrators also requires terminaldegrees for <strong>the</strong>ir full-time NTTF, while only one in ten requires terminal degrees for parttimeNTTF candidates (Figure 14).O<strong>the</strong>r hiring standards also appear to be more rigorous for full-time NTTF. When fillingfull-time non-tenure track faculty positions, more than half <strong>of</strong> administrators said that <strong>the</strong>irinstitutions conduct formal searches similar in scope to those for tenure-track candidates,<strong>Making</strong> <strong>the</strong> <strong>Best</strong> <strong>of</strong> <strong>Both</strong> <strong>Worlds</strong>
and nearly three quarters conduct formal searches that are more local in scope. (Thesequestions were asked independently, so implied portions do not add to one hundredpercent.) By contrast, when hiring part-time NTTF, more than half <strong>of</strong> <strong>the</strong> responding institutionssaid <strong>the</strong>y do not conduct any type <strong>of</strong> search. Instead, <strong>the</strong>y turn primarily to personsalready known to <strong>the</strong>m. In addition, administrators are much more likely to request andcontact references for full-time than for part-time NTTF (Figures 16, 17 and 18).It’s interesting that, although institutions appear to put considerably more effort into findingand hiring highly qualified full-time non-tenure track faculty, <strong>the</strong> average duration <strong>of</strong>employment is not markedly different for full-time (7 years) and part-time (5.5 years)NTTF (Figure 25). This finding is explained in part by <strong>the</strong> fact that a quarter <strong>of</strong> our surveyrespondents’ institutions impose limits on <strong>the</strong> length <strong>of</strong> time that full-time NTTF canremain in those positions—perhaps because allowing full-time NTTF to remain on departmentalteaching staffs for too long implies unintended, de facto tenure. By contrast, only 6percent <strong>of</strong> institutions impose such limits on part-time NTTF. The question <strong>of</strong> why parttimeNTTF stay for an even shorter time than <strong>the</strong>ir full-time counterparts is likelyexplained in part by <strong>the</strong> various reasons people choose to become NTTF in <strong>the</strong> first place,a finding we discuss later in this report.Ano<strong>the</strong>r measure <strong>of</strong> job conditions for non-tenure track faculty is short-term job security.Eighty-nine percent <strong>of</strong> our respondents said <strong>the</strong>y notify full-time NTTF at least severalmonths ahead <strong>of</strong> time about contract renewal decisions. That renewal time line is muchshorter for part-time NTTF: Two out <strong>of</strong> five receive only a month’s notice (and <strong>of</strong>ten muchless) that <strong>the</strong>y will have no teaching assignment for <strong>the</strong> coming semester (Figure 23).Compensation rates also differ for full- and part-time non-tenure track faculty. Whe<strong>the</strong>restablished on a “per credit hour” or “per course” basis, <strong>the</strong> minimum pay level for bothgroups is relatively similar. At <strong>the</strong> maximum end <strong>of</strong> <strong>the</strong> pay scale, however, full-timeNTTF earn considerably more than do part-time NTTF (Figure 29). A majority <strong>of</strong> institutionsreport that <strong>the</strong>y adjust pay rates for a number <strong>of</strong> factors: years <strong>of</strong> experience, level <strong>of</strong>credentials or o<strong>the</strong>r qualifications, length <strong>of</strong> service to <strong>the</strong> institution, and quality <strong>of</strong> performance.In each case, a higher percentage <strong>of</strong> full-time NTTF are rewarded based uponeach <strong>of</strong> <strong>the</strong>se criteria. Notably, 71 percent <strong>of</strong> institutions give raises to full-time NTTF forgood performance, while only half <strong>of</strong> part-time NTTF receive raises for good performance(Figure 28).7<strong>Making</strong> <strong>the</strong> <strong>Best</strong> <strong>of</strong> <strong>Both</strong> <strong>Worlds</strong>
T H E I N F L U E N C E O F U N I O N SApproximately a quarter <strong>of</strong> <strong>the</strong> institutions in <strong>the</strong> CEW study reportthat <strong>the</strong>ir faculties are represented by a union or o<strong>the</strong>r associationfor purposes <strong>of</strong> collective bargaining. With only a few exceptions,in unionized schools not only are both tenure-track and non-tenuretrack faculty unionized, but <strong>the</strong>y are also represented by <strong>the</strong> samebargaining units. In most cases <strong>the</strong> union had been in existencemore than three years.Unionized schools employ a larger portion <strong>of</strong> <strong>the</strong>ir faculty in nontenureeligible positions, and also tend to hire more <strong>of</strong> those NTTFon a part-time basis compared to non-unionized schools.The presence <strong>of</strong> a union makes a difference: Unionized NTTF arepaid more, are <strong>of</strong>fered a wider array <strong>of</strong> benefits including healthinsurance, retirement benefits and sick leave, and have generallybetter working conditions than <strong>the</strong>ir non-union counterparts.If <strong>the</strong> presence <strong>of</strong> a union results in a better life for NTTF, willNTTF continue <strong>the</strong> move to unionize? The answer is far <strong>from</strong>clear. The majority <strong>of</strong> our survey respondents (97%) report nounionizing activities on <strong>the</strong>ir campuses at <strong>the</strong> present (2006) yet<strong>the</strong> literature suggests that unionization is a rising tide acrosscampuses, for both tenure-track and non-tenure track faculty. 148<strong>Making</strong> <strong>the</strong> <strong>Best</strong> <strong>of</strong> <strong>Both</strong> <strong>Worlds</strong>
For most U.S. workers, access to employer-sponsored health insurance is a highly soughtbenefit, and such coverage is almost universal for tenure-track faculty. It is also nearlyuniversal for full-time non-tenure track faculty and <strong>the</strong>ir families. In contrast, only 51percent <strong>of</strong> institutions in our survey provide health insurance for part-time NTTF. Certaino<strong>the</strong>r benefits, such as life insurance, retirement plans, and sick leave, are <strong>of</strong>fered to alarge majority <strong>of</strong> full-time NTTF, though fewer institutions <strong>of</strong>fer various dependent careleaves. Only a few institutions <strong>of</strong>fer benefits o<strong>the</strong>r than health insurance to part-timeNTTF (Figures 31 and 33).In o<strong>the</strong>r aspects <strong>of</strong> <strong>the</strong>ir pr<strong>of</strong>essional lives, full-time non-tenure track faculty receive moresupport than do <strong>the</strong>ir part-time colleagues. They are more likely to be expected/allowedby <strong>the</strong>ir institutions to be involved in <strong>the</strong>ir own research, to advise students, to serve oncommittees, and to take part in departmental and institutional level governance. At <strong>the</strong>same time, <strong>the</strong>se full-time NTTF are more likely than <strong>the</strong> part-time NTTF to receive supportin <strong>the</strong> form <strong>of</strong> private <strong>of</strong>fice space, equipment, money for conferences and researchexpenses, and so forth (Figures 39-43).All <strong>of</strong> <strong>the</strong>se factors suggest that, instead <strong>of</strong> seeing <strong>the</strong> academic community as made up<strong>of</strong> two groups—<strong>the</strong> tenure- and <strong>the</strong> non-tenure tracks—we might more accurately recognizethree groups <strong>of</strong> pr<strong>of</strong>essionals: tenure-track faculty, full-time non-tenure track faculty,and part-time non-tenure track faculty. The American Association <strong>of</strong> UniversityPr<strong>of</strong>essors recommends that institutions reduce <strong>the</strong>ir numbers <strong>of</strong> part-time NTTF andincrease <strong>the</strong>ir numbers <strong>of</strong> and standards for full-time NTTF. 15 However, administratorshave told us that <strong>the</strong>y especially value <strong>the</strong> scheduling flexibility and <strong>the</strong> “specializedexpertise and pr<strong>of</strong>essional perspectives” that part-time NTTF uniquely <strong>of</strong>fer. Thus, wesuggest that, in order to maximize <strong>the</strong> assets <strong>of</strong> non-tenure track faculty, institutionsmight be better served by retaining both full- and part-time NTTF and working toimprove <strong>the</strong> quality <strong>of</strong> both types <strong>of</strong> positions.–––––––––– ––––––––––All <strong>of</strong> <strong>the</strong>se factors suggestthat, instead <strong>of</strong> seeing <strong>the</strong>academic community asmade up <strong>of</strong> two groups—<strong>the</strong> tenure- and <strong>the</strong>non-tenure tracks—we might more accuratelyrecognize three groups<strong>of</strong> pr<strong>of</strong>essionals:tenure track faculty,full-time non-tenuretrack faculty, andpart-time non-tenuretrack faculty.–––––––––– ––––––––––9<strong>Making</strong> <strong>the</strong> <strong>Best</strong> <strong>of</strong> <strong>Both</strong> <strong>Worlds</strong>
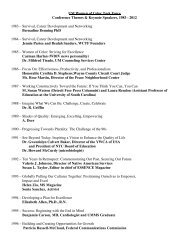
M A K I N G N O N - T E N U R E T R A C K FA C U LT Y P A R T O F T H EA C A D E M I C T E A M–––––––––– ––––––––––What can collegesand universitiesdo to increase <strong>the</strong>desirability <strong>of</strong> <strong>the</strong>positions and thusto increase <strong>the</strong>quality and stability<strong>of</strong> <strong>the</strong>ir non-tenuretrack faculty?–––––––––– ––––––––––From all accounts, people accept non-tenure track positions for a number <strong>of</strong> reasons.Gappa and Leslie have identified four general categories <strong>of</strong> NTTF: Career enders,specialists and experts, aspiring academics, and freelancers. 16 Within <strong>the</strong>se groupsmay be dual career or spousal hires; graduate students hoping to jumpstart <strong>the</strong>ir careers;new PhDs who aspire to tenure-track appointments but have been unable to find <strong>the</strong>m;pr<strong>of</strong>essionals who seek part-time work, ei<strong>the</strong>r to maintain better work-life balance or toenhance <strong>the</strong>ir regular, full-time careers; academics who simply prefer <strong>the</strong> role <strong>of</strong> NTTF;and, to a lesser extent, late career faculty easing into retirement. 17 The administratorswho responded to our survey believe <strong>the</strong>ir NTTF fit into all <strong>of</strong> <strong>the</strong>se categories (Figures51 and 52).So, given that non-tenure track faculty are a varied group <strong>of</strong> pr<strong>of</strong>essionals who take onei<strong>the</strong>r full-time or part-time non-tenure track appointments for different reasons, whatcan colleges and universities do to increase <strong>the</strong> desirability <strong>of</strong> <strong>the</strong> positions and thus toincrease <strong>the</strong> quality and stability <strong>of</strong> <strong>the</strong>ir non-tenure track faculty? The obvious way t<strong>of</strong>igure out what full- and part-time non-tenure track faculty want is to listen to what<strong>the</strong>y tell us. In a wide range <strong>of</strong> anecdotal narratives, NTTF have recounted <strong>the</strong>ir frustrationswith different aspects <strong>of</strong> <strong>the</strong>ir jobs and described ways to make <strong>the</strong>m morefulfilling. For example, The Chronicle <strong>of</strong> Higher Education periodically publishes acolumn for and about <strong>the</strong> experiences <strong>of</strong> non-tenure track faculty. Surprisingly, however,<strong>the</strong> research literature contains relatively few empirical studies about what <strong>the</strong> NTTF<strong>the</strong>mselves say <strong>the</strong>y want. Our own survey was directed not at non-tenure track facultybut at administrators. While this approach is useful, we and o<strong>the</strong>r researchers shouldalso be focusing directly on <strong>the</strong> faculty members.Our institutional-level survey did ask administrators to identify <strong>the</strong> job issues <strong>the</strong>yperceive to be most important to <strong>the</strong>ir non-tenure track faculty. As <strong>the</strong> following chartillustrates, <strong>the</strong>y most frequently named <strong>the</strong>se four: compensation, job security, respect,and working conditions.10<strong>Making</strong> <strong>the</strong> <strong>Best</strong> <strong>of</strong> <strong>Both</strong> <strong>Worlds</strong>
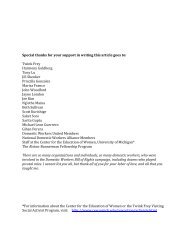
Issues <strong>of</strong> Importance to NTTF, as Reported by Respondents100%90%80%70%60%75%72%70%61%50%40%30%20%10%33%26%23%11%0%compensationjob securityrespectwork conditionspromotionresearch supportTT accessgovernanceA Hierarchy <strong>of</strong> Non-Tenure Track Faculty NeedsNot surprisingly, <strong>the</strong> kinds <strong>of</strong> things that non-tenure track faculty have said <strong>the</strong>y requirein <strong>the</strong>ir positions—and <strong>the</strong> things <strong>the</strong>ir institutional administrators have identified—fit into a framework similar to Maslow’s <strong>the</strong>ory <strong>of</strong> human motivation. Briefly, psychologistAbraham Maslow created a pyramid to illustrate his belief that people requirecertain conditions in <strong>the</strong>ir lives, and that each lower level <strong>of</strong> need must be realizedbefore a person is motivated to seek fulfillment <strong>of</strong> a higher level need. 18 As a way toillustrate <strong>the</strong> kinds <strong>of</strong> needs that NTTF have <strong>from</strong> <strong>the</strong>ir positions, we can place thoseneeds into a version <strong>of</strong> Maslow’s pyramid.11<strong>Making</strong> <strong>the</strong> <strong>Best</strong> <strong>of</strong> <strong>Both</strong> <strong>Worlds</strong>
3) self-actualization2) belongingness& esteem1) safety/securityPhysiological needs such as food,shelter, etc. (not applicable)1. Safety/security needs. In Maslow’s words, safety needs include “such phenomenaas, for instance, <strong>the</strong> common preference for a job with tenure or protection…asavings account, and…insurance <strong>of</strong> various kinds (medical, dental, unemployment,disability, old age).” 19 Based upon CEW and o<strong>the</strong>r research data and upon anecdotalevidence about non-tenure track faculty, we can place into this category <strong>the</strong>needs for adequate monetary remuneration for <strong>the</strong>ir work and access to healthand o<strong>the</strong>r benefits.12In describing safety needs, Maslow also discusses <strong>the</strong> kind <strong>of</strong> security that comes<strong>from</strong> having a dependable, undisrupted, and predictable routine, a schedule that“can be counted upon.” 20 As applied to <strong>the</strong> research data and anecdotal evidenceabout NTTF, we can place into this category such aspects <strong>of</strong> job security as longterm contracts, where suitable; transparent and equitable contract terms; andreasonable lengths <strong>of</strong> time for informing NTTF <strong>of</strong> <strong>the</strong>ir continued employmentand <strong>the</strong> courses <strong>the</strong>y’ll be teaching.<strong>Making</strong> <strong>the</strong> <strong>Best</strong> <strong>of</strong> <strong>Both</strong> <strong>Worlds</strong>
2. Belongingness and Esteem. For Maslow, belongingness and esteem are two <strong>of</strong><strong>the</strong> basic need levels, encompassed here in <strong>the</strong> need for self-respect and for <strong>the</strong>respect and esteem <strong>of</strong> o<strong>the</strong>rs, recognition and appreciation. Based upon topicsaddressed in our own and o<strong>the</strong>r research and upon anecdotal evidence, non-tenuretrack faculty members’ perceived desire for respect and positive working conditionsmay include raises to reward length and quality <strong>of</strong> performance; opportunitiesfor pr<strong>of</strong>essional development, in <strong>the</strong> form <strong>of</strong> time and resources for research andconferences; sabbaticals for long-term NTTF employees; opportunity to developand teach new courses and to collaborate with colleagues in <strong>the</strong> process; recognitionfor time spent advising students or serving on committees; adequate, perhapsprivate, <strong>of</strong>fice space; opportunity to participate in departmental and/or institutionallevel governance; transparent recognition <strong>of</strong> <strong>the</strong>ir valuable contributionsto <strong>the</strong>ir departments; and <strong>the</strong> possibility to move to <strong>the</strong> tenure track.3. Self-Actualization. According to Maslow, when <strong>the</strong> basic needs described aboveare met, people may be ready to work toward “doing what <strong>the</strong>y are fitted for.”From <strong>the</strong>se “satisfied” people, says Maslow, “we may expect <strong>the</strong> fullest (andhealthiest) creativeness.” 21 Of course, Maslow also believed that attainingtrue self-actualization is an exception ra<strong>the</strong>r than <strong>the</strong> rule for humans, so we donot mean to suggest that getting <strong>the</strong>re will be easy or automatic for non-tenuretrack faculty, regardless <strong>of</strong> how well <strong>the</strong>ir institutions support <strong>the</strong>ir development.However, by better defining, validating, and rewarding <strong>the</strong> roles <strong>of</strong> both full-timeand part-time NTTF, and by making <strong>the</strong>m meaningful partners in academia,administrators are likely to optimize NTTF satisfaction and thus <strong>the</strong> quality <strong>of</strong><strong>the</strong>ir contributions to <strong>the</strong> institutional mission.We can assume that full-time tenure-track faculty are likely to fulfill <strong>the</strong>ir workrelatedneeds <strong>from</strong> <strong>the</strong>ir academic institutions and disciplinary connections.Given <strong>the</strong> more varied life situations <strong>of</strong> non-tenure track faculty, however, <strong>the</strong>ircollege or university employers may not be <strong>the</strong> source <strong>of</strong> all <strong>the</strong>ir basic needs.For example, part-time NTTF who have substantial pr<strong>of</strong>essional careers outside<strong>the</strong> academy and teach at nearby colleges primarily to enhance <strong>the</strong>ir personaldevelopment may not require that <strong>the</strong> institutions fulfill <strong>the</strong>ir basic needs forfinancial security or safety. They are, however, more likely to find fulfillment inNTTF positions that <strong>of</strong>fer <strong>the</strong>m respect in terms <strong>of</strong> positive working conditionsand meaningful connections with colleagues.13<strong>Making</strong> <strong>the</strong> <strong>Best</strong> <strong>of</strong> <strong>Both</strong> <strong>Worlds</strong>
14–––––––––– ––––––––––The fears <strong>of</strong> some tenuretrackfaculty—aboutunfavorable effects <strong>of</strong>non-tenure trackfaculty on studentoutcomes or <strong>the</strong> lack<strong>of</strong> continuity withindepartments—arelikely not inherent to<strong>the</strong> presence <strong>of</strong> NTTF<strong>the</strong>mselves. Instead,problems are apt tooccur when departmentsdo not establish effectiveand thorough hiringprocesses, and when <strong>the</strong>ydo not createenvironments, policies,and practices thatallow NTTF to contributeas fully as <strong>the</strong>y are ableand willing to do.–––––––––– ––––––––––On <strong>the</strong> o<strong>the</strong>r hand, full-time non-tenure track faculty, for whatever reason <strong>the</strong>y takeon <strong>the</strong> position, are more likely to rely upon <strong>the</strong>ir university employers for <strong>the</strong> safety<strong>of</strong> adequate salaries, benefits, and <strong>the</strong> security <strong>of</strong> predictable, reliable work schedules—in addition to a sense <strong>of</strong> respect and belongingness.In o<strong>the</strong>r words, everyone has basic safety needs, but clearly not all non-tenure trackfaculty rely upon <strong>the</strong>ir institutions to provide <strong>the</strong>m—especially those who haveo<strong>the</strong>r pr<strong>of</strong>essional careers outside <strong>of</strong> teaching, as 63 percent <strong>of</strong> our respondentssaid some or most <strong>of</strong> <strong>the</strong>ir NTTF do (Figure 51). What this may mean is thatNTTF enter into <strong>the</strong> needs hierarchy at different levels. Wherever <strong>the</strong>y enter,however, <strong>the</strong>y all will find <strong>the</strong>ir careers as NTTF to be more rewarding if <strong>the</strong>yexperience a sense <strong>of</strong> partnership, belongingness and respect <strong>from</strong> <strong>the</strong>ir colleaguesand administrators.W H Y S H O U L D I N S T I T U T I O N S C A R E I F T H E I R N T T F F E E LR E S P E C T E D A N D C O M M I T T E D T O T H E M ?For one thing, institutions, very likely even in <strong>the</strong>ir mission statements, pr<strong>of</strong>ess a commitmentto high quality learning that prepares students to contribute to <strong>the</strong>ir communitiesand society. In addition, institutions, especially with today’s financial challenges, are<strong>of</strong>ten required to move beyond <strong>the</strong> traditions <strong>of</strong> <strong>the</strong> past to create more innovative, flexible,cost efficient ways <strong>of</strong> maintaining a vibrant, qualified pr<strong>of</strong>essional faculty.In many cases, as our data have demonstrated, institutions can achieve those two goalsby hiring both tenure-track and non-tenure track faculty and creating conditions whereinboth groups can thrive and can work toge<strong>the</strong>r as partners to achieve <strong>the</strong> desired studentand research objectives. Given administrators’ generally high opinions <strong>of</strong> NTTF, whichwe discussed earlier—including <strong>the</strong>ir talents as teachers, <strong>the</strong> high quality “specializedexpertise and pr<strong>of</strong>essional perspectives” <strong>the</strong>y bring to <strong>the</strong> classroom, <strong>the</strong> increasedwork-life flexibility and research time <strong>the</strong>y allow <strong>the</strong>ir tenure-track colleagues, and <strong>the</strong>potential for financial savings—institutions have strong incentives to create academicenvironments wherein non-tenure track faculty can be loyal partners.<strong>Making</strong> <strong>the</strong> <strong>Best</strong> <strong>of</strong> <strong>Both</strong> <strong>Worlds</strong>
The fears <strong>of</strong> some tenure-track faculty—about unfavorable effects <strong>of</strong> non-tenure trackfaculty on student outcomes or <strong>the</strong> lack <strong>of</strong> continuity within departments—are likelynot inherent to <strong>the</strong> presence <strong>of</strong> NTTF <strong>the</strong>mselves. Instead, problems are apt to occurwhen departments do not establish effective and thorough hiring processes, and when<strong>the</strong>y do not create environments, policies, and practices that allow NTTF to contributeas fully as <strong>the</strong>y are able and willing to do. When, in o<strong>the</strong>r words, <strong>the</strong>y are not afforded<strong>the</strong> kinds <strong>of</strong> security, inclusiveness, and sense <strong>of</strong> belongingness we discussed above.As one adjunct pr<strong>of</strong>essor explained, “Contingency is a threat to quality, not contingentfaculty. It’s not who we are but how we are treated that undermines <strong>the</strong> quality <strong>of</strong>higher education.” 22R E C O M M E N D AT I O N SThis report alludes to many policies and practices to create an environment that improves<strong>the</strong> role <strong>of</strong> non-tenure track faculty and thus enhances educational outcomes. We includehere a series <strong>of</strong> specific recommendations.We recognize that financial resources may be scarce, especially when institutions <strong>of</strong>higher education face times <strong>of</strong> economic retrenchment. Though cost may prohibit <strong>the</strong> fullimplementation <strong>of</strong> some <strong>of</strong> <strong>the</strong> following suggestions, <strong>the</strong> fact is that many <strong>of</strong> <strong>the</strong> recommendationsare nearly cost-free and some are likely to be relatively low cost. While somedesirable improvements may be prohibitively costly, o<strong>the</strong>rs may actually result in savingsif <strong>the</strong>y reduce attrition and costly replacement processes.Of course, institutions vary by size, location, mission, and governing system. Thus, notevery suggestion will be appropriate or possible for each institution. We provide <strong>the</strong>seideas as starting points for conversations about how colleges and universities can improve<strong>the</strong> full-time and part-time non-tenure track faculty ranks.15<strong>Making</strong> <strong>the</strong> <strong>Best</strong> <strong>of</strong> <strong>Both</strong> <strong>Worlds</strong>
Hiring and Continuing Employment• Regularize hiring procedures• Maintain high standard criteria for hiring both full- and part-time NTTF• Offer orientation sessions, both for new NTTF as a group and jointly with new tenuretrackfaculty• Make transparent and public all policies and o<strong>the</strong>r information about and for NTTF,for example on a special website or in a written handbook• Keep records about NTTF, to assure institutional level data about <strong>the</strong>ir numbers,demographics, and o<strong>the</strong>r aspects <strong>of</strong> <strong>the</strong>ir employment• Offer multi-year appointments, especially for full-time NTTF• Create an adequate time frame for notifying NTTF <strong>of</strong> contract renewal ornonrenewal• Ensure reasonable employment protection processes, to guard against unfair orunsubstantiated complaints about a non-tenure track faculty member’s jobperformanceSalary, Benefits, and Working Conditions• Establish equitable salary and raise schedules• Review benefits packages in view <strong>of</strong> <strong>the</strong> different types <strong>of</strong> NTTF and <strong>the</strong>ir relianceon <strong>the</strong> institution for benefits• Provide appropriate <strong>of</strong>fice space, equipment, and o<strong>the</strong>r forms <strong>of</strong> support• Offer NTTF input for <strong>the</strong>ir course selection and schedulingCareer Development and Advancement• Establish and clearly explain opportunities for advancement and flexibility, bothwithin <strong>the</strong> NTTF ranks and between non-tenure and tenure-track appointments16• Offer career development opportunities: workshops, mentoring relationships,conference attendance, and an increasing breadth <strong>of</strong> teaching assignments ando<strong>the</strong>r administrative responsibilities; consider sabbaticals for long-term NTTF• Involve NTTF in teaching evaluation procedures<strong>Making</strong> <strong>the</strong> <strong>Best</strong> <strong>of</strong> <strong>Both</strong> <strong>Worlds</strong>
Integration into Departmental and <strong>Institution</strong>al Life• Encourage collaborations among NTTF and between NTTF and <strong>the</strong>ir tenure-trackcolleagues—to develop curricula, for example, or to plan and teach courses• Include NTTF in departmental and institutional-level governance• Provide social networking opportunities for NTTF• Create an environment where everyone—tenure-track and non-tenure track faculty,administrators, and staff—feels engaged and connected to each o<strong>the</strong>r and to <strong>the</strong> work<strong>of</strong> <strong>the</strong> departmentC O N C L U S I O N<strong>Both</strong> full- and part-time non-tenure track faculty members are a fixture <strong>of</strong> highereducation. They are valued by administrators for <strong>the</strong> many advantages <strong>the</strong>y <strong>of</strong>fer,including <strong>the</strong>ir strong teaching abilities, specialized expertise and scheduling flexibility.In o<strong>the</strong>r words, this group <strong>of</strong> pr<strong>of</strong>essionals helps today’s colleges and universities tomeet many <strong>of</strong> <strong>the</strong> challenges <strong>the</strong>y face. It makes sense, <strong>the</strong>n, to improve <strong>the</strong> conditionsunder which non-tenure track faculty work, both to improve <strong>the</strong>ir own careersatisfaction and, by doing so, to maximize <strong>the</strong> contributions <strong>the</strong>y make.The decisions about how best to achieve that goal are complicated by a number <strong>of</strong>factors, including <strong>the</strong> heterogeneity <strong>of</strong> both full- and part-time NTTF; <strong>the</strong> particularmission, size, and practices <strong>of</strong> any given institution; financial constraints; <strong>the</strong> presence<strong>of</strong> unions; and o<strong>the</strong>r aspects <strong>of</strong> an institution’s culture and environment.As <strong>the</strong> research <strong>from</strong> our study indicates, however, colleges and universities that wishto integrate <strong>the</strong>ir NTTF and make <strong>the</strong>m partners with <strong>the</strong>ir tenure-track colleagues cando so, in many cases, with relative ease and without heavy financial burdens. Of course,as our Maslow-inspired template suggests, both full- and part-time NTTF deserve <strong>the</strong>basic security represented by equitable salaries and health benefits. In addition, <strong>of</strong>feringNTTF opportunities to perform at <strong>the</strong>ir best, to grow in <strong>the</strong>ir pr<strong>of</strong>ession, and to participatein <strong>the</strong> life <strong>of</strong> <strong>the</strong>ir academic departments will provide <strong>the</strong>m <strong>the</strong> self-esteem and sense<strong>of</strong> belongingness that will surely enhance <strong>the</strong>ir productivity and success.17<strong>Making</strong> <strong>the</strong> <strong>Best</strong> <strong>of</strong> <strong>Both</strong> <strong>Worlds</strong>
18<strong>Making</strong> <strong>the</strong> <strong>Best</strong> <strong>of</strong> <strong>Both</strong> <strong>Worlds</strong>
2P A R T T W OF I N D I N G S F R O M A N AT I O N A L I N S T I T U T I O N -L E V E L S U R V E Y O N N O N - T E N U R E T R A C K FA C U LT YI N T R O D U C T I O NIn Part Two we provide detailed information <strong>from</strong> our nationwide institutional survey<strong>of</strong> four-year colleges and universities. The study sampled all institutional types, allgeographic regions, and both private and public schools. The responses are about nontenuretrack faculty, but <strong>the</strong>y are not <strong>the</strong> responses <strong>of</strong> faculty members <strong>the</strong>mselves.Survey respondents were administrators, usually human resource <strong>of</strong>ficers, provosts, ordeans.We present <strong>the</strong> data in graph and table format in order to provide quick and easy accessto <strong>the</strong> findings. The figures are grouped by topic area and are indexed on page 20. PartOne is a discussion <strong>of</strong> <strong>the</strong> implications <strong>of</strong> our findings.Additional analyses <strong>of</strong> preliminary findings <strong>from</strong> this survey are available in PDF formatat www.cew.umich.edu/Research. The complete report, Non-Tenure Track Faculty: TheLandscape at U.S. <strong>Institution</strong>s <strong>of</strong> Higher Education includes all data analyzed to date.M E T H O D O L O G YThe study used a stratified random sample <strong>of</strong> 545 public and private four-year schools,drawn <strong>from</strong> <strong>the</strong> Carnegie 2000 list that was representative <strong>of</strong> institutional type as definedby <strong>the</strong> Carnegie classification system (see inside back cover) and geographic region. Thesurvey was fielded in academic year 2005-06 via email to an administrator—most <strong>of</strong>ten ina provost’s <strong>of</strong>fice, <strong>of</strong>fice <strong>of</strong> human resources, or division <strong>of</strong> institutional research—whohad been recommended as <strong>the</strong> <strong>of</strong>ficial on each campus most likely to have <strong>the</strong> informationwe were seeking. Because this was a long, complex survey, we were pleased with anoverall response rate <strong>of</strong> 36% that compared well with our sample.19<strong>Making</strong> <strong>the</strong> <strong>Best</strong> <strong>of</strong> <strong>Both</strong> <strong>Worlds</strong>
I N D E X T O F I G U R E SDemographics........................................................................................................................................23Figure 1: Comparison <strong>of</strong> Respondents to Sample ................................................................................................23Figure 2: <strong>Institution</strong>s in <strong>the</strong> Study by Measures <strong>of</strong> Size ......................................................................................24Figure 3: <strong>Institution</strong>s in <strong>the</strong> Study by Geographic Region....................................................................................24Figure 4: <strong>Institution</strong>s in <strong>the</strong> Study by Location ....................................................................................................24Figure 5: <strong>Institution</strong>s in <strong>the</strong> Study by Public/Private Status ................................................................................24Figure 6: <strong>Institution</strong>s in <strong>the</strong> Study by Religious Affiliation ................................................................................25Figure 7: Presence <strong>of</strong> Faculty Unions by <strong>Institution</strong>al Type ................................................................................25Utilization <strong>of</strong> NTTF ..............................................................................................................................26Figure 8: Non-Tenure Track Demographics (as a percentage <strong>of</strong> all faculty)........................................................26Figure 9: Determining PT vs. FT Status ..............................................................................................................27Figure 10: Percentage FTE that Qualifies for FT Status ........................................................................................27Figure 11: PT vs. FT Composition <strong>of</strong> <strong>the</strong> Non-Tenure Track Faculty ....................................................................28Figure 12: PT vs. FT Composition <strong>of</strong> <strong>the</strong> Non-Tenure Track Faculty by Union Status ........................................28Figure 13: Change in Use <strong>of</strong> NTTF Past and Future – All Schools ......................................................................29Hiring NTTF ........................................................................................................................................29Figure 14: <strong>Institution</strong>s Requiring a Terminal Degree..............................................................................................29Figure 15: O<strong>the</strong>r Required Credentials ..................................................................................................................30Figure 16: Processes Used to Identify a Qualified Pool <strong>of</strong> Candidates..................................................................31Figure 17: Requesting References ..........................................................................................................................32Figure 18: Checking Requested References ..........................................................................................................32Figure 19: Percentage <strong>of</strong> <strong>Institution</strong>s Offering Long Term Contracts ....................................................................32Figure 20: Long Term Contracts by Union Status ..................................................................................................33Figure 21: Duration <strong>of</strong> Long Term Contract, Where Offered ................................................................................33Figure 22: Decision Maker on Contract Renewals ................................................................................................34Figure 23: Contract Renewals ................................................................................................................................34Figure 24: Percentage <strong>of</strong> <strong>Institution</strong>s that Limit <strong>the</strong> Number <strong>of</strong> Long Term Contracts Allowed............................34Figure 25: Duration <strong>of</strong> Employment ......................................................................................................................3520<strong>Making</strong> <strong>the</strong> <strong>Best</strong> <strong>of</strong> <strong>Both</strong> <strong>Worlds</strong>
Compensations and Benefits................................................................................................................36Figure 26: Level at Which Decisions are Made About Salary or Benefits ............................................................36Figure 27: Basis <strong>of</strong> Compensation..........................................................................................................................37Figure 28: Basis <strong>of</strong> Adjustment to Compensation ..................................................................................................38Figure 29: Compensation Ranges ..........................................................................................................................39Figure 30: Employee (W2) vs. Independent Contractor (1099) ............................................................................39Figure 31: Percentage <strong>of</strong> Schools Offering Health Insurance ................................................................................40Figure 32: Who is Covered by Health Insurance....................................................................................................40Figure 33: Comparison <strong>of</strong> Benefits Offered to TT and NTT Faculty ....................................................................41Figure 34: No Changes Under Consideration in Type <strong>of</strong> Benefit Offered to NTTF or in Qualifying Criteria ......42Figure 35: Sabbatical Leave....................................................................................................................................42Figure 36: Percentage Differential in <strong>the</strong> Proportion <strong>of</strong> Union vs. Non-Union Schools Offering Benefits ..........43Working Conditions..............................................................................................................................44Figure 37: Primary Teaching Assignment ..............................................................................................................44Figure 38: Primary Teaching Assignment by <strong>Institution</strong>al Type ............................................................................45Figure 39: Expectation <strong>of</strong> Engagement in Aspects <strong>of</strong> Pr<strong>of</strong>essional Academic Life ..............................................46Figure 40: <strong>Institution</strong>al Support for Engagement in Aspects <strong>of</strong> Pr<strong>of</strong>essional Academic Life................................47Figure 41: <strong>Institution</strong>al Reward for Creation <strong>of</strong> Pr<strong>of</strong>essional Product ..................................................................48Figure 42: Access to Resources..............................................................................................................................49Figure 43: Participation in Governance ..................................................................................................................50Mobility..................................................................................................................................................51Figure 44: Decision Maker on Flexibility in Moving Between TT and NTT Status ..............................................51Figure 45: <strong>Institution</strong>s with Policies that Prohibit or Permit Moves <strong>from</strong> NTT to TT ..........................................52Figure 46: Frequency <strong>of</strong> Moves <strong>from</strong> NTT to TT ..................................................................................................52Figure 47: Mobility From NTT to TT by <strong>Institution</strong>al Type ..................................................................................53Issues and Constituencies ....................................................................................................................54Figure 48: Level <strong>of</strong> Consideration to <strong>Institution</strong>al Issues Regarding NTTF ..........................................................54Figure 49: Level <strong>of</strong> Interest in <strong>Institution</strong>al Issues Associated with NTTF............................................................55Figure 50: Results <strong>of</strong> Factor Analysis <strong>of</strong> Interest in <strong>Institution</strong>al Issues Related to NTTF ....................................57Figure 51: Reasons Individuals Accept NTT Positions, as Reported by Respondents ..........................................58Figure 52: Reasons Individuals Purposely Choose NTT Positions, as Reported by Respondents ........................58Figure 53: Issues <strong>of</strong> Importance to NTTF, as Reported by Respondents ..............................................................59Figure 54: Support for Issues Important to NTTF, as Reported by Respondents ..................................................60Figure 55: Opposition to Issues Important to NTTF, as Reported by Respondents ..............................................61Figure 56: Importance, Support and Opposition Compared ..................................................................................62Figure 57: Constituencies Who Advocate for Change on Behalf <strong>of</strong> NTTF............................................................63Figure 58: Constituencies Who Resist Change Regarding NTTF ..........................................................................64Figure 59: Comparing Advocates and Resistors Regarding NTTF Change ..........................................................6521<strong>Making</strong> <strong>the</strong> <strong>Best</strong> <strong>of</strong> <strong>Both</strong> <strong>Worlds</strong>
D E F I N I T I O N STo help build a commonality <strong>of</strong> terms among respondents, we provided <strong>the</strong> followingdefinitions to survey participants:• Instructional Faculty/Staff are employees with primarily instructional responsibilities,which may include teaching one or more classes, or advising or supervisingstudents’ academic activities (e.g., serving on <strong>the</strong>sis committees, supervisingindependent studies or one-on-one instruction).• Non-Tenure Track Faculty/Staff are employees who, regardless <strong>of</strong> <strong>the</strong>ir titles,hold positions that do not lead to consideration for tenure (“tenure” referring to“permanence <strong>of</strong> position.”)We know that institutions use a variety <strong>of</strong> <strong>of</strong>ten overlapping titles to describe<strong>the</strong>se non-tenure track employees, and those terms <strong>of</strong>ten refer to different groups<strong>of</strong> people within and between institutions.• Full-Time Faculty are those employees who are classified by <strong>the</strong>ir institutionsas “full-time,” regardless <strong>of</strong> <strong>the</strong> amount <strong>of</strong> instructional responsibilities.• Part-Time Faculty are those employees who are classified by <strong>the</strong>ir institutionsas “part-time,” regardless <strong>of</strong> <strong>the</strong> amount <strong>of</strong> instructional responsibilities.The definition <strong>of</strong> non-tenure track instructional faculty does NOT include <strong>the</strong> followingcategories <strong>of</strong> employees:• Graduate or undergraduate teaching or research assistants• Post-doctoral students• Visiting scholars• Research faculty, i.e., those whose primary responsibilities are not instructionalin nature• Clinical faculty, i.e., academic pr<strong>of</strong>essionals with primarily practice-relatedresponsibilities.22To enhance readability we use <strong>the</strong> following abbreviations throughout:Non-tenure track faculty—NTTFTenured and tenure-track faculty—TTFFull-time—FTPart-time—PT<strong>Making</strong> <strong>the</strong> <strong>Best</strong> <strong>of</strong> <strong>Both</strong> <strong>Worlds</strong>
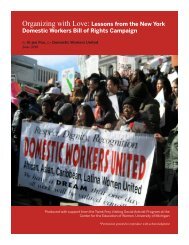
D E M O G R A P H I C SFigure 1Comparison <strong>of</strong> Respondents to SampleSampleRespondents30%25%20%15%10%5%0%doc-ext<strong>Institution</strong> Typedoc-intmaster Imaster IIbacc-lib artbacc-gen’l50%40%30%20%10%0%rural+ sm townLocalelargetownmidsize city large+ fringe city + fringe35%30%25%20%15%10%5%0%Geographic Regionnor<strong>the</strong>ast midwest south west60%50%40%30%20%10%0%publicPublic/Privatepvt,non-pr<strong>of</strong>itpvt,for pr<strong>of</strong>itThe demographics <strong>of</strong> our respondent group very closely reflect <strong>the</strong> sample on severalmeasures. We <strong>the</strong>refore believe that our data is sufficiently representative to allow forgeneralization to <strong>the</strong> population <strong>of</strong> American institutions <strong>of</strong> higher education.In order to provide data useful to <strong>the</strong> study an institution had to have both a tenure systemand NTT Instructional Faculty. <strong>Institution</strong>s that responded to <strong>the</strong> survey but did not meet<strong>the</strong>se criteria were removed <strong>from</strong> <strong>the</strong> sample, resulting in a group <strong>of</strong> 144 institutions to beused for fur<strong>the</strong>r analysis. Due to <strong>the</strong> small number <strong>of</strong> Master II-type institutions, forfur<strong>the</strong>r analysis <strong>the</strong>se are combined with Master I-type institutions.To limit <strong>the</strong> length <strong>of</strong> an already long survey instrument, we used IPEDS (<strong>the</strong> IntegratedPostsecondary Education Data System, <strong>National</strong> Center for Educational Statistics, U.S.Department <strong>of</strong> Education, Washington DC (http://nces.ed.gov/ipeds/) for certain demographicdata about <strong>the</strong> institutions in our sample, ra<strong>the</strong>r than including directquestions in <strong>the</strong> survey.23<strong>Making</strong> <strong>the</strong> <strong>Best</strong> <strong>of</strong> <strong>Both</strong> <strong>Worlds</strong>
Figure 2<strong>Institution</strong>s in <strong>the</strong> Study by Measures <strong>of</strong> SizeWe have two ways to gauge <strong>the</strong>size <strong>of</strong> <strong>the</strong> institutions in our sample—studentenrollment and number<strong>of</strong> faculty. The range <strong>of</strong> bo<strong>the</strong>nrollments and faculty headcountvaries enormously. This is someindication <strong>of</strong> <strong>the</strong> variety <strong>of</strong> institutionsincluded in this study.Figure 3StudentEnrollment<strong>Institution</strong>s in <strong>the</strong> Study by Geographic RegionHeadcountAll facultyMin 507 34Max 46,973 9,833Mean 11,662 936Nor<strong>the</strong>ast 24%Midwest 31%South 28%West 17%100%Figure 4<strong>Institution</strong>s in <strong>the</strong> Study by LocationThe majority (78%) <strong>of</strong> institutionsin our study are located in cities,with nearly half in midsized cities.Approximately one in five are inless populous areas, designated asrural or small town.Rural + small town 18%Large town 4%Midsize city + fringe 49%Large city + fringe 29%100%24Figure 5<strong>Institution</strong>s in <strong>the</strong> Study by Public/Private StatusThere are no private, for-pr<strong>of</strong>itinstitutions represented in thisresearch.<strong>Making</strong> <strong>the</strong> <strong>Best</strong> <strong>of</strong> <strong>Both</strong> <strong>Worlds</strong>Public 61%Private non-pr<strong>of</strong>it 39%Private, for pr<strong>of</strong>it 0%100%
Figure 6<strong>Institution</strong>s in <strong>the</strong> Study by Religious AffiliationAffiliation 21%No affiliation 79%100%Figure 7Presence <strong>of</strong> Faculty Unions by <strong>Institution</strong>al Type100%80%TTF unionizedNTTF unionized60%40%20%0%57%46%43%27%10%6% 7% 6%doc-extensive doc-intensive master I & II bacc-lib art0% 0%bacc-gen’lOverall, approximately a quarter <strong>of</strong> <strong>the</strong> institutions surveyed report that <strong>the</strong>ir facultiesare represented by a union or o<strong>the</strong>r association for purposes <strong>of</strong> collective bargaining:24% have unionized NTTF and 22% have unionized TTF. With only a few exceptions,in schools with unionized faculty, not only are both TT and NTT unionized, <strong>the</strong>y arealso represented by <strong>the</strong> same bargaining unit.In most cases (91%) <strong>the</strong> union had been in existence more than three years. For thoseschools without a faculty union, we asked whe<strong>the</strong>r <strong>the</strong>re was “a current, active move tounionize part-time NTTF on your campus?” Nearly all (97%) <strong>of</strong> <strong>the</strong> respondents said<strong>the</strong>re was no unionizing activity.25<strong>Making</strong> <strong>the</strong> <strong>Best</strong> <strong>of</strong> <strong>Both</strong> <strong>Worlds</strong>
U T I L I Z AT I O N O F N T T FFigure 8Non-tenure Track Demographics (as a Percentage <strong>of</strong> All Faculty)70%70%60%40%47%56%50%32%46%60%40%37%32%47%54%20%20%0%doc-extdoc-int masterI & IIbacc-libartbaccgen’l0%rural + large townsmall townmidsizecity +fringelarge city+ fringe70%70%60%40%52%47% 45%48%60%40%47%52%20%20%0%nor<strong>the</strong>ast midwest south west0%publicprivateOne <strong>of</strong> <strong>the</strong> early filter questions asked whe<strong>the</strong>r <strong>the</strong> institution employed NTTF in fulltimepositions only, part-time positions only, or both. Nearly all (93%) employ both fullandpart-time NTTF.Using a number <strong>of</strong> measures we see that use <strong>of</strong> NTTF as a percentage <strong>of</strong> all faculty arefairly evenly spread across geographic region and public/private status, and somewhatless so across institutional type and degree <strong>of</strong> urbanization.26<strong>Making</strong> <strong>the</strong> <strong>Best</strong> <strong>of</strong> <strong>Both</strong> <strong>Worlds</strong>
Figure 9Determining PT vs FT Status100%90%80%70%60%50%40%30%20%10%66%4367%22%70%We asked respondents to identify<strong>the</strong> criteria by which <strong>the</strong>ir institutionsdetermined non-tenure trackfaculty status as to part-time vs.full-time: number <strong>of</strong> courses taught,number <strong>of</strong> credit hours taught, orpercentage <strong>of</strong> full time equivalent(FTE). Most institutions indicatedthat <strong>the</strong>y used more than onemethod.0%# <strong>of</strong> courses # <strong>of</strong> credit hours # <strong>of</strong> contact hours% FTEFigure 10Percentage FTE that Qualifies for FT Status100%90%80%70%71%Of those using percentage <strong>of</strong> FTE,nearly three quarters grant full-timestatus only to faculty employed at100% FTE.60%50%40%30%20%10%0%9%12%8%2750% or less 51% - 75% FTE 76% - 99% FTE100% FTE<strong>Making</strong> <strong>the</strong> <strong>Best</strong> <strong>of</strong> <strong>Both</strong> <strong>Worlds</strong>
Figure 11PT vs FT Composition <strong>of</strong> <strong>the</strong> Non-tenure Track FacultyThe findings <strong>from</strong> our surveyclearly point out <strong>the</strong> error inequating NTTF with part-timestatus—respondents employ afairly high percentage (43%)<strong>of</strong> non-tenure track instructionalfaculty on a full-time basis.43%57%PT-NTTFFT-NTTFFigure 12PT vs FT Composition <strong>of</strong> <strong>the</strong> Non-tenure Track Faculty by Union StatusThe difference between unionand non-union schools is quitepronounced. <strong>Institution</strong>s withoutunionized faculty employ ahigher percentage <strong>of</strong> NTTF infull-time positions (53%), while<strong>the</strong> reverse is true for institutionswith faculty unions wherepart-timers comprise 72% <strong>of</strong> <strong>the</strong>NTTF.53%NON-UNION47%PT-NTTFFT-NTTF28%UNION72%28<strong>Making</strong> <strong>the</strong> <strong>Best</strong> <strong>of</strong> <strong>Both</strong> <strong>Worlds</strong>
Figure 13Change in Use <strong>of</strong> NTTF Past and Future—All SchoolsPAST 5 YEARSNEXT 1 - 2 YEARS13%15%40%17%47%68%SameIncreaseDecreaseH I R I N G N O N - T E N U R E T R A C K FA C U LT YOver <strong>the</strong> past five years, nearlyhalf (47%) <strong>of</strong> respondents reportedincreased usage, only one in eight(13%) reported a decrease. Theirexpectations for <strong>the</strong> future werevery different <strong>from</strong> <strong>the</strong>ir pastexperience. The proportion <strong>of</strong>institutions reporting increaseshas dropped by two-thirds—<strong>from</strong> nearly half (47%) to lessthan a quarter (17%) who anticipatecontinued increases. Sodespite implications <strong>from</strong> <strong>the</strong>literature that increased usagewill continue, it would seem thatanticipated usage is going t<strong>of</strong>latten.Figure 14<strong>Institution</strong>s Requiring a Terminal Degree9%FULL TIME15%24%15%PART TIME11%Relatively few <strong>of</strong> <strong>the</strong> respondinginstitutions require that <strong>the</strong> candidatehold a terminal degree to beeligible for a NTT position.52%Required23%51%29PreferredNot requiredVaries<strong>Making</strong> <strong>the</strong> <strong>Best</strong> <strong>of</strong> <strong>Both</strong> <strong>Worlds</strong>
Figure 15O<strong>the</strong>r Required CredentialsFor o<strong>the</strong>r required credentialssuch as prior teaching experience,pr<strong>of</strong>essional credentialing, andpractical experience, <strong>the</strong>re is littledifference between FT- and PT-NTTF, so for this analysis <strong>the</strong>two groups have been combined.Though NTTF are hired primarilyto teach, only one in ten (11%)institutions require prior teachingexperience, although three quarters(74%) prefer that candidateshave it. Three in ten institutionsrequire pr<strong>of</strong>essional credentialing—compared to only one in tenrequiring teaching experience.We can assume that response tothis item was not conflated witha terminal degree since <strong>the</strong>y wereboth part <strong>of</strong> <strong>the</strong> same question.4%PRIOR TEACHINGEXPERIENCE33%11%74%11%PRACTICALEXPERIENCE6%4%PROFESSIONALCREDENTIALING24%RequiredPreferred42%30%Not required54%Varies7%30<strong>Making</strong> <strong>the</strong> <strong>Best</strong> <strong>of</strong> <strong>Both</strong> <strong>Worlds</strong>
Figure 16Processes Used to Identify a Qualified Pool <strong>of</strong> CandidatesFULL TIME79%21%PART TIME45%55%Persons already knownDefinition:“A formalized search process isnot performed. Ra<strong>the</strong>r <strong>the</strong> hiringunit relies primarily on personsalready known to <strong>the</strong>m”YESNOIntra-institutional recommendations66%34%42%58%Definition:“Knowledgeable persons within<strong>the</strong> institution are asked to identifyor recommend qualified applicants”Local search29%71%49%51%Definition:“A formalized search is performedthat taps a pool <strong>of</strong> locally availableapplicants through various forms<strong>of</strong> advertisement and networking”Formal search20%Definition:45%55%80%“A formalized search is performedthat is similar in scope to that usedfor TT faculty”31From <strong>the</strong> original metric, <strong>the</strong> response options never and rarely were collapsed intoa single category titled ‘no’ and generally and always into a single category titled‘yes’.<strong>Making</strong> <strong>the</strong> <strong>Best</strong> <strong>of</strong> <strong>Both</strong> <strong>Worlds</strong>
Figure 17Requesting ReferencesThe majority <strong>of</strong> responding institutionsreport that <strong>the</strong>y requestand check references “always” or“generally”. As might be expected,references are requested (andchecked) more <strong>of</strong>ten for FT thanfor PT-NTTF. Requesting referencesdoes not mean thosereferences are checked. Of <strong>the</strong>institutions that report “always”requesting references, a substantialportion don’t always checkthose references thoroughly.Request ReferencesRarely 1% 7%Generally or Always 99% 93%Figure 18Checking Requested ReferencesFull TimeFull TimePart TimePart TimeCheck References ThoroughlyRarely 4% 15%Generally or Always 96% 85%Figure 19Percentage <strong>of</strong> <strong>Institution</strong>s Offering Long Term ContractsRespondents were asked whe<strong>the</strong>r<strong>the</strong>ir institution <strong>of</strong>fers long termcontracts (as defined by <strong>the</strong> institutionsince <strong>the</strong> survey did notprovide a definition) for certaincategories <strong>of</strong> NTT faculty.Doctoral-Extensive 65%Doctoral-Intensive 70%Master I&II 40%Baccalaureate-Liberal Arts 50%Baccalaureate-General 38%For all responding institutions 52%32<strong>Making</strong> <strong>the</strong> <strong>Best</strong> <strong>of</strong> <strong>Both</strong> <strong>Worlds</strong>
Figure 20Long Term Contracts by Union Status100%90%80%70%60%50%40%60%49%NTTF are more likely to have longterm contracts at schools withunions; 60% <strong>of</strong> schools withunions <strong>of</strong>fer long term contractscompared with just under half(49%) <strong>of</strong> <strong>the</strong> schools without afaculty union.30%20%10%0%unionnon-unionFigure 21Duration <strong>of</strong> Long Term Contract, Where Offered100%90%80%70%60%50%40%30%20%10%0%11%15%39%82%The majority <strong>of</strong> institutions that<strong>of</strong>fer long term contracts do so forfixed periods. Few indicate that<strong>the</strong>y generally or always <strong>of</strong>fer longterm contracts that are open-ended—only one in six (15%) for FT-NTTF and fewer, one in ten (11%)for PT-NTTF. However, while 82%<strong>of</strong>fer fixed-term contracts toFT-NTTF, only 39% do so forPT-NTTF.33PT-NTTFFT-NTTFPT-NTTFFT-NTTFopen endedfixed term<strong>Making</strong> <strong>the</strong> <strong>Best</strong> <strong>of</strong> <strong>Both</strong> <strong>Worlds</strong>
Figure 22Decision Maker on Contract RenewalsFull TimePart TimeDecision maker<strong>Institution</strong> 13% 8%Department / Unit 37% 58%<strong>Both</strong> 50% 34%Figure 23Contract RenewalsMost institutions provide a substantialnotice period <strong>of</strong> renewalor non-renewal <strong>of</strong> contracts forFT-NTTF. On <strong>the</strong> o<strong>the</strong>r hand, 10%<strong>of</strong> PT-NTTF receive a notice period<strong>of</strong> a week or two or less.Full TimePart TimeLength <strong>of</strong> NoticeSeveral months 89% 58%One month 37% 32%A week or two 1% 8%A few days or less 0% 2%Figure 24Percentage <strong>of</strong> <strong>Institution</strong>s that Limit <strong>the</strong> Number <strong>of</strong> Long Term Contracts Allowed34Approximately a quarter <strong>of</strong> institutionsimpose a limit on <strong>the</strong> number<strong>of</strong> terms or contracts an FT-NTTFmember is allowed to work for <strong>the</strong>institution, but only 6% do so forPT-NTTF; surprisingly nei<strong>the</strong>r <strong>of</strong><strong>the</strong>se percentages is changed by<strong>the</strong> presence <strong>of</strong> a faculty union.100%90%80%70%60%50%40%30%24%20%10%0%6%PT-NTTFFT-NTTF<strong>Making</strong> <strong>the</strong> <strong>Best</strong> <strong>of</strong> <strong>Both</strong> <strong>Worlds</strong>
Figure 25Duration <strong>of</strong> Employment100%90%80%70%60%50%40%30%20%65%75%58%44%PT-NTTFFT-NTTF10%0%long durationshort durationWe asked respondents to characterize <strong>the</strong> employment duration <strong>of</strong> NTTF as to whe<strong>the</strong>r<strong>the</strong>y tend to be:• long-term, long-service employees who <strong>of</strong>ten remain with <strong>the</strong> institution forseveral/many years, or• short-term employees whose length <strong>of</strong> service is generally <strong>of</strong> fairly short duration.These were asked as two separate questions (using <strong>the</strong> metric: never, rarely, generally,or always) so percentages add to more than 100%.We <strong>the</strong>n asked <strong>the</strong>m to estimate <strong>the</strong> average number <strong>of</strong> years NTTF tended to remainat <strong>the</strong> institution. Average duration is 7 years for FT-NTTF and 5½ years for PT-NTTF—not so different.35<strong>Making</strong> <strong>the</strong> <strong>Best</strong> <strong>of</strong> <strong>Both</strong> <strong>Worlds</strong>
C O M P E N S AT I O N A N D B E N E F I T SFigure 26Level at Which Decisions are Made About...SALARY OR PAY LEVELBENEFITS7%3%3%10%21%37%53%66%External<strong>Institution</strong> wideUnitUnion contractExternal entities, as well as various constituencies within <strong>the</strong> institution, may controlpolicies and practices that apply to non-tenure track faculty.Definitions for response categories:External—decision makers are state legislature, higher education board orcommission, university system<strong>Institution</strong>-wide—decision makers are executive level administrators whodetermine issues for <strong>the</strong> whole institution36Unit level—internal decision makers determine issues at <strong>the</strong> college, school,department, or unit levelFor more than half <strong>of</strong> <strong>the</strong> schools, compensation decisions are made on an institutionwidebasis, though nearly two in five schools make <strong>the</strong>se decisions at <strong>the</strong> unit level.Compare this with decisions about benefits, which at one in five schools are madeexternally.<strong>Making</strong> <strong>the</strong> <strong>Best</strong> <strong>of</strong> <strong>Both</strong> <strong>Worlds</strong>
Figure 27Basis <strong>of</strong> CompensationFULL TIME100%80%60%40%20%0%27%58%semester orquarter14%96%4%1%academic orcalendar yearPART TIME35%32%33%multi-year periodGenerallyRarelyNeverWe asked on what basis NTTF arecompensated: a single semester,quarter or term; a calendar oracademic year; or a multi-yearperiod. Some schools reportedusing each as a basis for payingboth FT- and PT-NTTF.From <strong>the</strong> original metric (never,rarely, generally, always) <strong>the</strong> lasttwo response options werecollapsed into a single categorytitled ‘generally’.100%80%82%60%59%40%46%42%32%20%0%17%semester orquarter2%12%academic orcalendar year10%multi-year period37<strong>Making</strong> <strong>the</strong> <strong>Best</strong> <strong>of</strong> <strong>Both</strong> <strong>Worlds</strong>
Figure 28Basis <strong>of</strong> Adjustment to Compensation100%90%80%70%60%50%64%79% 78%91%60%70%PT-NTTFFT-NTTF49%71%40%30%20%10%0%years <strong>of</strong>experiencelevel <strong>of</strong>credentials orqualificationslength <strong>of</strong>service with <strong>the</strong>institutionmerit or quality<strong>of</strong> performanceFrom <strong>the</strong> original metric, <strong>the</strong> response options generally and always have been collapsed into <strong>the</strong> singlecategory shown here.Fewer than half <strong>of</strong> <strong>the</strong> responding institutions report that <strong>the</strong>y recognize quality <strong>of</strong>performance or merit when adjusting <strong>the</strong> compensation <strong>of</strong> PT-NTTF. Given <strong>the</strong>ir largenumbers, it is surprising that at half <strong>of</strong> <strong>the</strong> responding institutions PT-NTTF are notrewarded monetarily for good performance.38<strong>Making</strong> <strong>the</strong> <strong>Best</strong> <strong>of</strong> <strong>Both</strong> <strong>Worlds</strong>
Figure 29Compensation Ranges$9,000$8,000$7,000$6,000$5,000$4,000$3,000$2,000$1,000$0$3,523$3,171$1,375$869FT - fee/coursePT - fee/courseFT - fee/credit hourPT - fee/credit houraverage minimum$7,978$5,564$2,238$1,350average maximumIt is worth noting that at <strong>the</strong> low end <strong>the</strong> differences in compensation are nearly nonexistent,whereas at <strong>the</strong> maximum end <strong>of</strong> <strong>the</strong> ranges <strong>the</strong> difference between FT and PTare greater when faculty are paid by <strong>the</strong> course.Figure 30Employee (W2) vs. Independent Contractor (1099)Full TimePart TimeW2 100% W2 98%1099 0% 1099 6%ei<strong>the</strong>r 0% ei<strong>the</strong>r 10%Our findings contradict a common belief that NTTF are treated as independent contractorsra<strong>the</strong>r than as employees. All respondents indicated that <strong>the</strong>y employ <strong>the</strong>ir FT-NTTF asemployees. With only a few exceptions <strong>the</strong> same is true for PT-NTTF. Employee statusconfers at least <strong>the</strong> minimal benefit <strong>of</strong> employer contributions to Social Security, whichwould o<strong>the</strong>rwise by fully borne by <strong>the</strong> individual.39<strong>Making</strong> <strong>the</strong> <strong>Best</strong> <strong>of</strong> <strong>Both</strong> <strong>Worlds</strong>
Figure 31Percentage <strong>of</strong> Schools Offering Health InsuranceHealth insurance is providednearly universally to FT-NTTF.Only half <strong>of</strong> <strong>the</strong> institutionsprovide coverage for PT-NTTF.100%80%95%60%51%40%20%0%FT-NTTF PT-NTTF nei<strong>the</strong>r3%Figure 32Who is Covered by Health Insurance40When health care is <strong>of</strong>fered, itis rare that only <strong>the</strong> employee iscovered; generally both spouseand children are covered byhealth insurance.Coverage <strong>of</strong> non-spousal partnersis <strong>of</strong>fered much less frequently.Same sex partners are coveredmore <strong>of</strong>ten than opposite sexpartners.100%80%60%40%20%7%91%89%44%30%0%employeeonlyspouse children same sexpartneroppositesex partner<strong>Making</strong> <strong>the</strong> <strong>Best</strong> <strong>of</strong> <strong>Both</strong> <strong>Worlds</strong>
Figure 33Comparison <strong>of</strong> Benefits Offered to Tenure Track and NTT Faculty100%80%60%40%20%0%100%34%BENEFITS OFFERED TO TENURE TRACK NEARLY UNIVERSALLY92% 99%98%89%91%95%51%38%life ins health ins retirementplan(s)30%79%90%sick leaveBENEFITS OFFERED LESS OFTEN1%19%90%sabbaticalPT-NTTFFT-NTTFTTFThe survey inquired about benefitsprovided to tenure track faculty(TTF) as a benchmark againstwhich to compare benefits forNTTF.As expected, more schools providebenefits to TTF than to ei<strong>the</strong>r FTorPT-NTTF. The list <strong>of</strong> benefitsra<strong>the</strong>r conveniently broke into twoportions—those <strong>of</strong>fered nearlyuniversally, that is by 90% or more<strong>of</strong> <strong>the</strong> respondents and shown in<strong>the</strong> top panel, and those <strong>of</strong>feredless <strong>of</strong>ten, shown in <strong>the</strong> secondpanel.80%60%73%59%55%66%51%40%20%23%13%10%41%10%30%42%36%27%8%0%tuition reimbchildbearingleavepaiddependent careemploymentassistancevacation41<strong>Making</strong> <strong>the</strong> <strong>Best</strong> <strong>of</strong> <strong>Both</strong> <strong>Worlds</strong>
Figure 34No Changes Under Consideration in Type <strong>of</strong> Benefit Offered to NTTFor in Qualifying CriteriaThe survey asked whe<strong>the</strong>r <strong>the</strong>institution was actively pursuingany changes in <strong>the</strong> number or type<strong>of</strong> employment benefits, or policiesit makes available to NTTF, or in<strong>the</strong> criteria for eligibility. Themajority <strong>of</strong> respondents indicatedthat no changes were being considered.100%90%80%70%60%50%40%30%20%86%94%10%0%number or typecriteriaFigure 35Sabbatical Leave42Overall, sabbatical leave isprovided to TTF by 90% <strong>of</strong>respondent institutions. Manyfewer <strong>of</strong>fer sabbatical to FT-NTTF.It is interesting that <strong>the</strong> high andlow ranges are both in <strong>the</strong>Baccalaureate-liberal arts schools.100%90%80%70%60%50%40%30%20%10%0%90% 90% 90%16%20%23%master I & II95%5%baccgeneralbaccliberalarts81%38%docextensivedocintensiveTTFFT-NTTF<strong>Making</strong> <strong>the</strong> <strong>Best</strong> <strong>of</strong> <strong>Both</strong> <strong>Worlds</strong>
Figure 36Percentage Difference in <strong>the</strong> Proportion <strong>of</strong> Union vs. Non-Union Schools Offering BenefitsUNION NON-UNION DIFFERENCETTFFT-NTT PT-NTTTTFFT-NTT PT-NTTTTF FT-NTT PT-NTTLife insurance 97% 89% 43% 98% 92% 30% --- --- 13%Health insurance 97% 94% 63% 97% 94% 46% --- --- 17%Retirement plan(s) 97% 89% 57% 97% 88% 31% --- --- 26%Sick leave 91% 86% 49% 89% 76% 24% --- 10% 25%Sabbatical 91% 23% 0% 88% 18% 2% --- 5% ---Tuition reimbursement 71% 63% 34% 72% 57% 18% --- 6% 16%Child bearing leave 80% 60% 20% 61% 52% 10% 19% 8% 10%Paid dependent care 60% 46% 20% 49% 39% 7% 11% 6% 13%Employment assistance 40% 29% 14% 42% 30% 9% --- --- 5%Vacation 34% 26% 11% 37% 28% 7% --- --- ---(—) A difference < 5% between <strong>the</strong> percentages <strong>of</strong> union and non-union schools <strong>of</strong>fering a particular benefit is considered too close to call.The left-hand and center tables in this figure show <strong>the</strong> proportion <strong>of</strong> union and non-unionschools <strong>of</strong>fering benefits to <strong>the</strong> three categories <strong>of</strong> faculty—TTF, FT-NTTF and PT-NTTF.The right-hand table shows <strong>the</strong> difference between <strong>the</strong> proportion <strong>of</strong> union vs. non-unionschools <strong>of</strong>fering benefits.This figure is complicated and may work better with an example:In <strong>the</strong> two left-hand tables, 43% <strong>of</strong> union schools <strong>of</strong>fer life insurance to PT-NTTFcompared with 30% <strong>of</strong> non-union schools—<strong>the</strong> difference, 13%, is what appearsin <strong>the</strong> right-hand table in <strong>the</strong> chart, indicating that more union schools <strong>of</strong>fer lifeinsurance benefits to PT-NTTF as compared to non-union schools.A positive number in <strong>the</strong> right-hand section <strong>of</strong> <strong>the</strong> table indicates that more union schoolsprovide a benefit. Notice that <strong>the</strong>re are no negative values, so in no case is a benefit<strong>of</strong>fered by a larger portion <strong>of</strong> non-union schools. The presence <strong>of</strong> a faculty union substantiallyincreases <strong>the</strong> portion <strong>of</strong> schools <strong>of</strong>fering benefits to NTTF.A union is particularly beneficial to PT-NTTF (note for how many benefits differences aregreater than 5% in <strong>the</strong> PT column <strong>of</strong> <strong>the</strong> right-hand section <strong>of</strong> <strong>the</strong> table) and particularlyfor policies important to career-flexibility and work-life balance—paid dependent careand childbearing leaves. Note <strong>the</strong> improvement even for TTF.While union schools <strong>of</strong>fer more benefits to FT-NTTF, <strong>the</strong> most advantage is conferred onPT-NTTF where <strong>the</strong> presence <strong>of</strong> a faculty union substantially increases <strong>the</strong> percentage <strong>of</strong>schools <strong>of</strong>fering benefits.<strong>Making</strong> <strong>the</strong> <strong>Best</strong> <strong>of</strong> <strong>Both</strong> <strong>Worlds</strong>43
W O R K I N G C O N D I T I O N SFigure 37Primary Teaching AssignmentIn terms <strong>of</strong> <strong>the</strong> type <strong>of</strong> courses<strong>the</strong>y are hired to teach, <strong>the</strong>re islittle difference between FT- andPT-NTTF, so for this analysis <strong>the</strong>two groups have been combined.From <strong>the</strong> original metric, generallyand always were collapsed into asingle category titled ‘generally’.UNDERGRADUATE CORECOURSES INDEPARTMENTAL CURRICULA17%3%UNDERGRADUATE UPPERLEVEL AND ELECTIVECOURSES6%35%In a related question, respondentsindicated that assessment <strong>of</strong>teaching performance is nearlyuniversal—all indicate that <strong>the</strong>ydo so for FT-NTTF and 98% that<strong>the</strong>y evaluate PT-NTTF.80%GenerallyRarelyNever59%COURSES IN PROFESSIONALSCHOOLS/PROGRAMSGRADUATE LEVEL CLASSES19%8%38%30%43%62%44From <strong>the</strong> original metric, <strong>the</strong> response options generally and always have been collapsed into <strong>the</strong> single category“generally” shown here.<strong>Making</strong> <strong>the</strong> <strong>Best</strong> <strong>of</strong> <strong>Both</strong> <strong>Worlds</strong>
Figure 38Primary Teaching Assignment by <strong>Institution</strong>al Type100%80%60%undergrad corepr<strong>of</strong>essional programsupper level electivesgrad courses40%20%0%doc-extensive doc-intensive master I & II bacc-lib art bacc-gen’lData points represent <strong>the</strong> percentage <strong>of</strong> institutions that responded “generally” or “always”.Again, <strong>the</strong>re is little difference between FT- and PT-NTTF, so for this graph <strong>the</strong> twogroups have been combined. There is relatively little variation when primary teachingassignment is examined by institutional type. With <strong>the</strong> exception <strong>of</strong> two data points <strong>the</strong>lines are relatively flat, indicating minimal differences among institutional types. Twodata points depart <strong>from</strong> <strong>the</strong> average—nearly two thirds (63%) <strong>of</strong> Doctoral—Intensivesreport engaging NTTF to teach courses in pr<strong>of</strong>essional programs, and 61% <strong>of</strong> LiberalArts institutions engage NTTF to teach upper level and elective courses at <strong>the</strong> undergraduatelevel. The presence <strong>of</strong> a faculty union makes relatively little difference toprimary teaching assignment.45<strong>Making</strong> <strong>the</strong> <strong>Best</strong> <strong>of</strong> <strong>Both</strong> <strong>Worlds</strong>
Figure 39Expectation <strong>of</strong> Engagement in Aspects <strong>of</strong> Pr<strong>of</strong>essional Academic LifeEngagement in research, teachingand service are integral to <strong>the</strong> life<strong>of</strong> TTF. We know that NTTF arehired to teach, but are <strong>the</strong>y alsorequired to mentor and advisestudents, engage in research andpublications, and provide serviceto <strong>the</strong> university and/or <strong>the</strong>community?Because not all disciplines doresearch, we use <strong>the</strong> broader term,pr<strong>of</strong>essional product, to encompass<strong>the</strong> fine and performing arts. From<strong>the</strong> original metric (required,preferred, not required, varies byfield) <strong>the</strong> first two responseoptions (required and preferred)were collapsed into a singlecategory titled ‘yes’.FULL TIME19%27%54%24%63%13%Create pr<strong>of</strong>essional productYESNOVARIESAdvise/mentor studentsPART TIME12% 10%78%16%32%52%46Overall, institutions have higherexpectations for FT-NTTF. Moreinstitutions expect FT-NTTF tocreate pr<strong>of</strong>essional product, advisestudents and perform service, thanPT-NTTF. While relatively fewexpect <strong>the</strong> creation <strong>of</strong> pr<strong>of</strong>essionalproduct, half expect committee/service work, and nearly two thirdsexpect that FT-NTTF will adviseand mentor students in addition toteaching.27%22%51%Do committee/service work10%16%74%From <strong>the</strong> original metric (required, preferred, not required, varies by field) <strong>the</strong> first two response options(required and preferred) were collapsed into a single category titled ‘yes.’<strong>Making</strong> <strong>the</strong> <strong>Best</strong> <strong>of</strong> <strong>Both</strong> <strong>Worlds</strong>
Figure 40<strong>Institution</strong>al Support for Engagement in Aspects <strong>of</strong> Pr<strong>of</strong>essional Academic LifeFULL TIMEPART TIMEAccess to necessary equipment, space, etc.16%79%45%84%YES55%NOFinancial support for dissemination20%33%If NTTF are expected to engage inaspects <strong>of</strong> academic life o<strong>the</strong>r thanteaching, it is reasonable to expectthat <strong>the</strong> institution will supportthose efforts. For FT-NTTF morethan four <strong>of</strong> five (84%) institutionsprovide access to necessary equipmentand <strong>of</strong>fice, lab or studiospace, etc.; two thirds (67%) providefinancial support for dissemination<strong>of</strong> pr<strong>of</strong>essional product such astravel, conference fees, etc.; andjust over half provide financialsupport for research, participationin grants, etc.67%80%Financial support for research,participation in grants, etc.22%46%54%78%47From <strong>the</strong> original metric never and rarely were collapsed into a single category titled ‘no’ and generally andalways into a single category titled ‘yes’.<strong>Making</strong> <strong>the</strong> <strong>Best</strong> <strong>of</strong> <strong>Both</strong> <strong>Worlds</strong>
Figure 41<strong>Institution</strong>al Reward for Creation <strong>of</strong> Pr<strong>of</strong>essional ProductFew institutions, one in five (19%),allow work release, a reducedteaching load, or o<strong>the</strong>r compensatedtime allowance and only one in six(16%) grant extra compensation forcreation <strong>of</strong> pr<strong>of</strong>essional product. Soalthough institutions may providespace and reimburse certain costs,<strong>the</strong>y do not, by and large, encouragesuch activities by providing <strong>the</strong>time to do so, nor do <strong>the</strong>y provide<strong>the</strong> incentive <strong>of</strong> increased compensation.For PT-NTTF <strong>the</strong> rewardsare even fewer.FULL TIMEPART TIMEWork release or reduced teaching load81%19%94%YESNOIncreased compensation6%16%10%84%90%From <strong>the</strong> original metric never and rarely were collapsed into a single category titled ‘no’ and generally andalways into a single category titled ‘yes’.48<strong>Making</strong> <strong>the</strong> <strong>Best</strong> <strong>of</strong> <strong>Both</strong> <strong>Worlds</strong>
Figure 42Access to ResourcesPT-NTTF100%90%80%80%85%99%76%86%FT-NTTF70%60%50%40%30%20%21%10%0%private <strong>of</strong>fice spaceaccess to voicemail/telephoneclerical supportA majority <strong>of</strong> respondents provide private <strong>of</strong>fice space to FT-NTTF (80%) and shared<strong>of</strong>fice space to PT-NTTF (82%). For those resources that cost <strong>the</strong> institution little toprovide, such as access to an email account, to <strong>the</strong> library, and to <strong>the</strong> computer labs,both FT- and PT-NTTF have almost universal privileges.However, our respondents report that <strong>the</strong>ir full-time NTTF are much more likely to beprovided with <strong>of</strong>fice space, and somewhat more likely to have telephones and clericalsupport—more costly resources, but ones that not only enable instructional faculty toget <strong>the</strong>ir work done but also contribute to a feeling <strong>of</strong> connectedness to <strong>the</strong>ir institutions.49<strong>Making</strong> <strong>the</strong> <strong>Best</strong> <strong>of</strong> <strong>Both</strong> <strong>Worlds</strong>
Figure 43Participation in GovernanceAs might be expected, FT-NTTFare entitled to participate in governanceat more institutions than arepart-timers and participation ismore likely at <strong>the</strong> departmentlevel than at <strong>the</strong> senate level.FT-NTTF SENATE22%PT-NTTF SENATE35%78%65%SomeNoneFT-NTTF DEPARTMENTPT-NTTF DEPARTMENT5%34%95%66%From <strong>the</strong> original metric, <strong>the</strong> response options “full” and “partial” have been combined in <strong>the</strong> pie graphswith <strong>the</strong> caption “some.”50<strong>Making</strong> <strong>the</strong> <strong>Best</strong> <strong>of</strong> <strong>Both</strong> <strong>Worlds</strong>
M O B I L I T YA number <strong>of</strong> survey items address <strong>the</strong> ability <strong>of</strong> NTTF to move into TT positions. Werecognize that not all individuals in NTT positions seek or desire a TT position; however,many scholars do aspire to <strong>the</strong> traditional model <strong>of</strong> an academic career.Figure 44Decision Maker on Flexibility in Moving Between TT and NTT Status6%7%18%External<strong>Institution</strong> wide69%UnitUnion ContractExternal entities, as well as various constituencies within <strong>the</strong> institution, may controlpolicies and practices that apply to NTTF. We asked “At what level is flexibility inmoving between TT and NTT status determined at your institution?” For <strong>the</strong> most part,this decision is made on an institution-wide basis.51<strong>Making</strong> <strong>the</strong> <strong>Best</strong> <strong>of</strong> <strong>Both</strong> <strong>Worlds</strong>
Figure 45<strong>Institution</strong>s with Policies that Prohibit or Permit Moves <strong>from</strong> NTT to TTWe asked about formal policies thatei<strong>the</strong>r explicitly permit or prohibitmoves <strong>from</strong> NTT to <strong>the</strong> tenure track.Only one in twenty have a policythat explicitly prohibits such moves<strong>from</strong> taking place, while nearly aquarter have a policy permittingsuch moves.HAVE POLICIESTHAT PERMIT23%HAVE POLICIESTHAT PROHIBIT5%In institutions that permit suchmoves, about half (47%) allow fornegotiation between <strong>the</strong> individualand <strong>the</strong> department/unit. The policyprovides that such moves would beconsidered permanent by 72% <strong>of</strong><strong>the</strong> institutions and for a specificlength <strong>of</strong> time by 9%. The remainderallowed for such moves to beconsidered ei<strong>the</strong>r.77%YesNo95%Figure 46Frequency <strong>of</strong> Moves <strong>from</strong> NTT to TTAll respondents, without regardto <strong>the</strong> presence <strong>of</strong> formal policiesprohibiting moves <strong>from</strong> NTT toTT positions, were asked how <strong>of</strong>tensuch moves actually took place.6%3%FrequentlySometimes52The vast majority <strong>of</strong> our respondentsindicated that <strong>the</strong>y do sometimesoccur. Relatively few indicated thatsuch moves happen ei<strong>the</strong>r frequentlyor never.91%NeverFrom <strong>the</strong> original metric, <strong>the</strong> response options “rarely” and “occasionally” have been combined in <strong>the</strong> piegraphs with <strong>the</strong> caption “sometimes.”<strong>Making</strong> <strong>the</strong> <strong>Best</strong> <strong>of</strong> <strong>Both</strong> <strong>Worlds</strong>
Figure 47Mobility <strong>from</strong> NTT to TT by <strong>Institution</strong>al TypeDOCTORAL-EXTENSIVE4%96%FrequentlySometimesNeverDOCTORAL-INTENSIVE10%90%<strong>Institution</strong>al type appears to be associatedwith whe<strong>the</strong>r or not such movements onto<strong>the</strong> tenure track occur. As <strong>the</strong> previous figuredemonstrates, movement <strong>from</strong> NTT to TTdoes occur “sometimes,” in <strong>the</strong> majority <strong>of</strong>institutions <strong>of</strong> all types. However, interestingdifferences show up at opposite ends <strong>of</strong> <strong>the</strong>classification system:MASTER I & II2%10%88%FrequentlySometimesNever• None <strong>of</strong> <strong>the</strong> Doctoral Extensive universitiesor Liberal Arts Baccalaureatecolleges reported that such moveshappen “frequently.”• Among Doctoral Intensive universitiesand General Baccalaureate collegessuch moves are more likely to happen:One in ten Doctoral Intensives and onein eight General Baccalaureates reportedthat such moves occur “frequently.”BACC-LIBERAL ARTS5%95%FrequentlySometimesNeverBACC-GENERAL6% 13%81%• Master’s colleges and universities are in<strong>the</strong> middle—such movements takingplace not as <strong>of</strong>ten as at DoctoralIntensive or General Baccalaureateinstitutions and more <strong>of</strong>ten than atDoctoral Extensive or Liberal ArtsBaccalaureate institutions.The message <strong>from</strong> <strong>the</strong>se findings seems tobe that, if you are a NTTF member aspiringto a tenure-track job, your chances arebetter at Doctoral Intensive and GeneralBaccalaureate colleges and universities.53<strong>Making</strong> <strong>the</strong> <strong>Best</strong> <strong>of</strong> <strong>Both</strong> <strong>Worlds</strong>
I S S U E S A N D C O N S T I T U E N C I E SThe final section <strong>of</strong> <strong>the</strong> survey asked a series <strong>of</strong> questions concerning <strong>the</strong> amount andtypes <strong>of</strong> interest in issues regarding NTTF and <strong>the</strong> role <strong>of</strong> various campus constituentsin matters related to NTTF.Figure 48Level <strong>of</strong> Consideration to <strong>Institution</strong>al Issues Regarding NTTF100%90%80%70%60%50%40%30%20%10%0%80%11%51%38%doc-extensive doc-intensive master I & II bacc-libart38%baccgen’lThough this varies considerably by institution type, overall, more than half <strong>of</strong> <strong>the</strong>respondents said that <strong>the</strong> subject <strong>of</strong> NTTF had been a matter <strong>of</strong> serious considerationat <strong>the</strong>ir institution over <strong>the</strong> past 1 or 2 years.54<strong>Making</strong> <strong>the</strong> <strong>Best</strong> <strong>of</strong> <strong>Both</strong> <strong>Worlds</strong>
Figure 49Level <strong>of</strong> Interest in <strong>Institution</strong>al Issues Associated with NTTFMean ResponseBudget constraints 3.53Ability to <strong>of</strong>fer a higher number <strong>of</strong> classes/sections 3.39Impact on <strong>the</strong> quality <strong>of</strong> instruction 3.32Students’ access to full-time tenured/tenure-track pr<strong>of</strong>essors 3.31Students’ access to faculty outside <strong>the</strong> classroom 3.10Reputation <strong>of</strong> <strong>the</strong> institution 3.07Opportunity to expand course <strong>of</strong>ferings 3.00Stakeholders’ concerns about quality <strong>of</strong> instruction 2.99Concerns about a disproportionate balance between TT/NTT 2.80Opportunity to reduce class size 2.68Ability to respond to market trends 2.62Terms or conditions <strong>of</strong> work for NTT 2.60Increased release time for TT faculty to produce research 2.40Differing qualifications <strong>of</strong> TT and NTTF 2.34The desire to bring in specialists 2.27Lack <strong>of</strong> NTT involvement in o<strong>the</strong>r faculty activities 2.22Loss <strong>of</strong> collegiality 2.13Spousal/partner employment assistance 1.84Differences in evaluation processes between TT and NTT 1.83Impact on academic freedom 1.61Scale: 1 = very little interest, 5 = a great deal <strong>of</strong> interestThe survey <strong>of</strong>fered a list <strong>of</strong> twenty issues <strong>of</strong>ten associated with <strong>the</strong> employment <strong>of</strong> NTTFand asked, on a scale <strong>of</strong> one to five, with one being very little interest and five being agreat deal <strong>of</strong> interest, how much consideration <strong>the</strong> items had received over <strong>the</strong> last 2years. Based on <strong>the</strong> mean response values for each <strong>of</strong> <strong>the</strong> twenty items, <strong>the</strong> highest rankedsingle item is “Budget Constraints”.55<strong>Making</strong> <strong>the</strong> <strong>Best</strong> <strong>of</strong> <strong>Both</strong> <strong>Worlds</strong>
Because a list <strong>of</strong> twenty items is difficult to evaluate, factor analysis was used to reduce<strong>the</strong> data and reveal how <strong>the</strong>y cluster into more meaningful and interpretable <strong>the</strong>mes.Figure 50 reflects our decision to remove “budget constraints” <strong>from</strong> <strong>the</strong> list <strong>of</strong> itemsto be factored. While an important item in and <strong>of</strong> itself, it didn’t seem to fit well withinfactor groupings. Fur<strong>the</strong>r, when removed, tests <strong>of</strong> internal reliability were stronger and<strong>the</strong> top ranking scores fell much more heavily into Factor 1 ra<strong>the</strong>r than into Factor 2when “budget constraints” was not included. Factor analysis was conducted using principalaxis factoring with varimax rotation.The factors are displayed in descending order <strong>of</strong> importance to respondents as indicatedby <strong>the</strong> mean response for each factor. The first factor may be interpreted as <strong>the</strong> importance<strong>of</strong> institutional quality with a more external focus. The second factor is moreinternally focused on curricula and course <strong>of</strong>ferings. The third is also internally focusedon aspects <strong>of</strong> faculty work life. Results were similar across institutional types. It isperhaps not surprising that our respondents, who are administrators representing <strong>the</strong>irinstitutions, rank <strong>the</strong> first two institutionally focused factors as ra<strong>the</strong>r more importantthan <strong>the</strong> third which represents issues that may be more important to faculty<strong>the</strong>mselves.56<strong>Making</strong> <strong>the</strong> <strong>Best</strong> <strong>of</strong> <strong>Both</strong> <strong>Worlds</strong>
Figure 50Results <strong>of</strong> Factor Analysis <strong>of</strong> Interest to <strong>Institution</strong>al Issues Related to NTTFConstructItem descriptionMeanresponseAlphaLoading0.875Quality and afocus on nonorganizationalconstituenciesStudents’ access to faculty outside <strong>the</strong> classroomStudents’ access to full-time tenured/tenure-track pr<strong>of</strong>essorsStakeholders’ concerns about quality <strong>of</strong> instructionReputation <strong>of</strong> <strong>the</strong> institutionImpact on <strong>the</strong> quality <strong>of</strong> instructionThe desire to bring in specialistsMean response for factor3.103.312.993.073.322.273.010.8460.7880.7690.6770.4310.3910.799Educational<strong>of</strong>ferings /curriculumOpportunity to expand course <strong>of</strong>feringsAbility to <strong>of</strong>fer a higher number <strong>of</strong> classes/sectionsAbility to respond to market trendsOpportunity to reduce class sizeIncreased release time for TT faculty to produce researchMean response for factor3.393.002.622.682.402.820.8220.7530.6110.5160.4290.806Faculty lifeand workconditionsImpact on academic freedomTerms or conditions <strong>of</strong> work for NTTDiffering qualifications <strong>of</strong> TT and NTTFLoss <strong>of</strong> collegialityDifferences in evaluation processes between TT and NTTConcerns about a disproportionate balance between TT/NTTLack <strong>of</strong> NTT involvement in o<strong>the</strong>r faculty activitiesSpousal/partner employment assistanceMean response for factor1.612.602.342.131.832.802.221.842.170.7420.6090.5760.5730.5590.4800.4600.413Factor analysis was conducted using principal axis factoring with varimax rotation57<strong>Making</strong> <strong>the</strong> <strong>Best</strong> <strong>of</strong> <strong>Both</strong> <strong>Worlds</strong>
Figure 51Reasons Individuals Accept NTT Positions, as Reported by RespondentsEarlycareeraspiringto TTLatecareerfacultyeasingintoretirementCareersoutside,teachas asidelineCan'tfind aTT jobPurposelychooseNTTFew 31% 75% 37% 43% 46%Some 57% 23% 46% 48% 35%Most 12% 2% 17% 9% 19%100% 100% 100% 100% 100%Acknowledging that individuals accept non-tenure track positions for many reasons,we asked respondents to identify reasons <strong>the</strong>y thought motivated such choices.Figure 52Reasons Individuals Purposely Choose NTT Positions, as Reported by RespondentsGeographicconstraintsSeek worklifebalancePrefer NTTFew 24% 38% 48%Some 57% 58% 41%Most 19% 4% 11%100% 100% 100%58Those who indicated a belief that some or most <strong>of</strong> <strong>the</strong>ir NTTF had purposely chosen suchpositions were <strong>the</strong>n asked to speculate as to why.<strong>Making</strong> <strong>the</strong> <strong>Best</strong> <strong>of</strong> <strong>Both</strong> <strong>Worlds</strong>
Figure 53Issues <strong>of</strong> Importance to NTTF, as Reported by Respondents100%90%80%70%60%75%72%70%61%50%40%30%20%10%33%26%23%11%0%compensationjob securityrespectwork conditionspromotionresearch supportTT accessgovernanceAlthough respondents were asked to make only four selections, <strong>the</strong> s<strong>of</strong>tware did not prevent choosing moreor less than four items <strong>from</strong> <strong>the</strong> list.It is important to keep in mind that respondents are administrators acting on behalf <strong>of</strong><strong>the</strong>ir institutions, <strong>the</strong>refore providing an institutional viewpoint, and not NTTF members<strong>the</strong>mselves.From a list <strong>of</strong> eight issues, all <strong>of</strong> which are important to non-tenure track faculty, weasked respondents to choose <strong>the</strong> four issues <strong>the</strong>y believe matter most to NTTF. The s<strong>of</strong>twaredid not prevent choosing more or less than four items <strong>from</strong> <strong>the</strong> list. This set <strong>of</strong>items is different <strong>from</strong> <strong>the</strong> previous set which focused on institutional issues ra<strong>the</strong>r thanitems <strong>of</strong> personal interest to NTTF.This figure shows <strong>the</strong> percentage <strong>of</strong> respondents choosing that item as being important.The top four choices (those chosen most <strong>of</strong>ten) are compensation, job security, respect,and work conditions, in that order. The number <strong>of</strong> responses drops <strong>of</strong>f after <strong>the</strong>se top four—indicating that <strong>the</strong> last four are perceived by administrators as less important. Keepingin mind that <strong>the</strong>se are administrators responding on behalf <strong>of</strong> <strong>the</strong>ir institutions, it is surprisingthat “Respect” is among <strong>the</strong> top four, and that “Tenure-Track Access” is not.59<strong>Making</strong> <strong>the</strong> <strong>Best</strong> <strong>of</strong> <strong>Both</strong> <strong>Worlds</strong>
Figure 54Support for Issues Important to NTTF, as Reported by Respondents100%90%80%70%60%50%49%40%30%20%10%36%34%24%13%8%5% 4%0%compensationwork conditionsrespectjob securitypromotionTT accessresearch supportgovernanceFrom <strong>the</strong> same list <strong>of</strong> eight, respondents were asked to identify <strong>the</strong> two issues that hadgarnered <strong>the</strong> most support, and which had sparked <strong>the</strong> most opposition. The top twochoices (those chosen most <strong>of</strong>ten) for support are compensation and work conditions,followed closely by respect, and <strong>the</strong>n job security.Note that <strong>the</strong>se are <strong>the</strong> same four chosen as most important to NTTF in <strong>the</strong> previoussection. In fact, <strong>the</strong> whole list is in <strong>the</strong> same order for both questions. This suggests thatrespondents may have been unable to differentiate between importance and support andso conflated <strong>the</strong> two in <strong>the</strong>ir responses.60Here too, it is important to keep in mind that respondents are administrators acting onbehalf <strong>of</strong> <strong>the</strong>ir institutions, <strong>the</strong>refore providing an institutional viewpoint, and notNTTF member <strong>the</strong>mselves.<strong>Making</strong> <strong>the</strong> <strong>Best</strong> <strong>of</strong> <strong>Both</strong> <strong>Worlds</strong>
Figure 55Opposition to Issues Important to NTTF, as Reported by Respondents100%90%80%70%60%50%40%30%20%10%24%22%18%18%17%15%10%6%0%TT accessgovernancejob securityresearch supportcompensationpromotionwork conditionsrespectThe ‘votes’ tally up ra<strong>the</strong>r differently for issues that generate opposition. The top items(access to <strong>the</strong> tenure track, participation in governance, job security and researchsupport) are issues that would change <strong>the</strong> nature <strong>of</strong> NTT work, making it more liketraditional TT work. It is important to keep in mind that respondents are administratorsacting on behalf <strong>of</strong> <strong>the</strong>ir institutions, <strong>the</strong>refore providing an institutional viewpoint, andnot NTTF member <strong>the</strong>mselves.Although respondents were asked to make only four selections for importance and twoin <strong>the</strong> case <strong>of</strong> support and opposition questions, <strong>the</strong> s<strong>of</strong>tware did not prevent choosingmore or less than that many items <strong>from</strong> <strong>the</strong> list. What is interesting is that <strong>the</strong> importanceand support questions were fairly well answered, but opposition was not.61<strong>Making</strong> <strong>the</strong> <strong>Best</strong> <strong>of</strong> <strong>Both</strong> <strong>Worlds</strong>
Figure 56Importance, Support and Opposition ComparedImportance Support OppositionCompensation 8 8 4Job security 7 5 6Respect 6 6 1Work conditions 5 7 2Promotion 4 4 3Research support 3 2 5Tenure track access 2 3 8Governance 1 1 7It may be helpful to look at importance toge<strong>the</strong>r with support and opposition. T<strong>of</strong>acilitate comparison, <strong>the</strong> response set for each item was ranked 1-8, with 8 being <strong>the</strong>response option chosen most <strong>of</strong>ten by administrators responding to our survey. Again,<strong>the</strong>re’s a great deal <strong>of</strong> similarity between issues judged by <strong>the</strong> respondents to be importantand those judged to have garnered <strong>the</strong> most support. Perhaps as observed above,importance and support are conflated, and perhaps opposition is more difficult togauge. A similar result will be seen in <strong>the</strong> next section on advocacy and resistance tochange.62<strong>Making</strong> <strong>the</strong> <strong>Best</strong> <strong>of</strong> <strong>Both</strong> <strong>Worlds</strong>
Acknowledging that <strong>the</strong>re are many constituencies interested in <strong>the</strong> evolving role <strong>of</strong>NTTF, we asked respondents to indicate <strong>from</strong> <strong>the</strong> following list which constituencieshad been instrumental in advocating for change on behalf <strong>of</strong> NTTF, and which had beenresistant to change.• NTTF <strong>the</strong>mselves• Administration(e.g., president, provost, dean)• Individual schools/departments• Faculty governing body• TT faculty <strong>the</strong>mselves• Faculty union• Women’s commission/council/center• Board/Regents/Trustees• External entity (e.g., state legislature, highereducation board/commission, university system)• Students/student organizationsFigure 57Constituencies Who Advocate for Change on Behalf <strong>of</strong> NTTF30%25%26%20%15%17%16%14%10%5%0%NTTFadminsch/deptfac/gov’t7%TTF7%fac union5%women’s comm3%board3%external1%studentsClearly, <strong>the</strong> strongest advocate for change regarding NTTF is <strong>the</strong> NTTF <strong>the</strong>mselves,followed by institutional level administration, individual schools or departments, andfaculty governing bodies.63<strong>Making</strong> <strong>the</strong> <strong>Best</strong> <strong>of</strong> <strong>Both</strong> <strong>Worlds</strong>
Figure 58Constituencies Who Resist Change Regarding NTTF30%25%24%24%20%15%15%14%10%11%5%6%3%1%1%1%0%adminTTFsch/deptfac/gov’texternalboardfac. unionNTTFwomen’s commstudentsRespondents indicated that <strong>the</strong> strongest resistance to change is institutional leveladministration, which may fear <strong>the</strong> financial impact <strong>of</strong> improving <strong>the</strong> lot <strong>of</strong> NTTF.Interestingly, this group was also <strong>the</strong> second leading advocate for change. Equallyresistant to change is <strong>the</strong> TTF who may see <strong>the</strong>ir power and exclusivity eroded by anewly empowered, entitled group <strong>of</strong> NTTF.64<strong>Making</strong> <strong>the</strong> <strong>Best</strong> <strong>of</strong> <strong>Both</strong> <strong>Worlds</strong>
Figure 59Comparing Advocates and Resistors Regarding NTTF ChangeAdvocatesResistorsNTT faculty <strong>the</strong>mselves 10 3Administration 9 10Individual schools/departments 8 8Faculty governing body 7 7TT faculty <strong>the</strong>mselves 6 9Faculty union 5 4Women’s commission/council/center 4 2Board/Regents/Trustees 3 5External entity 2 6Students/student organizations 1 1Now comparing <strong>the</strong> two, we see, not surprisingly, that NTTF are highly ranked asadvocates and fairly low as resistors. Showing <strong>the</strong> choices ranked 1-10 (with 10 being<strong>the</strong> response option chosen most <strong>of</strong>ten) ra<strong>the</strong>r than by <strong>the</strong> number <strong>of</strong> votes cast for eachchoice helps to show <strong>the</strong> two constituent groups (advocates and resistors) with an equalmetric which although it facilitates comparison also tends to mask <strong>the</strong> absolute differencein <strong>the</strong> number <strong>of</strong> votes. As with opposition to issues in <strong>the</strong> previous section, resistanceto change was less well answered that advocacy and may have an aspect <strong>of</strong> socialbias—not wishing to name <strong>the</strong> negative, perhaps.Constituents in leadership/governance positions (administration, schools/departments,faculty government, and faculty unions) are ranked almost evenly as advocates andresistors—indicating <strong>the</strong>ir conflicted roles in <strong>the</strong> changing and challenging environmentfor NTTF. Tenure track faculty are seen as net resistors, perhaps supporting <strong>the</strong> beliefthat increasing numbers and improving circumstances for NTTF pose a threat to <strong>the</strong>exclusive and privileged purview <strong>of</strong> TTF. The o<strong>the</strong>r category <strong>of</strong> net resistors is nonemployeeadministrators such as boards and external entities.65<strong>Making</strong> <strong>the</strong> <strong>Best</strong> <strong>of</strong> <strong>Both</strong> <strong>Worlds</strong>
E N D N O T E S1. Bradley, G. (2004). Contingent Faculty and <strong>the</strong> New Academic Labor System. Academe,90(1), 28-33.2. AAUP (2006). AAUP Contingent Faculty Index 2006. Retrieved <strong>from</strong> American Association <strong>of</strong>University Pr<strong>of</strong>essors website: www.aaup.org/AAUP/pubsres/research/conind2006.htmBenjamin, E. (Ed.) (2003). Exploring <strong>the</strong> role <strong>of</strong> contingent instructional staff in undergraduatelearning. (New Directions for Higher Education Vol. 123) Fall 2003. San Francisco:Jossey-Bass.Ehrenberg, R. G. & Zhang, L. (2004). Do tenured and tenure track faculty matter? (NBERWorking Paper No. W10695). Cambridge, MA: <strong>National</strong> Bureau <strong>of</strong> Economic Research.Jacoby, D. (2006). Effects <strong>of</strong> part-time faculty employment on community college graduationrates. The Journal <strong>of</strong> Higher Education, 77(6), 1081-1103.Umbach, P. (2007). How effective are <strong>the</strong>y? Exploring <strong>the</strong> impact <strong>of</strong> contingent faculty onundergraduate education. The Review <strong>of</strong> Higher Education, 30(2), 91-123.3. Spalter-Roth, R. & Erskine, W. (2004). Academic relations: The use <strong>of</strong> supplementary faculty.ASA Research Report. Washington, D.C.: American Sociological Association.4. Kezar, A., Carducci, R. & Contreras-McGavin, M. (2006). Rethinking <strong>the</strong> “L” word in highereducation. Published as ASHE Higher Education Report 31(6).5. For example: Umbach, P. (2007).6. Spalter-Roth, R. & Erskine, W. (2004).7. NCES, 2004 <strong>National</strong> Study <strong>of</strong> Postsecondary Faculty (NSOPF:04). Report on Faculty andInstructional Staff in Fall 2003. <strong>National</strong> Center for Educational Statistics, Department <strong>of</strong>Education, Washington DC.8. AAUP (2006). Trends in Faculty Status, 1975-2003. Retrieved <strong>from</strong> American Association <strong>of</strong>University Pr<strong>of</strong>essors website: www.aaup.org/AAUP/pubsres/research/trends1975-2003.htm669. David W. Leslie (2006). TIAA-CREF Policy Brief: Faculty Careers and Flexible Employment.www.tiaa-crefinstitute.org<strong>Making</strong> <strong>the</strong> <strong>Best</strong> <strong>of</strong> <strong>Both</strong> <strong>Worlds</strong>
10. NCES, 2004 <strong>National</strong> Study <strong>of</strong> Postsecondary Faculty (NSOPF:04).11. AAUP (2003). Contingent Appointments and <strong>the</strong> Academic Pr<strong>of</strong>ession. Retrieved <strong>from</strong> <strong>the</strong>AAUP website: http://www.aaup.org/AAUP/pubsres/policydocs/conting-stmt.htmAAUP (2006). AAUP Contingent Faculty Index 2006.Biles, G. E. & Tuckman, H. P. (1986). Part-Time Faculty Personnel Management Policies.New York: ACE/Macmillan Publishing Co.Gappa, J. M. & Leslie, D. W. (1993). The Invisible Faculty: Improving <strong>the</strong> Status <strong>of</strong> Part-Timers in Higher Education. San Francisco: Jossey-Bass.Leslie, D. M. (Ed) (1998). The Growing Use <strong>of</strong> Part-Time Faculty: Understanding Causesand Effects, (New Directions for Higher Education Vol. 104). San Francisco: Jossey-Bass.Spalter-Roth, R. & Erskine, W. (2004).Thompson, K. (2003). Contingent Faculty and Student Learning: Welcome to <strong>the</strong>Strativersity. New Directions for Higher Education (Vol. 123), Fall 2003. San Francisco:Jossey-Bass, pp. 61-69.12. NCES, 2004 <strong>National</strong> Study <strong>of</strong> Postsecondary Faculty (NSOPF:04).13. Umbach, P. (2007).AAUP (2006). AAUP Contingent Faculty Index 2006.14. Rhoades, G. (1996). Reorganizing <strong>the</strong> Faculty Workforce for Flexibility: Part-TimePr<strong>of</strong>essional Labor. The Journal <strong>of</strong> Higher Education, 67(6) 626-659.15. AAUP (2003).16. Gappa, J. M. & Leslie, D. W. (1993).17. Flynn, E. A., Flynn, J. F., Grimm, N. & Lockhart, T. (1986). The Part-Time Problem: FourVoices. Academe, January-February 72(1), pp. 12-18.Gaddy, C. D. (1998). Implications for Knowledge Production and Careers in Science. In D.M. Leslie (Ed.), New Directions for Higher Education (Vol. 104) pp. 61-70. San Francisco:Jossey-Bass.Harper, E. P., Baldwin, R. G., Gansneder, B. G., & Chronister, J. L. (2001). Full-TimeWomen Faculty Off <strong>the</strong> Tenure Track: Pr<strong>of</strong>ile and Practice. Review <strong>of</strong> Higher Education,24(3), 237-257.67<strong>Making</strong> <strong>the</strong> <strong>Best</strong> <strong>of</strong> <strong>Both</strong> <strong>Worlds</strong>
18. Maslow, A. H. (1943). A Theory <strong>of</strong> Human Motivation, Psychological Review. (50)6, 370-396.19. Maslow, A. H. (1943) p. 379.20. Maslow, A. H. (1943) p. 377.21. Maslow, A. H. (1943) p. 383.22. Jaschik, S. A New Campaign on Adjuncts. (March 05, 2007). Inside Higher Ed.http://insidehighered.com/news/2007/03/05/adjunctsAAUP (2006). AAUP Contingent Faculty Index 2006.68<strong>Making</strong> <strong>the</strong> <strong>Best</strong> <strong>of</strong> <strong>Both</strong> <strong>Worlds</strong>
C A R N E G I E C L A S S I F I C AT I O N O F I N S T I T U T I O N S O F H I G H E R E D U C AT I O N , 2 0 0 0The Carnegie Classification <strong>of</strong> <strong>Institution</strong>s <strong>of</strong> HigherEducation is a taxonomy <strong>of</strong> all U.S. colleges and universitiesthat grant degrees and are accredited by <strong>the</strong> U.S. Secretary<strong>of</strong> Education. The categories are based on information about<strong>the</strong> institutions, such as types <strong>of</strong> degrees conferred, academicdisciplines <strong>of</strong>fered, and specialization. This report uses <strong>the</strong>2000 edition <strong>of</strong> <strong>the</strong> Carnegie Classification, which has sixcategories <strong>of</strong> four-year institutions. Each category is brieflydescribed below:• Doctoral/Research Universities—Extensive:These institutions typically <strong>of</strong>fer a wide variety <strong>of</strong>baccalaureate degrees and award fifty or more doctoraldegrees per year across at least fifteen academicdisciplines. Doctoral degrees include <strong>the</strong> Ph.D.,Doctor <strong>of</strong> Education, Doctor <strong>of</strong> Juridical Science,and Doctor <strong>of</strong> Public Health, among o<strong>the</strong>rs.• Doctoral/Research Universities—Intensive:These institutions typically <strong>of</strong>fer a wide variety <strong>of</strong>baccalaureate degrees and award at least ten doctoraldegrees per year across at least three academicdisciplines or at least twenty doctoral degrees peryear overall.• Master's Colleges and Universities I:These institutions typically <strong>of</strong>fer a wide variety <strong>of</strong>baccalaureate degrees and award forty or more master'sdegrees per year across three or more academicdisciplines.• Master's Colleges and Universities II:These institutions typically <strong>of</strong>fer a wide variety <strong>of</strong>baccalaureate degrees and award twenty or moremaster's degrees per year.• Baccalaureate Colleges—Liberal Arts:These institutions award at least half <strong>of</strong> <strong>the</strong>irbaccalaureate degrees in liberal arts fields. Examples<strong>of</strong> liberal arts fields include English, foreignlanguages, biological sciences, ma<strong>the</strong>matics, philosophy,religion, physical sciences, social sciences, andhumanities.• Baccalaureate Colleges—General:These institutions award less than half <strong>of</strong> <strong>the</strong>irbaccalaureate degrees in liberal arts fields.More information can be found on <strong>the</strong> Carnegie Foundation’s websitehttp://www.carnegiefoundation.org/classifications/
R E G E N T S O F T H E U N I V E R S I T Y O F M I C H I G A NJulia Donovan Darlow, Ann Arbor; Laurence B. Deitch, Bingham Farms; Olivia P.Maynard, Goodrich; Rebecca McGowan, Ann Arbor; Andrea Fischer Newman, AnnArbor; Andrew C. Richner, Grosse Pointe Park; S. Martin Taylor, Grosse Pointe Farms;Ka<strong>the</strong>rine E. White, Ann Arbor; Mary Sue Coleman (ex <strong>of</strong>ficio)The University <strong>of</strong> Michigan, as an equal opportunity/affirmative action employer,complies with all applicable federal and state laws regarding nondiscrimination andaffirmative action, including Title IX <strong>of</strong> <strong>the</strong> Education Amendments <strong>of</strong> 1972 andSection 504 <strong>of</strong> <strong>the</strong> Rehabilitation Act <strong>of</strong> 1973. The University <strong>of</strong> Michigan is committedto a policy <strong>of</strong> nondiscrimination and equal opportunity for all persons regardless <strong>of</strong>race, sex, color, religion, creed, national origin or ancestry, age, marital status, sexualorientation, gender identity, gender expression, disability, or Vietnam-era veteran statusin employment, educational programs and activities, and admissions. Inquiries or complaintsmay be addressed to <strong>the</strong> Senior Director for <strong>Institution</strong>al Equity and TitleIX/Section 504 Coordinator, Office <strong>of</strong> <strong>Institution</strong>al Equity, 2072 AdministrativeServices Building, Ann Arbor, Michigan 48109-1432, 734-763-0235, TTY 734-647-1388. For o<strong>the</strong>r University <strong>of</strong> Michigan information call 734-764-1817.