Commissioner's response to the report of the Central Vigilance ...
Commissioner's response to the report of the Central Vigilance ...
Commissioner's response to the report of the Central Vigilance ...

You also want an ePaper? Increase the reach of your titles
YUMPU automatically turns print PDFs into web optimized ePapers that Google loves.
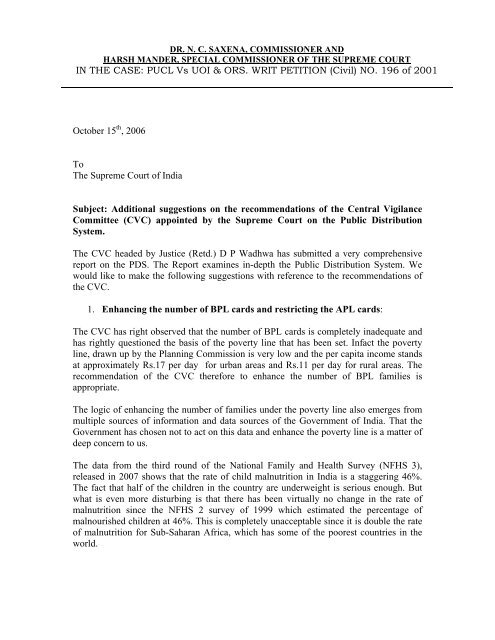
DR. N. C. SAXENA, COMMISSIONER ANDHARSH MANDER, SPECIAL COMMISSIONER OF THE SUPREME COURTIN THE CASE: PUCL Vs UOI & ORS. WRIT PETITION (Civil) NO. 196 <strong>of</strong> 2001Oc<strong>to</strong>ber 15 th , 2006ToThe Supreme Court <strong>of</strong> IndiaSubject: Additional suggestions on <strong>the</strong> recommendations <strong>of</strong> <strong>the</strong> <strong>Central</strong> <strong>Vigilance</strong>Committee (CVC) appointed by <strong>the</strong> Supreme Court on <strong>the</strong> Public DistributionSystem.The CVC headed by Justice (Retd.) D P Wadhwa has submitted a very comprehensive<strong>report</strong> on <strong>the</strong> PDS. The Report examines in-depth <strong>the</strong> Public Distribution System. Wewould like <strong>to</strong> make <strong>the</strong> following suggestions with reference <strong>to</strong> <strong>the</strong> recommendations <strong>of</strong><strong>the</strong> CVC.1. Enhancing <strong>the</strong> number <strong>of</strong> BPL cards and restricting <strong>the</strong> APL cards:The CVC has right observed that <strong>the</strong> number <strong>of</strong> BPL cards is completely inadequate andhas rightly questioned <strong>the</strong> basis <strong>of</strong> <strong>the</strong> poverty line that has been set. Infact <strong>the</strong> povertyline, drawn up by <strong>the</strong> Planning Commission is very low and <strong>the</strong> per capita income standsat approximately Rs.17 per day for urban areas and Rs.11 per day for rural areas. Therecommendation <strong>of</strong> <strong>the</strong> CVC <strong>the</strong>refore <strong>to</strong> enhance <strong>the</strong> number <strong>of</strong> BPL families isappropriate.The logic <strong>of</strong> enhancing <strong>the</strong> number <strong>of</strong> families under <strong>the</strong> poverty line also emerges frommultiple sources <strong>of</strong> information and data sources <strong>of</strong> <strong>the</strong> Government <strong>of</strong> India. That <strong>the</strong>Government has chosen not <strong>to</strong> act on this data and enhance <strong>the</strong> poverty line is a matter <strong>of</strong>deep concern <strong>to</strong> us.The data from <strong>the</strong> third round <strong>of</strong> <strong>the</strong> National Family and Health Survey (NFHS 3),released in 2007 shows that <strong>the</strong> rate <strong>of</strong> child malnutrition in India is a staggering 46%.The fact that half <strong>of</strong> <strong>the</strong> children in <strong>the</strong> country are underweight is serious enough. Butwhat is even more disturbing is that <strong>the</strong>re has been virtually no change in <strong>the</strong> rate <strong>of</strong>malnutrition since <strong>the</strong> NFHS 2 survey <strong>of</strong> 1999 which estimated <strong>the</strong> percentage <strong>of</strong>malnourished children at 46%. This is completely unacceptable since it is double <strong>the</strong> rate<strong>of</strong> malnutrition for Sub-Saharan Africa, which has some <strong>of</strong> <strong>the</strong> poorest countries in <strong>the</strong>world.
Absolute Weights – A 25 year trend (Mean in Kg)Rural Rural Rural NCHS Median1977 1996 2003 ValuesAge F M F M F M F M01+ 7.5 8.1 8.1 8.7 8.1 8.6 9.5 10.25 13.7 14.1 13.6 14.4 14.1 14.6 17.7 18.710 22.0 21.6 22.4 22.6 23.1 23.1 32.5 31.420-24 42.9 48.1 43.5 50.3 43.8 50.9 56.6 68.9>70** - - 39.1 47.3 41.5 49.2Source:** Quoted by Arvind Wadhwa et al, from NNMB 1990-91.I. National Nutrition Moni<strong>to</strong>ring Bureau Report, 1977II. National Nutrition Moni<strong>to</strong>ring Bureau Report, 1996, 2002III. WHO, 1983, Quoted by Hanumanth Rao & Vijayaraghavan, 1996.An age wise distribution <strong>of</strong> Absolute weights for <strong>the</strong> population as compared <strong>to</strong> <strong>the</strong>International norms (NCHS Median Values) shows that for every age group <strong>the</strong> weight ismuch lesser than <strong>the</strong> international norms. At <strong>the</strong> age <strong>of</strong> on, male children in India are 1.4kg than <strong>the</strong> interntional norm and girl children are less 1.6 kgs less than <strong>the</strong> intenationalnorm. This increases <strong>to</strong> 3.6 kg and 4.1 kg respectively for boys and girls by <strong>the</strong> age <strong>of</strong>five. In <strong>the</strong> age group <strong>of</strong> 20-24 <strong>the</strong> difference in weight <strong>of</strong> Indian adult males ascompared <strong>to</strong> <strong>the</strong> international average is 12.8 kgs and it is 18 kgs for women.This represents a situation <strong>of</strong> alarming proportions since <strong>the</strong> difference with regard <strong>to</strong> <strong>the</strong>international standards is so high.This trend is evident for heights as well. While it is well known that weights represent arobust indic<strong>to</strong>r <strong>of</strong> nutritional status, it is now scientifically established that heights alsorepresent nutritional status similarly. The table below shows us that <strong>the</strong> difference inheights, as compared <strong>to</strong> <strong>the</strong> international standards has also remained largely unchangedover <strong>the</strong> decades. From a difference <strong>of</strong> 5.9 cms for male children and 6.7 cm for girlchildren, at <strong>the</strong> age <strong>of</strong> five, <strong>the</strong> difference in heights <strong>of</strong> <strong>the</strong> Indian population as compared<strong>to</strong> <strong>the</strong> International standard by <strong>the</strong> time <strong>the</strong>y reach adult hood becomes 15.2 cms foradult males 13.5 cm for adult females.These figure show that <strong>the</strong> average Indian population is not only underweight but alsostunted and that <strong>the</strong>re has been no significant increase in <strong>the</strong> weights or <strong>the</strong> heights <strong>of</strong> <strong>the</strong>Indian population over a period <strong>of</strong> time.
Absolute Heights – A 25 year trend (Mean in cm)Rural – 1977 Rural-1996 Rural-2002 NCHS MedianValuesI II III IVAge F M F M F M F M01+ 71.9 73.1 72.8 75.0 73.8 75.3 74.3 76.105+ 99.6 100.5 100.4 102.1 102.5 103.2 108.4 109.910+ 125.7 125.1 126.8 127.9 128.5 128.7 138.3 137.520-24 151.2 163.4 151.5 164.0 151.1 163.3 163.7 176.8>=60 147.9 162.3 147.9 161.0 146.8 160.0 - -Source:NNMB Reports, 1977, 1996, 2002The most robust indica<strong>to</strong>r <strong>of</strong> nutritional status, according <strong>to</strong> nutritionists <strong>to</strong>day is <strong>the</strong>Body Mass Index (BMI). Any individual with a BMI <strong>of</strong> less than 18.5 is considered <strong>to</strong>have Chronic Energy Deficiency and <strong>the</strong>refore alnourished.If we this <strong>to</strong> calculate <strong>the</strong> Body Mass Index (BMI) <strong>of</strong> <strong>the</strong> Indian Population, and take a 20year trend analysis, we would find that nearly 40% <strong>of</strong> <strong>the</strong> adult population in <strong>the</strong> countryhave a BMI <strong>of</strong> less than 18.5. The World Health Organisation classifies such a situationas alarming.% DISTRIBUTION OF ADULTS ACCORDING TO BMICLASSIFICATION 20 YEAR TRENDBMI 1974-79 * 1988-90 * 1996-97 ** 1993-94 *** 2002*CLASSES (RURAL) (RURAL) (RURAL) (URBAN) (RURAL)=25M 2.3 2.7 4.1 5.5 6.2* NNMB, 1991, quoted by N,Nadamuni Naidu et al, 1994.* Rural, 2002** NNMB, Rural surveys, 1996; *** NNMB Urban Surveys, 1994
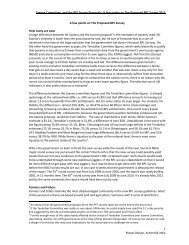
We are also enclosing <strong>the</strong> figures for states where <strong>the</strong> prevalence <strong>of</strong> anemia amongpregnant women and children is more than 70%. This is <strong>the</strong> data from NFHS 3.Prevalence <strong>of</strong> anaemia among pregnant womenand children(States with anaemia levels more than 70% among children)100806040200Children age 6-35 months w ho are anaemic (%)Pregnant w omen age 15-49 w ho are anaemic (%)Source: NFHS-3(2005-06), IIPS, Ministry <strong>of</strong> Health and Family Welfare, GoI.It is important <strong>to</strong> reflect on <strong>the</strong> reasons for this situation and correlate it with <strong>the</strong> decliningconsumption and availability <strong>of</strong> food grains in <strong>the</strong> country. The paper by Pr<strong>of</strong>. UtsaPatnaik which we are annexing with this <strong>report</strong> shows <strong>the</strong> clearly declining trends onconsumption and availability <strong>of</strong> foodgrains that has led <strong>to</strong> this situation.The first graph below shows that overall food grain production in India has kept pacewith <strong>the</strong> growth in population after <strong>the</strong> 1960’s. The growth in GDP has outpaced both <strong>the</strong>foodgrain production and <strong>the</strong> growth in population.1400Population, GDP and Foodgrain Production1200100080060040020001951 1961 1971 1981 1991 2001 2006PopulationGDPFoodgrainProduction
Yet when we examine <strong>the</strong> per capita availability <strong>of</strong> foodgrains in <strong>the</strong> country, we see aclearly declining trend.Per capita foodgrain avialability per day in gms500480460440420400196619681970197219741976197819801982198419861988199019921994199619982000200220042006The steepest decline in availability <strong>of</strong> foodgrains, in recent years is from 1997.This is <strong>the</strong>year when Government <strong>of</strong> India moved from a universal Public Distribution Systemwhen food grains were available at subsidised rates for <strong>the</strong> entire population <strong>to</strong> a system<strong>of</strong> targeting it <strong>to</strong> a BPL population based on <strong>the</strong> poverty line drawn up by <strong>the</strong> PlanningCommission. There has been a reversal <strong>of</strong> this trend marginally now with <strong>the</strong> focus onfood schemes that has been brought about because <strong>of</strong> <strong>the</strong> PUCL case and <strong>the</strong> subsequentmoni<strong>to</strong>ring by <strong>the</strong> Supreme Court. The Government <strong>of</strong> India acknowledged this gap inavailability <strong>of</strong> food grains with <strong>the</strong> reduced <strong>of</strong>ftake from <strong>the</strong> PDS in <strong>the</strong> Long Term GrainPolicy Report (Abhijit Sen Committee Report) way back in 2001. The graph reproducedbelow, from <strong>the</strong> Long Term Grain Policy Report, shows <strong>the</strong> stark reduction in <strong>the</strong> <strong>of</strong>ftakeand availability <strong>of</strong> grain from <strong>the</strong> PDS after 1997, when it was targeted.
If we look at <strong>the</strong> trend state-wise on <strong>the</strong> decline for both rural and urban areas as we haveexamined in <strong>the</strong> table below we find that this trend is across States and holds true both forrural and for urban areas.Changes in average per capita cereal consumption in physical terms over <strong>the</strong> lastdecade in <strong>the</strong> major StatesYearRURALMonthly per capita cereal consumption (kg.) inAP ASM BHR* GUJ HAR KTK KRL MP#1993-94 13.3 13.2 14.3 10.7 12.9 13.2 10.1 14.21999-2000 12.65 12.63 13.75 10.19 11.37 11.53 9.89 12.942004-05 12.07 13.04 13.08 10.07 10.66 10.73 9.53 12.16MAH ORS PUN RAJ TN UP^ WB IND1993-94 11.4 15.9 10.8 14.9 11.7 13.9 15.0 13.41999-2000 11.32 15.09 10.58 14.19 10.66 13.62 13.59 12.722004-05 10.50 13.98 9.92 12.68 10.89 12.87 13.18 12.12YearURBANMonthly per capita cereal consumption (kg.) inAP ASM BHR* GUJ HAR KTK KRL MP#1993-94 11.3 12.1 12.8 9.0 10.5 10.9 9.5 11.31999-2000 10.94 12.26 12.70 8.49 9.36 10.21 9.25 11.092004-05 10.51 11.92 12.21 8.29 9.15 9.71 8.83 10.63MAH ORS PUN RAJ TN UP^ WB IND1993-94 9.4 13.4 9.0 11.5 10.1 11.1 11.6 10.61999-2000 9.35 14.51 9.21 11.56 9.65 10.79 11.17 10.422004-05 8.39 13.11 9.01 10.84 9.48 10.94 10.39 9.94* includes Jharkhand # includes Chhattisgarh ^ includes UttaranchalWe now move <strong>to</strong> <strong>the</strong> final details for <strong>the</strong> basis <strong>of</strong> <strong>the</strong> fixation <strong>of</strong> <strong>the</strong> poverty line. As wehave shown in <strong>the</strong> analysis using multiple source <strong>of</strong> <strong>of</strong>ficial data, <strong>the</strong>re is a drastic declinein <strong>the</strong> availability and consumption <strong>of</strong> foodgrains over <strong>the</strong> years and this is directly linked<strong>to</strong> <strong>the</strong> foodgrain availability through <strong>the</strong> Public Distribution System.In order <strong>to</strong> look a <strong>the</strong> level at which <strong>the</strong> poverty line should be fixed, we will examine <strong>the</strong><strong>the</strong> monthly per capita expenditure data for rural and urban areas and suggest <strong>the</strong> level atwhich <strong>the</strong> poverty line could be fixed.The MPCE data <strong>of</strong> <strong>the</strong> Government <strong>of</strong> India (for urban areas) given in <strong>the</strong> table showsthat
current MPCE data <strong>of</strong> <strong>the</strong> Governmen<strong>to</strong>f India shows that <strong>the</strong> current level <strong>of</strong>Rs.500 per person per month (which is<strong>the</strong> poverty line for urban areas asdefined by <strong>the</strong> Planning Commission)and corresponds <strong>to</strong> roughly 20% <strong>of</strong> <strong>the</strong>population.We are <strong>of</strong> <strong>the</strong> view that this should beincreased <strong>to</strong> <strong>the</strong> MPC.E band <strong>of</strong>Rs.915 – Rs.1120 for urban areas. Thiswould comprehensively cover all <strong>the</strong>urban poor. This would roughly cover72% <strong>of</strong> <strong>the</strong> population.Since <strong>the</strong> same argument holds true for<strong>the</strong> rural areas, <strong>the</strong> Honorable Courtmay consider enhancing <strong>the</strong> MPCElimit for identification <strong>of</strong> <strong>the</strong> rural poor<strong>to</strong> Rs.525 – 615 for rural areas. Thiswould also roughly cover around 72% <strong>of</strong> <strong>the</strong> urban population.The details <strong>of</strong> <strong>the</strong> MPCE categories are given in <strong>the</strong> table below:Monthly per capita expenditure (MPCE)Monthly per capita expenditureRural(MPCE)UrbanMPCE no. <strong>of</strong> persons per av. hhMPCE no. <strong>of</strong> av. hhclass 1000sizeclass persons/1000 size0-225 24 6.19 0-300 20 6.05225-255 27 6.65 300-350 30 6.48255-300 64 6.01 350-425 64 6.05300-340 83 5.98 425-500 69 5.72340-380 96 5.85 500-575 91 5.58380-420 96 5.66 575-665 85 5.36420-470 108 5.5 665-775 117 5.31470-525 100 5.29 775-915 103 4.96525-615 122 4.93 915-1120 123 4.28615-775 126 4.56 1120- 123 3.861500775-950 67 4.39 1500- 70 3.41925950+ 88 3.9 1925+ 106 2.87Allclasses1000 5.08 Allclasses1000 4.43
The fixation <strong>of</strong> <strong>the</strong> poverty line for <strong>the</strong> purposes <strong>of</strong> identifying <strong>the</strong> poor at 72% forurban areas and 70% for rural areas would not only realistically cover all <strong>the</strong> poorwhom <strong>the</strong> PDS is meant <strong>to</strong> serve but would also be in line with <strong>the</strong> recommendationmade by <strong>the</strong> CVC on <strong>the</strong> APL category.2. Eligibility for An<strong>to</strong>daya Card Holders for Urban Areas:The Honorable Supreme Court in its interim order <strong>of</strong> 2 nd May 2003, <strong>the</strong> Supreme Courtdeliberated on <strong>the</strong> An<strong>to</strong>daya Anna Yojana (AAY) and directed <strong>the</strong> Government <strong>of</strong> Indiadirected “<strong>to</strong> place on AAY category <strong>the</strong> following groups <strong>of</strong> persons:(1) Aged, infirm, disabled, destitute men and women, pregnant and lactating women,destitute women;(2) widows and o<strong>the</strong>r single women with no regular support;(3) old persons (aged 60 or above) with no regular support and no assured means<strong>of</strong> subsistence;(4) households with a disabled adult and assured means <strong>of</strong> subsistence;(5) households where due <strong>to</strong> old age, lack <strong>of</strong> physical or mental fitness, socialcus<strong>to</strong>ms, need <strong>to</strong> care for a disabled, or o<strong>the</strong>r reasons, no adult member isavailable <strong>to</strong> engage in gainful employment outside <strong>the</strong> house;(6) primitive tribes.”Since <strong>the</strong> category <strong>of</strong> “primitive tribes” is relevant largely for rural areas, we wouldrequest <strong>the</strong> Honorable Court <strong>to</strong> consider urban homeless people instead <strong>of</strong> “primitivetribes” for <strong>the</strong> AAY card. The direction <strong>to</strong> Government <strong>of</strong> India could thus be <strong>to</strong> incWe would submit that for urban areas, <strong>the</strong> Government <strong>of</strong> India may be directed <strong>to</strong> placeon AAY category <strong>the</strong> following groups <strong>of</strong> persons:(1) Aged, infirm, disabled, destitute men and women, pregnant and lactating women,destitute women;(2) widows and o<strong>the</strong>r single women with no regular support;(3) old persons (aged 60 or above) with no regular support and no assured means<strong>of</strong> subsistence;
(4) households with a disabled adult and assured means <strong>of</strong> subsistence;(5) households where due <strong>to</strong> old age, lack <strong>of</strong> physical or mental fitness, socialcus<strong>to</strong>ms, need <strong>to</strong> care for a disabled, or o<strong>the</strong>r reasons, no adult member isavailable <strong>to</strong> engage in gainful employment outside <strong>the</strong> house;(6) Urban Homeless.The finding <strong>of</strong> <strong>the</strong> CVC on <strong>the</strong>re being a large number <strong>of</strong> inclusion and exclusion errorsin <strong>the</strong> provision <strong>of</strong> BPL and AAY cards and <strong>the</strong> existence <strong>of</strong> a large number <strong>of</strong> bogusration cards is fur<strong>the</strong>r reinforced by <strong>the</strong> recently released data from <strong>the</strong> latest (61 st ) round<strong>of</strong> <strong>the</strong> National Sample Survey Organisation (NSSO) <strong>of</strong> <strong>the</strong> Government <strong>of</strong> India. Thisshows almost a fourth <strong>of</strong> <strong>the</strong> poorest families in <strong>the</strong> country do not have any access <strong>to</strong> anyration card. On <strong>the</strong> o<strong>the</strong>r hand 87.5% <strong>of</strong> <strong>the</strong> richest quintile <strong>of</strong> <strong>the</strong> population have access<strong>to</strong> ration cards. What is even more alarming that is that 16.8 % <strong>of</strong> <strong>the</strong> richest quintile hasBPL cards whereas only 49 % <strong>of</strong> <strong>the</strong> poorest families in <strong>the</strong> country have ei<strong>the</strong>r BPL orAn<strong>to</strong>daya cards, whereas 100% <strong>of</strong> <strong>the</strong> poorest quintile should have had access <strong>to</strong>An<strong>to</strong>daya cards. Similarly only 43 % <strong>of</strong> <strong>the</strong> next poorest quintile have access <strong>to</strong> BPL andAn<strong>to</strong>daya cards.Table 4.2% <strong>of</strong> HH that possess ration card 2004/05 (NSSO 61st round)Any card BPL card APL card AAY cardPoorest 77.3 44.2 28.2 4.9Q2 81.6 40.5 38.4 2.7Q3 83.3 40 41.6 1.8Q4 84.9 30.5 52.7 1.7Richest 87.5 16.8 70.1 0.6While for most rural areas, BPL census surveys have been carried out from time <strong>to</strong> time,we have found no systematic attempt <strong>to</strong> do so for urban areas. Government <strong>of</strong> India may<strong>the</strong>refore be directed <strong>to</strong> design and develop a comprehensive census survey for <strong>the</strong>identification <strong>of</strong> <strong>the</strong> urban poor in consultation with <strong>the</strong> Supreme Court Commissioners,as has been done for rural areas. This would be necessary <strong>to</strong> eliminate <strong>the</strong> bogus cards, assuggested by <strong>the</strong> CVC and also ensure that <strong>the</strong> food grains meant for <strong>the</strong> poor actuallyreach <strong>the</strong>m.3. Replacing wheat being supplied in <strong>the</strong> PDS with micro-nutrient fortifiedwheat flour (Atta):
The CVC has recommended <strong>the</strong> introduction <strong>of</strong> micro-nutrient fortified wheat flour (atta)in <strong>the</strong> Public Distribution System instead <strong>of</strong> wheat as ano<strong>the</strong>r option. We sought <strong>the</strong>opinion <strong>of</strong> <strong>the</strong> National Institute <strong>of</strong> Nutrition (NIN), Hyderabad on this issue. NIN is <strong>the</strong>premier Nutrition institution <strong>of</strong> <strong>the</strong> Government <strong>of</strong> India and is a part <strong>of</strong> <strong>the</strong> IndianCouncil <strong>of</strong> Medical Research (ICMR) on <strong>the</strong> advisability <strong>of</strong> this measure based oncurrent scientific and medical evidence, since fortification has for long been a contentiousissue in scientific and medical circles. We had requested NIN <strong>to</strong> provide us with <strong>the</strong>international evidence from scientific studies on this.The summary <strong>of</strong> <strong>the</strong> <strong>response</strong>, <strong>of</strong> <strong>the</strong> National Institute <strong>of</strong> Nutrition, vide <strong>the</strong>ir letter, RefNo: VS/NIN/2007 dated Oc<strong>to</strong>ber 1 st , 2007) is, inter alia, as follows:1. Wheat flour consumed in India, which would be provided through <strong>the</strong> PDS wouldbe whole wheat Atta. Unless this is vacuum packed it will lead <strong>to</strong> rancidisationdue <strong>to</strong> <strong>the</strong> oxidisation <strong>of</strong> essential fatty acids and will <strong>the</strong>refore have a shelf life <strong>of</strong>even less than a month (depending on <strong>the</strong> humidity, temperature, s<strong>to</strong>ragecondition etc.). It may <strong>the</strong>refore not be feasible or cost effective <strong>to</strong> ensure quality<strong>of</strong> <strong>the</strong> wheat flour in India.2. India already has a National Anemia Prophylaxis Programme which provides Ironand Folic Acid <strong>to</strong> pregnant and lactating mo<strong>the</strong>rs and children. The dosage <strong>of</strong>Ironsupplementation in this programme is between 60 – 120 mg. This is amongst <strong>the</strong>highest dosages in <strong>the</strong> world and adding <strong>to</strong> <strong>the</strong> dosage consumed would lead <strong>to</strong>iron <strong>to</strong>xicity.3. Wheat flour consumed in India has a higher fibre content because <strong>of</strong> which <strong>the</strong>content <strong>of</strong> phytate is also higher than <strong>the</strong> wheat flour consumed in developedcountries. Phytates reduce <strong>the</strong> bio-availability <strong>of</strong> iron and inhibit <strong>the</strong>ir absorption<strong>of</strong> iron in <strong>the</strong> body. Therefore fur<strong>the</strong>r fortification may not be beneficial.4. Lab studies have shown that <strong>the</strong> oxidative stress caused by increasing <strong>the</strong> dosage<strong>of</strong> Iron in <strong>the</strong> body may lead <strong>to</strong> damage <strong>of</strong> <strong>the</strong> epi<strong>the</strong>lial cells in <strong>the</strong> intestine. Ironsupplementation in countries like China have <strong>the</strong>refore been reduced <strong>to</strong> once infive days based on this growing body <strong>of</strong> evidence.Our experience with <strong>the</strong> o<strong>the</strong>r food schemes <strong>of</strong> <strong>the</strong> Government <strong>of</strong> India which havebeen moni<strong>to</strong>red as part <strong>of</strong> <strong>the</strong> mandate in this petition has shown that <strong>the</strong> involvemen<strong>to</strong>f <strong>the</strong> private sec<strong>to</strong>r and especially with regard <strong>to</strong> centralised systems for food grainsleads <strong>to</strong> large scale corruption. The interim order <strong>of</strong> Oc<strong>to</strong>ber 7 th , 2004 by <strong>the</strong>Honorable Supreme Court banning contrac<strong>to</strong>rs in <strong>the</strong> ICDS and putting in place adecentralised system using SHGs/ Mahila Mandals etc. has had a far reaching impactin reducing centralised corruption. We apprehend that if private millers are brought inlarge numbers for centralised milling, it will lead <strong>to</strong> <strong>the</strong> same set <strong>of</strong> problems. Thecollusion <strong>of</strong> rice millers (for milling <strong>of</strong> paddy <strong>to</strong> rice) and agencies like <strong>the</strong> State FoodCorporations and <strong>the</strong> Food Corporation <strong>of</strong> India is well documented and has been <strong>the</strong>finding <strong>of</strong> many State CAG <strong>report</strong>s.
In our considered opinion <strong>the</strong>refore, and in line with <strong>the</strong> opinion provided by <strong>the</strong> NationalInstitute <strong>of</strong> Nutrition, that it may not be advisable at this stage <strong>to</strong> switch <strong>the</strong> PDS fromwheat <strong>to</strong> fortified wheat flour.Sincerely Yours,Dr. N.C. SaxenaHarsh Mander