Situation analysis - DFID@Stir - University of Stirling
Situation analysis - DFID@Stir - University of Stirling
Situation analysis - DFID@Stir - University of Stirling
- No tags were found...

You also want an ePaper? Increase the reach of your titles
YUMPU automatically turns print PDFs into web optimized ePapers that Google loves.
Working Paper 4August 2002<strong>Situation</strong> <strong>analysis</strong>Production systems and natural resourcemanagement in PU KolkataInstitute <strong>of</strong> Aquaculture<strong>University</strong> <strong>of</strong> <strong>Stirling</strong><strong>Stirling</strong> FK9 4LAScotland
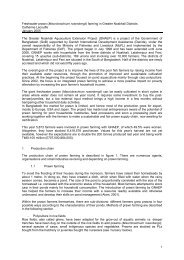
Bunting, S.W., Kundu, N. and Mukherjee, M., 2002. <strong>Situation</strong> <strong>analysis</strong> <strong>of</strong> production systems and naturalresource use in PU Kolkata. <strong>Stirling</strong>, UK: Institute <strong>of</strong> Aquaculture [Working Paper]For further information please contact the project team leader:Dr Stuart BuntingInstitute <strong>of</strong> Aquaculture, <strong>University</strong> <strong>of</strong> <strong>Stirling</strong>, <strong>Stirling</strong> FK9 4LA, ScotlandTel: +44 (0)1786 456573, Fax: +44 (0)1786 451462or visit the project website at: http://www.dfid.stir.ac.uk/dfid/nrsp/kolkata.htm© The authors retain the copyright to materials presented in this reportDisclaimer: This publication is an output from a project funded by the UK Department for InternationalDevelopment (DFID) for the benefit <strong>of</strong> developing countries. The views expressed are not necessarily those<strong>of</strong> DFID.ii
Executive summary1. The development and evolution <strong>of</strong> farming strategies in PU Kolkata is reviewed,historical events influencing this process are discussed and prevailing geographic andclimatic conditions are presented. Aspects <strong>of</strong> local governance, population growth andurbanisation are also discussed to better describe the social and institutional pressuresthat contributed to the emergence <strong>of</strong> PU farming, and which now threaten its viability.2. The primary objective <strong>of</strong> this survey <strong>of</strong> farm managers was to address gaps in theexisting knowledge base concerning current management practices and arrangements.Knowledge generated concerning general employment practices, labour demands andmarket channels will be used to better focus future project activities, in particularidentifying selected groups <strong>of</strong> the poor for inclusion in focus groups and householdinterviews. Knowledge on constraints facing producers will be used to identify andpromote enhanced PU natural resource management strategies and policy initiativesthat benefit the poor.3. Managers <strong>of</strong> farms producing fish, vegetables or rice, the three main productionsystems in PU Kolkata were selected at random and interviewed employing a pretestedsemi-structure questionnaire. Data collected were summarised and informationfrom secondary sources used to better describe the setting in which PU farming isundertaken, and in particular key emerging constraints that threaten the viability <strong>of</strong>current farming activities.4. Estimates concerning the extent <strong>of</strong> aquaculture in PU Kolkata vary from 2,500 ha toover 3,000 ha, however, individual farms are usually small (
and usually taken on a short-term lease, consequently farmers feel insecure and arereluctant to invest time and money to enhance productivity. Solid organic waste iswidely used to supply nutrients and improve soil quality, however, changing access anddeclining quality have resulted in many farmers using more inorganic fertiliser. Otherproblems noted by vegetable growers included limited access to finance, pricefluctuations, insect pests and the high cost <strong>of</strong> fertiliser and pesticides.8. Unlike ponds managed for aquaculture, separate households manage individualvegetable plots and family members undertake much <strong>of</strong> the cultivating, harvesting andmarketing. During busy periods labourers from local villages may be employed on acasual basis, however, the temporal and uncertain nature <strong>of</strong> this work makes themvulnerable to changing circumstances. Women undertaking horticultural work are <strong>of</strong>tensupporting their family due to the illness, absence or death <strong>of</strong> their spouse, when workis scarce they will usually find employment as rag-pickers.9. Paddy culture is the most widespread agricultural activity in PU Kolkata coveringseveral thousand hectares and extending over 50 km from the city. Selection <strong>of</strong> farmersfor this survey was restricted to the WRR, the majority <strong>of</strong> those interviewed farmedless than 2.6 ha, whilst most farmers owning their own land also cultivated vegetables.Although farmers used rainwater, wastewater and groundwater to irrigate crops,seasonal water shortages were the main concern for producers. Other constraints notedby rice farmers included limited access to finance, insect pests, price fluctuations andseasonal flooding <strong>of</strong> fields.10. Labourers employed mostly in the fisheries and agricultural fields can also findemployment on farms producing rice during the paddy season. Women are commonlyengaged in work relating to paddy culture, usually in post-harvest activities, threshingand drying the grain. Some labourers reportedly travelled several miles to find work onthe paddy farms, staying in temporary accommodation until the end <strong>of</strong> their contracts.11. Constraints common to fish, vegetable and rice farming included changing access towaste resources and a perceived decline in quality, siltation <strong>of</strong> fishponds and canals,uncertain and seasonally variable water supplies, insecure tenure and limited access t<strong>of</strong>inance. Although <strong>of</strong> only moderate concern to most farmers, insect pests and diseasesproblems were widespread, and when unsure farmers take advice from neighbours andshopkeepers, potentially leading to mis-diagnosis, resulting in more severe problemsand money wasted on inappropriate treatments.12. Possible outcomes <strong>of</strong> planned development projects appear to constitute importantemerging threats to PU farming, whilst possible health risks associated with reusingwaste resources to produce food and possible changes in consumer perceptionconstitute serious concerns requiring further assessment. It was considered important tohighlight these issues as PU farmers and communities are <strong>of</strong>ten poorly positioned tocope with or manage unforeseen problems.13. Outcomes from this work will be used to guide the planned focus group and householdinterviews with poor people whose livelihoods depend either directly or indirectly onPU farming. Knowledge generated regarding the most significant constraints to PUfarming will be disseminated to local government departments, development agenciesand stakeholder groups to assist them in formulating PU natural resource managementstrategies and policies that safeguard and enhance these systems and benefit the poor.iv
GlossaryAcronyms and Bengali termsADBAsian Development Bankalasmall brick built house in the fisheries used by accounts managers and cooksaratdarslocal term for auctioneersbargasystem <strong>of</strong> community managementbargadarsregistered share cropperbankyoke for fish seed carriersBDPBasic Development PlanbheriBengali name for commercial pond-based fish farmbighaunit <strong>of</strong> land measurement (7.5 bigha = 1 ha)BLLROBlock Land and Land Reforms Officeblocksecond smallest administrative unit in India, may cover one to ten mouza, there are343 blocks in West BengalcattahBengali measure <strong>of</strong> area (20 cattah = 1 bigha)CBOCommunity-based OrganisationCEIPCalcutta Environmental Improvement Project (ADB-DFID funded)CEMSAPCalcutta Environmental Management Strategy and Action PlanCICFRICentral Inland Capture Fisheries Research InstituteCITCalcutta Improvement TrustCITUCommunist Party <strong>of</strong> India Trade UnionCLCCalcutta Leather ComplexCMPOCalcutta Metropolitan Planning OrganisationCMACalcutta Metropolitan AreaCMCCalcutta Metropolitan CorporationCMDACalcutta Metropolitan District AuthorityCMWSACalcutta Metropolitan Water and Sanitation Authoritycrore Bengali expression for one hundred million (100,000,000)CUSPCalcutta Urban Services for the Poor (DFID funded)dadanBengali expression for financial/credit advanceDFIDDepartment for International Development (UK Government)DLLRODistrict Land and Land Reforms OfficeDoFDepartment <strong>of</strong> Fisheries (now Department <strong>of</strong> Fisheries, Aquaculture, AquaticResources, and Fishing Harbours), GoWBDoEFDepartment <strong>of</strong> Environment and Forests, GoWBDoIWDepartment <strong>of</strong> Irrigation and Waterways, GoWBDurga PujaAutumn festival for HindusDWFDry Weather FlowECWEast Calcutta WetlandsEMBEastern Metropolitan BypassEUSEpizootic Ulcerative SyndromeGAPGanga Action Planghatriver jetty or steps down to a fishpondGNSGantantrik Nagarik Samiti - Democratic Citizens Society (NGO)GoIGovernment <strong>of</strong> Indiagoldarslocal Bengali term for agents trading fish seedGoWBGovernment <strong>of</strong> West BengalGram Panchayat elected local municipal body covering 10-15 villageshatlocal Bengali term for marketHIDCOHousing and Industrial Development CorporationIMCIndian Major CarpIWMEDInstitute <strong>of</strong> Wetland Management and Ecological Designjheelsmall pond
LUDCPLURMmaundmouzaNEDECONGONRDODApaikerspata bonapattapisciculturePolice StationPRAPSPUPUIPUBLICraiyatarupee (Rs)SCSDLLROSFDCSLMCSTSWFtankVWSCWBWBIDCOWBSHBWBSPBWBSPCBWRRWWF-IndiazaminderZilla ParishadLand Use Development and Control PlanLand Use Registry MapBengali unit <strong>of</strong> weight (1 maund = 37.3 kg)smallest administrative unit in India, may cover one to ten villagesNetherlands Engineering ConsultantsNon-government OrganisationNational River DirectorateOverseas Development Administration (now DFID)local Bengali term for ‘contract carriers’ who transport fish from bheries toauction marketshandicraft involving weaving <strong>of</strong> palm leavestilling right given to a sharecropper, a licence to tilllocal phrase for fish cultureThana or area <strong>of</strong> jurisdictionParticipatory Rural AppraisalProduction SystemPeri-UrbanPeri-Urban InterfacePeople United for Better Living in Calcutta (NGO)the right to sell land, although government retains ownershipIndian currency (£1 = ~Rs70)Scheduled CasteSub-Divisional Land and Land Reforms OfficeState Fisheries Development CorporationSalt Lake Municipal CorporationScheduled TribeStorm Water Flowlocal term for small pondVillage Water and Sanitation CommitteeWorld BankWest Bengal Industrial Development CorporationWest Bengal State Housing BoardWest Bengal State Planning BoardWest Bengal State Pollution Control BoardWaste Recycling RegionWorld Wide Fund for nature - Indian Branchfeudal land ownerelected local municipal body governing ~10 Gram Panchayatsvi
ContentsSection Heading PageExecutive SummaryGlossaryContentsTablesFiguresBoxesiiivviiixxx1 Introducing Kolkata, an Indian mega-city 11.1 Geography and geology 21.2 Climate 31.3 Growth and development <strong>of</strong> erstwhile Kolkata 41.4 Demographics 51.5 Governance in the CMC and CMA and the Waste Recycling Region 71.6 Summary 82 Survey objective and method 103 Origins and recent history <strong>of</strong> production in PU Kolkata 124 PU aquaculture 164.1 Scale and distribution 164.2 Management pattern 174.3 Water source 204.4 Species cultured 234.5 Fish seed and supply chains 244.6 Feed and fertiliser application 264.7 Integrated production 274.8 Disease and pest problems 274.9 Chemical applications 284.10 Labour arrangements and unions 284.11 Employee livelihoods 304.12 Finance 314.13 Constraints 315 PU horticulture 345.1 Scale and distribution 345.2 Management pattern 355.3 Solid organic waste application 355.4 Irrigation strategy 365.5 Crop varieties cultivated 385.6 Seed supply 385.7 Fertiliser use and application 385.8 Pest and disease problems 395.9 Pesticide use and application 395.10 Labour, livelihoods and gender 395.11 Finance 405.12 Constraints 406 PU paddy farming 436.1 Scale and distribution 436.2 Management pattern 43vii
Contents (cont.)Section Heading Page6.3 Water source and irrigation strategy 446.4 Fertiliser use and application 456.5 Seed supply 456.6 Pest and disease problems and treatment 466.7 Labour, livelihoods and gender 466.8 Finance 466.9 Constraints 477 Summary and emerging issues 497.1 Siltation 497.2 Decreasing access to wastewater and declining quality 517.3 Ongoing and planned development initiatives 517.4 Public health concerns 557.4.1 Epidemiological evidence from fishery workers 557.4.2 Consumer health risks 587.4.3 Safeguarding public, producer and environmental health 587.5 Knowledge dissemination and exploitation 597.6 Future strategy 60References 62Appendix 1 <strong>Situation</strong> <strong>analysis</strong> questionnaire following pre-testing 64Appendix 2 Questionnaire coding system for data interpretation 69viii
TablesTable Heading Page4.1 Frequency distribution for aquaculture operations with respect to size (ha) andlocation 164.2 Frequency distribution <strong>of</strong> aquaculture-based farms with respect to size (ha); figuresin parenthesis indicate farms practicing integrated production 174.3 Management strategies and associated observations for PU aquaculture activities 194.4 Access to wastewater, as perceived by pond managers in PU Kolkata 214.5 Methods employed to deliver wastewater to PU fishponds 224.6 Predominant fish species stocked in PU ponds 234.7 Supply channels employed by managers to acquire fish seed 254.8 Regions from where fish seed are purchased based on responses from farmmanagers (n = 56) 264.9 Primary livelihood strategies associated with PU aquaculture practiced on 56 farms 314.10 Constraints to PU aquaculture based on the perceptions <strong>of</strong> farm managers (n = 56) 325.1 Constraints to PU horticulture based on the perceptions <strong>of</strong> farm managers (n = 33) 416.1 Constraints to PU paddy farming based on perceptions <strong>of</strong> farm managers (n = 22) 487.1 Emerging constraints to the viability <strong>of</strong> farming systems exploiting wastewater inPU Kolkata and potential management strategies 507.2 Epidemiology <strong>of</strong> workers employed in wastewater aquaculture and a controlpopulation 567.3 Prevalence (%) <strong>of</strong> pathogens in stool samples from fishery workers from locationsshown 567.4 Prevalence <strong>of</strong> disease symptoms related to nutritional deficiencies for workers atsites shown 577.5 Prevalence <strong>of</strong> substance abuse amongst fishery workers for sites shown 58ix
FiguresFigure Heading Page1.1 Map showing the location <strong>of</strong> Kolkata in West Bengal, together with other cities inIndia having a tradition <strong>of</strong> Urban Agriculture 21.2 Mean average monthly temperatures (°C) for Kolkata 31.3 Average monthly rainfall (mm) totals for Kolkata 41.4 Map showing the CMA area and location <strong>of</strong> the CMC 61.5 Outline <strong>of</strong> the Waste Recycling Region (WRR) showing different areas <strong>of</strong>agricultural activity 83.1 Water-bodies and tracts <strong>of</strong> agricultural land in PU Kolkata 133.2 Extent <strong>of</strong> brackish-water rice cultivation downstream <strong>of</strong> Kolkata 145.1 Distribution <strong>of</strong> vegetable cultivation practices in the Dhapa region based on usepatterns <strong>of</strong> solid organic waste and wastewater 377.1 Outline plan for Rajarhat covering an area <strong>of</strong> 2,750 ha and bordering the northernboundary <strong>of</strong> the WRR 53BoxesBox Heading Page1 Evolution <strong>of</strong> horticulture and aquaculture in PU Kolkata 122 Land reform in West Bengal 183 Code <strong>of</strong> Conduct agreed between unions and fish producers 29x
1. Introducing Kolkata 1 , an Indian mega-cityIt is widely acknowledged that many <strong>of</strong> India’s mega-cities are still subject to the processesand pressures <strong>of</strong> urbanisation, driven by rapid population growth, liberalisation,privatisation and rural-urban migration. However, in many cases, lessons from past failuresin planning and managing urban growth elsewhere have largely been ignored. Althoughurban centres constitute the economic backbone <strong>of</strong> the country, problems associated withrapid population concentration are widespread in many recently urbanised centres,including mass unemployment, illiteracy, slums, congestion, encroachment <strong>of</strong> publicspace, water and air pollution and deteriorating infrastructure and services.According to the 2001 census, around 285 million or ~28% <strong>of</strong> the Indian population live inurban areas, with 38% <strong>of</strong> the urban population residing in only 38 agglomerations. In 1991the census revealed that 217 million people, constituting ~26% <strong>of</strong> the total population livedin urban areas. These data help illustrate the level <strong>of</strong> growth <strong>of</strong> urban centres in India,although it should be noted that the actual proportion <strong>of</strong> the population living in urbanareas only showed a 2% increase. Some economists have suggested that as centres <strong>of</strong> tradeand commerce, urban areas would account for a significant proportion <strong>of</strong> GNP growth inIndia, however, the actual situation appears markedly different, with only moderate GNPgrowth being attributed to urban areas. Despite this it has <strong>of</strong>ten been demonstrated thaturbanisation is an important driving factor in a county’s economic development.With greater populations concentrated in urban areas, demand for food and the need todevelop effective supply and distribution channels <strong>of</strong>ten increases. One approach thatcontributes to the increased efficiency <strong>of</strong> food supply is to grow it close to the marketplace, reducing transport times and costs. Proximity to urban markets also holds benefitsfor producers. Ready access to large numbers <strong>of</strong> consumers ensures produce always has amarket, whilst the relative wealth <strong>of</strong> urban consumers allows producers to command apremium for fresh, good quality produce, and markets exist for higher cost and valueaddedproducts. However, despite these benefits, farming close to urban areas is <strong>of</strong>tenassociated with problems relating to land tenure, pollution and environmental degradation,competition for natural resources and ineffective local institutions.Based on preliminary investigations (Bunting, Kundu and Mukherjee, 2001) it appears thatthe traditional farming systems which developed in PU Kolkata to service urban marketsare threatened by various processes associated with urbanisation. In this study the physical,economic and social settings are considered, together with the historical background tobetter describe the evolution <strong>of</strong> PU farming practices around Kolkata. The current natureand extent <strong>of</strong> key farming systems is assessed from interviews with farm managers, andoutcomes used to identify important constraints to the specific farming practices. Proposeddevelopment initiatives and emerging constraints identified during this study phase arereviewed and potential negative outcomes and mitigating factors discussed.1 Since project inception Calcutta has <strong>of</strong>ficially been renamed Kolkata, therefore, unless in an historical or<strong>of</strong>ficial context, the new name will be used in subsequent sections and project outputs1
1.1. Geography and geologyPresent day Kolkata is situated in West Bengal; the state adjoins four others, namelyAssam, Bihar, Orissa and Sikkim, and borders Bangladesh, Bhutan and Nepal (Figure 1.1).West Bengal has an area <strong>of</strong> around 1,400 km 2 and a coastline extending to several hundredkilometres, much <strong>of</strong> which is within the Sunderbans mangrove forest, a UNESCO WorldHeritage Site. Kolkata is centred around latitude 22° 34’ N and longitude 88° 24’ E. Thecity is bounded to the west and north-west by the Hooghly River, whilst land to the southand southeast generally slopes away toward the coast and low-lying wetlands. The corearea <strong>of</strong> the city is generally flat with elevations ranging from 1.5 to 9 m above mean sealevel (ADB, 2000a); however, there are some natural depressions in this area, many <strong>of</strong>which are dead river channels.Figure 1.1. Map showing the location <strong>of</strong> Kolkata in West Bengal, together with other cities in India having atradition <strong>of</strong> Urban Agriculture (Source: Yasmeen, 2001)2
Quaternary sediments comprising clay and silt, together with various grades <strong>of</strong> sand andgravel, underlie the city. Above these deposits there is a clay bed which varies in thicknessfrom 10-40 m, whilst below, at depths <strong>of</strong> 250-650 m there is a second clay bed;groundwater found in aquifers between these beds is extracted using tube-wells. To thewest <strong>of</strong> the city soils are classified as entisols (weakly developed soils), whilst to the eastalfisols (forest soils with relatively good native fertility) predominate. The Gangeticalluvium group <strong>of</strong> soils found in the region are rich in calcium, whilst only medium levels<strong>of</strong> organic matter, phosphate and potash are present.1.2. ClimateSituated just north <strong>of</strong> the Tropic <strong>of</strong> Cancer, climate in the region is strongly influenced bythe annual passage <strong>of</strong> the southwest monsoon. The rainy season usually commencesaround mid-June and lasts until mid-September, the winter season follows the rains andlasts until February, whilst March through to mid-June are commonly regarded as thesummer months. Mean maximum and minimum monthly air temperatures for Kolkata arepresented in Figure 1.2 and show that during the summer months, the average maximumdaily temperature ranges from 33-36°C, however, in May maximum daily temperaturesabove 40°C are common. During May there are <strong>of</strong>ten thunderstorms and spells <strong>of</strong> heavyrain, known locally as kalbaishakhi, these downpours bring welcome relief from the highhumidity (70-80%) that prevails at this time. Mean maximum temperatures remain around32°C throughout the rainy season. From October to mid-February the city experiencesgenerally pleasant weather with comparatively low temperature and little rainfall. Januaryis the coolest month, with average minimum temperatures around 13°C.Mean temperature (°C)4035302520151050Jan Feb March April May June July Aug Sept Oct Nov DecMaxMinFigure 1.2. Mean average monthly temperatures (°C) for Kolkata (Source: OnlineWeather, no date)During the monsoon, rainfall is heavy, reaching a peak <strong>of</strong> 328 mm in August (Figure 1.3);with the retreat <strong>of</strong> the monsoon this decreases to around 114 mm in October. The lowestrainfall totals are usually recorded during December, with an average <strong>of</strong> only 5 mmreported. Wind speed throughout the year averages ~7 km h -1 , although occasionallystorms and cyclones bring much higher winds, usually during the rainy season.3
350300Mean rainfall (mm)250200150100500Jan Feb March April May June July Aug Sept Oct Nov DecFigure 1.3. Average monthly rainfall (mm) totals for Kolkata (Source: OnlineWeather, no date)Figure 1.3 demonstrates that rainfall in the region is highly seasonal, consequently accessto wastewater from the city during the dry season constitutes a significant advantage t<strong>of</strong>armers in PU Kolkata. However, where the supply is uncertain or unpredictable this maycause serious problems for producers that depend on wastewater to irrigate vegetable orrice crops or to maintain water levels in fishponds.1.3. Growth and development <strong>of</strong> erstwhile KolkataBased on an historical perspective regarding the establishment and growth <strong>of</strong> Kolkata it ispossible to gain a clearer insight concerning the origins and driving forces underlying thepast and most recent phases <strong>of</strong> urbanisation. Less than three centuries ago, the area aroundKolkata was part <strong>of</strong> a largely rural district in the delta <strong>of</strong> lower Bengal, a flat rice-swampinterspersed with patches <strong>of</strong> jungle and a few scattered villages on the riverbank. In 1690,Job Charnock founded Kolkata, a trading post on the eastern banks <strong>of</strong> the Hooghly Riverthat soon encompassed the villages <strong>of</strong> Sutanuti, Govindapur and Kalikata.Establishment <strong>of</strong> a trading post and garrison by the British provided a stimulus forurbanisation, the prospect <strong>of</strong> employment and commercial opportunities drew manyindigenous people from rural areas. However, it was only in the nineteenth century,following increased interest by the British, that trade was promoted in the region. With thegrowth <strong>of</strong> commerce, attention was given to communications, and railways built totransport goods, people and troops throughout the region. Prior to 1860, the Kolkata portoccupied only a small area <strong>of</strong> the Hoogly, Howrah and 24 Parganas districts on the eastshore <strong>of</strong> the river. These docks served ships exporting raw materials from Bengal, Bihar,Assam and part <strong>of</strong> the northwest provinces.Initially exports from Kolkata to Europe consisted <strong>of</strong> raw materials such as indigo andcotton, and later cash crops such as opium, jute and tea. In 1866-67, jute from West Bengalaccounted for 21.6% <strong>of</strong> India’s export earnings, however, by 1870-71 this had declined to12.4%. The declining importance <strong>of</strong> jute was partly due to growing demand for productssuch as tea from the mountains <strong>of</strong> West Bengal and Assam, and partly due to low pricesowing to overproduction. Good dock facilities were also crucial for importing goods,troops and settlers from Europe. With the advent <strong>of</strong> the industrial revolution in England,demand for coal and iron ore increased greatly and imports from India were used to4
supplement local supplies. The export <strong>of</strong> industrial processes from England to India alsomeant that during the 19 th century, factories and mills began to produce greater volumes <strong>of</strong>processed and finished products for export to Britain, Europe and America. Due to theimportance <strong>of</strong> trade and commerce, planning and development <strong>of</strong> port and harbourfacilities was directly under the control <strong>of</strong> the government. Starting in 1860, plans, projectsand ‘commissions <strong>of</strong> enquiry’ were all focused on the expansion <strong>of</strong> the port facilities.From the historical account presented above it is apparent that the origins <strong>of</strong> bothurbanisation and industrialisation in Kolkata may largely be attributed to the presence <strong>of</strong>British settlers. However, the growth pattern <strong>of</strong> modern-day Kolkata has largely beendictated by political, and more recently, since the introduction <strong>of</strong> the New EconomicPolicy (1991/92), economic objectives. Industrial growth is now widely regarded as acentral tenet in the economic development <strong>of</strong> West Bengal, indeed following the adoption<strong>of</strong> the New Economic Policy average annual industrial growth almost doubled to 5%, ascompared with average growth over the previous seven years (Government <strong>of</strong> WestBengal, 1999). The overall projected growth in Domestic Product for West Bengal hasbeen estimated at an annual rate <strong>of</strong> 6.7%; it appears that much <strong>of</strong> this may be accounted forby industrial development. However, despite the economic benefits <strong>of</strong> industrialisation,associated negative impacts such as noise, air and water pollution can severely affect thelives <strong>of</strong> local residents, furthermore, the contamination <strong>of</strong> municipal solid waste andwastewater with industrial pollutants poses a serious threat to traditional farming practicesthat exploit such waste resources. The need to develop infrastructure such as roads,railways, housing and commercial buildings, required to support industrial growth, mayalso displace PU farmers and poor communities or restrict their access to natural resources.1.4. DemographicsSettlement by the British and the prospect <strong>of</strong> trade gave impetus to population growth inKolkata, however, the concentration <strong>of</strong> commerce and communications in this city meantthat urbanisation in other areas <strong>of</strong> eastern India, and in particular West Bengal, has beenretarded. In 1710 the population <strong>of</strong> Kolkata was estimated at between 10-12,000, in 1831 itwas around 187,000 and in 1837 had increased to ~230,000 (National Institute <strong>of</strong> UrbanAffairs, 1998). By 1850 the population had risen to roughly 415,000, however, the nextcensus in 1866 showed a marked decline to ~359,000. This decline was probably due tothe emergence <strong>of</strong> disease problems in the city, causing death and out-migration. By 1872the census shows that the population had recovered to around 409,000. Rapid populationgrowth shortly after the founding <strong>of</strong> the city (ten-fold from 1710-1750) was due toimmigration by European settlers and rural-urban migration by native people seekingemployment and commercial opportunities. More recently, periods <strong>of</strong> rapid populationgrowth in Kolkata have been associated with mass migration resulting from the partition <strong>of</strong>India and the war <strong>of</strong> independence between Bangladesh and Pakistan. Rural-urbanmigration within West Bengal still contributes to population growth in the city, althoughthere is a widespread belief that many recent immigrants have come from other states ineastern India, such as Bihar, Assam and Orissa.Recent estimates suggest that during the ten years from 1981 to 1991, population growth inthe Calcutta Municipal Area (CMA) was 33.7%, up from 22% during the previous ten-yearperiod (CMDA, 1992). However, population growth in the state as a whole from 1981-1991 was only 24.7%, with an average urban population growth <strong>of</strong> 29.5%. In 1961, the5
1.5. Governance in the CMC and CMA and the Waste Recycling RegionEarly settlement in Kolkata was divided into two distinct sections, locally referred to as theblack and white towns, however, the native and foreign communities did not remainisolated. For aspirant Indians they found that establishing a relationship with the Britishsettlers could help in gaining access to wealth creating opportunities, however, aprerequisite to establishing such a relationship was confidence in speaking English. ThoseIndians that undertook a western education and subsequently worked for the British andtheir followers were referred to as the baboo class, in contrast, Indians with anti-Britishsentiments continued to support traditional education and protested against the exploitativenature <strong>of</strong> British rule. Despite such protests, the English language dominated and passedinto the primary curriculum. Opposition to the imposition <strong>of</strong> western culture and educationemerged as a substantive movement in the mid-1800’s and lead by charismatic localfigures reached a climax with the Sepoy Mutiny <strong>of</strong> 1857. However, it was not until 1947,following the passage <strong>of</strong> the Second World War, that India finally gained independence.Independence for India was also closely associated with partition <strong>of</strong> the sub-continent,although debate surrounds the events giving rise to this event.Partition and the migration <strong>of</strong> people from East Bengal resulted in an influx <strong>of</strong> some 3million people to West Bengal during the period from 1947-52 (Som, 1987). The massmigration <strong>of</strong> people during this period, and more recent movements <strong>of</strong> economic migrantsfrom rural areas and other states, has resulted in a large proportion <strong>of</strong> the population <strong>of</strong>Kolkata having to live in unplanned and poorly serviced slums or bustees. In 1981 it wasestimated that out <strong>of</strong> a total population <strong>of</strong> 10.7 million in Kolkata, 3 million people lived inslums (Som, 1987), however, despite many slum development and rehabilitationprogrammes, the situation remains desperate for many.The system <strong>of</strong> local self-government that is practised in Kolkata has a long history. UnderBritish rule this popular representative system provided a democratic means to expressdisquiet with British rule, even permitting nationalist leaders such as Subhash ChandraBose to be elected as Mayor <strong>of</strong> the Calcutta Corporation. Following Independence, theestablished system <strong>of</strong> local self-government continued and remained largely effective.Today the CMC follows a parliamentary form that is similar to the cabinet systemestablished by the British; the Mayor continues to head a council <strong>of</strong> elected members,however, this body functions under the federal State Government.Following partition Kolkata became the capital <strong>of</strong> the newly formed state <strong>of</strong> West Bengal.The historical centre <strong>of</strong> the city, the Calcutta Municipal Corporation (CMC), which sharesits name with the executive administrative council, covers an area <strong>of</strong> 187 km 2 . However,the wider urban agglomeration surrounding the CMC which covers an area <strong>of</strong> 1,380 km 2and consists <strong>of</strong> 3 municipal corporations, 37 municipalities, 70 non-municipal towns and450 villages has been defined as the CMA. Figure 1.4 shows that although the CMCconstitutes the core <strong>of</strong> the city, the municipality actually adjoins directly to what areclassified as rural areas, both within and outside the CMA. The evolution <strong>of</strong> farmingactivities in these rural areas and their relationship with the city is described in Box 1 (Page11). From this review it is apparent that waste from the city largely supported the earlyintensification <strong>of</strong> agriculture in the region, whilst produce cultivated serviced growingurban markets. More recently, however, the close association and proximity <strong>of</strong> these PUfarming practices to urban areas is <strong>of</strong> growing concern to the municipal authorities,primarily as this activity stands in the path <strong>of</strong> urban growth. Despite this tension, the7
environmental, economic and social benefits attributed to these farming activities byNGOs, select government departments and local advocates lead, in part, to legislation andoutline plans for their conservation. Possibly the most significant development was thedesignation <strong>of</strong> ~12,500 ha <strong>of</strong> farmland toward the east <strong>of</strong> the CMC as a Waste RecyclingRegion (WRR). This conservation area was formerly implemented through a ruling fromthe Calcutta High Court (1993) and as a consequence the area is protected againstunplanned development.The WRR is commonly divided into four parts, each under the jurisdiction <strong>of</strong> a differentpolice station, there are ~4,500 ha under both Bhangor and Sonarpur stations, 2,100 haunder Bidhanagar and ~1,400 ha under Tiljala (CRG, 1997). Figure 1.5 shows the positionand extent <strong>of</strong> the WRR, the main concentration <strong>of</strong> garbage farming lies adjacent to theEastern Metropolitan Bypass (EMB) and between the Dry Weather Flow (DWF) andCentral Lake canals. The remaining part <strong>of</strong> the western half <strong>of</strong> the WRR is dominated byponds managed for wastewater aquaculture whilst the eastern side consists largely <strong>of</strong>wastewater irrigated farms. Directly to the northeast <strong>of</strong> the WRR is Salt Lake City, whilstthe Krishnapur Canal constitutes the remainder <strong>of</strong> the regions northern boundary.iiiiiiiiiiiLegendi - vegetable farmsii - wastewater aquacultureiii - paddy farmsFigure 1.5. Outline <strong>of</strong> the Waste Recycling Region (WRR) showing different areas <strong>of</strong> agricultural activity(Source: Gupta, 2001)1.6. SummaryPast phases <strong>of</strong> urban growth, prevailing environmental conditions and drainagecharacteristics <strong>of</strong> the developing urban area have contributed significantly to theestablishment <strong>of</strong> traditional waste-reuse farming practices in PU Kolkata. Nutrientscontained in both solid organic waste and wastewater have contributed to improved yields8
whilst reducing input costs, access to urban drainage water also contributes to theavoidance <strong>of</strong> problems associated with the highly seasonal rainfall that prevails in theregion. The managed reuse <strong>of</strong> city waste has contributed to improved sanitation andreduced public and environmental health problems, whilst population growth in the cityhas resulted in greater market demand for produce from PU farms and encouraged theexpansion <strong>of</strong> this activity. However, due to a number <strong>of</strong> threats, many <strong>of</strong> which areassociated with processes <strong>of</strong> urbanisation, the WRR was established as a conservation areato safeguard against development. In the following sections, the current nature and extent<strong>of</strong> the principle PU farming activities in this region are reviewed, and constraints facingproducers discussed.9
2. Survey objective and methodologyThe objective <strong>of</strong> surveying managers <strong>of</strong> PU production systems was to address gaps in theexisting knowledge base concerning current management practices and arrangements, andto triangulate data from previously reported studies. It was anticipated that knowledgegenerated concerning general employment practices, labour demands and market channelsfor inputs and products, would contribute to better focusing planned studies concerning therole <strong>of</strong> PU production systems in poor livelihoods. Furthermore, it was anticipated thatknowledge generated concerning major constraints facing producers would constitute avaluable resource for local researchers, government departments and internationaldevelopment organisations. The aim being to help them target resources to safeguard andenhance these farming practices which play an important role in the local economy, supplyproduce to urban and PU markets and sustain various poor livelihoods.Due to the extent <strong>of</strong> PU Kolkata it was necessary to develop a strategy to focus the survey<strong>of</strong> production systems in the region. From a practical perspective the East KolkataWetlands or WRR provide a geographical focus, whilst the volume and diversity <strong>of</strong>produce cultivated here make these production systems some <strong>of</strong> the most important in theregion. Furthermore, initial <strong>analysis</strong> suggested that a significant number <strong>of</strong> poor peopledepend either directly or indirectly on the continued function <strong>of</strong> these systems for asubstantial proportion <strong>of</strong> their livelihood or food security (Bunting et al., 2001). Byconcentrating on this important system, which has been the subject <strong>of</strong> significant previousresearch, legal argument and externally-funded development activity, it was anticipatedthat opportunities for improved governance and management would be identified thatcould enhance the livelihoods <strong>of</strong> significant numbers <strong>of</strong> poor people.Having decided on a geographical focus, a stratified sampling framework was preparedbased on the primary nature <strong>of</strong> the major production system. Livestock production wasconsidered too infrequent and temporal to be included in the main survey, however, asupplementary enquiry concerning this aspect was undertaken as a separate project activity(Harris, 2001). From the initial literature review (Bunting et al., 2001) it was proposed thatthe study should focus on the three most significant production activities in PU Kolkata:- aquaculture - fish production is reportedly widespread in the region and conductedin a variety <strong>of</strong> water bodies or wetlands 2 . Wastewater from canals draining the cityis the major water source in the area, whilst entrained nutrients enhance productionin those ponds managed for wastewater aquaculture.- horticulture - vegetable cultivation exploiting solid waste inputs from the city toenhance production is concentrated in the Dhapa region, recently however, due touncertain solid waste supplies inorganic fertilisers are reportedly being used.Irrigation <strong>of</strong> the vegetable plots is undertaken using water from both the mainsewage canals, secondary feeder canals and freshwater jheels, which are retainedspecifically for irrigation purposes.2 The term ‘wetland’ is used locally in both <strong>of</strong>ficial and un<strong>of</strong>ficial contexts to refer to environments that areinundated with water for a significant part <strong>of</strong> the year, however, no distinction is made between natural andengineered systems10
- paddy farming - rice production, both rain-fed and irrigated, occurs toward themargins <strong>of</strong> PU east Kolkata; irrigation water is either pumped from undergroundaquifers or, where possible, discharge water from fishponds is utilised.A draft questionnaire was prepared and tested by local field staff who surveyed a smallnumber <strong>of</strong> respondents and made appropriate refinements (Appendix 1). Following thistrial phase interviews were undertaken with production system managers and results coded(Appendix 2) and compiled using Excel. Sampling <strong>of</strong> fisheries was undertaken throughrandom selection from a list <strong>of</strong> operational bheries (CRG, 1997); for the smaller jheels inthe WRR, a list <strong>of</strong> the managers names was made and a sample selected at random. Asimilar strategy was adopted for vegetable growers, a random sample was selected from alist, and according to their availability farmers were interviewed. In the case <strong>of</strong> PU paddyfarming, the absence <strong>of</strong> records meant that a map was used to identify areas where thisactivity was concentrated, and farmers interviewed at random during trips to the region.Supplementary interviews with workers were also undertaken in some instances, in whichcase informal interviews and discussions were held whilst the labourers continued to work;this was found to be most convenient. Preliminary <strong>analysis</strong> and report writing werecompleted by the local field staff and a draft survey report prepared and distributed to otherproject team members for review.In addition to survey data recorded as part <strong>of</strong> the current project, data from other studieswere incorporated in the final report to highlight areas <strong>of</strong> agreement and discrepancy. Theobjective was to provide a comprehensive knowledge base from which to formulate futureresearch and development initiatives that better address key constraints and opportunitiesfacing the managers <strong>of</strong> PU farms. Sections 4-6 present an overview <strong>of</strong> prevailing systemscharacteristics that should be considered when assessing the current status and importance<strong>of</strong> PU farming in poor livelihoods. Further information from secondary sources ispresented together with summarised survey data to aid comparison and consolidate theknowledge base.11
3. Origins and recent history <strong>of</strong> production in PU KolkataThe history <strong>of</strong> Kolkata since its founding in 1690 by the British East India Company as atrading post on the eastern banks <strong>of</strong> the Hooghly River is well documented. This issignificant as the development and current status <strong>of</strong> production systems in PU east Kolkatamay be largely attributed to critical historical developments (Furedy, 1987; Ghosh and Sen,1987; Kundu, 1994). The origins <strong>of</strong> aquatic and terrestrial production systems exploitingwaste resources from the city are described briefly in Box 1. However, from a period <strong>of</strong>rapid and sustained expansion, recent change at the PUI has seen a marked decline in theextent and apparent viability <strong>of</strong> traditional production systems.Box 1. Evolution <strong>of</strong> horticulture and aquaculture in PU KolkataAgriculture in PU Kolkata has a long history dating back to the late eighteenth century. Shortly afterfounding the city, sewage and most <strong>of</strong> the solid waste were disposed <strong>of</strong> in the river from a speciallyconstructed ghat; some solid waste was also used as infill. Overall, this system proved unhygienic and itwas widely acknowledged that a new strategy was needed, however, a system <strong>of</strong> burning solid waste,which was later tried, was not successful. Mr. William Clark, Chief Sanitary Engineer, then proposed toremove municipal solid waste to the Salt Lake area, and during 1864 a low-lying area to the east <strong>of</strong> the citywas acquired at a price <strong>of</strong> Rs 93,000 for the purpose <strong>of</strong> waste disposal; dumping started in 1868.In 1876 this land was leased for 3 years to Nandalal Das, whilst rights to capture fisheries in the area weregiven to Durga Charan Kundu for 4 years. However, unsatisfactory management by Nandalal Das forcedthe Corporation to transfer the lease to Bhabanath Sen, who acquired the right <strong>of</strong> land including thewatercourses for 20 years from 30 th April 1879; the following year he acquired the fisheries. Under thesupervision <strong>of</strong> Bhabanath Sen horticulture in the area became established and better organised. In 1904, thesub-deputy Collector reported that <strong>of</strong> 220 ha taken on lease by Bhabanath Sen, 60 ha were beingcultivated; gradually, however, the entire area leased out to Bhabanath Sen was converted to horticulture,and this productive vegetable growing area became known as Dhapa.In 1872 a fish ghat was constructed on Raja’s khal, and this was closely followed in 1887 by theestablishment <strong>of</strong> a flourishing fish hat (market) at Pagladanga, a navigation channel was constructedsubsequently to connect the market to the town reservoir. Later, land taken to construct the SWF (stormwater flow) canal caused disruption to both the fish khal and market. However, discharge <strong>of</strong> sewagecarried in SWF canal resulted in brackish lagoons becoming less saline, and as a result freshwater fish sooncolonised these lagoons; it is also likely that some informal stocking <strong>of</strong> fish was undertaken. An accountgiven by Mr P Ghosh, former Secretary <strong>of</strong> the Fish Producers Association, suggest that the earliest attemptat formal aquaculture deliberately exploiting wastewater was undertaken by Mr Bidhu Bhusan Sarkar in1918. Subsequent construction <strong>of</strong> the Dr B N Dey Outfall Scheme increased access <strong>of</strong> farmers in the areato wastewater, which in turn encouraged others to adopt wastewater aquaculture.From a peak in 1945 when ~350 fisheries managed for wastewater aquaculture covered7,300 ha, recent estimates have put the remaining pond area at 2,500-3,000 ha. In 1956 theSalt Lake Reclamation Scheme was formulated and acquisition notices served on nearlyhalf the farms managed for wastewater aquaculture. Between 1962 and 1967, under thedirection by the Government, about 1,200 ha <strong>of</strong> ponds were filled with silt dredged fromthe Hooghly River; this reclaimed land was used to develop Salt Lake City, a majorresidential area to the northeast <strong>of</strong> Kolkata. From 1967 to 1972, a further 320 ha werereclaimed to extend Salt Lake City. In 1972, there were 11,480 acres <strong>of</strong> fisheries. Duringthe period 1978-79 the East Calcutta and Patuli Townships were developed converting 670and 240 ha, respectively. Figure 3.1 shows the location <strong>of</strong> major wetlands in PU Kolkata(dark shading), together with an indication <strong>of</strong> the areas under agricultural production(hatched).12
Figure 3.1. Water-bodies and tracts <strong>of</strong> agricultural land in PU Kolkata (Source: ADB, 2000a)Following these major projects, recent pond conversions in the area have proceeded in aless overt fashion, with initial conversion to paddy farming, which is more easilydeveloped for light industry or residential purposes. Since the early 1980’s, roughly 2,200ha <strong>of</strong> ponds have been converted to rice farming. Paddy farming is widespread in WestBengal and the influence <strong>of</strong> Kolkata on production extends throughout the region. Demandfrom the huge urban markets helps sustain higher than average prices, whilst nutrient richwastewater is used for irrigation over 50 km from the city. Naskar (1985) reviewed thepractice and history <strong>of</strong> brackish-water rice cultivation and reported that it was common forfarmers in the region to integrate the culture <strong>of</strong> fish and shrimp with paddy farming. It wasalso widely reported that water from the Kulit estuary used to irrigate rice fields in theseareas contained significant concentrations <strong>of</strong> sewage water. The author noted thatintegrated farming was being conducted on 7,000 ha <strong>of</strong> paddy land in Minakhan block and11,200 ha in Haroa block. Figure 3.2 indicates the general location and extent <strong>of</strong> brackishwaterrice cultivation downstream <strong>of</strong> Kolkata, much <strong>of</strong> which is irrigated partly withwastewater.13
Figure 3.2. Extent <strong>of</strong> brackish-water rice cultivation downstream <strong>of</strong> Kolkata (Source: Naskar, 1985)As noted in Box 1, vegetable farming in PU Kolkata developed in the region surroundingDhapa and this area continues to be a centre for vegetable production. Arrangementsbetween the Calcutta Corporation and a single private leaseholder, who took responsibilityfor systematic garbage disposal continued until 1968. At this time the total area estimatedto be under vegetable cultivation had risen to 810 ha. Recent estimates have put the arearemaining under horticulture in PU Kolkata at ~320 ha, whilst production on this land maybe up to 370 t ha -1 y -1 . Despite the productive nature <strong>of</strong> horticulture in the area it isapparent that the land area under cultivation has declined significantly, suggesting that landis being converted for other purposes.Construction <strong>of</strong> the EMB in the 1980’s involved the conversion <strong>of</strong> selected wetland areasand portions <strong>of</strong> the solid waste disposal ground. Improved communications associated withthe EMB have increased the attractiveness <strong>of</strong> the area to developers, consequently thepotential financial returns for fishery owners that sell their land may be substantial, makingthe temptation to sell stronger. Furthermore, the role <strong>of</strong> Government in regulatingconversion remains somewhat ambiguous. Although conscious <strong>of</strong> the need to retain PUwetlands, some recent plans suggest that limited conversion to support infrastructure andeconomic growth may be desirable; the acquisition notice still threatens ~1,100 ha <strong>of</strong>wetland at the Kolkata PUI. The KMC, which retains ownership <strong>of</strong> all the land used forhorticulture around Dhapa, also issues only short-term lease agreements that furthercontribute to uncertainty and insecurity amongst the farming community.Attempts have been made in recent years by fishery owners and others to stop furtherencroachment <strong>of</strong> the wetlands, and as mentioned previously, following a lawsuit filed byNGOs the Calcutta High Court ruled in September 1992 that:‘no government or non-government body can reclaim any more wetlands, on theeastern fringes, where wetlands are defined in terms <strong>of</strong> being wet for 6 months ormore in a year.’14
This was widely considered a landmark judgement, but doubts have been expressedregarding its implementation. Moreover, as yet no measures have been taken to properlyconserve the remaining wetlands. The potential <strong>of</strong> community-based organisations indeveloping enhanced natural resource management strategies for PU Kolkata is discussedfurther in Section 7. The following sections describe the current status <strong>of</strong> aquaculture,horticulture and rice farming in PU Kolkata. Constraints identified by respondents arediscussed.15
4. PU aquacultureFish cultivation in ponds managed for wastewater aquaculture in PU Kolkata is a practicethat has been developed by local farmers and entrepreneurs during the past century; Kundu(1994) presents a comprehensive review <strong>of</strong> the systems origins and development. A recentreport noted that there were 264 individual fisheries or bheries operating on a commercialbasis with a cumulative surface area <strong>of</strong> 2,480 ha; these fisheries were distributed withinfour PU wards, namely Bhangor, Bidhannagar, Sonarpur and Tiljala (CRG, 1997). Thisreport also noted that there were a further 22 fisheries with an area <strong>of</strong> 970 ha distributedthroughout this region that were either lying idle or only informally used for aquaculture.Fish cultivation is also practiced in the numerous jheels in the Dhapa area and in severalhomestead ponds concentrated in Sonarpur and Bhangor, some <strong>of</strong> which are managed forwastewater aquaculture. Preliminary stakeholder consultations suggested that ~400households may be producing fish in ponds receiving wastewater.4.1. Scale and distributionAquaculture-based production systems are distributed throughout the WRR and varymarkedly in size. Assessing the distribution <strong>of</strong> commercial fisheries based on locationsuggests that smaller fisheries below 2 ha occur mainly in Sonarpur and Tiljala, whilstlarge fisheries >40 ha predominate in Bidhannagar; Bhangor is characterised by a mixture<strong>of</strong> small to medium sized fisheries (Table 4.1). Although roughly 89% <strong>of</strong> the 264commercial fisheries are below 20 ha in size, occupying 1,080 ha, the scale <strong>of</strong> theremaining 11% <strong>of</strong> fisheries over 20 ha results in them accounting for a disproportionatelylarge area <strong>of</strong> 1,400 ha (CRG, 1997).Table 4.1. Frequency distribution for aquaculture operations with respect to size (ha) and locationFarm size (ha)RegionBidhannagar Bhangor Sonarpur TiljalaFrequency (%)70 4 1.5Total 46 37 104 77Developed from CRG (1997)Table 4.2 shows the size distribution for the 56 aquaculture-based production systemssurveyed during the situation <strong>analysis</strong>. Holdings varied from 0.4-162 ha, whilst thefrequency distribution compares well with that for all commercial aquaculture operationsin the region (Table 4.1). Individual holdings with an area below 13.3 ha accounted for59% <strong>of</strong> the sample, whilst the proportion <strong>of</strong> farms above the median range <strong>of</strong> 6.7-13.3 ha16
skews the average farm size in the survey to ~18.5 ha; mean pond depths reportedly rangedfrom 0.15-1.2 m.Table 4.2. Frequency distribution <strong>of</strong> aquaculture-based farms with respect to size (ha); figures in parenthesisindicate farms practicing integrated productionFarm size (ha)Police stationBidhannagar Bhangor Sonarpur TiljalaFrequency (%)0-3.3 14 2 1 303.3-6.7 1 2 5 14.36.7-13.3 2 2 2 2 14.3>13.3 12 (2) 7 (4) 1 3 41Total 15 23 7 11From the survey data it is apparent that integration <strong>of</strong> additional production activities withaquaculture appears to occur on some commercial farms with areas exceeding 13.3 ha inBidhannagar and Bhangor. The nature <strong>of</strong> these integrated production systems is discussedin Section 4.8. Larger farms (>13.3 ha) occurred mainly in Bidhannagar and Bhangor, andwhile Bhangor was also characterised by a number <strong>of</strong> smaller fisheries (0-3.3 ha), n<strong>of</strong>isheries in this size range were surveyed in Bidhannagar. Subdivision <strong>of</strong> lakes in Bhangor,as a result <strong>of</strong> infilling with garbage and land reforms, has resulted in a large number <strong>of</strong>jheels in this region. The size distribution <strong>of</strong> fisheries in Sonarpur and Tiljala indicates amixture <strong>of</strong> small and medium sized fisheries, although larger bheries are less common.4.2. Management patternA diverse range <strong>of</strong> management strategies have developed in association with aquacultureproduction systems in PU Kolkata (Table 4.3), the evolution <strong>of</strong> which has largely beengoverned by socio-political forces and legislative restructuring. Perhaps the key issue inthis respect, however, has been land reform in West Bengal, implemented to increaseaccess by poor families to scarce land resources; traditionally feudal landlords orzamindars governed access to much <strong>of</strong> the land in the State. Box 2 outlines the key reformsthat have contributed to the current pattern <strong>of</strong> land holding and use at the Kolkata PUI. Keyenactments were the West Bengal Estates Acquisition Act (1953) and West Bengal LandReforms Act (1955), however, due to exemptions covering tea gardens, orchards andfisheries, the bheries in PU Kolkata remained largely intact until only recently.Amendments to the Land Reforms Act in 1995 brought fisheries within its jurisdiction, andconsequently lead to significant reorganisation, with many private holdings being vestedfrom their owners by the State and transferred to fishermen’s groups (non-registeredcooperatives). Having demonstrated their competency, such groups may subsequentlyapply to become registered cooperatives. The practice <strong>of</strong> vesting land has resulted in adecline in larger fisheries under private ownership, however, there are a number <strong>of</strong> smaller,independently managed household ponds and jheels in the region. The majority <strong>of</strong> jheelsare found on land that was vested from zamindars as part <strong>of</strong> the land reform programme inWest Bengal. Two <strong>of</strong> the largest fisheries in the region, (Nalban and Goltala bheries)remain under the direct control <strong>of</strong> the State Fisheries Development Corporation, GoWB.17
Box 2. Land reform in West BengalAccording to planners, land reforms may be used to describe land levelling, consolidation <strong>of</strong> fragmentedholdings or changes in agrarian relations and structure. In India, a complicated issue like land reforms,which includes economic, sociological and political issues must be addressed through a process <strong>of</strong>evolution, unlike in some other countries where revolutionary changes have brought about desiredoutcomes in a short span <strong>of</strong> time. However, since independence, certain shifts in political leanings havebeen reflected in amendments and new legislation passed concerning land reformation. The West BengalEstates Acquisition Act (1953) and West Bengal Land Reforms Act (1955) stand as two major pieces <strong>of</strong>legislation concerning land reforms in West Bengal. The Bengal Tenancy Act (1885) was the first piece <strong>of</strong>legislation seeking to define the various relationships between different classes <strong>of</strong> tenants and theirlandlords. However, not until independence, and the enactment <strong>of</strong> the Estates Acquisition Act (1953) wasthe zamindari system, introduced under the Permanent Settlement Regulation (1793), abolished in WestBengal. The main objects <strong>of</strong> the Estates Acquisition Act (1953) were to eliminate the interests <strong>of</strong>zamindars and intermediaries by acquisition on payment <strong>of</strong> compensation and acquire their mining rights.However, the Act also permitted intermediaries to retain possession <strong>of</strong> their khas lands up to certain limits,whilst treating them as tenant holding directly under the State. Although commonly overlooked, otherlegislation such as the West Bengal Estates Acquisition Rules (1954), West Bengal Land Reforms(Bargadars) Rules (1956) and West Bengal Land Reforms Rules (1965) has contributed to the pattern <strong>of</strong>landholding in PU Kolkata. Other enactments such as the Restoration <strong>of</strong> Alienated Land Act (1973) andUrban Land (Ceiling and Regulation) Act (1976), together with minor Acts have also influenced theprocess <strong>of</strong> land reform.Amendments to the rules <strong>of</strong> Permanent Settlement and codified by the Tenancy Act (1885) dispensed withlarge numbers <strong>of</strong> intermediaries acting between the cultivator and State. The Land Reforms Act (1955),which repealed the Tenancy Act (1885) sought to further refine agreements, stipulating that nointermediaries were permitted between the raiyat and State; this simplified the relationship <strong>of</strong> the State tothe raiyat, as well as that between raiyats. The Estates Acquisition Act (1953), for the first time laid downan upper limit <strong>of</strong> land that could be held by a raiyat; amendments in the Land Reforms Act (1955) furtherreduced this limit. The ‘land ceiling’ as it is now known was fixed by an amendment <strong>of</strong> the West BengalLand Reforms Act (1971). Regulations outlined in the Land Reforms Act (1955) stipulate ceilings <strong>of</strong> 2.5ha for a raiyat or sole surviving member <strong>of</strong> a raiyat family and 5 ha for a family comprising two to fivemembers. For a raiyat family having more than five members, the limit was 5 ha plus 0.5 ha for eachmember in excess <strong>of</strong> five, although the aggregate <strong>of</strong> the ceiling area for such raiyat shall not exceed 7 ha;for any other raiyat the ceiling was 7 ha.Land holdings exceeding the relevant ceilings were vested by the government and distributed to thelandless and land-poor; this has been a major goal <strong>of</strong> land reform in West Bengal. The maximum area <strong>of</strong>land that may be allocated to an individual is 0.8 ha (2 acres), whilst the minimum is 0.14 ha (1/3 acre).Prior to distribution, District Officers make a list <strong>of</strong> eligible persons in order <strong>of</strong> priority; local <strong>of</strong>ficers thendistribute the vested land only to those people that appear on the list. Priority is given to certain groups asstipulated by the Board <strong>of</strong> Revenue, West Bengal. Landless agricultural workers receive priority, followedby landless Bargadars; landless people who used to cultivate the land in question as Bargadars oragricultural workers under the previous owners; and raiyats owning less than 1 ha <strong>of</strong> land. For eachcategory, however, members <strong>of</strong> Scheduled Tribes, followed by Scheduled Castes receive priority. Initially,however, tea gardens, orchards and fisheries were not covered by the land reform Acts, and as a resultsome large landholdings have remained in private hands. An amendment to the Land Reforms Act in 1995bought fisheries within its jurisdiction, and recently several large fisheries in PU Kolkata have been vestedand distributed among poor fishermen.18
Table 4.3. Management strategies and associated observations for PU aquaculture activitiesManagement strategy Operation CommentOwner managed - farms managed by the owner who engages labour as required;according to local knowledge this type <strong>of</strong> management practice isdecliningOwn land with joint - land or ponds with multiple owners is developed for fish culture andmanagementRegistered cooperativeFishermen’s group ornon-registered cooperativeOwner-workerparticipatorythe owners share investment and operating costs, as well as pr<strong>of</strong>its- groups <strong>of</strong> fishermen holding the required land deeds may approachthe DoF to form registered co-operatives; following registration cooperativesmay be eligible for government support in the form <strong>of</strong> seedinputs or loans- land vested by the state government is distributed to a group <strong>of</strong>landless people residing locally and assistance is provided by the DoFin managing the fishery; this is the first step to forming a co-operative- Although individually owned the workers take responsibility forinvestment, management and marketing, giving a fixed portion <strong>of</strong> theproduction to the ownerLeased - leases are arranged for various periods, although in all cases theowner is given an single payment, the leaseholder is then free toculture fish for the duration <strong>of</strong> the lease- fisheries <strong>of</strong> this type were distributed throughout the WRR- this strategy benefits owners who otherwise without jointmanagement could not practice aquaculture- despite the advantages many potential co-operatives remainunregistered as they do not possess the correct papers- these groups could potentially form co-operatives but lack thepapers required for formal registration- this ownership pattern benefits both the owner and workers asincreased production result in mutual benefits- a common management pattern although there may be negativeenvironmental and productive impacts as the leaseholder has noincentive to consider long-term change- this type <strong>of</strong> ownership is common for larger fisheriesLeased with jointmanagement- several leaseholders share responsibility for decision making andpr<strong>of</strong>its are distributed according to individual shareholdingsVested CMC land - the CMC gives water bodies under its ownership to farmers - vested water bodies (referred to locally as jheels) are generallysmall in sizesSublet vested land - large bheries were subdivided and vested amo ng local farmers by - water bodies resulting from the subdivision <strong>of</strong> the bheries areleaders <strong>of</strong> the Left Front Government which has held power in West referred to locally as jheelsBengal for 24 years, the water bodies are then sublet to other farmersIncorporatedcompanyGovernmentundertakings- fisheries <strong>of</strong> this type function as commercial businesses - only one fishery was managed as a commercial business- these farms are maintained by the government - access to these fisheries is difficult without prior arrangement
Fisheries that remain in private hands are usually run on a partnership, shareholding orleasehold basis; owners rarely operate fisheries directly. In the case <strong>of</strong> partnerships thelandowner is paid a rent but may still participate in decision-making and take a share <strong>of</strong> thepr<strong>of</strong>its. In the shareholding system, pr<strong>of</strong>its are divided amongst the shareholders, althoughthe owner generally takes 40% <strong>of</strong> the pr<strong>of</strong>its. When land is taken on lease, usually by fiveto ten people, the owner is paid an annual rent and pr<strong>of</strong>its are shared in proportion to eachlessee’s financial contribution.4.3. Water sourceAccess to wastewater draining from Kolkata city was one <strong>of</strong> the primary driving forcesbehind the emergence <strong>of</strong> PU aquaculture. Initially, opportunistic farmers exploited thewastewater resource to cultivate fish and vegetables, however, as siltation in the HooghlyRiver became more problematic, the authorities diverted a greater proportion <strong>of</strong> the siltladen wastewater to agriculture, and in particular fishponds. This strategy required theconstruction <strong>of</strong> an extensive canal network that extended throughout the eastern PUI; keyarteries in this network include the fisheries feeder canal and Ghosh’s canal. The drainagenetwork was engineered to distribute wastewater under gravity to the majority <strong>of</strong> fisheries,however, as silt has accumulated in the fishponds, an increased proportion <strong>of</strong> farmers findit necessary to pump wastewater from the canals. This problem has been further aggravatedby the need to maintain a low hydraulic head at the pumping stations transferringwastewater from the city sewers to the drainage canals (Edwards, 2001). In the currentstudy it was reported that ~32% <strong>of</strong> pond managers were required to pump water from thedrainage canals to their ponds during the year.As part <strong>of</strong> the comprehensive survey <strong>of</strong> fisheries undertaken by the Creative ResearchGroup (CRG, 1997), operators access to sewage water was assessed, results from this studyare summarised in Table 4.4. Respondents were requested to score the supply <strong>of</strong> sewagewater on a five-point scale, where 1 indicated a more than adequate supply and 5 a highlyinadequate supply. In the region under Bidhannagar police station perceptions <strong>of</strong> thesewage supply appear variable, 43% <strong>of</strong> respondents scored the supply as adequate or morethan adequate and an equal proportion scored it as inadequate or highly inadequate. Scoresin Tiljala were also distributed across the possible range <strong>of</strong> responses, although the largestproportion (73%) classified the supply as inadequate or highly inadequate. During thesurvey 10 respondents in this region did not consider the question applicable, whilst 18fisheries were rain-fed. The number <strong>of</strong> respondents in Sonarpur who classified the supplyas inadequate or highly inadequate was also significant at 63%, whilst no respondents inthis area considered the supply ‘more than adequate’. The modal score in both Sonarpurand Tiljala was 4, indicating an inadequate sewage supply. Overall, the majority (60%) <strong>of</strong>farm managers questioned regarded the sewage supply as inadequate to highly inadequate,a further 22% considered the supply adequate for part <strong>of</strong> the year, suggesting perhaps thatthe sewage supply is governed by seasonal changes. Only a relatively small proportion <strong>of</strong>respondents (18%) scored the supply as adequate to more than adequate.The historical perspective presented by Furedy (1987) provides an insight to one <strong>of</strong> the keyconstraints in reusing wastewater for aquaculture. Siltation problems in the Kulti riverwere a driving force behind the diversion <strong>of</strong> wastewater to PU fishponds, however, sincethis remedial action, no sustained effort has been undertaken to reduce or manage the highloading <strong>of</strong> suspended solids present in the wastewater. Therefore, the problem <strong>of</strong> siltation20
was merely transferred from the river to the secondary canal network and PU fishponds.As the ponds and feeder canals have become silted, decreasing access and consequentlyreuse <strong>of</strong> wastewater in fishponds, siltation in the primary canals and river is again aproblem for the municipal authorities. The fact that many fishpond operators experiencesignificant problems in accessing wastewater, and as a result increased volumes <strong>of</strong>wastewater are having to be discharged to the Kulti river, also belies the myth that reuse inPU fishponds treats a significant proportion <strong>of</strong> wastewater discharged from the city. Evenwhen functioning ideally, wastewater flowing through the fishponds is not dischargeddirectly to the Kulti River, but passes into downstream paddy fields and drains away fromthe primary canal network. The volume <strong>of</strong> wastewater that, having passed through thereuse system, is ultimately discharged to the river network has not been evaluated.Table 4.4. Access to wastewater, as perceived by pond managers in PU KolkataPolice stationScores*1 2 3 4 5ModalscoreBidhannagar 8 12 6 17 3 3Bhangor (2ha were not availableAdapted from CRG (1997)During the 1940’s an ambitious scheme was implemented to intercept wastewater drainingto the fishponds, and to treat it in primary settlement tanks situated at Bantala. The schemealso extended to transporting sludge, thickened in earthen basins, by train to tea growingplantations in Darjeeling. Although successfully commissioned, the settlement tanks onlyremained functional for one to two years. Several reasons including technical problems,high operation and maintenance costs and vandalism have been given for the failure <strong>of</strong> thetreatment plant. However, it is likely that a combination <strong>of</strong> factors lead to such a rapidsystems failure. The now defunct settlement tanks remain as a reminder to future plannersand policy makers concerning the need to develop appropriate and demand leadinterventions that consider the range <strong>of</strong> stakeholder demands. This is particularly pertinentconsidering the planned initiatives outlined in the forthcoming ADB-DFID funded CalcuttaEnvironmental Improvement Project (CEIP) urban development project, details <strong>of</strong> whichare discussed in Section 7.3.Problems with accessing sufficient wastewater from the secondary canal network haveresulted in a significant number <strong>of</strong> operators using pumps. Table 4.5 shows that producersin Tiljala can still rely on gravity to supply wastewater, producers in Bidhannagar alsodepend mainly on gravity although a few (4) are also required to supplement this by usinga pump. The majority <strong>of</strong> managers (14) in Bhangor rely largely on gravity, although some(6) also need to pump water and 3 depend solely on pumped water. In Sonarpur, themajority <strong>of</strong> respondents reportedly had to pump wastewater to their fishpond, whilst onlytwo were able to depend on gravity to supply their needs. This is consistent with the21
findings <strong>of</strong> the earlier survey (CRG, 1997) during which the majority <strong>of</strong> fishpond managersin Sonarpur reported the supply <strong>of</strong> sewage water to be inadequate or highly inadequate(Table 4.4).Although in common parlance, references to gravity being employed to supply wastewaterto fishponds may, in some cases, be considered an oversimplification. Due to the nature <strong>of</strong>the sewerage system in the CMA, all drainage water must be raised by pump severalmeters so that there is a sufficient hydraulic head to enable drainage under gravity throughthe primary canal network to the discharge lock on the Kulti river and the secondary canalssupplying the PU fishponds. Edwards (2002) discussed further problems that have emergedrecently due to the technical and operational constraints associated with pumping largevolumes <strong>of</strong> water from the city and the differing demands <strong>of</strong> stakeholders in the PU area.Furthermore, due to the topography <strong>of</strong> the region and barriers such as roads, varioussiphons have been constructed, whilst controlling distribution through the drainagenetwork means that several lock gates on the primary and secondary canals must beregulated and maintained. Unfortunately, farmers frequently complain that due to theprevailing systems for controlling the sluice gates, significantly less wastewater enters thesecondary canal network than is actually required to sustain the fisheries; several <strong>of</strong> thesluices in question are under the control <strong>of</strong> the Department <strong>of</strong> Irrigation and Waterways.Some individual fisheries are dependent on the maintenance <strong>of</strong> siphons to enable them toextract wastewater from the canals.Table 4.5. Methods employed to deliver wastewater to PU fishpondsWater supplymethodPolice stationBidhannagar Bhangor Sonarpur TiljalaFrequency(%)Gravity 11 14 2 11 68Pump 3 5 14Gravity and pump 4 6 18Total 15 23 7 11Maintenance <strong>of</strong> lock gates, siphons and the secondary drainage network by fisherymanagers, and the considerable cost <strong>of</strong> pumping wastewater from the feeder canals to thefishponds, constitutes a significant indirect subsidy supporting the managed disposal <strong>of</strong>wastewater from the city. However, the formal system draining Kolkata serves only aproportion <strong>of</strong> the population, usually middle class and more affluent households, togetherwith businesses, that can afford a connection to the sewage mains. Greater understandingconcerning the volume <strong>of</strong> wastewater used in fishponds, and where pond water isdischarged to downstream users, the degree <strong>of</strong> treatment achieved, could be useful in theevaluating the economic benefit <strong>of</strong> PU fishponds in terms <strong>of</strong> <strong>of</strong>fsetting the costs <strong>of</strong>wastewater treatment. Furthermore, wider appreciation <strong>of</strong> the value <strong>of</strong> environmentalprotection, wildlife habitat, employment and food production associated with PUaquaculture, together with other benefits and costs may contribute greatly to informing arational debate concerning the future <strong>of</strong> the system.22
Pumping <strong>of</strong> wastewater from the drainage canals is routinely undertaken to sustain bothwater and nutrient levels in the fishponds, however, pumps are also employed on many <strong>of</strong>the larger fisheries to drain ponds and move water between ponds, <strong>of</strong>ten in an attempt t<strong>of</strong>acilitate oxygenation. The need to pump wastewater to maintain water levels in themajority <strong>of</strong> ponds highlights the fact that many <strong>of</strong> the PU wetlands are man-made, and thattheir existence depends on the continued functioning <strong>of</strong> the fisheries. Despite thisdependence, many environmentalists do not perhaps appreciate this synergy. Were theregreater awareness <strong>of</strong> this issue, it may contribute to building consensus amongstenvironmental campaigners, producers and policy makers.The necessity <strong>of</strong> having to pump wastewater to many <strong>of</strong> the fisheries also has otherconsequences: employing diesel pumps represents a capital and operating cost toproducers, and also brings into question the environmental credentials <strong>of</strong> the system.However, owing to an agreement between the managers and labour unions, those fisheriesrequired to pump wastewater are only required to engage labourers at a rate <strong>of</strong> one per 5bigha or 0.7 ha, as compared with one per 3 bigha or 0.4 ha where water is delivered undergravity. Presumably the rationale is that the added cost <strong>of</strong> pumping means that theimposition <strong>of</strong> higher labour demands could threaten the viability <strong>of</strong> the farms.4.4. Species culturedTraditionally, aquaculture at the Kolkata PUI was dominated by the production <strong>of</strong> IndianMajor Carp (IMC), specifically a polyculture <strong>of</strong> rohu (Labeo rohita), catla (Catla catla)and mrigal (Cirrhinus mrigala). However, there has reportedly been a trend towardsculturing tilapia (Oreochromis niloticus), usually as part <strong>of</strong> a polyculture with IMC butsometimes in monoculture. Several other fish species, including common carp (Cyprinuscarpio), silver carp (Hypophthalmichthys molitrix) and grass carp (Ctenopharyngodonidella) are produced, however, the volume <strong>of</strong> production appears limited. Tilapia culture isassociated with several advantages, self-recruitment in ponds, which is absent in IMC,demanding less investment in stocking, rapid growth and reportedly good diseaseresistance. Their omnivorous feeding behaviour also means they exploit various feedingniches, whilst the ability to feed efficiently on phytoplankton makes them highlyproductive in systems receiving significant fertiliser inputs, but where supplementaryfeeding is limited. Table 4.6 shows the predominate fish species stocked in PU fishponds.Table 4.6. Predominant fish species stocked in PU pondsSpecies stockedPolice stationBidhannagar Bhangor Sonarpur TiljalaFrequency(%)Indian major carp dominant 13 10 6 6 62.5Tilapia dominant 2 12 5 34Mixed species 1 1.8Total 15 22 7 1123
It is notable that IMC are stocked predominantly in PU ponds situated in Bidhannagar, aregion characterised by larger bheries, whilst in Bhangor, where the majority <strong>of</strong> waterbodies are small, tilapia monocultures are more widespread. Several factors may begoverning the decision as to which species or combination <strong>of</strong> species to stock. Investmentcosts associated with establishing tilapia monocultures may be less, making them moreattractive to small producers; returns associated with culturing IMC may be higher,although so too may be the risks, thus deterring more vulnerable small-scale producers;water quality in ponds in Bidhannagar may suit better the requirements <strong>of</strong> IMC. This mayalso be the case in Sonarpur where 6 <strong>of</strong> the 7 producers interviewed stocked mostly IMC,however, in Tiljala the number <strong>of</strong> farms stocking tilapia and IMC was roughly equal. Thedecision making process is likely to be influenced further by labour union demandsconcerning harvesting days per year, fish seed costs and market demand.4.5. Fish seed and supply chainsThe majority <strong>of</strong> producers (~64%) purchase both fry and fingerlings, however, despitebeing less costly, only a small proportion (~5.4%) stocked just fry due to the higher risk <strong>of</strong>mortality. Fry are much more prone to poor water quality, disease, predation andenvironmental perturbations such as fluctuating temperatures. The fisheries buying frytended to be larger, with more space available for separate nursery ponds in which the fishmay be on-grown prior to stocking in the larger, less manageable bheries. The remaining17 fisheries that only purchased fingerlings tended to be smaller in size, hence with noscope for on-growing.Regarding fish seed trading it was considered important to assess the characteristics <strong>of</strong> thesupply chains, including:- the nature and extent <strong>of</strong> the network, and hence vulnerability to external factors,- the role <strong>of</strong> seed trading in supporting poor livelihoods throughout West Bengal,- technical, financial, institutional and social issues governing the shape andeffectiveness <strong>of</strong> the network.From those farmers surveyed it was apparent that the majority (64%) depend solely onagents (commonly called goldars) to supply fish seed (hatchlings and fry) (Table 4.7).Producers prefer to buy seed from goldars, this way the producers avoid the risksassociated with transporting fish seed and they are not required to travel long distancesfrom their farm to collect the seed. The goldars are also better networked, enabling them toeasily find the species, size and quality <strong>of</strong> seed required by the producers. Goldarspurchase seed from either Naihati fish market or the bandhs in Bankura district; it is theneither delivered by truck or the goldars commission carriers to transport it on their bikes,or manually on their head, to the desired fishery. Managers requiring larger fingerlingstend to purchase them directly from producers. In Bhangor, where the majority <strong>of</strong>managers operate small fisheries and jheels, fish seed are more likely to be purchaseddirectly from hatchery operators; the hatchery manager will usually arrange for thedelivery <strong>of</strong> seed to Sealdah fish market. Some fishpond managers are also involved withon-growing hatchlings to produce fingerlings that they then sell to other farms in the localarea.24
Table 4.7. Supply channels employed by managers to acquire fish seedSeed supplyPolice stationBidhannagar Bhangor Sonarpur TiljalaFrequency(%)Agents 12 10 4 10 64Purchased directly 6 1 13Agents and purchased directly 3 7 2 1 23Total 15 23 7 11Milwain (2001) discussed in detail the organisation and structure <strong>of</strong> fish seed networkssupplying fisheries in PU Kolkata. This author also makes a series <strong>of</strong> recommendationsconcerning possible improvements to fish seed production and distribution in West Bengal.Important areas identified for further consideration including improved water qualitymonitoring and management in hatcheries, better surveillance <strong>of</strong> tube-well watercharacteristics, particularly arsenic and iron concentrations which may negatively affectseed quality, better information on risks from flooding and assistance with marketing toreduce competition amongst producers. Milwain (2001) also proposes a workshop withgovernment staff, specialists and business managers to develop improved managementstrategies; this could constitute an important aspect <strong>of</strong> future research and development insupporting poor livelihoods and enhancing the viability and efficiency <strong>of</strong> fish production inPU Kolkata.From participant responses during the situation <strong>analysis</strong>, it is apparent that Nihati is themost common source for fish seed (35.7% <strong>of</strong> respondents), although, sources in the localarea were cited almost as <strong>of</strong>ten (32% <strong>of</strong> respondents) (Table 4.8). Local sources probablyinclude the purchase <strong>of</strong> fingerlings from other farmers in the area who may have on-growna surplus <strong>of</strong> fish, either intentionally to sell to other producers, or inadvertently owing tobetter than expected survival. Producers citing sources in the local area may, however, bebuying from local traders but unaware <strong>of</strong> the origins <strong>of</strong> the seed they purchase.Other significant sources for seed include Bankura, Sealdah, Bandel, Tribeni and Pandua,with 10.7-19.6% <strong>of</strong> producers interviewed purchasing seed from these regions. Suppliers ineach <strong>of</strong> the remaining 18 regions were used by less than 10% <strong>of</strong> participants. From thisstudy it is apparent that producers in PU Kolkata use fish seed suppliers from a broadgeographical distribution to meet their requirements. Further information would berequired from participants to identify which factors e.g. proximity, reputation, quality, costor past experience, govern the decision concerning the selection <strong>of</strong> seed suppliers, althoughMilwain (2001) provides a preliminary review. The fact that 45 respondents identified 115suppliers also suggests that producers purchase seed from several sources. However, moreinformation would be required to assess whether this was due to producers trying to spreadrisks associated with buying seed <strong>of</strong> unknown quality from one source or if producers wereforced to use multiple suppliers to achieve their preferred stocking regime, in terms <strong>of</strong>species, size and timing. It is also uncertain whether producers consider possible negativefactors such as potential increases in disease risk associated with sourcing seed frommultiple suppliers.25
Table 4.8. Regions from where fish seed are purchased based on responses from farm managers (n = 56)Seed purchase pointPolice stationBidhannagar Bhangor Sonarpur TiljalaFrequency(%)Nihati 9 5 2 4 35.7Local area 4 5 3 6 32Bankura 3 4 2 2 19.6Sealdah 2 3 2 1 14.3Bandel 3 3 1 1 14.3Tribeni 4 2 1 1 14.3Pandua 1 1 2 2 10.7Kalna 3 1 7.1Howrah 3 1 7.1Hooghly 1 2 5.4Burdwan 1 2 5.4North 24 Parganas 1 2 5.4Balagar 1 2 5.4Jirat 2 1 5.4Kalyani 1 1 3.6Nadia 1 1 3.6Ramsagar 1 1.8Tripura 1 1.8Ranaghat 1 1.8Bongao 1 1.8South 24 Parganas 1 1.8Basirhat 1 1.8Magra 1 1.8Halisahar 1 1.8Chandannagar 1 1.8Total 38 35 17 25Information not available 8 2 14.6. Feed and fertiliser applicationAlthough not considered here, wastewater introduced to fishponds represents a significantproduction enhancing input that stimulates the autotrophic food web. The objective <strong>of</strong> thissection was to ascertain which other inputs are used in PU fishponds to enhanceproduction, and to assess whether the use <strong>of</strong> such inputs is dependent on access towastewater. A combination <strong>of</strong> mustard oil cake and mohua cake was reportedly applied by64.2% <strong>of</strong> producers, 16.1% and 7.1% <strong>of</strong> producers applied leather milk and hotel dust,respectively, whilst 12.5% employed no additional feed or fertiliser. Mustard oil cake andmohua cake are traditional fish feeds, however, due to their relatively high cost alternativenutrient sources such as leather milk and hotel dust are now being exploited. Leather milkis a waste product <strong>of</strong> the leather industry and is being used in several areas; middlemencollect this material from slaughterhouses and tanneries in containers and transport it to thefisheries on trucks. Hotel dust consists <strong>of</strong> organic waste from hotel kitchens, the use <strong>of</strong> thismaterial in fishponds is a recent innovation facilitated by local entrepreneurs who collectand transport it to the PU fishponds. Although obviously meeting a demand, potentialnegative environmental health impacts associated with these management practises remain26
to be assessed. According to some respondents, in bheries where the integrated production<strong>of</strong> ducks and hens is practiced, litter is used as a supplementary feed input, however, noinformation on the extent and management demands <strong>of</strong> this practice are available.4.7. Integrated productionFisheries commonly have facilities to on-grow seed to fingerlings in smaller nursery pondsprior to stocking in the main bheries, however, further vertical integration through thedevelopment <strong>of</strong> hatcheries and maintenance <strong>of</strong> broodstock may be constrained due to pooraccess to good quality water in the area, limited financial resources and knowledge andcompetition from established commercial seed producers in the State. More general farmlevel integration was reported on six <strong>of</strong> the larger holdings (Table 4.2) with activities suchas growing vegetables, producing coconuts and rearing ducks and hens for eggs and meat.Such integration is usually undertaken on a relatively small scale, largely for selfconsumption,although, some produce may be sold at local markets. However, morewidespread and intensive integration is reportedly constrained by a number <strong>of</strong> factors. Oneexample reported was that <strong>of</strong> law and order problems, farmers are unwilling to risk thetheft <strong>of</strong> livestock or unguarded crops from embankments, whilst the threat <strong>of</strong> poachingdeters mangers from planting trees along their embankments, through fear <strong>of</strong> reducingvisibility and consequently security. Restrictions imposed by labour unions limiting thetypes <strong>of</strong> work undertaken by some employees and the added risk and demands <strong>of</strong>managing integrated systems may also constrain further integration.4.8. Disease and pest problemsOf 56 farmers interviewed, the majority (47) reported that aquaculture production had beenmoderately affected by disease outbreaks, only one reported severe affects on productionwhilst 8 did not consider disease to have an impact. Disease problems mentioned includedfin rot, gill rot, dropsy, Argulus sp. (fish louse) and Lernia sp. (anchor worm), however, itshould be noted that some <strong>of</strong> these terms refer to disease symptoms as opposed tocausative agents. Summarising the occurrence <strong>of</strong> diseases affecting fish in PU ponds, CRG(1997) noted seven potential problems. The incidence <strong>of</strong> Gyrodactylus sp. andDactylogyrus sp. parasites was reportedly insignificant, whilst that <strong>of</strong> epizootic ulcerativedisease, tail rot, dropsy and fish leeches was low. The incidence <strong>of</strong> fin rot was reportedlymoderate, occurring mainly from mid-July to mid-August and from October to February;this problem was also reported to affect all fish species cultured, whilst the usual treatmentwas the application <strong>of</strong> formalin. The most serious problems encountered were infestationswith Argulus sp. and Lernia sp. which reportedly had a high incidence; the occurrence <strong>of</strong>these parasites was reportedly most common amongst IMC species.Producers depend largely on their own experience in detecting and diagnosing diseaseoutbreaks; a lack <strong>of</strong> scientific support from government and agricultural service providerswas noted, as was the absence <strong>of</strong> a formal monitoring programme. Despite theseconstraints producers reported that if detected in the primary stages, and appropriatetreatments applied, mortalities may be avoided. Furthermore, producers reported thatwhere fish receive proper nutrition, resulting largely from adequate access to wastewater,the effects <strong>of</strong> disease are minimised.27
4.9. Chemical applicationsLime is generally applied to the sediments during fishpond preparation to kill pathogens,predators and trash fish that may harbour disease; lime is also applied to the water prior tostoking to reduce turbidity. Furthermore, where there is a history <strong>of</strong> disease outbreaks limeis used in conjunction with potassium permanganate for the regular treatment <strong>of</strong> pondwater. Roughly 82% <strong>of</strong> respondents reported employing this management strategy,however, <strong>of</strong> these farmers, 46.4% reported using other treatments. Chemicals employedwhen fish show visible disease signs include terramycine (oxytetracycline) and metacid(methyl parathion). Treatments are usually purchased from retailers in local markets, whoalso provide advice concerning the appropriate compound and application rate, however,rarely do they have scientific training, the materials or specimens to make valid diagnosesor a complete understanding <strong>of</strong> the factors contributing to the disease outbreak.Consequently, disease diagnosis and identification is largely based on guesswork andconsultation with other producers having experience <strong>of</strong> similar problems. Of those farmersinterviewed 17.9% reported that no chemical treatments were employed on their farms.4.10. Labour arrangements and unionsEmployment opportunities associated with PU aquaculture have been cited as one <strong>of</strong> themajor reasons why the system is worthy <strong>of</strong> protection. Reports have suggested that 8,700people are directly employed as labourers to assist in the operation <strong>of</strong> the fisheries (CRG,1997). Furthermore, it has been proposed that the operation <strong>of</strong> these largely commercialaquaculture systems sustains several thousand jobs in allied support activities such as thesupply <strong>of</strong> inputs, including seed, and the marketing <strong>of</strong> produce. As with other examples <strong>of</strong>PU farming, it was envisaged that work in these systems would enable recent migrantsfrom rural areas to find employment. Furthermore, it has been reported previously thatseveral groups <strong>of</strong> migrant labour have specialised skills, such as bamboo screen making,that ensure they are able to secure employment, although timing and duration may bevariable. However, despite the apparent benefit <strong>of</strong> PU aquaculture in providingemployment opportunities, arrangements at the Kolkata PUI are largely governed by thelabour unions. This suggests that lessons and recommendations drawn from an assessment<strong>of</strong> the current system concerning employment should be viewed cautiously and that wherelabour markets are more flexible, practical and financial considerations may dictate thatmodified employment arrangements should be adopted. Labour costs in the PU Kolkatasystem represent the greatest operating cost (CRG, 1997) whilst the majority <strong>of</strong> farmingsystems are reportedly not financially viable (Mukherjee, 1996), therefore, in the absence<strong>of</strong> enhanced production or higher fish prices, major restructuring <strong>of</strong> the labour force maybe required to sustain the system.Labour unions are well established in the fisheries <strong>of</strong> PU Kolkata and on behalf <strong>of</strong> thelabourers negotiate terms and conditions for both temporary and permanent employees.Daily wage rates, benefits, job specification, minimum employment days per year, leaveand the number <strong>of</strong> employees to be engaged are all governed by agreement between thelabour union and farm managers. However, terms and conditions vary with respect t<strong>of</strong>ishery size and key management aspects. The Dakshin 24 Parganas Zilla Bheri MazdoorUnion represents temporary labours who constitute the majority <strong>of</strong> the workforce in thefisheries, this union is affiliated to the CITU and largely dictates the terms and conditionsfor employment in the fisheries. Periodically the unions and fishery managers meet and28
negotiate terms and conditions, however, a number <strong>of</strong> disputes over employment rightsresulted in a conflict resolution meeting between the union and managers. In 1992, a draftCode <strong>of</strong> Conduct was agreed at a meeting <strong>of</strong> the 24 Parganas Fish Producers Associationand district level union <strong>of</strong>ficials (Box 3).The majority <strong>of</strong> labourers are closely allied to party leaders and union representatives who,following consultation with the workforce, negotiate terms and conditions with members<strong>of</strong> the fish producer associations. Based on this arrangement, conditions such as thenumber <strong>of</strong> harvest days per year, minimum harvest quantity per day, and daily wage levelsare fixed; in many cases managers have also been forced to create full-time employmentfor labourers, thus ensuring they get a regular income. However, due to the strength <strong>of</strong>unions in the region, several managers reported that the prevailing terms and conditions arebiased towards the demands <strong>of</strong> the workers. Fisheries with an area below 1.3 ha do nothave to adhere to the Code <strong>of</strong> Conduct, therefore, all labourers employed by these farmsare casual employees and lack the security <strong>of</strong> a permanent position. Larger fisheries, dosometimes hire casual labourers to undertake specific tasks, however, it is difficult to judgethe frequency <strong>of</strong> such opportunities as such employment is usually in response toemergency situations, such as burst embankments.Box 3. Code <strong>of</strong> Conduct agreed between unions and fish producersThe size <strong>of</strong> a bheri has a bearing on wages paid to labourers and the rate at which labourers should beemployed, small bheries are classified as those between 1.3-13.4 ha, medium range from 13.4-33.4 andlarge bheries cover an area above 33.4 ha. Aquaculture-based production systems below 1.3 ha in size areexcluded from the ‘Code <strong>of</strong> Conduct’ as labourers working on operations <strong>of</strong> this scale are not unionised.Employment rates are based on the premise that bheries that are not required to pump wastewater require agreater number <strong>of</strong> labourers (one per 3 bigha or 0.4 ha) whilst those that pump wastewater to the pondsrequire less labour (one per 5 bigha or 0.7 ha). The number <strong>of</strong> harvest days and quantity <strong>of</strong> fish to bemarketed are fixed based on the area occupied by the bheri:Bheri area (ha) Harvest days per year Minimum harvestquantity (kg d -1 )Minimum productionrequired (t ha -1 y -1 )*1.3-4 - - -4-6.7 120-135 150-200 2.7-4.56.7-13.4 180 240 3.2-6.413.4-26.7 240 360 3.2-6.4>26.7 300 500-800 5.6*preliminary calculations demonstrate that some medium sized fisheries must achieve relatively goodproduction rates <strong>of</strong> 6.4 t ha -1 y -1 to meet the requirements <strong>of</strong> the Code <strong>of</strong> Conduct.Compensation should also be provided to labourers employed on fisheries over 26.7 ha at a rate <strong>of</strong> half theannual wage, whilst additional conditions state that labourers should only engage in one type <strong>of</strong> work andhave a minimum <strong>of</strong> six-month employment per year.Developed from Mukherjee (1996) and CRG (1997)Although many <strong>of</strong> the farm managers may consider the Code <strong>of</strong> Conduct restrictive, it canbe argued that terms and conditions set out in this agreement have largely been responsiblefor several <strong>of</strong> the key benefits attributed to PU aquaculture around Kolkata. Stipulating aminimum number <strong>of</strong> harvest days per year and minimum harvest quantity contributes tothe predominant stocking and harvesting strategy in the region, which in turn results in aconstant supply <strong>of</strong> small fish to urban markets. The small size <strong>of</strong> fish cultured means theyare affordable, and are generally sold in markets serving poor communities, whilst the year29
ound supply <strong>of</strong> fresh fish has benefits for food security in poor households. The consistentnature <strong>of</strong> stocking and harvesting also means that small-scale suppliers and traders areroutinely involved in servicing the needs <strong>of</strong> producers, and therefore receive regularcommissions or wages.Despite these benefits, producers face the same fixed employment costs, irrespective <strong>of</strong>production rates or price levels, therefore, a decline in either may threaten the financialviability <strong>of</strong> the farm. The fixed term nature <strong>of</strong> employment arrangements also means thereare few incentives for labourers to contribute to achieving higher production or enhancingthe quality <strong>of</strong> fish produced. The introduction <strong>of</strong> practices such as pr<strong>of</strong>it sharing or bonusescould contribute to enhanced production, better returns for managers and employees, morefish for sale in urban markets and greater employment opportunities in associatedactivities. Although some managers did consider the specified employment rates per unitarea high, it was noted during other project work that some co-operatives reportedlyprovided employment for larger numbers (Edwards, 2001). The caveat concerningpumping in the Code <strong>of</strong> Conduct and its influence on employment rates is also significantin light <strong>of</strong> proposed development initiatives. Renovation <strong>of</strong> the canal network feeding thefishponds and establishment <strong>of</strong> secondary pumping stations to enhance wastewaterdelivery may mean more fisheries are required to engage one employee per 3 bigha (0.4ha); this could almost double the number <strong>of</strong> people employed by these fisheries.Furthermore, added labour costs may negate any saving achieved through not pumping.4.11. Employee livelihoodsBased on survey outcomes it is possible to identify several categories <strong>of</strong> labour associatedwith the various stages <strong>of</strong> fish production in PU ponds managed for wastewateraquaculture (Table 4.9). Labourers employed directly to manage and maintain the bheriesand jheels include fishermen, who undertake the main work <strong>of</strong> netting, fish carriers, landcutters and several others who work cleaning grass or applying lime, fertiliser andmedications. The permanent workforce, which mainly lives on-site, consists <strong>of</strong> themanager and those engaged in net making, construction work, weed clearance, harvestingand cooking. Members <strong>of</strong> the permanent workforce earn ~Rs1,200 (£17) per month andreceive other benefits such as board and lodging, medical expenses and a small subsistencegrant; they are also entitled to 4 days leave per month. Casual labourers employed fornetting, desilting, guarding, transporting, net repairing and various other activities, usuallylive in villages adjacent to the ponds. General information concerning the location <strong>of</strong> thesevillages in relation to the fisheries was noted and in some instances arrangements madewith employees for further visits to the local communities to initiate the process <strong>of</strong> focusgroup and household interviews.Considering the gender <strong>of</strong> managers and labourers engaged in PU aquaculture, it was notedthat no fisheries were owned or taken on lease by women and that hardly any women wereemployed as workers. Women are present as members in some co-operatives andundertake activities such as weeding and transporting fish, however, in such cases womenare only permitted to work if no other members <strong>of</strong> their family are employed in thefisheries; labour unions make the final decision concerning the allocation <strong>of</strong> jobs. Furtherknowledge on the nature and outcomes <strong>of</strong> selected permanent and casual employmentopportunities associated with PU aquaculture will be collated during subsequent focusgroup and household interviews.30
Table 4.9. Primary livelihood strategies associated with PU aquaculture practiced on 56 farmsPrimary livelihood Permanent Casual TotalPermanentNetting 690 125 815Desilting 103 62 165Weed clearing 192 192Day guard 149 149Night guard 719 25 744ala staff 346 346Transportation 184 157 341Net repairing 50 50pata bona 15 15Total 2,383 434 2,8174.12. FinanceRegarding finance, the survey revealed that most managers, 57% <strong>of</strong> those surveyed,depended wholly or partly on dadan or advances from traders to finance their productionactivities. Such arrangements usually involved managers entering into agreements witharatdars (auctioneers). Loans are usually taken in the form <strong>of</strong> subsidised fish seed, with anundertaking that when the fish are harvested they will be marketed through the samearatdar, who will take some fish as repayment and a commission <strong>of</strong> 3% on the remainingfish for providing the initial loan. Finance in the form <strong>of</strong> private loans or credit wasreportedly used by 45% <strong>of</strong> respondents, whilst 43% utilised their own savings forinvestment. Only a small proportion <strong>of</strong> producers (~5%) reported that they made use <strong>of</strong>formal loans from banks, co-operatives or local government departments. A couple hadreceived loans from the DoF, although this usually depended upon prior involvement <strong>of</strong> thedepartment in developing a management plan for the fishery. Many <strong>of</strong> the participantsinterviewed (46%) reported using more than one source <strong>of</strong> finance for investment,however, the relative advantages or problems encountered with each requires furtherinvestigation.4.13. ConstraintsThe following section reviews the major constraints facing producers and discusses theknowledge required to address such problems, as well as opportunities to improve thesituation. Many <strong>of</strong> the issues outlined in Table 4.10 are mentioned frequently inconversations with farms in PU Kolkata, however, few attempts have been made toprioritise the major constraints based on the perceptions <strong>of</strong> farm managers. Based onoutcomes from the survey it is apparent that the most widely reported constraint isuncertainty concerning the supply <strong>of</strong> wastewater; 86% <strong>of</strong> respondents mentioned thisfactor and participants assigned it a mean rank <strong>of</strong> 1.1, which resulted in it being ranked asthe most important constraint. Factors contributing to this problem were discussed inSection 4.3.31
The second most important constraints, with overall ordinal ranks <strong>of</strong> 2.5, were “financialproblems” and “declining wastewater quality”, mentioned by 25 and 9 per cent <strong>of</strong>respondents, respectively. Aggregation <strong>of</strong> responses under a general heading <strong>of</strong> financialproblems means that it is difficult to specify whether these are due to poor financialreturns, high input costs, restricted access to credit and loans or other factors; therefore,further work on assessing the nature <strong>of</strong> these problems may be useful. Declining waterquality apparently affects fewer producers, and although quality may be a largelysubjective term, widely reported concerns relating to wastewater quality are reducednutrient status following the removal <strong>of</strong> cattle sheds from the city and industrialcontamination.Table 4.10. Constraints to PU aquaculture based on the perceptions <strong>of</strong> farm managers (n = 56)ConstraintProportion <strong>of</strong>respondentsaffected (%)Mean rankassigned byparticipantsOverallordinal rankUncertain wastewater supply 86 1.1 1Financial problems 25 2 2.5Declining wastewater quality 9 2 2.5Poaching 34 2.5 4Labour problems 30 2.6 5.5Siltation 23 2.6 5.5Management problems 5 3 8Poor road infrastructure 5 3 8Poor seed quality 2 3 8Limited access to electricity 9 3.2 10Disease 29 3.3 11Threat from land developers 7 4 13Law and order problems 4 4 13Inundation during flooding 2 4 13Declining production 5 4.3 15Transport problems 2 5 16Note: 5% <strong>of</strong> respondents were unable to identify specific constraints to productionPoaching was reportedly the second most widespread constraint faced by producers. Allfisheries employ night guards, and some also deploy day guards; <strong>of</strong> all the livelihoodssupported by PU aquaculture, guard duties account for the greatest number. It has beensuggested that fishery workers with low incomes sometimes steal fish from neighbouringfarms, and that residents from particular villages are renowned for poaching, however,there is no evidence to support this. Small-scale ‘poaching’ by some <strong>of</strong> the most vulnerablemembers <strong>of</strong> local communities may be vital to their survival and such activities are <strong>of</strong>tenoverlooked, however, other accounts suggest poaching in the area can be highly organisedand orchestrated by armed gangs. Constraints associated with ‘labour problems’ and‘siltation’ each received an ordinal rank <strong>of</strong> 5.5, these problems were mentioned by 30 and23 per cent <strong>of</strong> respondents, respectively. According to farm managers, labour problemsinclude unwillingness to work and forced employment by the unions, however, during thecourse <strong>of</strong> discussions some labourers remarked that inefficient management also representsa problem. Without some form <strong>of</strong> wastewater pre-treatment, the problem <strong>of</strong> siltation islikely to persist and gradually threaten the continued operation <strong>of</strong> the fisheries, however32
measures to control this problem may be difficult to implement and would likely requirethe support <strong>of</strong> all producers in the region. The cost and logistical problems <strong>of</strong> renovatingthose fisheries already badly affected by siltation are also likely to be prohibitive. Thepossible synergy between de-silting the fisheries and filling land for urban development isdiscussed in Section 7.1.Management problems were mentioned by a small proportion <strong>of</strong> respondents (5%), andreceived an overall ordinal rank <strong>of</strong> 8, however, further information is required to assess thenature <strong>of</strong> these. Poor road infrastructure was mentioned by a similar proportion <strong>of</strong> people,and also received an ordinal rank <strong>of</strong> 8. Poor seed quality was also assigned an ordinal rank<strong>of</strong> 8, although only mentioned by 2% <strong>of</strong> respondents. Limited access to electricity was <strong>of</strong>concern to slightly more producers (9%) but only received an ordinal rank <strong>of</strong> 10. One <strong>of</strong>the most common constraints, mentioned by 29% <strong>of</strong> respondents, was a problem withdisease affecting production, however, with an overall ordinal rank <strong>of</strong> 11, the severity <strong>of</strong>the problem appears generally low. However, where disease problems are present, even atlow levels, there is the possibility that management difficulties or slight environmentalperturbations may trigger a more severe or widespread outbreak. Only a small proportion<strong>of</strong> respondents mentioned the remaining problems, which were ranked 13-16; thussuggesting these may be localised and <strong>of</strong> generally low importance. During this phase <strong>of</strong>the interview, it was apparent that respondents were sometimes reluctant to discuss some<strong>of</strong> the more sensitive problems they may face, e.g. antagonism with local political activists,law and order problems and question marks over land entitlement and documents.33
5. PU horticultureDisposal <strong>of</strong> municipal solid waste is generally regarded as a significant problem by urbanauthorities. However, the tradition <strong>of</strong> organic waste reuse through horticulture in PUKolkata has meant that farmers have managed, and indeed subsidised, the disposal <strong>of</strong> asignificant proportion <strong>of</strong> solid waste generated by residents and businesses in the city. Thisarrangement has also benefited farmers in the area as municipal organic waste has beenless expensive than alternative inorganic inputs, and conferred additional benefits such asmaintenance <strong>of</strong> soil quality and suppression <strong>of</strong> pests.The origins <strong>of</strong> PU horticulture exploiting municipal waste were described in Box 1. Dhapastill constitutes a centre for horticulture in PU Kolkata, although a number <strong>of</strong> factors arereportedly constraining this practice. Horticultural production during the 1960s wasestimated at 56,000 t y -1 , today the daily supply <strong>of</strong> vegetables to urban markets has beenestimated at 147 tonnes. However, despite its contribution to supplying urban markets withyear-round fresh produce, appreciation <strong>of</strong> the benefits associated with PU horticulture andunderstanding <strong>of</strong> issues that threaten its viability is reportedly limited amongst urbancommunities. The objective <strong>of</strong> this survey phase was to describe the general nature <strong>of</strong>vegetable farming in the WRR and identify where further research might be appropriate. Itwas also anticipated that knowledge generated would assist in developingrecommendations for policy makers and PU natural resource managers, to safeguard andenhance this established farming sector.5.1. Scale and distributionThe current extent and location <strong>of</strong> horticulture in PU Kolkata may largely be attributed tohistorical factors relating to solid waste disposal from the city, as outlined in Box 1.However, other factors such as recent changes in access to solid organic waste andwastewater, competition from producers in other parts <strong>of</strong> West Bengal due to improvedcommunications; and the level <strong>of</strong> market demand are increasingly likely to influence thescale and distribution <strong>of</strong> PU horticulture. From the survey it is apparent that the majority <strong>of</strong>horticulturists interviewed (97%) were located in Tiljala, which includes Dhapa,Boinchtala and Dhalenda; the area around these villages has traditionally been the centrefor vegetable growing in the region.Of the 33 farmers interviewed, four had land holdings <strong>of</strong>
5.2. Management patternWithout exception, all land farmed by participants in the current survey was under theownership <strong>of</strong> the KMC, <strong>of</strong> the 33 farmers interviewed, 20 had taken their lease directlyfrom the KMC, whilst 13 had taken on land which had been sub-let by one or moreintermediaries. As a condition <strong>of</strong> the lease, which usually lasts for a single year, farmersare only permitted to undertake agricultural activities, and do not have rights to sell theland or use it for other purposes. Such short-term arrangements result in feelings <strong>of</strong>insecurity and uncertainty meaning farmers are less likely to invest time and money toensure the long-term future <strong>of</strong> the production system. Consequently, soil quality, both interms <strong>of</strong> structure and nutrient status is under threat; consideration <strong>of</strong> management impactson the wider environment, less; and investment in new technology and supporting services,e.g. improved solid waste and wastewater delivery mechanisms, enhanced marketingchannels or better extension services, severely limited.5.3. Solid organic waste applicationDuring the course <strong>of</strong> the last century, low-lying land surrounding Dhapa, Boinchtala andDhalenda was in-filled using solid waste from the city; solid waste was used subsequentlyto supply nutrients for growing vegetables. However, during the survey, around half <strong>of</strong> thefarmers interviewed (16) reported that they no longer exploit this nutrient source, insteadpreferring to use chemical fertilisers. Factors contributing to the decline in solid organicwaste exploitation include difficulty in ensuring continued access to inputs, decliningquality and the low price <strong>of</strong> some inorganic fertilisers owing to government subsidies.Three farmers interviewed reported that they had never used organic waste on their farms,although the factors behind this require further investigation.Access to organic waste inputs has reportedly been constrained due to the difficulties facedby truck drivers trying to deliver loads along narrow and sometimes poorly maintainedroads and paths servicing the vegetable growing areas. Financial incentives werepreviously employed by producers to ensure delivery <strong>of</strong> good quality organic waste,however, with growing competition from the recently commissioned composting plant fororganic matter, the farmers now find themselves unable to pay sufficient incentives tosecure regular deliveries. Where truck drivers do deliver loads <strong>of</strong> municipal solid waste, itfrequently has to be left some distance from the fields, meaning farmers have to arrange forcarriers to transport it by hand to the vegetable plots where it is required. This mayrepresent a significant cost to the producer, and considering the perceived decline inquality <strong>of</strong> solid waste inputs, many producers are reluctant to pay for this service. Prior tousing trucks to remove solid waste to the dumpsite, a light railway transported solid wastefrom the city to Dhapa; parallel tracks were used alternately to ensure a constant supply t<strong>of</strong>armers throughout the region, however, this system was discontinued in 1974. Aninteresting opportunity might be to investigate the possibility <strong>of</strong> renovating this solid wastetransport system, however, such a rehabilitation project would require careful assessmentand widespread consultation to ensure an equitable and appropriate outcome.Considering solid waste to which they have access, farmers perceive two key factors thatare contributing to a decline in its quality; the first is the greater proportion <strong>of</strong> nonbiodegradablematerial thrown out by city residents and the second is the fact that betterquality waste with a high organic content, e.g. from markets and food processing facilities,35
is taken preferentially to the organic composting plant where truck drivers receive apremium from the operators. The organic composting plant is also a joint venture betweenthe KMC and commercial operators, and as such truck drivers working for the KMC aremore inclined to transport waste to the plant.Problems <strong>of</strong> accessing solid organic waste outlined above appear considerable, however,despite these constraints, 14 respondents reported that they still rely on inputs <strong>of</strong> solidmunicipal waste to cultivate vegetables. This suggests that producers still regard solidorganic waste as a useful input to PU farming systems. Several advantages are reported forplots in which organic waste is routinely used: firstly producers are required to apply lessinorganic fertiliser, thus reducing costs and avoiding environmental problems associatedwith fertiliser wash-out; secondly, mulching facilitated through solid waste applicationshelps suppress weed growth and conserve soil moisture; thirdly, organic inputs helpmaintain soil quality, enhancing production and avoiding erosion. Based on theseobservations it appears reasonable to suggest that opportunities to safeguard continuedaccess, and where possible widening access, should be investigated.5.4. Irrigation strategyVegetable growers in PU Kolkata predominantly use water from jheels and fishponds tomeet their irrigation requirements; <strong>of</strong> the 33 farmers interviewed, 32 exploited these watersources, whilst only one relied on rainwater. All producers irrigating with water fromjheels and ponds routinely used pumps to extract the water and deliver it to their fields;however, in times <strong>of</strong> need, clay pots may also be used to carry water to the fields manually.Although producers reported using pumps, it is not clear if individual operators ownpumps, if several producers buy sets collectively or whether producers hire pumps to meettheir requirements. It would also be interesting to know how access to water resources inthe region is regulated, and if the owners or managers <strong>of</strong> the jheels and ponds demandpayment for extracted water. In the dry season jheels in the region are prone to drying andproducers either have to access alternative water sources or modify their cropping patternsto account for such water shortages.Combinations <strong>of</strong> solid organic waste and wastewater used by different producers in themain vegetable farming region have been described in detail (IWMED, 1999). In this studyit was reported that nine distinct combinations <strong>of</strong> waste resources could be identified andthat use patterns could largely be described based on geographical distribution (Figure 5.1).In areas a and g sewage water was reportedly used directly from the canals, although solidwaste was only used in area a. Other areas where solid waste was exploited included b, c,d, e and f although a distinction was made between the application <strong>of</strong> ‘fresh’ and ‘old’waste. Areas b and d received largely domestic wastewater, whilst areas c and e receivedwastewater containing tannery effluent, area f being rain-fed. Areas h and i did not receivesolid waste inputs and rainwater and wastewater-fed pond water were used for irrigation,respectively. Based on this characterisation <strong>of</strong> farms, it might be suggested that those usingwastewater directly (a and g), wastewater containing tannery effluent (c and e) and freshsolid waste (a, b and c) pose the greatest health risk to workers and consumers.Furthermore, where rainwater is used for irrigation producers are likely to be morevulnerable to drought, whilst producers exploiting solid organic waste and wastewater aremore likely to be vulnerable to changing access to these resources. Information presentedin Figure 5.1 could prove useful in targeting resources and future research.36
Figure 5.1. Distribution <strong>of</strong> vegetable cultivation practices in the Dhapa region based on use patterns <strong>of</strong> solid organic waste and wastewater (Source: IWMED, 1999)
5.5. Crop varieties cultivatedVegetable farmers in PU Kolkata cultivate a range <strong>of</strong> species and varieties, includingbottle, bitter and ridge gourds, lalsak and dhulisak (Amaranthus spp.), cauliflower, brinjal(Solanum melongena), radish and several recently introduced Chinese leafy vegetables.More than sixteen vegetables are commonly produced on PU farms and as many as 11separate crops grown annually; the selection <strong>of</strong> vegetables to be grown in each crop isdictated largely by the availability <strong>of</strong> water and organic waste. Due to prevailing soilconditions it is also common practice for farmers to simultaneously crop 3-5 varieties onthe same land. Cropping strategies generally follow a seasonal pattern based on successesand failures in past years. During the dry season it is common for farmers to cultivate leafyvegetables that can survive with a nominal amount <strong>of</strong> water.Anecdotal evidence suggested that growing cauliflowers shows the greatest potential interms <strong>of</strong> pr<strong>of</strong>it, although associated risks were not assessed. Maize cultivation is alsoreportedly increasing in the region although the reasons for this remain unclear.Innovations, particularly concerning the introduction <strong>of</strong> new varieties appear largely toresult from farmer led initiatives, no respondents reported receiving advice or assistancefrom local government departments or NGOs. Although not scientifically trained, farmersin the region have acquired significant knowledge through practical experience. However,the absence <strong>of</strong> ongoing support and training in the region means new entrants may not beable to readily adopt horticulture on vacant or accessible land, whilst existing producersmay be poorly equipped to cope with rapid change associated with urbanisation orunforeseen perturbations.5.6. Seed supplyOf the farmers interviewed, 30 purchased seed from the market, and for 16 respondentsthis was reportedly their only source <strong>of</strong> seed, the remaining 14 also prepared their ownfarm-saved seed. One farmer interviewed reportedly saved all the seed required forreplanting, purchasing none from the market. From the data collected it is not clear if thevarieties being cultivated dictate whether farmers have to buy seed from the market.Further investigation concerning the perceptions <strong>of</strong> farmers regarding the performance,production and disease resistance <strong>of</strong> farm-saved seed, as compared with seed purchasedfrom the market may also be useful. Helping assess prospects for improved seedmanagement, whether producers require more knowledge, or whether improved marketingchannels for seed would be beneficial. Farmers in the region generally bought and soldseed at Mathpukur market, however, data on the origins <strong>of</strong> seed in this market, and thenumber <strong>of</strong> farmers interviewed that sell seed there, is not currently available.5.7. Fertiliser use and applicationUntil recently, solid organic waste from the city was commonly the only nutrient sourceused to cultivate vegetables in PU Kolkata. Following composting in heaps along the fieldmargins, garbage from the city reportedly formed very good organic manure. However,recent problems with declining quality and reduced access to solid organic waste have leadto an increasing number <strong>of</strong> producers turning to inorganic nutrient sources. Of the farmersinterviewed ~50% rely on chemical fertilisers such as urea, sona saar (calcium aluminium38
nitrate), super-phosphate and DAP (di-ammonium phosphate) to meet crop nutrientrequirements. Urea usage is relatively widespread due to a comparatively low cost, ascompared with other fertilisers, and the level <strong>of</strong> growth enhancement associated with itsapplication. The comparatively low cost <strong>of</strong> urea is also partly due to the governmentsubsidy, introduced with the aim <strong>of</strong> increasing agricultural output. The recent transition toinorganic fertilisers and apparent priority given to cost considerations suggests producersmay require further knowledge concerning the relative performance <strong>of</strong> different fertilisersin terms <strong>of</strong> yield and product quality. Further trials in the region concerning the impact <strong>of</strong>changing from largely organic to inorganic inputs on soil quality, disease resistance andpest and weed infestations would also potentially be useful. Opinions expressed by fellowfarmers and shopkeepers also reportedly influence the selection <strong>of</strong> fertiliser by producers.5.8. Pest and disease problemsProblems with pest infestations were reportedly widespread, effecting crops planted by97% <strong>of</strong> farmers questioned; <strong>of</strong> those effected, 2 reported severe problems whilst theremaining 30 reported moderate problems. Although many farmers in the region areexperienced vegetable growers, many were only able to give the local names <strong>of</strong> pests suchas sutulipoka (Epilachna sp.) and kestokalipoka (green leaf hopper). Limited knowledgeconcerning the scientific name and identification <strong>of</strong> pests and their developmental stagesrepresents a considerable constraint to selecting the most appropriate and specifictreatment. Evidently, from these responses it is apparent that the use <strong>of</strong> garbage appears tohave little effect on the perceived severity <strong>of</strong> pest problems encountered by producers.5.9. Pesticide use and applicationOf the 33 farmers interviewed, 32 reported using pesticides on their crops, only onereported not using such products. Pesticides such as Follidol® powder (methyl parathion)are routinely applied by dusting over the plants; several oil based pesticides e.g. Ustad®(cypermethrine-10) and Hildon® (endrosulphurece) are applied by mixing in water andspraying onto the crop. Due to limited knowledge concerning the type <strong>of</strong> pests encounteredand suitability and action <strong>of</strong> particular pesticides, producers frequently mentioned that theyfollow the advice <strong>of</strong> sellers or other farmers in selecting and applying pesticides. In manyinstances farmers reported using the same pesticide irrespective <strong>of</strong> the pest attacking theircrops. In certain cases we found producers applying Gamaxene® (hexachlorocyclohexane)to plants with the aim <strong>of</strong> preventing damage by ants. It was interesting to note that in someinstances, farmers did not use pesticides on vegetables used for their home consumption.However, further investigation would be required to assess whether the reason for this wasconcern over the likely health effects <strong>of</strong> pesticide residues or the fact that farmers were notworried about the quality and appearance <strong>of</strong> vegetables for home consumption.5.10. Labour, livelihoods and genderLabourers are employed on a casual basis depending on the availability <strong>of</strong> labour from themanager’s own household and workload; during busy periods <strong>of</strong> planting and harvestingmore labour is likely to be employed. Having completed work on their own land, farmerswith small land holdings sometimes find employment as labourers on neighbouring plots to39
earn extra income. The casual nature <strong>of</strong> the labour force means that a union has not beencreated to represent them. Agricultural labourers generally reside in villages adjoiningregions where horticulture is practiced, although a number live in the bustee or slum nearMathpukur market. Labourers are generally employed to undertake specific tasks, such ascleaning and weeding, ploughing, garbage sorting, sowing, harvesting and transporting thevegetables to Mathpukur and Choubaga markets. From wealth ranking in the first projectworkshop it was apparent that casual agricultural labourers are amongst the poorest groupspresent at the Kolkata PUI, furthermore, the casual and unpredictable nature <strong>of</strong> theiremployment also makes them some <strong>of</strong> the most vulnerable.With respect to gender, it was observed that both men and women were employed asagricultural labourers. Based on informal discussions it was apparent that many womenwho worked in the fields were largely responsible for supporting their families; <strong>of</strong>ten thiswas due to the absence <strong>of</strong> a partner through bereavement or separation, or the inability <strong>of</strong> ahusband or father to work due to ill health. When not engaged in agricultural labouring,many <strong>of</strong> the women find employment as rag pickers at the local garbage dumps. Otheremployment opportunities in the region are severely limited, and resources and training todiversify livelihoods difficult to access. Declining horticultural activity in the region ordecreased demand for agricultural labour resulting from mechanisation could thereforehave significant negative impacts for many households, particularly those that are femaleheaded. During the survey it was apparent that female managers <strong>of</strong> plots managed forhorticulture were very much in the minority, although a few exceptions were found.5.11. FinanceAccess to finance for many farmers in the region appears to represent a potential constraintto production; <strong>of</strong> those responding to this question none accessed finance from banks, localgovernment departments or NGOs. The most common finance source, mentioned by 21respondents, was that <strong>of</strong> personal savings, however, more information on the nature <strong>of</strong>such personal savings, where they are kept or invested and the rates <strong>of</strong> return may beuseful in assessing relative financial performance and risks. Further informationconcerning ‘personal savings’, for example, if they are savings accumulated by individuals,households or families and how decisions are made concerning the allocation <strong>of</strong> savingscould potentially be useful. The second most common source <strong>of</strong> finance was a private loanor credit, mentioned by 18 respondents. If the loan is taken after mortgaging assets theinterest is 5%, but if the farmer has nothing to mortgage, the interest rate is 10%. Only onerespondent reported taking an advance from a dadan to finance his farming activities,however, the interest rate and repayment arrangements were not discussed. Furtherinformation <strong>of</strong> the comparative terms and conditions associated with different financeoptions may be useful in assessing the usefulness <strong>of</strong> working to provide alternatives. Fromthis study, however, it is apparent that horticulturalists are much less dependent on financefrom dadans, as compared with aquaculture producers.5.12. ConstraintsConstraints to horticulture identified by participants are outlined in Table 5.1; <strong>of</strong> the 11factors identified, concern over the inaccessibility <strong>of</strong> solid organic waste and difficultieswith its transportation were mentioned by the largest proportion <strong>of</strong> respondents (42%)40
Problems with insect pests, high fertiliser and pesticide prices and declining solid wastequality were each mentioned by 6% <strong>of</strong> respondents. Concerning the specific questionposed concerning insect and disease pests, a large proportion (97%) <strong>of</strong> respondents noted aproblem, although only two reported severe effects (Section 5.9). Responses recorded inTable 5.1 also demonstrate that when considered alongside other possible constraints e.g.inaccessibility to solid waste and limited access to finance, pest problems appear relativelyunimportant. High fertiliser and pesticide prices were also problematic for some producers,although the majority were reportedly unconcerned. Site-specific conditions and individualmanagement regimes may influence the need to apply fertiliser and pesticides. Therefore,further information would be required to assess why more farmers are not concerned aboutinputs prices, especially as 50% <strong>of</strong> vegetable growers now depend on inorganic fertiliser(Section 5.8) and all those providing information employ pesticides (Section 5.10).Each <strong>of</strong> the remaining four constraints were only mentioned by single farmers (3% <strong>of</strong>respondents), suggesting that these problems are not widespread and may be associatedwith specific features <strong>of</strong> the farms in question. Health problems <strong>of</strong> labourers were <strong>of</strong>concern on one farm, workers suffer from cuts, wounds or stomach problems, whilst accessto medical care is largely unavailable or expensive. During discussion <strong>of</strong> this topic thefarmer reported that most labourers were now used to such problems and had stoppedcomplaining. One farmer mentioned adverse chemical effects although no furtherinformation on the nature and severity <strong>of</strong> these impacts was recorded; further informationwould be required to state whether it was the crop, labourers or wider environment thatwas effected. Poaching was apparently much more problematic for managers <strong>of</strong> PUfishponds, perhaps due to the size <strong>of</strong> the ponds, and difficulties in monitoring activitiesover such large areas. Many vegetable producers engage night guards or watch over theirown and neighbouring plots, whilst casual labourers living nearby are also likely to bevigilant. Insecurity <strong>of</strong> land tenure was apparently not widespread, however, knowing thatall land holding in the area are under the ownership <strong>of</strong> the KMC, may mean farmers areresigned to having insecure tenure and consequently making management decisions basedon short term assessments. Some farmers that had migrated from other states, given thechance, would reportedly like to sell <strong>of</strong>f rights to their holdings to developers, however,local farmers wished to continue farming, as it represents the only accessible livelihoodstrategy.The practice <strong>of</strong> ‘garbage farming’ has been a major source <strong>of</strong> income and employment inthe Dhapa region for many decades, however, due to the constraints outlined and discussedabove, the majority <strong>of</strong> farmers considered their livelihoods threatened and believed that theland would not remain under vegetable cultivation for much longer.42
6. PU paddy farmingRice cultivation is widespread in West Bengal and forms an integral component <strong>of</strong> manyrural livelihoods, however, the scale and influence <strong>of</strong> Kolkata means that rice cultivationover 50 km from the city may be regarded as PU in nature. Demand from urban marketsinfluences the value <strong>of</strong> rice grown in much <strong>of</strong> West Bengal, many consumers also expressa preference based on price, as opposed to nutrition, taste or aromatic properties, andconsequently many farmers have changed from growing high quality indigenous varieties,to high yielding introduced strains. Flows <strong>of</strong> wastewater connect the rice producers to thecity; for many years nutrients entrained with this water used for irrigation have beenperceived as a benefit, however, increasing contamination and changing consumerperceptions may change this. This section aims to describe the nature and prevailingmanagement approaches used in PU rice production, and to elucidate some <strong>of</strong> the mostimportant constraints, as perceived by farmers.6.1. Scale and distributionOf the 22 producers interviewed, 13 were solely growing rice, whilst 9 were farmingpredominantly rice with some land given over to vegetable cultivation. Of those producingonly rice, 7 were farming less than 1.3 ha, 4 were farming 1.3-2.6 ha and 2 were farmingover 2.6 ha. Of those engaged in mixed farming, 6 were farming 0.26-1.3 ha, 2 farmed 1.3-2.6 ha and 1 farmed between 2.6-3.9 ha. All producers interviewed were farming rice ineither Sonarpur (12) or Bhangor (10); <strong>of</strong> those farming in Sonarpur, 9 were growing onlyrice, whilst 3 were also growing vegetables, in Bhangor, 4 were growing only rice and 6were also producing vegetables. Due to the relatively small sample size it is difficult to saythat mixed farms producing both rice and vegetable are more common in Bhangor.However, during discussions with farmers in the village <strong>of</strong> Tardah Kapasiti, it wassuggested that water scarcity during the dry season in Bhangor meant vegetables, requiringless water than rice, were grown during this period. In Tardah Kapasiti farmers are largelydependent on natural rainfall to sustain production, in such circumstances information onmore efficient rainwater harvesting and storage might be useful, although, existingpractices would first require assessment.Fragmentation <strong>of</strong> paddy fields occurs mainly as a result <strong>of</strong> land subdivision owing tomarriage and inheritance, and the acquisition <strong>of</strong> new land to extend traditional familyholdings, through redistribution under the Land Reforms Act (1955) and the purchase <strong>of</strong>vacant plots. Fragmentation was reported by ~50% <strong>of</strong> respondents who considered itproblematic owing to logistical and security difficulties. Anecdotal evidence suggests thatin the village <strong>of</strong> Nayabad, Sonarpur, several farmers manage large land holdings producingrice, however, no information is available concerning the relative efficiency andproductivity <strong>of</strong> such farms and whether they confer greater or lesser benefits to poorcommunities in the region.6.2. Management patternOf those farmers only producing rice, 5 managed their own land, 6 rented land owned bythe KMC and 2 rented KMC owned land, sub-let by intermediaries. The majority <strong>of</strong>farmers producing both rice and vegetables (8) owned the land they farmed, whilst only43
6.4. Fertiliser use and applicationFertiliser use in rice production is common practice with urea, super-phosphate andcalcium representing key inputs. Quantities employed depend on several factors includingrice and soil type, irrigation rate and plant growth; other factors such as the level <strong>of</strong> riskassociated with production and the cost and availability <strong>of</strong> fertiliser will also influence thetiming and level <strong>of</strong> application. Of the farmers interviewed, 6 used only inorganic fertiliserinputs, whilst 15 used both inorganic and organic nutrient sources. Organic inputs includedcow dung and compost, most <strong>of</strong> which was derived from household waste and by-productsfrom vegetable growing and processing.Based on past experience and site-specific characteristics, many farmers have developedthe capacity to assess the rate at which to apply organic and inorganic fertiliser to achievethe most effective results. However, with changing access to waste resources, particularlydue to the removal <strong>of</strong> cattle sheds from eastern Kolkata, knowledge concerning traditionalpractices becomes redundant and inappropriate, as reliance <strong>of</strong> inorganic fertilisers tosupply all plant nutrients increases. In some situations, ash was being used as asupplementary fertiliser, although it also reportedly helped reduce pest problems, whilstthe origins <strong>of</strong> this practice were not clear, it was mainly observed in the Tardah region.Rice farmers in PU Kolkata generally depend on advice from their neighbours concerningthe application <strong>of</strong> non-traditional fertilisers. Therefore, although there was reportedly atrend toward using relatively cheap inorganic fertilisers that produce immediate benefits, itis possible that application rates are sub-optimal, that excess nutrients are lost in run<strong>of</strong>f orthat potential impacts on soil quality following long-term inorganic fertiliser use are poorlyunderstood. One reason for the shift to inorganic fertiliser is that in India most fertilisersare highly subsidised, although some more so than others. Urea receives the highestsubsidy, and therefore farmers tend to apply it when a deficiency in plant growth isobserved, although it may not be the correct supplement. Where wastewater from canals isaccessible to farmers, they reported having to use less fertiliser, as compared with theirneighbours. Farmers also stated that if wastewater is used, only urea application is requiredto achieve good growth.6.5. Seed supplyPaddy seeds <strong>of</strong> varying quality are widely available in local markets, and many farmers,having fulfilled their own requirements <strong>of</strong>ten sell some seed at these markets. Of thefarmers interviewed, 13 reported using farm-saved seed, however, 6 noted that in roughlyalternate years they purchased seed from <strong>of</strong>f-farm sources. Where farm-saved seed is usedconstantly, these producers believed that the strain becomes weaker, yields decline andcrops become more disease prone. Seven farmers reported using only purchased seed; insome cases farmers were given seed by <strong>of</strong>ficials at the Block Office, this is theadministrative <strong>of</strong>fice for district subdivisions run by the State government. Access to seedwhen required and in sufficient quantities did not appear to be a problem for PU ricegrowers.45
6.6. Pest and disease problems and treatmentThe majority <strong>of</strong> farmers (19) reported experience <strong>of</strong> moderate problems with pests anddisease outbreaks, whilst only 3 reported severe problems. Some <strong>of</strong> the most commonpests affecting the rice crop were named as majra poka (gall midge), gandhi poka andjhalsa poka (leaf faller). In case <strong>of</strong> jhalsa poka, if pesticides are not applied in the initialstages the entire crop may be destroyed; leaves redden and appear burnt and finally theplant shrivels and dies. Although most farmers rely largely on their own judgementconcerning which pesticides to use and when to apply them, they sometimes take advicefrom either neighbouring farmers or people that sell the pesticides. Pesticides routinelyused by the farmers include Hildon® and Demachrome®.6.7. Labour, livelihoods and genderPaddy farmers in the region are not affiliated to the unions, however, most are members <strong>of</strong>the local Krishi Samabay (farmer co-operative). This organisation looks after the interests<strong>of</strong> agricultural labourers, making sure they receive a proper wage and that they are notexploited. However, labourers employed in the paddy fields are commonly engaged on acasual basis and therefore lack the security <strong>of</strong> a regular income. When employed the dailywage is around Rs50-70 for men and Rs40-50 for women. Labourers working for ricefarmers usually also have their own land, yet work in the fields <strong>of</strong> larger farmers to earnextra income. Labourers that work predominantly in the fisheries sometimes also engage inagricultural work during the paddy season.During the survey, very few women were reported to manage farms producing rice,however, many <strong>of</strong> the labourers engaged in activities related to paddy farming werefemale. Male agricultural labourers usually undertake activities such as ploughing, sowingand harvesting, whilst women are more commonly engaged in post-harvest work, threshingand drying the rice. Occasionally women were observed working in the field but this wasusually related to severe financial hardship, forcing them to engage in physically arduousactivities. Poor wages received by their spouse, bereavement or a husband leaving his wifewere given as possible reasons why women might face financial hardship, compellingthem to work in the fields.The majority <strong>of</strong> labourers reside in villages adjacent to the paddy fields with many livingonly a few minutes walk from the farms on which they work. However, in some instances,labourers reportedly travelled several miles from their villages to find work, staying intemporary accommodation until the end <strong>of</strong> their contracts. Some farmers also managedland some distance from their native village, and as a consequence it was suggested thatyounger generations were dissuaded from pursuing agriculture as a livelihood strategy,preferring to engage in more local activities. Where this situation arises an aging farmerwill <strong>of</strong>ten sub-let the land to others.6.8. FinanceThe range <strong>of</strong> finance sources available to paddy farmers is similar to horticulturalists.However, unlike the vegetable growers, two rice farmers were reportedly making use <strong>of</strong>loans from banks, local government departments or co-operatives. According to many46
producers bank loans are not popular, as it is difficult to access loans from sources such asthis, especially as most farmers don’t have land deeds to use as security. For rice growersthe most common source <strong>of</strong> finance was private loans and credit, however, in such cases,interest rates charged are usually around 10%, which is relatively high when comparedwith other finance options. To secure private loans it is <strong>of</strong>ten necessary for borrowers todeposit assets with the moneylender, otherwise the rate <strong>of</strong> interest may be increased.Where the loan is not repaid within the given time the borrower risks losing assetsdeposited as security. For most farmers harvest periods represent the only times when theremight be money available to invest in the production system, however, financial returns are<strong>of</strong>ten only sufficient to repay debts and purchase seed and fertiliser.6.9. ConstraintsDemand for rice in the region is strong, local people eat rice with two or three meals perday, whilst the huge area under paddy cultivation in West Bengal means prices are cheap,perhaps making rice more attractive than other cereals. Although prices might be low ascompared with other crops, average yields, relatively low input costs and limited barriersto entry, mean farming rice remains an attractive livelihood option. This is supported bythe fact that a significant area <strong>of</strong> PU Kolkata has been converted from aquaculture to paddyfarming. However, despite the growth in this agricultural sector, farmers undertakingpaddy cultivation around Kolkata face several constraints (Table 6.1).Seasonal water shortages were the most widely reported problem, noted by 68% <strong>of</strong> thosesurveyed; from Section 6.4 it is apparent that this problem is usually associated withfarmers that depend largely on rainwater for irrigation. A common solution to avoidingdependence on rainwater is to install a tube-well, enabling the farmer to extractgroundwater when required, however, this is costly and probably beyond the means <strong>of</strong>many, especially in the Tardah region. Farmers could form collectives to pay jointly for apump and its instillation, however, management, especially the scheduling and allocation<strong>of</strong> water may be difficult to co-ordinate. Improved approaches to rainwater harvesting andstorage may be more appropriate, but again will require some investment <strong>of</strong> resources onbehalf <strong>of</strong> both farmers and local government department or NGO groups.Limited access to finance was mentioned as a constraint to production by 45% <strong>of</strong>respondents. Farmers reported that this was a significant barrier to adopting moderntechnologies, however, the prospect <strong>of</strong> co-operative farming was regarded as a possiblestrategy to permit investment and enable members to benefit from economies <strong>of</strong> scale. Ingeneral, farmers thought that the return from paddy farming was not sufficient consideringthe level <strong>of</strong> time and money invested and the risks faced, however, many mentioned thatthey thought themselves incapable <strong>of</strong> doing an alternative job, or simply that to theirknowledge there were no other jobs available.Pest problems and price fluctuations were each noted as constraints by 14% <strong>of</strong> farmers.Issues relating to pest problems were outlined in Section 6.6, and from that discussion it isapparent that farmers would benefit from greater support regarding the diagnosing andtreatment <strong>of</strong> pest problems. Furthermore, knowledge concerning integrated pestmanagement approaches could potentially make a significant contribution to avoidingproblems, reducing expenditure on pesticides and safeguarding public, producer andenvironmental health.47
Farmers attributed price fluctuations to two main factors. A long-term decline in the value<strong>of</strong> rice was attributed to processes <strong>of</strong> globalisation, in particular cheap imports fromThailand, which have meant farmers no longer have access to the larger markets, andconsequently only find an outlet in local markets where the price is comparatively low.Secondly, seasonal fluctuation in the price <strong>of</strong> rice, associated with over-supply duringcertain periods <strong>of</strong> the year, were regarded as problematic as few farmers have the capacityto store grains successfully, and are instead forced to sell in depressed markets. Farmersalso noted that sometimes, due to the poor quality <strong>of</strong> their produce, they are unable toattain higher prices; farmers blamed quality problems on the varieties they cultivate andinability to adopt advanced paddy cultivation methods, due largely to financial constraints.Table 6.1. Constraints to PU paddy farming based on perceptions <strong>of</strong> farm managers (n = 22)ConstraintProportion <strong>of</strong>respondentsaffected (%)Ordinal rankSeasonal water shortages 68 1Limited access to finance 45 2Insect pests 14 3.5Price fluctuations 14 3.5Seasonal inundation <strong>of</strong> fields 5 5Note: 14% <strong>of</strong> respondents were unable to identify specific constraints to productionOnly one farmer mentioned seasonal problems associated with the inundation <strong>of</strong> land andproperty during the rainy season; his farm was situated in a flood prone area on particularlylow-lying land. To compensate for this problem the farmer outlined how, based on his ownexperience, he had modified his cropping pattern to avoid planting out when there was stilla risk <strong>of</strong> losing the rice crop due to excessive inundation.The nature and range <strong>of</strong> constraints identified by participants will probably change inresponse to various external forces, for example, modifications in legislation and policyrelating to PU natural resource management, variations in input or borrowing costs orchanging consumer perceptions. From the patterns <strong>of</strong> constraints reported it is alsoapparent that farmers in the same region may each face a different range <strong>of</strong> problems,largely depending on their personal circumstances and site-specific variables. In suchsettings, the most effective approach to solving existing problems and dealing withpotential future threats is to strengthen the capacity <strong>of</strong> farmers and local institutions toidentify, assess and address constraints. During discussions one farmer proposed that onereason why there is not more support for one another within the farming community wasthe fact that they are all poor. Financially, individual farmers in the region may berelatively poor, however, each farmer has their own knowledge and experience, andcollectively it may be that farmers in the region have access to the resources required toaddress many <strong>of</strong> the constraints they might face. The Krishi Samabay represents oneinstitution that may be able to represent rice producers and work toward consolidating andextending the existing farmer centred knowledge base. However, other local institutionsand organisations such as NGOs, CBOs, universities and local government extensionservices may also have important roles to play.48
7. Summary and emerging issuesOutcomes discussed in the previous three sections have related largely to responses byindividual farm managers. In general the findings agree with those <strong>of</strong> previous studies,whilst new knowledge concerning the range <strong>of</strong> constraints faced by managers should havean important role in guiding future research and more particularly, policy initiatives anddevelopment orientated work. An important aspect <strong>of</strong> the process reported here waswidespread research fatigue amongst participants, this is due partly to the failure <strong>of</strong> pastprojects to address constraints facing producers and partly due to the failure <strong>of</strong> researchersto communicate findings effectively to policy makers and development agencies.One useful outcome <strong>of</strong> the survey with managers has been further knowledge concerningthe number and general nature <strong>of</strong> people whose livelihoods depend either directly orindirectly on farming systems at the Kolkata PU interface. Dialogue initiated during thesurvey should also prove useful in gaining access to groups <strong>of</strong> labourers from poorcommunities. Outcomes from this work will be used to guide a more focused assessment<strong>of</strong> the benefits poor people derive from PU farming. Incorporating knowledge from boththe stakeholder workshop and farm manager interviews, selected poor groups will beidentified and representatives invited to participate in household and focus groupinterviews, permitting them to share perceptions <strong>of</strong> their livelihoods and discuss constraintsand opportunities.During the course <strong>of</strong> this survey, and as a result <strong>of</strong> discussions undertaken as part <strong>of</strong> thefirst project workshop and institutional assessment, it has been possible to identify someemerging constraints that may seriously threaten the viability <strong>of</strong> traditional farmingpractices in PU Kolkata (Table 7.1). Although many existing constraints have been welldocumented and are widely recognised, for example, insecure land tenure and industrialcontamination <strong>of</strong> waste resources, unforeseen problems may have much more severeimpacts. During the first project workshop the vulnerability <strong>of</strong> poor PU communities torapid change was highlighted, limited access to resources and knowledge mean it isparticularly difficult for such communities to plan for, and cope with, change.In the following sections the most significant emerging constraints to PU farming aredescribed; a number <strong>of</strong> other proposed development initiatives are also reviewed as theytoo may have unforeseen consequences that constitute potential threats. It is intended thatthis preliminary review will contribute to a more detailed assessment <strong>of</strong> the primaryconstraints and opportunities to livelihoods enhancement in PU Kolkata. Where possible,knowledge <strong>of</strong> potential constraints identified will be communicated to policy makers,development agencies and stakeholder groups, the objective being to increase theircapacity to plan and cope with these emerging problems.7.1. SiltationA widespread problem that affects all farmers in the region is siltation, both <strong>of</strong> the primaryand secondary canals and fishponds. Issues related to the problems <strong>of</strong> siltation werediscussed in Sections 4.3; from this it is apparent that the logistical problems <strong>of</strong> desiltingthe fishponds would be considerable. Furthermore, limited financial reserve and restrictedaccess to finance may mean producers are unable to initiate work on removing silt.Considering the scale <strong>of</strong> the problem it is probably true that without external assistance, for49
example s<strong>of</strong>t-loans or grants from the government or development agencies, the farmmanagers will be unable to address the problem.Table 7.1. Emerging constraints to the viability <strong>of</strong> farming systems exploiting wastewater in PU Kolkata andpotential management strategiesConstraintPotential management strategiesSiltation <strong>of</strong> canals and ponds - desiltation <strong>of</strong> canals and ponds, using sediment to enforceembankments and <strong>of</strong>f-site as fill for construction sites- primary effluent treatment to reduce suspended solids load enteringdrainage network and pondsDecreasing access to wastewater - renovate canal network and increase pumping capacity, permittingwastewater transfer to secondary canals servicing fisheriesIncreasing industrialcontaminationAdvanced wastewater treatmentplantDecreased access to and quality<strong>of</strong> solid organic wasteWastewater from new urbandevelopments- improved planning, discharge standard enforcement, treatment,HACCP and product monitoring- increase wastewater supplied to ponds or provide supplementarynutrients to sustain production- encourage separation at source to reduce inorganic content, andbetter co-ordinate waste distribution- re-engineer distribution network to accommodate new and existingflowsEmployee health problems - promote strategies to limit health risks, implement HACCPframeworkChanging consumer perceptions - extend HACCP to processors and retailers, monitor products toreassure public and provide consumers with guidance on storingand preparing products from PU farmsEdwards (2001) described possible synergies arising from the need for desiltation and thedemand from developers for fill to prepare land for urban developments. Indeed fishpondsmanaged by the Nalban co-operative society have recently been desilted to provide fill forpart <strong>of</strong> the planned Rajarhut new township development. Despite the potential <strong>of</strong> sucharrangements the logistical problems remain, much <strong>of</strong> the WRR is largely inaccessible toheavy pant and haulage vehicles, suggesting that it may be necessary to implement a widerinfrastructure programme, including road building, to facilitate the removal <strong>of</strong> sediments.Unfortunately, such infrastructure projects may be at odds with the objectives <strong>of</strong> localconservation groups who are reluctant to see any development that may disrupt theperceived ecological balance. Improved road access may also permit greater access to thelargely isolated villages in the WRR, which may in turn increase pressure for unplanneddevelopment. The need to renovate the canals and ponds obviously represents a pressingproblem for producers, but management <strong>of</strong> the underlying problem <strong>of</strong> high suspendedsolids loading in the wastewater will probably require individual managers to implementappropriate treatment strategies. An alternative approach would be to commission acentralised wastewater treatment plant, however, a number <strong>of</strong> technical and operationalconstraints may be associated with such a strategy; issues relating to centralisedwastewater treatment are discussed further in Section 7.3.50
7.2. Decreasing access to wastewater and declining qualityFurther to affecting production by decreasing the volume <strong>of</strong> water in fishponds, siltationalso prevents the effective distribution <strong>of</strong> wastewater in the secondary canal networkserving the farms. Uncertain wastewater supplies for aquaculture managers and seasonalwater shortages for vegetable and rice growers represent significant constraints. Indeedconsidering the seasonal nature <strong>of</strong> rainfall in the region (Figure 1.3) urban drainage waterhas, in the past, permitted farmers to cope with periods <strong>of</strong> natural water scarcity and tointensify and extend production into what may otherwise have been fallow periods.However, owing to problems <strong>of</strong> siltation, and ongoing conflict between the needs <strong>of</strong> theurban drainage authorities and the requirements <strong>of</strong> producers (Edwards, 2001), benefitsonce associated with access to wastewater are being reduced. Desiltation <strong>of</strong> the secondarycanal network would contribute to farmers regaining access to wastewater, however,renovation <strong>of</strong> the primary canals and upgrading <strong>of</strong> the pumping stations draining Kolkatawould be required to completely restore the system. An alternative approach beingproposed by the DoF would be to install secondary pumps to transfer wastewater from theprimary to secondary canals. However, this would increase energy consumption by what isregarded as a largely ecologically balanced system and also incur capital costs and demandresources for operation and maintenance.Better co-ordination by farmers in the region could contribute to the more effectiveoperation <strong>of</strong> the silted canal network, especially where the canal is used to both supply thefishponds with water and drain them. Through a collective effort by farmers in the region itmay also be possible to arrange for sections <strong>of</strong> the secondary canal network to be desilted,however, limited access to finance and insecurity <strong>of</strong> tenure appear to constrain investmentin such activities. Declining wastewater quality, both in terms <strong>of</strong> perceived nutrient levelsand greater industrial contamination, is also <strong>of</strong> concern to producers. During preliminarydiscussions with farm managers they reported that the nutrient status <strong>of</strong> wastewaterreaching their farms had decreased following the removal <strong>of</strong> cattle sheds from the city.Furthermore, increased per capita water supply and usage in the city may be diluting theavailable nutrients.Perceived declines in wastewater nutrient status suggest that modified managementstrategies may be required to optimise production efficiency, however, prior to such work,further assessment should be made to quantify the changing availability <strong>of</strong> nutrients.Contamination <strong>of</strong> wastewater with industrial effluents also affects the quality <strong>of</strong> theresource; the problem <strong>of</strong> tannery effluents has long been recognised, but effluents fromvarious other industries also present a serious threat. Ideally monitoring and enforcement<strong>of</strong> discharge standards should safeguard against contamination, however, the complexurban drainage system and the limited resources <strong>of</strong> the regulatory authorities meandischarged standards are not always enforced. Consequently, the onus falls on the producerto try and prevent contaminated produce from reaching the market, however, limitedknowledge concerning possible health hazards or appropriate strategies to minimisepotential risks mean producers are unable to safeguard against this.7.3. Ongoing and planned development initiativesDuring stakeholder meetings, institutional <strong>analysis</strong> and the initial project workshop, severalplanned development initiatives were identified that could potentially have a significant51
impact on poor livelihoods at the Kolkata PU interface. State authorities plan to relocatetanneries from the eastern edge <strong>of</strong> Kolkata to a designated complex 20 km further east,whilst a new township to the northeast <strong>of</strong> Kolkata is planned for 1 million people. Majorprojects concerning urban planning and development are also being implemented byvarious State level authorities with external loan and grant aid assistance. The CEIP projectfunded by the ADB and DFID, to be executed by the KMC and DoIW aims to ‘… improvethe welfare and well being <strong>of</strong> the people <strong>of</strong> Calcutta, especially the poor, though animproved urban environment, equitable access to municipal services, and more effectivemunicipal management’ (ADB, 2000, p. ii). Each <strong>of</strong> these planned initiatives is describedbriefly below and potential impacts on poor PU livelihoods discussed.Tanneries relocationDuring the 1990’s awareness and concern regarding the discharge <strong>of</strong> tannery effluents toPU Kolkata increased significantly, as a consequence it was proposed that the tanneriesshould move to a dedicated facility further from the city. However, despite setting up theCalcutta Leather Complex (CLC) and a ruling by the Supreme Court <strong>of</strong> India (1996)ordering the closure <strong>of</strong> tanneries close to city, discussions with stakeholders suggest thatnone <strong>of</strong> the estimated 500 individual tannery operations have relocated. Although plans tomove the tanneries to a centralised complex, where the needs <strong>of</strong> operators can be met moreeffectively and waste discharges more easily managed, appear reasonable, a number <strong>of</strong>concerns have delayed the process. Operators have particular concerns: the lack <strong>of</strong> nearbyhousing to accommodate the considerable workforce; perceived law and order problemsthat may make the transfer <strong>of</strong> money and goods unsafe; increased government scrutiny;and the costs and inconvenience <strong>of</strong> moving further from the city and their traditionalcustomer base. The treatment <strong>of</strong> effluents originating from the CLC was widely regardedas one <strong>of</strong> the key benefits, helping reduce levels <strong>of</strong> industrial contamination in the PUenvironment and WRR. However, due to poor planning, it has been reported that acommon effluent treatment plant will not be commissioned until two years after thecomplex becomes operational. There is also concern that if the planned effluent treatmentplant is not well designed and maintained that pollution, particularly heavy metals, willagain result in public and environmental health concerns.Rajarhat townshipFigure 7.1 shows an outline land-use plan for Rajarhat. This development, covering 2,750ha, will include commercial and business districts and housing for an estimated 1 millionpeople, whilst open spaces to encourage wildlife and recreation will cover 1,310 ha (Anon,1995). Although the township is outside the WRR, a development on this scale, with anassociated increase in groundwater abstraction and run<strong>of</strong>f and wastewater discharges islikely to disrupt the local hydrology. Furthermore, it is proposed that Rajarhat wastewatercould be discharged to the WRR, augmenting recent declines in wastewater flows fromKolkata. However, where Rajarhat wastewater has different characteristics, such asnutrient or pathogen loadings, to that from Kolkata, farmers may be required to adjust theirmanagement practices to maintain the quantity and quality <strong>of</strong> production. Modifying thecanal network to convey Rajarhat wastewater to the WRR may also conflict with theexisting drainage pattern, possibly demanding construction <strong>of</strong> a separate canal system orthe diversion <strong>of</strong> Kolkata wastewater to areas outside the WRR for reuse or to the KultiRiver for discharge. A positive aspect <strong>of</strong> the Rajarhat development is the possible use <strong>of</strong>silt from fishponds as construction fill, an issue discussed above.52
Figure 7.1. Outline plan for Rajarhat covering an area <strong>of</strong> 2,750 ha and bordering the northern boundary <strong>of</strong> the WRR (Source: Anon, 1995)WRR
Advanced wastewater treatmentAlthough largely focused on urban communities, in the initial CEIP project report theobjective and scope, under point (i) emphasises the need to ‘improve the environment inthe outer areas <strong>of</strong> Calcutta‘ (ADB, 2000, p. ii). Consequently, as part <strong>of</strong> the projectengineers are proposing to construct an extended aeration wastewater treatment plant toremove potentially harmful substances from wastewater flowing through PU Kolkata.However, treatment using this process is likely to remove a significant proportion <strong>of</strong> thenutrients present in the wastewater, whilst pathogen removal may be variable.Consequently, access to nutrients by producers is likely to decline, whilst using more waterto deliver the required nutrient levels to fishponds and irrigated agriculture will increasecosts and may increase risks from pathogen transfer and microbiological contamination.Under such circumstances, alternative management approaches involving feeds andfertilisers to sustain production may become appropriate, however, the strong position <strong>of</strong>labour unions makes changes to management practices problematic and may requirenegotiation with unions, retraining <strong>of</strong> labour, etc.Bioeconomic modelling could provide an insight concerning likely impacts <strong>of</strong> changingwastewater quality or modified farming practices on production and financial returns,enabling producers to refine their management and providing knowledge to informinfluential labour union bosses. The model may also be employed to assess likelymicrobiological impacts <strong>of</strong> alternative wastewater application strategies. The contribution<strong>of</strong> a multi-disciplinary stakeholder committee, including labour union representatives, inguiding research could be crucial in facilitating the assessment <strong>of</strong> strategies to enable theequitable implementation <strong>of</strong> such changes. Furthermore, results <strong>of</strong> such research are morelikely to be implemented having been sanctioned and overseen by union representativestogether with other stakeholders.A question remains as to whether extended aeration is an appropriate treatment process forwastewater valued as an input to farming systems. Mara, Edwards, Clark and Mills (1993)described a lagoon-based treatment approach that optimised pathogen removal whilstlimiting nutrient retention; such a strategy may be more appropriate for Kolkata. In theCEIP report Appendix E (ADB, 2000a, p. 47) the authors note that the current quality <strong>of</strong>some receiving waters in the WRR is below that anticipated for ‘wastewater that would bedischarged as a result <strong>of</strong> the project improvements.’ Despite recognising that ‘A balancemust be struck in Project design so that dangerous substances, including toxics andpathogens, are removed from the wastewater, while maintaining the organic contentrequired to support the fisheries and agriculture’ (ADB, 2000a, p. 47), it is noted in thefollowing sentence that ‘the overall design concern must be ensuring that wastewaterdischarged to the ECW is <strong>of</strong> sufficient quality to protect public health and surface andgroundwater quality.’ From the discussion above it appears that further work on therelative merits <strong>of</strong> extended aeration, treatment lagoons and other options is critical to betterbalance health and environmental concerns with the nutrient requirements <strong>of</strong> producers,ensuring that the treatment strategy implemented is equitable.Expanding capacity at the organic composting plantVegetable farmers surveyed described how changing access to municipal solid wasterepresents a significant constraint to production, and issues relating to this were discussed54
in Section 5.3. However, from the CEIP report it appears that capacity at commercialorganic composting plants at Dhapa is planned to rise from the current 700 to 1,850 t d -1(ADB, 2000, p. 15). This would probably result in a further decline in the quality andquantity <strong>of</strong> solid waste to which PU farmers can gain access. Where the organic content <strong>of</strong>available waste is low, producers may have to purchase greater amounts <strong>of</strong> unprocessedmaterial to maintain production, whilst also increasing expenditure on associated transportand waste handling and sorting costs. Furthermore, reduced access to solid waste and ashift to inorganic fertiliser may have negative impacts on soil quality and permitcolonisation by weeds; consequently research on enhanced management practices may berequired to mitigate against such negative outcomes. In the CEIP report it is noted thatcompost produced as a result <strong>of</strong> increased capacity at commercial plants in Dhapa wouldhave a market value estimated at Rs6.3 million ($144,828) (ADB, 2000, Appendix 13,para. 5). However the value <strong>of</strong> the unprocessed organic waste used in the compost to poorfarmers in the region may well be significantly higher.Closing Dhapa and other landfill sitesActivities relating to improving municipal waste management planned for the CEIP projectwill focus on ‘segregation <strong>of</strong> waste at source, effective collection <strong>of</strong> the various wastes,and disposal in an environmentally safe manner’ (ADB, 2000, p. 15). The report alsodescribes how the waste management strategy includes provision for ‘… an integratedhazardous waste management facility developed at the Dhapa landfill site’ and that ‘Thefacilities will be equipped with adequate leachate collection and treatment’ and ‘Nonplasticbiomedical wastes will be incinerated at Dhapa’ (ADB, 2000, p. 15). However, it is alsonoted that the development programme will close <strong>of</strong>f the existing Dhapa and Noaparalandfill sites to trash sorters and that approximately 655 people will lose their livelihood(ADB 2000, Appendix 10, para. 4). Provision has apparently been made to find alternativeemployment for those displaced, however, the fact that people had to sort trash for theirlivelihood suggests that alternative livelihood options in the region are limited. It shouldalso be recognised that there may be social problems, including a stigma associated withrag-picking, that could making finding alternative employment difficult.7.4. Public health concernsPublic perception and food safety issues may be critical to continuing consumer acceptance<strong>of</strong> products from PU farms. Furthermore, safeguarding the health <strong>of</strong> poor labourers maymake a significant contribution to enhancing their livelihoods and those <strong>of</strong> their families.Although focused on fish farming, the following section highlights problems <strong>of</strong> workingon PU farms and outlines some <strong>of</strong> the hazards <strong>of</strong> reusing waste resources, many <strong>of</strong> whichare common to workers growing vegetables and rice. However, when reusing solid wasterisks from cut injuries and exposure to biomedical and other hazardous waste may begreater.7.4.1. Epidemiological evidence from fishery workersEpidemiological data presented in Table 7.2 demonstrates that workers employed on fishfarms managed for wastewater aquaculture experience a range <strong>of</strong> health problems.55
However, there do not appear to be notable differences when compared to health problemsencountered by a control group also engaged in aquaculture, but where wastewater was notused.Table 7.2. Epidemiology <strong>of</strong> workers employed in wastewater aquaculture and a control populationHealth problem Rahara (%) Salt Lake (%)Kalyani (%)(control)Diarrhoea 40 34.5 33.3Fever 33.3 31 38Cough and cold 50.3 58.6 76.8Cut injury 40 17.2 38Sore eye/redness 16.7 6.9 19Skin ulcer 10 - -Itching skin lesion 40 75.9 57.7Other skin complaint 13.3 - 14.3Jaundice 3.3 - 4.8Dyspnoea/respiratory disease 20 13.8 28.6Worm expulsion 30 44.8 57.7*3 month study; 1 year study (Source: Bhowmik, Chakrabarti and Chattopadhyay, 2000)From worm expulsion data presented in Table 7.2 it appears that pathogen levels arehighest in the control group, however, findings from stool sample <strong>analysis</strong> shown in Table7.3 support a different conclusion. Round worm (Ascaris lumbricodies) were present instool samples from 25% and 14% <strong>of</strong> people surveyed in Salt Lake and Rahara,respectively, however, were absent in the control population. Low levels <strong>of</strong> Enterobiushistolytica (causing amebiasis) 4% in both Rahara and Salt Lake, were also present in thepopulation engaged in wastewater aquaculture, but absent from the control group.Furthermore, although present in 25% <strong>of</strong> the control population, Giardia lamblia (causinggiardiasis) was recorded in 86% <strong>of</strong> samples from Slat Lake and 89% from Rahara.Table 7.3. Prevalence (%) <strong>of</strong> pathogens in stool samples from fishery workers from locations shownHealth indicator Rahara (%) Salt Lake (%)Kalyani (%)(control)Hook worm - - -Round worm (Ascaris lumbricodies) 14 25 -Giardia lamblia 89 86 25Whipworm (Trichuris trichura) - - -Pinworm (Enterobius vermicularis) 18 40 10Entamoeba histolytica 4 4 -(Source: Bhowmik, Chakrabarti and Chattopadhyay, 2000)The prevalence <strong>of</strong> Enterobius vermicularis at 18% and 38% was also higher in the SaltLake and Rahara populations as compared with 10% for the control; the higher prevalence<strong>of</strong> this pathogen in the Rahara population indicates that a contributing factor, other than56
wastewater reuse, influenced the level <strong>of</strong> infection. Bhowmik, Chakrabarti andChattopadhyay (2000) noted an absence <strong>of</strong> hookworm in the populations tested, this issignificant as this pathogen can cause severe problems for communities engaged inwastewater reuse.More general assessment by Bhowmik et al. (2000) <strong>of</strong> the health <strong>of</strong> workers engaged inwastewater aquaculture, through assessment <strong>of</strong> disease symptoms related to nutritionaldeficiencies, revealed the presence, at low levels (
emains unclear, possible explanations may include cultural and socio-economicdifferences.Table 7.5. Prevalence <strong>of</strong> substance abuse amongst fishery workers for sites shownSubstance Rahara (%) Salt Lake (%)Kalyani (%)(control)Smoking 63 62 52Chewing tobacco 40 31 19Ganja 10 25 -Intravenous drugs - - -Snuff - 4 -Alcohol 53 35 19Nil 7 17 33(Source: Bhowmik, Chakrabarti and Chattopadhyay, 2000)7.4.2. Consumer health risksGenerally good hygienic practice and food preparation by Bengalis has been proposed asone mitigating factor reducing the risk <strong>of</strong> food-borne illness from aquatic products.However, with a growing immigrant population in both urban and PU Kolkata, dependenceon such cultural facets may no longer be adequate. Therefore, a public informationexercise, at markets and in the mass media, to inform consumers <strong>of</strong> general food safetyissues, particularly the storage and preparation <strong>of</strong> aquatic products, could have a significantimpact. Furthermore, where management practices are modified due to changing access towaste resources, health risks associated with traditional farming practices may changesignificantly as prior safeguards, precautions and mitigating factors are rendered obsolete.Further work should be undertaken to quantify the health risks associated with variousproducts from PU farms in the region. Not only would this contribute to safeguardingpublic health, but also contribute to reassuring consumers regarding the safety <strong>of</strong> productsfrom these systems. A major shift in consumer acceptance <strong>of</strong> products from PU productionsystems, irrespective <strong>of</strong> the actual health risk, could have severe implications forproducers.7.4.3. Safeguarding public, producer and environmental healthDevelopment and implementation <strong>of</strong> a HACCP (Hazard Analysis and Critical ControlPoint) framework for farms reusing solid waste and wastewater could make a significantcontribution to improving both the health <strong>of</strong> workers and food safety. Furthermore,HACCP could be used to identify changes in health risks associated with modifiedmanagement practices, and consequently opportunities to avoid such problems. Such aninitiative could also extend beyond waste management, to include other health and safetyissues at work, and possibly personal and household health. Considering the widespreadhealth problems experienced by workers, particularly those engaging in aquaculture (Table7.2 and 7.3), a programme to improve occupational health could significantly enhance theirlivelihoods. HACCP appears preferable to product monitoring due to the logistics <strong>of</strong>sampling and testing produce which is sent daily to market by the large number <strong>of</strong> PU58
producers, the complex and disparate distribution networks involved and the limitedcapacity <strong>of</strong> institutions with facilities to implement such a programme. Although desirable,several limitations have been suggested, constraining development <strong>of</strong> HACCP for smallscalefarmers, therefore, only by working together may producers be able to formulatemanagement plans that minimise risks to the environment, workers, local communities andconsumers. Furthermore, given the need to base HACCP on sound scientific principles, itis evident that local government agencies and NGOs would have important roles inmonitoring the system, identifying critical control points and assessing the magnitude <strong>of</strong>risks posed.7.5. Knowledge dissemination and exploitationKey constraints described in the previous sections, including siltation, decreased access towastewater (and solid organic waste) and declining quality, increased contamination,potential changes in wastewater treatment and distribution, excessive labour uniondemands, restrictive conservation measures, urbanisation, health problems and changingconsumer perceptions all represent possible constraints. Furthermore, although potentialmanagement strategies to mitigate such factors may be proposed, the consequences <strong>of</strong>untested approaches are not always predictable and may in turn create problems. Thelimited capacity <strong>of</strong> most farmers and households in PU Kolkata to pre-empt and plan formany <strong>of</strong> the emerging constraints means that traditional farming practices, and the poorthat depend upon them, are increasingly vulnerable. Initiatives to increase the capacity <strong>of</strong>local communities and farmers to assess and manage emerging and unforeseen problemsare therefore required; it is anticipated that knowledge from this initial review and futureproject activities could contribute to processes <strong>of</strong> awareness raising and empowerment.Producer associations and co-operatives represent potentially important recipients forproject outputs and hopefully such groups would be able to use this information t<strong>of</strong>ormulate strategic plans to address the key constraints identified. Another CBO that hasrecently emerged as an important voice for stakeholders in PU Kolkata is the Save WetlandCommittee. Impetus for the committee began to build when the owner <strong>of</strong> the Nalbanfishery attempted to sell, despite the land having been vested by the government. Duringthe ensuing dispute, the workers were made jobless and as a result decided to start amovement, with the objective <strong>of</strong> countering such moves in the future.On 26 th November 2000, numerous workers and local people, together with government<strong>of</strong>ficials, researchers and the Minister for Fisheries and Minister for the Environmentattended a meeting where a proposal was put forward concerning the formation <strong>of</strong> thecommittee; this was supported by all those present. During the meeting 27 people spoke tothose assembled and that evening, Mr Abdul Rashid Mullah (Headmaster, Tardah HighSchool) was elected President, with Mr Pitambar Das, a local leader, being elected VicePresident. Mr Tushar Ghosh was chosen as the Secretary. Representatives were alsoelected to fill the other posts on the committee. The meeting, attended by an estimatedtwenty thousand people, demonstrated the widespread concern felt by many differentstakeholder groups and the broad-based support for action.Since its formation, the committee has meet once a month, with a general meeting <strong>of</strong> 65people every three months; there is also an annual general meeting where anyone canparticipate. The core work <strong>of</strong> the committee is to stop encroachment <strong>of</strong> the fisheries and to59
prevent the illegal selling <strong>of</strong> vested land. Involvement <strong>of</strong> local people on the committeeensures that recent events requiring action are addressed in a timely fashion; one suchevent was the proposed Lakeland Project (see Edwards, 2001). Through quick recourse tolegal action the committee succeeded in stopping the development, and won the case byarguing that the proposed project would destroy both biodiversity and the livelihoods <strong>of</strong>people in the area. This has been probably the most notable achievement by the committee,whilst future aims include:- increasing the depth <strong>of</strong> fishponds in the WRR,- ensuring the proper supply <strong>of</strong> sewage to fisheries throughout the year,- safeguarding the income <strong>of</strong> 150,000 people from PU communities,- supplying electricity to all villages where fisheries are located,- declaration <strong>of</strong> the East Kolkata Wetlands as a national wetland area in accordance withthe Ramsar Convention,- categorising fishermen who fall below the poverty line,- providing proper housing and amenities for labourers.7.6. Future strategyResistance to further research may represent a significant constraint to testing enhancedmanagement strategies, such as those proposed in Table 7.1, and developing action plansthat meet the demands and expectations <strong>of</strong> stakeholders, particularly those poorly servedby existing approaches to policy formulation. To overcome this, prior to further research, itwould be advisable to consult with local stakeholders and target institutions to assist inboth assessing the existing knowledge base and to prioritise specific research areas. Suchan approach would engender greater ownership and may yield more valuable outcomes.Inappropriate and extractive research methods, poorly targeted investigations and thereplication <strong>of</strong> studies have further alienated stakeholders in PU Kolkata.Having noted the success <strong>of</strong> the Save Wetlands Committee, it appears that one strategy toavoid such problems would be to convene a steering committee to oversee the researchprocess. A multi-disciplinary committee, consisting <strong>of</strong> representatives from keystakeholder groups, could develop a research strategy for the PU region to address priorityissues, evaluate research proposals and communicate findings to appropriate policy makersand implementing agencies. The strategic perspective <strong>of</strong> the committee should ensureresources are targeted toward key development constraints and prevent replication <strong>of</strong>effort. Furthermore, approval from the committee may reassure participants thatknowledge generated would be used effectively to formulate policy and bring aboutsubstantive livelihoods enhancement. Additionally, the committee would be beneficial tostrategic development planning at the Kolkata PU interface more generally, providing apoint <strong>of</strong> contact for external agencies wishing to support research and development in thearea.60
Encouraging diverse stakeholder groups to participate on the committee would permit localagencies and institutions greater ownership <strong>of</strong> research undertaken and help avoid conflictbetween institutional bodies. The committee would command a strong position to promotecommissioning <strong>of</strong> research to address emerging threats to PU farming systems and tosafeguard livelihoods that may otherwise be vulnerable. However, despite its potential,such an approach would require broad-based support from stakeholders including policymakers, producers and local communities, and to achieve such support it may first benecessary to reach a consensus amongst these different groups concerning the objectivesand functioning <strong>of</strong> the committee. To further ensure that the research commissioned by thecommittee fits with the development aims set out by the Save Wetlands Committee, itwould be advisable to invite this body to nominate one or more members to sit on thepanel.It is anticipated that outcomes presented in this report will prove useful in helpingresearchers, local government departments and development agencies target resources onthe most significant constraints facing producers and the emerging problems that threatenthe viability <strong>of</strong> traditional farming practices in the region. Knowledge from this studyconcerning the role <strong>of</strong> labourers in operating, servicing and maintaining the PU productionsystems will also be used to guide future project activities, particularly the planned focusgroups and household interviews, to assess the importance <strong>of</strong> PU farming in poorlivelihoods.Acknowledgement: The project team expresses its gratitude to those farmers andlabourers who gave their time to participate in this survey and thanks them for sharing theirconcerns and opinions, giving the outcomes <strong>of</strong> this work greater depth and meaning.61
ReferencesADB, 2000. Report and Recommendation <strong>of</strong> the President to the Board <strong>of</strong> Directors on aProposed Loan to India for the Calcutta Environmental Improvement Project. AsianDevelopment Bank [unpublished report].ADB, 2000a. Focused Initial Environmental Examination. CEIP Report, SupplementaryAppendix E. Asian Development Bank [unpublished report].Anon, 1995. New Calcutta. Calcutta, India: Government <strong>of</strong> West Bengal [unpublishedpublicity brochure].Bhowmik, M.L., Chakrabarti, P.P. and Chattopadhyay, A., 2000. Micr<strong>of</strong>lora present insewage-fed systems and possibilities <strong>of</strong> their transmission pp. 71-77. In: Waste Recyclingand Resource Management in the Developing World. India: <strong>University</strong> <strong>of</strong> Kalyani andSwitzerland: International Ecological Engineering Society.Bunting, S.W., Kundu, N. and Mukherjee, M., 2001. Renewable natural resource-use inlivelihoods at the Calcutta peri-urban interface: a 1iterature review. <strong>Stirling</strong>, UK: Institute<strong>of</strong> Aquaculture [Working Paper].Calcutta High Court, 1993. Ruling for matter #2851 <strong>of</strong> 1992 D/-24-9-1992, PeopleUnited for Better Living in Calcutta (PUBLIC) vs. State <strong>of</strong> West Bengal, Umesh ChandraBannerjee, Presiding Judge. All Indian Review, Calcutta, pp. 215-232.CMDA, 1992. Calcutta Slum Improvement Project. Report (1991-1992). Kolkata, India:CMDACRG, 1997. East Calcutta Wetlands and Waste Recycling Region. Creative ResearchGroup, Calcutta [unpublished report].Edwards, P., 2001. Senior stakeholder meetings, Calcutta – 30 July to 6 August 2001.Bangkok, Thailand: Asian Institute <strong>of</strong> Technology [unpublished report].Edwards, P., 2002. Institutional Assessment: Reviewing Policies, Processes andStakeholder Positions at the Kolkata Peri-urban Interface. Bangkok, Thailand: AsianInstitute <strong>of</strong> Technology [unpublished Working Paper].Furedy, C., 1987. From waste land to waste - not land: the role <strong>of</strong> the Salt Lakes, EastCalcutta, in waste treatment and recycling, 1845-1930 pp. 145-153. In: The UrbanExperience: Calcutta. Calcutta, India: Riddhi.Ghosh, D. and Sen, S., 1987. Ecological history <strong>of</strong> Calcutta’s wetland conversion.Environmental Conservation 14: 219-226.Government <strong>of</strong> West Bengal, 1999. Economic Review. Calcutta, India: State PlanningBoard, Government <strong>of</strong> West Bengal.Gupta, K., 2000. Status and Future <strong>of</strong> the East Calcutta Sewage Fisheries. Calgary,Canada: <strong>University</strong> <strong>of</strong> Calgary [ME.Des thesis]62
IWMED, 1999. Pan and list 3 merged. Kolkata, India: IWMED [unpublished report].Kundu, N., 1994. Planning the Metropolis, a Public Policy Perspective. Calcutta, India:Minerva Associates Ltd.Milwain, G. 2001. Investigation into sustainable development and livelihood issues <strong>of</strong> thefish seed distribution network in West Bengal, India. <strong>Stirling</strong>, UK: <strong>University</strong> <strong>of</strong> <strong>Stirling</strong>[MSc thesis]Mukherjee, M.D. 1996. Pisciculture and the environment: an economic evaluation <strong>of</strong>sewage-fed fisheries in East Calcutta. Science, Technology & Development 14(2): 73-99.Naskar, K.R., 1985. A short history and the present trends <strong>of</strong> brackishwater fish culture inpaddy fields at the Kulti-Minakhan areas <strong>of</strong> Sunderbans in West Bengal. Journal <strong>of</strong> theIndian Society <strong>of</strong> Coastal Agriculture Research 3(2): 115-124.National Institute <strong>of</strong> Urban Affairs, 1988. State <strong>of</strong> India’s Urbanisation. New Delhi,India: NIUA [unpublished report].OnlineWeather, Climate guide for Calcutta, India. Website accessed on 24 th June 2002.http://www.onlineweather.com/v4/world/owac/AS/climate/Calcutta.htmlSom, N., 1987. Bustees, pavement dwellers and refugees <strong>of</strong> Calcutta pp. 154-167. In: TheUrban Experience: Calcutta. Calcutta, India: Riddhi.Supreme Court <strong>of</strong> India, 1996. Judgement on Writ Petition (Civil) No. 3227 <strong>of</strong> 1993 ‘MC Mehta versus the Union <strong>of</strong> India and Others’. New Delhi, India.Yasmeen, G., 2001. Urban agriculture in India: a survey <strong>of</strong> expertise, capacities and recentexperience. Cities Feeding People Report 32. Canada: International Development ResearchCentre.63
Appendix 1 <strong>Situation</strong> <strong>analysis</strong> questionnaire following pre-testingFishery managers questionnaire1. Date:2. Name:3. Police Station/Block:4. Village:5. Owner:6. Type <strong>of</strong> farming:7. Ownership Pattern: (a) own land (b) Leased land (c) Co-operative (d) Joint ownership8. (e)Any Other9. Size: a) Main fisheryb) Nursery pond/s10. Type <strong>of</strong> management or any other information about the ownership pattern.Inputs11. a) Source <strong>of</strong> waterb) Pump/other methods usedc) Amount per bigha12. a)type <strong>of</strong> fish feedb) brought from wherec) amount per bigha13. Type <strong>of</strong> fertilizers14. Information about sewage water used15. Fish Seed:Type From where brought (region and distance) Transportation(middlemen)i)ii)iii)iv)Other information about seeds including the quality and people involved in the work.16. LabourPermanent labourers who have been benefitedType <strong>of</strong> work No.i)ii)iii)iv)v)vi)vii)TotalAge< 20 years 20-40 years > 40 yearsM F T M F T M F TresidenceTotalMandays64
Any other information about the type <strong>of</strong> labour eg from which region, means <strong>of</strong>transportation etc.17. Casual labourersType <strong>of</strong> work Time <strong>of</strong> work Months they doworka)b)c)d)Where they live18. What do the casual labourers do otherwise?Part time/ whole time/ Others19. Other people who benefit directly from the workHowMonetary benefitsa)b)c)Rank importance wise20. Source <strong>of</strong> finance: a)b)c)20. Source <strong>of</strong> information: a)b)c)21. Any other information regarding the finance and information.22. Production:Typea)b)c)d)% <strong>of</strong> totalproductionDistance fromthe marketTransportation and the type <strong>of</strong> sellers23. How are you linked to the market sellers/ paikars?24. Regarding seeds and other inputs whose help do you take and how?25. Other information about the products, total production and market.26. Problems:Problems Rank Any other information about problemsi)ii)iii)iv)v)vi)vii)65
26. Map drawing: This was not asked anywhere keeping in mind the sensitivity <strong>of</strong> the area.27. Management, Infrastructure, Other facilities, Planning: NA.28. Timeline:29. The effects <strong>of</strong> urbanization30. Regarding your occupation what have been done by the local bodies related to youroccupation?Regarding your fisheryLabour relatedLocal CorporationLocal PanchayatAny other31. What has the Government done to solve your existing problems?32. The bodies which have come forward to solve your problems?Name <strong>of</strong> OrganizationPart it plays33. Do you think that because <strong>of</strong> the present condition <strong>of</strong> the wetlands the city <strong>of</strong> Kolkatafaces water logging?34. Do you support expansion <strong>of</strong> the city, which involves the destruction <strong>of</strong> the wetlands?35. If due to development present existing activities are destroyed how will it affect you?36. Are you associated with any <strong>of</strong> the bodies, which are fighting for the existence <strong>of</strong> thewetlands?37. Any other information other than the ones discussed which you would want to tell.38. How did you get the capital for investment? a) from bank b) private loan c) othersources39. Any comments about getting a bank loan?40. What is the interest for a private loan?41. Fish DiseasesLocal name When it usually occurs Prevention (is help received)KhataGaye PokaLege GhoshaPakhna pochaKankote sleshaRas panduJok laga41. Type <strong>of</strong> labourers NumberFishermenTransportGuardWeeding hands66
Farmer’s questionnaireDate1. Geographical regionVillagePolice Station/Block2. Total amount <strong>of</strong> landNumber <strong>of</strong> piecesHow far3. Owner <strong>of</strong> landRelation <strong>of</strong> land with farmer4. Water supply to landHow is it suppliedWhen5. What do your grow When How much6. SeedFrom wherePrice7. How do you cultivate?8. FertiliserWhether you get garbageAt what priceThe components you takeChemical fertilisersType Where from How much PriceOther organic fertilisers9. PestsName Time Affects which crop10. PesticidesType Bought from where Price How are they used11. LabourType Number Wage67
Whether unionisedWhat else do they do?12. FinanceFrom where do they get money?About ban loanInterest rateTime in which it must be given back13. Whether any organisation Govt. or otherwise ever helps14. Problems68
Appendix 2. Questionnaire coding system for data interpretationQuestion Description Column Code1 Serial number 12 Location 2 1. Bidhannagar (Salt Lake): Dhapa Manpur2. Tiljala: Dhapa, Boinchtala, Dhalenda, PaschimChoubaga, Choubaga3. Sonarpur: Chak kolar Khal, Karimpur, Jagatipota,Mukundapur, Atghara, Ranbhutia, Kantipota, Nayabad,Tihuria, Tardaha, Kumarpukuria, Goalpota, Khedhati,Kheadaha, Deara, Kharki, Bhagabanpur, Samukpota,Garal, Pratapnagar4. Bhangor: Tardaha Kapasati, Beonta, Hadia, DharmatalaPanchuria, Hatgachha, Kulberia3 Activities 3 1. fishery and jhils2. fishery with other related activities3. vegetable farms4. paddy fields5. mixed farming4 Ownership type 4 1. own land2. own land with joint management3. co-operative (registered)4. co-operative (not registered)5. owner-worker participatory6. leased-lane7. leased-land with joint management8. vested/CMC land9. sublets vested/CMC land10. incorporated company11. Government undertaking12. own & leased (vested)5 Holding size 5 1. 100 bigha6 Fragmented 6 1. yes2. no3. na.7 Water source 7 1. sewage canal2. jhils and ponds3. sewage canal & underground water4. rainwater5. rainwater & underground water8 Irrigationmethod8 1. gravity (without using pump)2. pump3. gravity and pump4. na.9 Garbage use 9 1. used69
2. not presently used3. na.10 Fish feed 10 1. mustard cake, mohua cake and lime2. leather milk and others3. hotel dust and others4. mustard cake, mohua cake, lime and others5. no feed used6. na.11 Fertiliser 11 1. only chemical fertiliser used2. chemical & organic fertiliser used3. no fertiliser used4. na.12 Seed 12 1. own produce2. bought from market3. both4. na.13 Fish stocksupply14 Type <strong>of</strong> fishstocked15 Fish disease &pests16 Medicine &pesticide use13 1. bought from agents2. bought directly3. both4. own spawn & from market5. na.14 1. spawn2. hatchlings & fingerlings3. both4. na.15 1. severely affects2. moderately affects3. not affected4. na.16 1. potassium permanganate & lime2. other chemicals & medicines3. none4. pesticides5. na.17 Crops grown 17 1. major produce Indian major carp2. major produce tilapia3. mixed species4. paddy5. vegetables6. paddy and vegetables7. na.18 Labour type 18 1. permanent2. casual3. casual & permanent4. na.19 Labour gender 19 1. male2. male & female3. na.20 Unionisedlabour20 1. yes2. no70
21 Financing 21 1. bank loan/ loan from Government/ co-operatives2. private loan/ credit3. dadan or advance4. personal savings5. private loan/ credit & dadan or advance6. private loan/ credit & personal savings7. dadan or advance & personal savings8. private loan/ credit & dadan or advance & personalsavings9. na.22 Assistance fromGovernment,NGO, etc.23 Landdevelopment24 Fish cultivationproblems22 1. yes2. no3. na.23 1. for2. against3. unsure24 1. uncertain sewage water2. labour problem3. declining production4. electricity5. transport6. poor seed quality7. poaching8. siltation9. disease10. financial11. law and order12. degraded sewage water13. management problems14. risk <strong>of</strong> land developers15. bad roads16. inundation17. no problem25 Vegetable &rice cultivationproblems25 1. inaccessibility/ garbage transportation2. insects3. seasonal water shortage4. price fluctuation5. high fertiliser/pesticide price6. health problems <strong>of</strong> workers7. poaching8. adverse chemical affects9. degraded garbage quality10. lack <strong>of</strong> finance11. seasonal inundation <strong>of</strong> fields12. problem <strong>of</strong> land security13. no problem71
Notes: