- Page 1 and 2: Australia’swelfare2013
- Page 3 and 4: The Australian Institute of Health
- Page 5 and 6: ContentsPreface ...................
- Page 7 and 8: AcknowledgmentsSteering committeeDa
- Page 9 and 10: Symbols$ Australian dollars (unless
- Page 11 and 12: xSection 1
- Page 13 and 14: 2Australia’s people
- Page 15 and 16: 1 Australia’s peopleAt a glanceWh
- Page 17 and 18: Age group (years)100+95-9990-9485-8
- Page 19 and 20: Long-term trends and projectionsThe
- Page 21 and 22: Based on the ABS’s medium-level g
- Page 23 and 24: The prevalence of disabilityIn 2009
- Page 25 and 26: FertilityIn 2011, a total of 301,61
- Page 27 and 28: Indigenous men and women are more l
- Page 29 and 30: Deaths per 1,000 population16014012
- Page 31 and 32: 1Box 1.3: Classification of geograp
- Page 33 and 34: As illustrated by Figure 1.7, which
- Page 35 and 36: Per cent3025All overseas-born2015No
- Page 37 and 38: 1.5 Where do Australians live?1As s
- Page 39 and 40: Table 1.2: Distribution of populati
- Page 41 and 42: Population growthNegative growth0%
- Page 43 and 44: Box 1.4: Statistical classification
- Page 45 and 46: Among one-family households, Indige
- Page 47 and 48: Table 1.5: Children living in famil
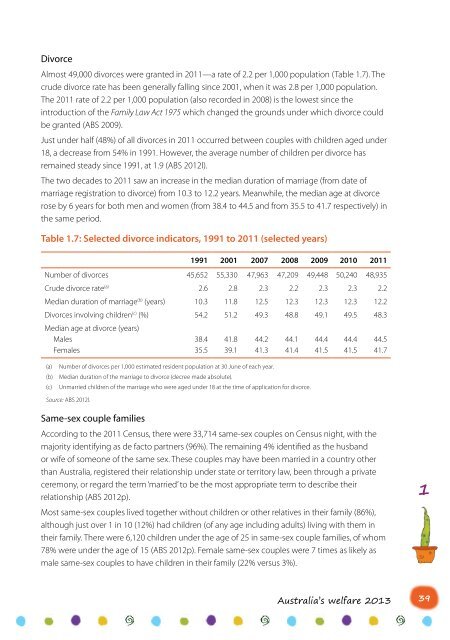
- Page 49: Table 1.6: Selected marriage indica
- Page 53 and 54: References1ABS (Australian Bureau o
- Page 55 and 56: 44Economic participation
- Page 57 and 58: 2 Economic participationAt a glance
- Page 59 and 60: 2.2 Participation in educationCOAG
- Page 61 and 62: Educational attainmentEducational a
- Page 63 and 64: Among those aged 25 to 64, the larg
- Page 65 and 66: In 2012, 1 in 4 people (25%) of pri
- Page 67 and 68: 2Box 2.3: Labour force concepts and
- Page 69 and 70: In the three decades to 2012, the l
- Page 71 and 72: For information on how labour force
- Page 73 and 74: In 2012, the majority (70%) of empl
- Page 75 and 76: The labour force underutilisation r
- Page 77 and 78: Box 2.5: International comparison o
- Page 79 and 80: Indigenous peoplePer cent1009080706
- Page 81 and 82: Fewer than half (39%) of all migran
- Page 83 and 84: Per cent504540One-parent families w
- Page 85 and 86: People who are homeless or at risk
- Page 87 and 88: Note that in this section, when the
- Page 89 and 90: Among couple-only and lone-person h
- Page 91 and 92: Comparisons between family types sh
- Page 93 and 94: $(’000)1,2001,0008006004002000015
- Page 95 and 96: Nil or
- Page 97 and 98: Table 2.9: Number of recipients of
- Page 99 and 100: 2Cai L 2007. Effects of health on w
- Page 101 and 102:
90Housing
- Page 103 and 104:
3 HousingAt a glanceHousing afforda
- Page 105 and 106:
Interest rates play an important ro
- Page 107 and 108:
National Partnership AgreementsFive
- Page 109 and 110:
3Variations in tenure by household
- Page 111 and 112:
Tenure across the life cycleHousing
- Page 113 and 114:
3.5 Housing occupancyWhile the numb
- Page 115 and 116:
Box 3.3: Key concepts relating to h
- Page 117 and 118:
Box 3.4: First home buyer trendsMor
- Page 119 and 120:
People with disabilityAn estimated
- Page 121 and 122:
3.7 Housing assistance in the priva
- Page 123 and 124:
While the majority (63%) of househo
- Page 125 and 126:
In the week ending 1 June 2012, mor
- Page 127 and 128:
Assistance typeAverage assistancepe
- Page 129 and 130:
At 30 June 2012, the total social h
- Page 131 and 132:
Social housing tenanciesAt 30 June
- Page 133 and 134:
Age group (years)75-7970-7465-6960-
- Page 135 and 136:
Between 2003-04 and 2011-12, the pr
- Page 137 and 138:
In 2011-12, two-thirds (68%) of new
- Page 139 and 140:
Per cent10090OvercrowdedAdequateUnd
- Page 141 and 142:
Per cent181614121086420152025303540
- Page 143 and 144:
Dwelling amenities and location of
- Page 145 and 146:
3Social housingAs detailed above, s
- Page 147 and 148:
3AIHW 2011a. Aboriginal and Torres
- Page 149 and 150:
138Section 2
- Page 151 and 152:
140Children and young people
- Page 153 and 154:
4 Children and young peopleAt a gla
- Page 155 and 156:
Early Years Workforce Strategy 2012
- Page 157 and 158:
Coinciding with these changes, adop
- Page 159 and 160:
4Maternal workforce participationPa
- Page 161 and 162:
Just over one-quarter of all mother
- Page 163 and 164:
Per cent7060Children in formal care
- Page 165 and 166:
4Box 4.1: Education in AustraliaEac
- Page 167 and 168:
In 2011, the average usual weekly c
- Page 169 and 170:
The lower end of the range in atten
- Page 171 and 172:
Box 4.3: Australia’s internationa
- Page 173 and 174:
Per cent10090Year 10: Non-Indigenou
- Page 175 and 176:
Completion of further educationIn 2
- Page 177 and 178:
Participation of young people in so
- Page 179 and 180:
In 2011, the teenage birth rate amo
- Page 181 and 182:
Box 4.4: International comparison o
- Page 183 and 184:
A large number of young people who
- Page 185 and 186:
Per cent10090807060504030$1,000 or
- Page 187 and 188:
Compared with 2007-08, the rates of
- Page 189 and 190:
There were 185,200 children (6.8%)
- Page 191 and 192:
Young people and crimeYoung people
- Page 193 and 194:
Number1,000800Indigenous peopleNon-
- Page 195 and 196:
Multiple disadvantageAnalysis under
- Page 197 and 198:
Development of an ongoing education
- Page 199 and 200:
References4ABS (Australian Bureau o
- Page 201 and 202:
4Callander EJ, Schofield DJ, Shrest
- Page 203 and 204:
4Marks G 2007. Transitions to adult
- Page 205 and 206:
194People with disability
- Page 207 and 208:
5 People with disabilityAt a glance
- Page 209 and 210:
5DisabilityCare AustraliaNew approa
- Page 211 and 212:
• the National Disability Researc
- Page 213 and 214:
5SDAC estimates of prevalence and s
- Page 215 and 216:
On the other hand, the ageing of th
- Page 217 and 218:
Per cent6543210NSWVicQldWASATasACTN
- Page 219 and 220:
Overseas-born AustraliansTaking int
- Page 221 and 222:
Table 5.1: People aged under 65 wit
- Page 223 and 224:
Disability support servicesHow many
- Page 225 and 226:
The increase in the number of clien
- Page 227 and 228:
In 2010-11, acquired brain injury w
- Page 229 and 230:
Disability support servicesIn 2011-
- Page 231 and 232:
Delivery of disability services und
- Page 233 and 234:
There were around 96,300 FTE studen
- Page 235 and 236:
In addition to in-home accommodatio
- Page 237 and 238:
Note that the 2011 Census does not
- Page 239 and 240:
There has been continuing strong gr
- Page 241 and 242:
Box 5.5: Recent changes to the Disa
- Page 243 and 244:
Number90,00080,00070,00060,000Mobil
- Page 245 and 246:
References5ABS (Australian Bureau o
- Page 247 and 248:
5FaHCSIA (Department of Families, H
- Page 249 and 250:
6 Older peopleAt a glance6Who are o
- Page 251 and 252:
6Challenges of supporting an ageing
- Page 253 and 254:
Box 6.2: A new direction in aged ca
- Page 255 and 256:
Older Aboriginal and Torres Strait
- Page 257 and 258:
Per cent1009080706050Non-private dw
- Page 259 and 260:
Self-assessed healthThe ABS 2011-12
- Page 261 and 262:
Information on differences in need
- Page 263 and 264:
Data collected by the ABS show that
- Page 265 and 266:
Table 6.1: Overseas-born Australian
- Page 267 and 268:
A new measure, the Work Bonus, was
- Page 269 and 270:
6(ABS 2009c, 2011h). Among those ag
- Page 271 and 272:
Of the three core activities of dai
- Page 273 and 274:
More than half (58%) of ACAT assess
- Page 275 and 276:
Major citiesInner regionalOuter reg
- Page 277 and 278:
HACCIn terms of client numbers, HAC
- Page 279 and 280:
6Service use and resident character
- Page 281 and 282:
Per cent60Activities of daily livin
- Page 283 and 284:
Use of the ACAP was notably high in
- Page 285 and 286:
6.8 Where to from here?6While key d
- Page 287 and 288:
References6ABS (Australian Bureau o
- Page 289 and 290:
6Boulton-Lewis GM & Tam M (eds) 201
- Page 291 and 292:
280Homelessness
- Page 293 and 294:
7 HomelessnessAt a glance7Who is ho
- Page 295 and 296:
In addition to the long-term person
- Page 297 and 298:
7For example, the ABS Census, which
- Page 299 and 300:
Box 7.1: Identifying homeless peopl
- Page 301 and 302:
7.5 How many people are homeless an
- Page 303 and 304:
7Nearly two-thirds (64%) of people
- Page 305 and 306:
Per cent706050403020100Major cities
- Page 307 and 308:
In 2010, an estimated 2.1 million a
- Page 309 and 310:
7Chamberlain and Johnson (2013) sug
- Page 311 and 312:
7Who receives assistance and what s
- Page 313 and 314:
7When data on reasons for seeking a
- Page 315 and 316:
Overall, 28% of clients needed assi
- Page 317 and 318:
Table 7.3: Clients of specialist ho
- Page 319 and 320:
As shown in Figure 7.12, there has
- Page 321 and 322:
7While the identification of people
- Page 323 and 324:
7Overall, 29% of clients had a home
- Page 325 and 326:
In 2011-12, there were an estimated
- Page 327 and 328:
7As SHSC data continue to be collec
- Page 329 and 330:
318Section 3
- Page 331 and 332:
320Australia’s welfare 2013
- Page 333 and 334:
8 Informal carersAt a glance8Who pr
- Page 335 and 336:
The National Carer StrategyThe Nati
- Page 337 and 338:
Box 8.1: Measuring informal carers
- Page 339 and 340:
8.4 Who provides informal care?Age
- Page 341 and 342:
According to the 2011 Census, the a
- Page 343 and 344:
8The estimate of the number of youn
- Page 345 and 346:
Rate ratio1.21.00.80.680.40.20.0Bor
- Page 347 and 348:
Overall physical or emotionalwellbe
- Page 349 and 350:
UnaffectedFriendshipsLost or losing
- Page 351 and 352:
The 2009 SDAC shows that primary ca
- Page 353 and 354:
Box 8.3: Data about informal carers
- Page 355 and 356:
National Disability AgreementThe ND
- Page 357 and 358:
Number of care recipients (’000)1
- Page 359 and 360:
In 2011-12, Australian Government e
- Page 361 and 362:
8.6 Where to from here?8Data issues
- Page 363 and 364:
8DoHA 2012d. National Respite for C
- Page 365 and 366:
9 Community services workforceAt a
- Page 367 and 368:
9Early childhood education and care
- Page 369 and 370:
Community services industries compr
- Page 371 and 372:
9Box 9.2: Community services occupa
- Page 373 and 374:
Across all industries, the largest
- Page 375 and 376:
Table 9.3: People employed in commu
- Page 377 and 378:
There was considerable variation be
- Page 379 and 380:
Geographic profile of community ser
- Page 381 and 382:
9Table 9.7: People employed in comm
- Page 383 and 384:
Table 9.8: Average hours paid for a
- Page 385 and 386:
9DEEWR’s research showed the labo
- Page 387 and 388:
Table 9.11: Student completions and
- Page 389 and 390:
Table 9.12: Projected employment gr
- Page 391 and 392:
9.4 Volunteers9The work undertaken
- Page 393 and 394:
Table 9.15: Participation in volunt
- Page 395 and 396:
9The 2012 National Statutory Child
- Page 397 and 398:
386Australia’s welfare 2013
- Page 399 and 400:
10 Welfare expenditure10At a glance
- Page 401 and 402:
10Although many services and paymen
- Page 403 and 404:
Tax revenues more directly represen
- Page 405 and 406:
10Unemployment benefitsOnly expendi
- Page 407 and 408:
10Box 10.3 Non-government expenditu
- Page 409 and 410:
10Box 10.4: International compariso
- Page 411 and 412:
References10ABS (Australian Bureau
- Page 413 and 414:
402Section 4
- Page 415 and 416:
404Indicators of Australia’s welf
- Page 417 and 418:
1111 Indicators of Australia’s we
- Page 419 and 420:
11• Proportion of adults who usua
- Page 421 and 422:
112. Infant mortality rate. The num
- Page 423 and 424:
114. Adults at risk of lifetime har
- Page 425 and 426:
116. People aged 15 and over who ha
- Page 427 and 428:
118. Household tenure types. The pr
- Page 429 and 430:
1110. Number of homeless people. Th
- Page 431 and 432:
1112. Victimisation rate for select
- Page 433 and 434:
11.3 Autonomy and participation11Au
- Page 435 and 436:
11Labour force participation provid
- Page 437 and 438:
1115. People aged 15 to 64 studying
- Page 439 and 440:
1117. Year 5 schoolchildren not mee
- Page 441 and 442:
1119. Average equivalised disposabl
- Page 443 and 444:
1121. Average net household wealth.
- Page 445 and 446:
1123. Unemployment and underutilisa
- Page 447 and 448:
1125. Average hours worked by full-
- Page 449 and 450:
1127. Households with access to the
- Page 451 and 452:
1129. People aged 15 and over who a
- Page 453 and 454:
11Family formation and functioning
- Page 455 and 456:
1131. Crude divorce rate. The numbe
- Page 457 and 458:
1133. Children who were the subject
- Page 459 and 460:
1135. Imprisonment rate. The number
- Page 461 and 462:
1137. Adults who have confidence in
- Page 463 and 464:
1139. Adults participating in civic
- Page 465 and 466:
11ABS 2013b. Crime victimisation, A
- Page 467 and 468:
456
- Page 469 and 470:
Appendix A: TablesTables for this a
- Page 471 and 472:
Carer Supplement: A single, annual
- Page 473 and 474:
Family Tax Benefit Parts A and B: T
- Page 475 and 476:
C.2 Australian GovernmentTotal welf
- Page 477 and 478:
C.5 International comparisonsAll in
- Page 479 and 480:
Table C.2: Welfare-related expendit
- Page 481 and 482:
ReferencesABS (Australian Bureau of
- Page 483 and 484:
DESDETCDHSDIACDMSDoHADS NMDSDSPDVAE
- Page 485 and 486:
PISAPPPPRAQldSASAAPSDACSEEHSHISHSCS
- Page 487 and 488:
care and protection orders: Legal o
- Page 489 and 490:
early intervention: In the childhoo
- Page 491 and 492:
household composition: The grouping
- Page 493 and 494:
main tenant: The tenant who is part
- Page 495 and 496:
primary carer: A person who provide
- Page 497 and 498:
social inclusion: According to the
- Page 499 and 500:
IndexReferences in italics indicate
- Page 501 and 502:
social participation, 253superannua
- Page 503 and 504:
Australian Government Department of
- Page 505 and 506:
Child Care Benefit, 153child care c
- Page 507 and 508:
homeless people, 298; DHS income su
- Page 509 and 510:
definitions and classificationsbaby
- Page 511 and 512:
teachers, 360-74, 377; employmentpr
- Page 513 and 514:
first marriages, 443flexible aged c
- Page 515 and 516:
Indigenous Australians, 53parents,
- Page 517 and 518:
economic costs, 284outcomes after s
- Page 519 and 520:
jobs, see employment; unemploymentJ
- Page 521 and 522:
occupations data, 383older people,
- Page 523 and 524:
NHSC, 94, 95, 133night, alone at, 4
- Page 525 and 526:
parents, 145-53, 343age, 15-16, 167
- Page 527 and 528:
Protection visas, 25psychiatric dis
- Page 529 and 530:
ooms, 102, 286, 287see also overcro
- Page 531 and 532:
carers, 327, 328community aged care
- Page 533 and 534:
standards (quality)community aged c
- Page 535 and 536:
Training in Job Search Techniques,
- Page 537 and 538:
working age, see traditional workin