CAFOs Uncovered - Union of Concerned Scientists
CAFOs Uncovered - Union of Concerned Scientists
CAFOs Uncovered - Union of Concerned Scientists
- No tags were found...

Create successful ePaper yourself
Turn your PDF publications into a flip-book with our unique Google optimized e-Paper software.
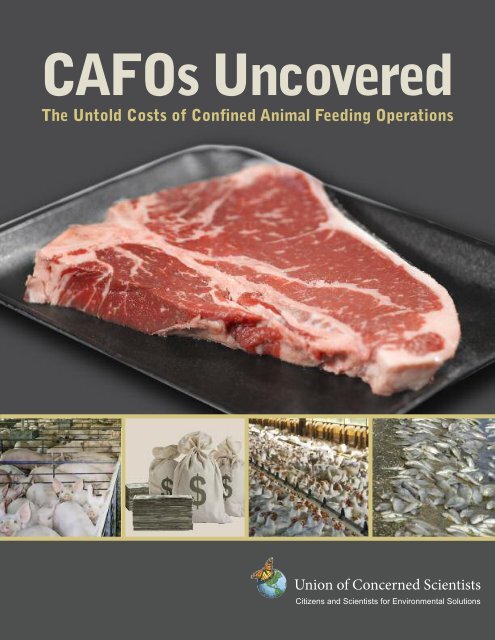
<strong>CAFOs</strong> <strong>Uncovered</strong>The Untold Costs <strong>of</strong> ConfinedAnimal Feeding OperationsDoug Gurian-ShermanU N I O N O F C O N C E R N E D S C I E N T I S T SA P R I L 2 0 0 8
ii <strong>Union</strong> <strong>of</strong> <strong>Concerned</strong> <strong>Scientists</strong>© 2008 <strong>Union</strong> <strong>of</strong> <strong>Concerned</strong> <strong>Scientists</strong>All rights reservedDoug Gurian-Sherman is a senior scientist in the<strong>Union</strong> <strong>of</strong> <strong>Concerned</strong> <strong>Scientists</strong> (UCS) Food andEnvironment Program.e <strong>Union</strong> <strong>of</strong> <strong>Concerned</strong> <strong>Scientists</strong> is the leadingscience-based nonpr<strong>of</strong>it working for a healthyenvironment and a safer world.e goal <strong>of</strong> the UCS Food and EnvironmentProgram is a food system that encouragesinnovative and environmentally sustainable waysto produce high-quality, safe, and affordable food,while ensuring that citizens have a voice in howtheir food is grown.More information about the <strong>Union</strong> <strong>of</strong> <strong>Concerned</strong><strong>Scientists</strong> and the Food and Environment Programis available on the UCS website at www.ucsusa.org.e full text <strong>of</strong> this report is available online(in PDF format) at www.ucsusa.org or may beobtained from:UCS PublicationsTwo Brattle SquareCambridge, MA 02238-9105Or, email pubs@ucsusa.org or call (617) 547-5552.COVER PHOTOS:David Michalak, www.huntingtoncreative.com(steak), Farmsanctuary.org (pigs),istockphoto (money), Farmsanctuary.org (chickens) ,Rick Dove, www.doveimaging.com andwww.neuseriver.com (fish)DESIGN: Penny Michalak (designmz.com)Printed on recycled paper using soy-based inks
iv <strong>Union</strong> <strong>of</strong> <strong>Concerned</strong> <strong>Scientists</strong>F I G U R E S A N D T A B L E SFigures1. U.S. Hog Inventory on the Largest Farms 142. Number <strong>of</strong> U.S. Hog Operations and Hog Inventory 153. Federal EQIP Funding for 2006 434. Counties Eligible for EQIP Subsidies in Georgia’s Poultry Litter Transfer Program, 2006 445. Average Atmospheric Ammonium Ion Concentration, 1985–2002 456. Wet Deposition <strong>of</strong> Ammonium Nitrogen, 2002 457. Wet Deposition <strong>of</strong> Ammonia and Nitrate Nitrogen, 2002 468. Geographic Concentration <strong>of</strong> Hog Production, 1997–2002 469. Geographic Concentration <strong>of</strong> Dairy Cows, 1997–2002 4710. Geographic Concentration <strong>of</strong> Broiler Production, 1997–2002 4711. CAFO Manure Lagoon 4812. Environmental Danger <strong>of</strong> <strong>CAFOs</strong> 4813. CAFO Manure Pile 4814. CAFO Manure Lagoon 4815. Unsanitary Conditions in Cattle CAFO 4916. Alternative Cattle Production 4917. Crowding in Chicken CAFO 4918. Alternative Poultry Production 4919. Crowding in Hog CAFO 5020. Hog Hoop Barn 5021. Alternative Pork Production 50TablesES-1. CAFO Costs Underwritten by U.S. Taxpayers 61. Number <strong>of</strong> Livestock Operations by Size, 1982–1997 162. Number <strong>of</strong> Animals by Operation Size, 1982–1997 163. Percent <strong>of</strong> Livestock Production under Contract by Sector 214. Percent <strong>of</strong> Animals Slaughtered in Large Plants 225. Indirect Subsidies to the CAFO Industry, 1997–2005 346. Comparison <strong>of</strong> Subsidies for <strong>CAFOs</strong> and Diversified Farms 35
<strong>CAFOs</strong> <strong>Uncovered</strong>vA C K N O W L E D G M E N T Sis report was made possible through the financialsupport <strong>of</strong> e Cedar Tree Foundation, e DeerCreek Foundation, e Educational Foundation <strong>of</strong>America, e David B. Gold Foundation, Newman’sOwn Foundation, and UCS members.e report was greatly informed by Dr. Silvia Secchi<strong>of</strong> Southern Illinois University, who provided insightson economic matters concerning the livestockindustry and also reviewed parts <strong>of</strong> the text. Wewere similarly fortunate to receive research contributionsand perspectives from Elanor Starmer <strong>of</strong> theGlobal Development and Environment Institute(GDAE) at Tus University. We also thank Dr. KateClancy for her helpful thoughts and suggestions.We are grateful for the reviews provided byDr. Mark Honeyman <strong>of</strong> Iowa State University,Dr. Michael Mallin <strong>of</strong> the University <strong>of</strong> North Carolina,Dr. William Weida <strong>of</strong> Colorado College andthe Global Resource Action Center for the Environment(GRACE), and Timothy A. Wise <strong>of</strong> the GDAEat Tus University. Each <strong>of</strong>fered invaluable commentsthat greatly improved the report, but we mustnote that their willingness to review the materialdoes not necessarily imply an endorsement <strong>of</strong> thereport or its conclusions and recommendations.Here at the <strong>Union</strong> <strong>of</strong> <strong>Concerned</strong> <strong>Scientists</strong>, a greatdeal <strong>of</strong> appreciation is due to Margaret Mellon,without whose patience, counsel, and many contributionsthis report would not have been possible.anks are also due to Stanback interns ElizabethWillets and Pei Yen for research contributions, JaneRissler and Heather Sisan for logistical and otherhelp, and Julie MacCartee for research assistance.We would also like to thank Bryan Wadsworth forcopyediting, Heather Tuttle for coordinating printproduction, and Penny Michalak for designand layout.
<strong>CAFOs</strong> <strong>Uncovered</strong> 1EXECUTIVE SUMMARYThe livestock industry (including poultry) is vitalto our national economy, supplying meat, milk,eggs, and other animal products and providingmeaningful employment in rural communities. Untilrecently, food animal production was integrated withcrop production in a balanced way that was generallybeneficial to farmers and society as a whole. Butlivestock production has undergone a transformationin which a small number <strong>of</strong> very large <strong>CAFOs</strong>(confined animal feeding operations) predominate.ese <strong>CAFOs</strong> have imposed significant—but largelyunaccounted for—costs on taxpayers and communitiesthroughout the United States.<strong>CAFOs</strong> are characterized by large numbers <strong>of</strong>animals crowded into a confined space—an unnaturaland unhealthy condition that concentrates toomuch manure in too small an area. Many <strong>of</strong> thecostly problems caused by <strong>CAFOs</strong> can be attributedto the storage and disposal <strong>of</strong> this manure and theoveruse <strong>of</strong> antibiotics in livestock to stave <strong>of</strong>f disease.e predominance <strong>of</strong> <strong>CAFOs</strong> is not the inevitableresult <strong>of</strong> market forces; it has been fosteredby misguided public policy. Alternative productionmethods can be economically efficient and technologicallysophisticated, and can deliver abundant animalproducts while avoiding most <strong>of</strong> the problemscaused by <strong>CAFOs</strong>. However, these alternatives are ata competitive disadvantage because <strong>CAFOs</strong> have reducedtheir costs through subsidies that come at thepublic’s expense, including (until very recently) lowcostfeed. <strong>CAFOs</strong> have also benefited from taxpayersupportedpollution cleanup programs andtechnological “fixes” that may be counterproductive,such as the overuse <strong>of</strong> antibiotics. And by shiingthe risks <strong>of</strong> their production methods onto the public,<strong>CAFOs</strong> avoid the costs <strong>of</strong> the harm they cause.In addition, the fact that the meat processing industryis dominated by a few large and economicallypowerful companies makes it difficult for alternativeproducers to slaughter their animals and get theirproducts to market. is excessive market concentrationis facilitated by lax enforcement <strong>of</strong> laws intendedto prevent anti-competitive practices.By describing several <strong>of</strong> the subsidies and otheroen hidden costs <strong>of</strong> <strong>CAFOs</strong> that are imposed onsociety (referred to as externalized costs or “externalities”),this report attempts to clarify the realprice we pay—and can no longer afford—for thisharmful system. ese externalities are associatedwith the damage caused by water and air pollution(along with cleanup and prevention), the costsborne by rural communities (e.g., lower propertyvalues), and the costs associated with excessive antibioticuse (e.g., harder-to-treat human diseases).Subsidies have included payments to grain farmersthat historically supported unrealistically low animalfeed prices, and payments to <strong>CAFOs</strong> to preventwater pollution.e United States can do better. In fact, there isa new and growing movement among U.S. farmersto produce food efficiently by working with naturerather than against it. More and more meat anddairy farmers are successfully shiing away frommassive, overcrowded <strong>CAFOs</strong> in favor <strong>of</strong> modernproduction practices. We <strong>of</strong>fer a number <strong>of</strong> policyrecommendations that would level the playing fieldfor these smart, sophisticated alternatives by reducingCAFO subsidies and requiring <strong>CAFOs</strong> to pay afair share <strong>of</strong> their costs.
2 <strong>Union</strong> <strong>of</strong> <strong>Concerned</strong> <strong>Scientists</strong><strong>CAFOs</strong>—Too Big for Our Own GoodMost <strong>of</strong> the problems caused by <strong>CAFOs</strong> result fromtheir excessive size and crowded conditions. <strong>CAFOs</strong>contain at least 1,000 large animals such as beefcows, or tens <strong>of</strong> thousands <strong>of</strong> smaller animals suchas chickens, and many are much larger—with tens<strong>of</strong> thousands <strong>of</strong> beef cows or hogs, and hundreds <strong>of</strong>thousands <strong>of</strong> chickens.e problems that arise from excessive size anddensity (e.g., air and water pollution from manure,overuse <strong>of</strong> antibiotics) are exacerbated by the paralleltrend <strong>of</strong> geographic concentration, whereby<strong>CAFOs</strong> for particular types <strong>of</strong> livestock have becomeconcentrated in certain parts <strong>of</strong> the country.For example, large numbers <strong>of</strong> swine <strong>CAFOs</strong> arenow located in Iowa and North Carolina, dairy<strong>CAFOs</strong> in California, and broiler chicken <strong>CAFOs</strong> inArkansas and Georgia.We need to be concerned about these excessivelylarge feeding operations because they have becomethe predominant means <strong>of</strong> producing meatand dairy products in this country over the past fewdecades. Although they comprise only about 5 percent<strong>of</strong> all U.S. animal operations, <strong>CAFOs</strong> now producemore than 50 percent <strong>of</strong> our food animals.ey also produce about 65 percent <strong>of</strong> the manurefrom U.S. animal operations, or about 300 milliontons per year—more than double the amount generatedby this country’s entire human population. Forthe purposes <strong>of</strong> this report, there are approximately9,900 U.S. <strong>CAFOs</strong> producing hogs, dairy cows, beefcows, broiler chickens, or laying hens.Better Options Exist<strong>CAFOs</strong> do not represent the only way <strong>of</strong> ensuringthe availability <strong>of</strong> food at reasonable prices. Recentstudies by the U.S. Department <strong>of</strong> Agriculture(USDA) show that almost 40 percent <strong>of</strong> mediumsizedanimal feeding operations are about as costeffectiveas the average large hog CAFO, and manyother studies have provided similar results.Medium-sized and smaller operations also avoid orreduce many <strong>of</strong> the external costs that stemfrom <strong>CAFOs</strong>.If <strong>CAFOs</strong> are not appreciably more efficientthan small and mid-sized operations, why are theysupplanting smaller farms? e answers lie largelyin farm policies that have favored large operations.<strong>CAFOs</strong> have relied on cheap inputs (water, energy,and especially feed) to support the high animal densitiesthat <strong>of</strong>fset these operations’ high fixed costs(such as buildings). Feed accounts for about 60 percent<strong>of</strong> the costs <strong>of</strong> producing hogs and chickensand is also an important cost for dairy and beefcows, and federal policies have encouraged the production<strong>of</strong> inexpensive grain that benefits <strong>CAFOs</strong>.Perhaps even more important has been the concentration<strong>of</strong> market power in the processing industryupon which animal farmers depend. isconcentration allows meat processors to exert considerableeconomic control over livestock producers,oen in the form <strong>of</strong> production contracts andanimal ownership. e resulting “captive supply”can limit market access for independent smallerproducers, since the large majority <strong>of</strong> livestock areeither owned by processors or acquired under contract—andprocessors typically do not contract withsmaller producers. Federal government watchdogshave stated that the agency responsible for ensuringthat markets function properly for smaller producersis not up to the task.Hoop barns and smart pasture operationsAlthough there is evidence that confinement operationssmaller than <strong>CAFOs</strong> can be cost-effective andproduce ample animal products, studies also suggestthat sophisticated alternative means <strong>of</strong> producinganimal products hold even greater promise. For example,hog hoop barns, which are healthier for theanimals and much smaller than <strong>CAFOs</strong>, can producecomparable or even higher pr<strong>of</strong>its per unit atclose to the same price.Research in Iowa (the major hog-producingstate) has also found that raising hogs on pasturemay produce animals at a lower cost than <strong>CAFOs</strong>.Other studies have shown that “smart” pasture oper-
4 <strong>Union</strong> <strong>of</strong> <strong>Concerned</strong> <strong>Scientists</strong><strong>of</strong> raw manure into streams and estuaries and killingmillions <strong>of</strong> fish. Smaller but more numerous spillscause substantial losses as well.Remediation <strong>of</strong> the leaching under dairy andhog <strong>CAFOs</strong> in Kansas has been projected to costtaxpayers $56 million—and Kansas is not one <strong>of</strong> thecountry’s top dairy- or hog-producing states. Basedon these data, a rough estimate <strong>of</strong> the total cost <strong>of</strong>cleaning up the soil under U.S. hog and dairy<strong>CAFOs</strong> could approach $4.1 billion.The two primary pollutants from manure, nitrogenand phosphorus, can cause eutrophication(the proliferation and subsequent death <strong>of</strong> aquaticplant life that robs freshwater and marine environments<strong>of</strong> the oxygen that fish and many otheraquatic organisms need to survive). For example,run<strong>of</strong>f and leaching from animal sources including<strong>CAFOs</strong> is believed to contribute about 15 percent<strong>of</strong> the nutrient pollution that reaches the Gulf <strong>of</strong>Mexico, where a large “dead zone”—devoid <strong>of</strong> fishand commercially important seafood such asshrimp—has developed. CAFO manure also contributesto similar dead zones in the ChesapeakeBay (another important source <strong>of</strong> fish and shellfish)and other important estuaries along the EastCoast. The Chesapeake Bay’s blue crab industry,which had a dockside value <strong>of</strong> about $52 million in2002, has declined drastically in recent years alongwith other important catches such as striped bass,partly due to the decline in water quality caused inpart by <strong>CAFOs</strong>.Although it is difficult to account for all <strong>of</strong> thesocial benefits (such as fisheries and drinkingwater) lost due to CAFO pollution, it is reasonableto assume the losses are substantial. One indirectway <strong>of</strong> estimating such costs is to calculate the cost<strong>of</strong> preventing some or all <strong>of</strong> the pollution causedby <strong>CAFOs</strong>. The USDA, for example, has determinedhow much it would cost to transport manureto enough crop fields or pastures to complywith new Clean Water Act rules governing the distribution<strong>of</strong> manure on fields. Based on a nitrogenlimitedstandard and realistic estimates <strong>of</strong> the rateat which farms will accept manure, the annual cost<strong>of</strong> adequate manure distribution in the ChesapeakeBay region alone would total $134 million per year.Using a phosphorus-limited standard and an unrealisticallyhigh manure acceptance rate, the costwould be $153 million annually. Considering thatnet returns for the animal industry in this regionamount to $313 million, compliance with suchstandards could comprise between 43 and 49 percent<strong>of</strong> net returns.Air pollution from manureAirborne ammonia is a respiratory irritant and cancombine with other air pollutants to form fine particulatematter that can cause respiratory disease.And because ammonia is also re-deposited onto theground, mostly within the region from which itoriginates, ammonia nitrogen deposited on soilsthat have evolved under low-nitrogen conditionsmay reduce biodiversity and find its way into watersources. Ammonium ion deposition also contributesto the acidification <strong>of</strong> some forest soils.Animal agriculture is the major contributor <strong>of</strong>ammonia to the atmosphere, and the substantialmajority <strong>of</strong> this ammonia likely comes from confinementoperations, since manure deposited bylivestock on pasture contributes proportionatelymuch less ammonia to the atmosphere than manurefrom <strong>CAFOs</strong>. Up to 70 percent <strong>of</strong> the nitrogen inCAFO manure can be lost to the atmosphere dependingon manure storage and field applicationmeasures. Over the past several decades, theamount <strong>of</strong> airborne ammonia deposition in manyareas <strong>of</strong> the United States with large numbers <strong>of</strong><strong>CAFOs</strong> has been rising dramatically, and may oenexceed the capacity <strong>of</strong> forests and other environmentsto utilize it without harm.e USDA has estimated the total U.S. cost <strong>of</strong>controlling air and water pollution through manuredistribution onto farmland—in quantities that complywith the Clean Water Act—at $1.16 billion peryear under high manure acceptance rates. However,the standard applied in this calculation would onlyreduce airborne ammonia pollution from <strong>CAFOs</strong> byabout 40 percent. And if lower, more realistic ma-
<strong>CAFOs</strong> <strong>Uncovered</strong> 5nure acceptance rates were used, the manure wouldhave to be transported unacceptable distances.erefore, proper manure disposal from <strong>CAFOs</strong> atcurrent farmer acceptance rates would in all likelihoodexceed these values considerably.Harm to rural communities<strong>CAFOs</strong> are sited in rural communities that bear thebrunt <strong>of</strong> the harm caused by <strong>CAFOs</strong>. is harm includesthe frequent presence <strong>of</strong> foul odors and watercontaminated by nitrogen and pathogens, as wellas higher rates <strong>of</strong> respiratory and other diseasescompared with rural areas that are not locatednear <strong>CAFOs</strong>.One study determined that each CAFO in Missourihas lowered property values in its surroundingcommunities by an average total <strong>of</strong> $2.68 million. Itis not possible to accurately extrapolate this valuenationally due to the many differences between localities,but as a very rough indication <strong>of</strong> the magnitude<strong>of</strong> these costs, multiplying by 9,900 (the totalnumber <strong>of</strong> U.S. <strong>CAFOs</strong> as defined for this report)would yield a loss <strong>of</strong> about $26 billion.Antibiotic-resistant pathogensEstimates have suggested that considerably greateramounts <strong>of</strong> antibiotics are used for livestock productionthan for the treatment <strong>of</strong> human disease inthe United States. e massive use <strong>of</strong> antibiotics in<strong>CAFOs</strong>, especially for non-therapeutic purposessuch as growth promotion, contributes to the development<strong>of</strong> antibiotic-resistant pathogens that aremore difficult to treat.Many <strong>of</strong> the bacteria found on livestock (such asSalmonella, Escherichia coli, and Campylobacter) cancause food-borne diseases in humans. Furthermore,recent evidence strongly suggests that some methicillin-resistantStaphylococcus aureus (MRSA) anduropathogenic E. coli infections may also be causedby animal sources. ese pathogens collectivelycause tens <strong>of</strong> millions <strong>of</strong> infections and many thousands<strong>of</strong> hospitalizations and deaths every year.e costs associated with Salmonella alone havebeen estimated at about $2.5 billion per year—about88 percent <strong>of</strong> which is related to premature deaths.Because an appreciable degree <strong>of</strong> antibiotic resistancein animal-associated pathogens is likely due tothe overuse <strong>of</strong> antibiotics in <strong>CAFOs</strong>, the resultingcosts are likely to be high. Eliminating the use <strong>of</strong> antibioticsfor growth promotion (the majority <strong>of</strong>which occurs on <strong>CAFOs</strong>) could cost <strong>CAFOs</strong>between $1.5 billion and $3 billion per year.Conclusions and Recommendationse costs we pay as a society to support <strong>CAFOs</strong>—inthe form <strong>of</strong> taxpayer subsidies, pollution, harm torural communities, and poorer public health—ismuch too high (Table ES-1, p. 6). For example, conservativeestimates <strong>of</strong> grain subsidies and manuredistribution alone suggest that <strong>CAFOs</strong> would haveincurred at least $5 billion in extra production costsper year if these expenses were not shied onto thepublic. e figure would undoubtedly be muchhigher if truly adequate manure distribution was required.Although we do not have good national datafor other costs quantified in Table ES-1, and somethat have not been quantified (such as water and energyuse and water purification costs), they couldamount to billions <strong>of</strong> dollars more per year.Technological solutions to specific CAFO problemshave been proposed, such as feed formulationsthat would reduce manure nitrogen, lagoon coversthat would reduce atmospheric ammonia, and “biogas”capture and production that would reducemethane emissions from manure, but these are onlypartial solutions and would generally add to the cost<strong>of</strong> production. None <strong>of</strong> these technologies solve antibioticresistance, loss <strong>of</strong> rural income, or theethical treatment <strong>of</strong> animals. By comparison, sophisticatedCAFO alternatives can provide plentifulanimal products at similar prices, but with muchfewer <strong>of</strong> the problems caused by <strong>CAFOs</strong>.e bottom line is that society is currently proppingup an undesirable form <strong>of</strong> animal agriculturewith enormous subsidies and a lack <strong>of</strong> accountabilityfor its externalized costs. Once we appreciate therole these subsidies—along with government
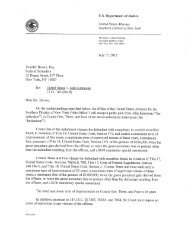
6 <strong>Union</strong> <strong>of</strong> <strong>Concerned</strong> <strong>Scientists</strong>Table ES-1. CAFO Costs Underwritten by U.S. Taxpayers 1Cost <strong>of</strong> Pollution orPollution AvoidanceCost to Distribute andApply Manure to Fields $1.16 billion/year 2Reduction in Property Values $26 billion (total loss) 3Public Health Costs from Overuse<strong>of</strong> Antibiotics in Livestock $1.5 billion – $3.0 billion/year 4Remediation <strong>of</strong> Leakage fromManure Storage Facilities(Swine and Dairy) $4.1 billion (total cost) 5Cost <strong>of</strong> SubsidyGrain Subsidies for Livestock Feed $3.86 billion/year 6EQIP Subsidy $100 million – $125 million 71Numbers are rough estimates <strong>of</strong> current or recent costs and are presented only to indicate the magnitude <strong>of</strong> these costs. See the text for details.2SOURCE: Aillery et al. 2005.3SOURCE: Mubarak, Johnson, and Miller 1999. Extrapolation from Missouri data based on national CAFO numbers.4SOURCE: NRC 1999. Extrapolation based on U.S. population <strong>of</strong> 300 million.5SOURCE: Volland, Zupancic, and Chappelle 2003. Extrapolation from Kansas data based on national swine and dairy CAFO numbers.6SOURCE: Starmer 2007. Data averaged over the period 1996–2005.7SOURCE: NRCS 2003. Calculations based on NRCS projections for 2007 (yearly values increase from a low in 2002 to a high in 2007).policies—play in shaping the way our food animalsare raised, we can also see the environmental,health, and economic benefits to be gained fromredirecting agriculture toward smart pasture operationsand other desirable alternatives.Public policies that support <strong>CAFOs</strong> at the expense<strong>of</strong> such alternatives should be eliminated, andpolicies that support these alternatives should beimplemented. Needed actions include:• Strict and vigorous enforcement <strong>of</strong> antitrust andanti-competitive practice laws under the Packersand Stockyards Act (which cover captive supply,transparency <strong>of</strong> contracts, and access to openmarkets)• Strong enforcement <strong>of</strong> the Clean Water Act as itpertains to <strong>CAFOs</strong>, including improved oversightat the state level or the takeover <strong>of</strong> responsibilitiescurrently delegated to the states forapproving and monitoring and enforcement <strong>of</strong>National Pollution Discharge Elimination System(NPDES) permits; improvements could includemore inspectors and inspections, bettermonitoring <strong>of</strong> manure-handling practices, andmeasurement <strong>of</strong> pollution prevention practices• Development <strong>of</strong> new regulations under theClean Air Act that would reduce emissions <strong>of</strong>ammonia and other air pollutants from <strong>CAFOs</strong>,and ensure that CAFO operators cannot avoidsuch regulations by encouraging ammoniavolatilization• Continued monitoring and reporting <strong>of</strong> ammoniaand hydrogen sulfide emissions as requiredunder the Comprehensive Environmental Response,Compensation, and Liability Act(CERCLA, commonly referred to as the “Superfund”)and the Emergency Planning andCommunity Right-to-Know Act (EPCRA)• Replacement <strong>of</strong> farm bill commodity crop subsidieswith subsidies that strengthen conservationprograms and support prices when suppliesare high (rather than allowing prices to fallbelow the cost <strong>of</strong> production)• Reduction <strong>of</strong> the current $450,000 EQIP project capto levels appropriate to smaller farms, with a focuson support for sound animal farming practices• Revision <strong>of</strong> slaughterhouse regulations to facilitatelarger numbers <strong>of</strong> smaller processors, includingthe elimination <strong>of</strong> requirements not
<strong>CAFOs</strong> <strong>Uncovered</strong> 7appropriate to smaller facilities, combined withpublic health measures such as providing adequatenumbers <strong>of</strong> federal inspectors or empoweringand training state inspectors• Substantial funding for research to improvealternative animal production methods (especiallypasture-based) that are beneficial to the environment,public health, and rural communities
draw precise conclusions was beyond the scope <strong>of</strong>this report, but even when limited to the availablenational data, a glimpse <strong>of</strong> the large scale <strong>of</strong> <strong>CAFOs</strong>ubsidies is possible.Alternatives to <strong>CAFOs</strong> are many and diverse.ey include smaller feeding operations; pasturebasedcattle, swine, and poultry; and swine hoopbarns. Even these alternatives receive some subsidies;in particular, systems that use feed grain mayhave received some <strong>of</strong> the indirect grain subsidiesthat <strong>CAFOs</strong> have received. However, some alternativeshave not received these subsidies, and mosthave received proportionately less than <strong>CAFOs</strong>. Alternativesdo not receive several important directsubsidies (e.g., for manure transport), and they donot produce the degree <strong>of</strong> water pollution, air pollution,antibiotic-resistant organisms, health costs, orharm to rural communities that <strong>CAFOs</strong> do, thusgreatly reducing the costs the public must bear.Depriving <strong>CAFOs</strong> <strong>of</strong> their subsidies could helplevel the playing field, but would not necessarily ensurethe success <strong>of</strong> alternative systems. In manyways subsidies are appropriate in agriculture—providedthe public gets the desired benefits in returnfor its investment.<strong>CAFOs</strong> <strong>Uncovered</strong> 11
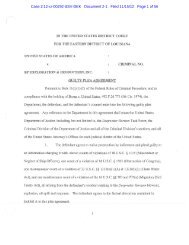
14 <strong>Union</strong> <strong>of</strong> <strong>Concerned</strong> <strong>Scientists</strong>however, it can be prohibitively expensive to transportthe manure beyond a short distance. Disposalmay therefore be accomplished by pumping the liquefiedmanure onto nearby “sprayfields” (a practicethat can only distribute manure over a relativelyshort distance), or by trucking it a greater distance(which adds additional expense).e weight <strong>of</strong> CAFO manure is due to the mixing<strong>of</strong> urine and feces, which forms a slurry that ismostly liquid, and additional liquid is oen addedwhen manure is flushed with water into storage facilitiessuch as lagoons. Placing a large number <strong>of</strong>animals in a small space oen means that more manureis produced than can be properly disposed <strong>of</strong>on fields close to the CAFO.Other problems stem from the density <strong>of</strong> theanimals in individual operations. High-density confinementmeans that animals may be exposed totheir own manure, which is typically collectedwithin the stocking facilities, oen aer droppingthrough slatted floors. e manure can harbor andspread disease-causing organisms, and gases such asammonia and hydrogen sulfide emitted from themanure can be harmful to both animals and workers.<strong>CAFOs</strong> also release these harmful products intothe surrounding air and water, causing problems farbeyond the facility itself.Large manure storage facilities are oen requiredbecause the application <strong>of</strong> manure to fields isoen restricted to certain times <strong>of</strong> the year (e.g.,when the ground is not frozen). Such storage facilitiesraise additional environmental concerns. eycan overflow or collapse, sending unprocessed manureinto surface water, killing fish and contributingto degradation <strong>of</strong> the aquatic environment. Waterpollution can also occur due to leakage through theground under the storage facility, contaminatinggroundwater supplies such as wells and aquifers. Finally,these facilities also emit gases, especially ammonia,that cause air pollution and global warming.<strong>CAFOs</strong> Are Getting BiggerIt should be acknowledged that many <strong>CAFOs</strong> aremuch larger than the lower limit recognized by theEPA. is is illustrated for hog production in Figure 1,which shows the percent <strong>of</strong> hogs produced at operationslarger than 2,000 head and 5,000 head (doublethe minimum CAFO size) from 1994 to 2001(McBride and Key 2003). Over 50 percent <strong>of</strong> totalFigure 1. U.S. Hog Inventory on the Largest Farms80PERCENT OF TOTAL U.S. INVENTORY70605040302010+Operations with 2,000+ headOperations with 5,000+ head01994 1995 1996 1997 1998 1999 2000 2001Operations with 5,000+ head were not reported prior to 1996.SOURCE: McBride and Key 2003.
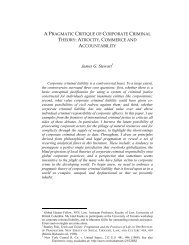
<strong>CAFOs</strong> <strong>Uncovered</strong> 15Figure 2. Number <strong>of</strong> U.S. Hog Operations and Hog Inventory250,0008075OPERATIONS200,000150,000100,00050,000OperationsInventory7065605550INVENTORY (MILLION OF HEAD)4501994 1995 1996 1997 1998 1999 2000 200140An operation is any place having one or more hogs on hand at any time during the year.SOURCE: McBride and Key 2003.hog production occurred on <strong>CAFOs</strong> with morethan 5,000 hogs by 2001. e average hog CAFOin the EPA’s southern seaboard region held morethan 12,000 head per year in 2004 (McBride andKey 2007).On the other hand, as illustrated in Figure 2, thetotal number <strong>of</strong> swine in the United States remainedabout the same over this time period, demonstratingthat increased size <strong>of</strong> operations was not requiredto supply the domestic demand for pork.Between 1994 and 2001, the number <strong>of</strong> hog operationsfell by more than 50 percent. Between 1982and 2006, the number <strong>of</strong> hog operations fell by afactor <strong>of</strong> almost 10, from just under 500,000 toabout 60,000 (NASS 2007).e total number <strong>of</strong> beef cattle produced in theUnited States has declined somewhat over the pastseveral decades, while broilers have increased dramatically.Between 1966 and 2006, the amount <strong>of</strong>broiler meat produced in the United States increasedby about 500 percent.e proportion <strong>of</strong> animals produced on <strong>CAFOs</strong>has increased greatly over the past several decades,and the geographic distribution <strong>of</strong> <strong>CAFOs</strong> has alsobecome more concentrated. Despite the fact thatmany smaller livestock operations remain, theirnumbers have been falling dramatically (Table 1,p. 16), 7 and <strong>CAFOs</strong> are now responsible forproducing much <strong>of</strong> the animal products soldin the United States.Table 2 (p. 16) shows the number <strong>of</strong> animalsraised by operations <strong>of</strong> different sizes in the UnitedStates. 8 e much greater size <strong>of</strong> animal operationsover 1,000 AU compared with smaller operationsmeans that even though there are many fewer largeoperations, they produce more animals than anyother size class as <strong>of</strong> 1997 (although medium-sizedoperations continue to produce a substantial number<strong>of</strong> animals). Large <strong>CAFOs</strong> clearly have been replacingother ways <strong>of</strong> raising livestock.Nevertheless, the fact that there are still manyoperations <strong>of</strong> small and medium size suggests that7 About 92 percent <strong>of</strong> all operations larger than 1,000 AU are confined operations (Kellogg et al. 2000).8 About 16 million AU are raised in <strong>CAFOs</strong>; therefore about 35 percent <strong>of</strong> all AU at large operations are unconfined. However, about 7.3 million AU on theselarge unconfined operations are in categories other than feedlot beef cows or dairy cows (Kellogg et al. 2000). e overwhelming majority <strong>of</strong> these are likely tobe cow-calf operations with animals on range or pasture, and virtually all beef calves over 500 lb. from these operations are eventually transferred to feedlot<strong>CAFOs</strong>. Excluding these cows, about 91 percent <strong>of</strong> all animals at operations larger than 1,000 AU are in confined operations, including virtually all large beefcattle- and swine-finishing operations, and virtually all chicken operations.
16 <strong>Union</strong> <strong>of</strong> <strong>Concerned</strong> <strong>Scientists</strong>Table 1. Number <strong>of</strong> Livestock Operations by Size,* 1982–1997FarmSize Category1982 1987 1992 1997 Percent Change1982 to 1997Less Than 25 Total AU 660,425 577,488 496,206 474,335 -2825 to
<strong>CAFOs</strong> <strong>Uncovered</strong> 17tages against disadvantages such as the pollutioncaused by animal waste.To assess the efficiency <strong>of</strong> <strong>CAFOs</strong> we must firstchoose one <strong>of</strong> several possible definitions. Onemeasure <strong>of</strong> efficiency is costs per unit <strong>of</strong> production.ese costs typically include labor, materials, andenergy, but <strong>CAFOs</strong> also cause harm to the environmentand people that are “costs” to society.When such costs to the environment, publichealth, or rural communities are borne by societyrather than the producer they are termed “negativeexternalities” (or just “externalities” for the purposes<strong>of</strong> this report). If <strong>CAFOs</strong> were required to remediateor prevent the cost <strong>of</strong> these externalities, they wouldincur higher production costs and thus be consideredless efficient than they currently appear. In addition,<strong>CAFOs</strong> receive subsidies that help defraytheir production costs. Because these subsidies aretypically funded by taxes, society is paying to reduce<strong>CAFOs</strong>’ production costs in more ways than one.So, when examined in a broader societal context,suppositions about the higher economic efficiency<strong>of</strong> <strong>CAFOs</strong> can be seen as half-truths. eprimary purpose <strong>of</strong> this report is to examine some<strong>of</strong> the costs our society pays for <strong>CAFOs</strong> from an environmentaland public health perspective, and howsubsidies create an illusion <strong>of</strong> CAFO efficiency.e societal costs <strong>of</strong> pollution externalities andgrain subsidies—that is, costs for which CAFOowners have never been held accountable—are examinedprimarily in Chapters 2 and 3. But first, weconsider narrower aspects <strong>of</strong> efficiency that encompassthose costs CAFO owners have historically paid.Factors Contributing to CAFO GrowthSeveral key factors have driven CAFO expansion,one being the availability <strong>of</strong> cheap inputs (i.e., expensessuch as grain, water, and energy that havevariable costs). We consider the importance <strong>of</strong> lowcostgrain below.Another factor that will be briefly addressed inChapter 3 is technological change. is has takenthe form <strong>of</strong> developing breeds <strong>of</strong> livestock that bettersuit the CAFO environment and that facilitate highspeedprocessing, reliance on antibiotics to compensatefor conditions that favor disease, and feed formulationsthat allow animals to be produced in a way that meetsthe demands <strong>of</strong> <strong>CAFOs</strong>. ese changes and others haveoen been accomplished through taxpayer-supportedresearch at public universities.In addition, the ability <strong>of</strong> <strong>CAFOs</strong> to shi thecosts <strong>of</strong> their pollution onto the public in the form<strong>of</strong> externalities such as air and water pollution reducesthe apparent costs <strong>of</strong> production. e cost <strong>of</strong>these externalities is considered at greater length inChapter 3.In this chapter we will examine economic efficienciesand processor-related market control.Economic efficiencyEconomies <strong>of</strong> scale, which help larger operationsrun more efficiently by using production tools notreadily available to smaller operations, are oenoveremphasized in discussions <strong>of</strong> CAFO efficiency.Economies <strong>of</strong> scale do exist for <strong>CAFOs</strong> when costssuch as manure disposal are avoided, but are oensmall and reach optimum levels at an operation sizebelow that <strong>of</strong> large <strong>CAFOs</strong>.Much more important has been the availability<strong>of</strong> low-cost grain, which allows <strong>CAFOs</strong> to maintainlarge numbers <strong>of</strong> animals in a small space (becausethe grain can be brought to the animals rather thanhaving the animals forage for their food, as in pastures).Corn and soybeans, the primary feed grains,are high in easily digestible carbohydrates and proteincompared with forage. eir high nutritionalvalue per unit <strong>of</strong> weight allows large volumes <strong>of</strong>these grains to be shipped at relatively low expense, 9further facilitating the centralization <strong>of</strong> animal feedingoperations. For example, the ability to ship grainat low cost to the Mid-Atlantic, which lies outsidemajor corn- and soybean-growing regions, has facilitatedthe dramatic growth <strong>of</strong> <strong>CAFOs</strong> in North Carolina—nowthe second largest hog-producing stateand fourth largest producer <strong>of</strong> broilers.9 Soybeans are technically not grain, but for the sake <strong>of</strong> simplicity will be referred to as grain along with corn in this report (unless otherwise noted).
18 <strong>Union</strong> <strong>of</strong> <strong>Concerned</strong> <strong>Scientists</strong>e high nutrient content <strong>of</strong> grain also gives it ahigh “conversion efficiency” compared with manyother feed sources. Conversion efficiency refers tothe amount <strong>of</strong> feed needed to produce a unit <strong>of</strong> animalproduct. Cattle, even though they evolved to eatforage, generally add weight somewhat faster andproduce more milk when fed grain rather than pastureor forage.Livestock also expend more energy to maintainbody temperature and mobility on pasture and otherCAFO alternatives, which contributes to lower conversionefficiency. Animals that are housed in temperature-controlledfacilities and have restricted mobilitycan devote more <strong>of</strong> their food consumption to gainingweight or producing eggs or milk. In other words, animalsin heated facilities are kept warm through theuse <strong>of</strong> fossil fuel energy rather than the metabolic energythey would otherwise expend.Beginning in the 1950s, the growth <strong>of</strong> broiler<strong>CAFOs</strong> applied pressure to other livestock sectors toadopt similar measures for increasing production andreducing costs. Chickens convert grain into meatmore efficiently than cattle or hogs: it typically takesabout 2.3 lb. <strong>of</strong> grain to produce a pound <strong>of</strong> chicken,but 5.9 lb. to produce a pound <strong>of</strong> pork and 13 lb. for apound <strong>of</strong> beef (Pimentel and Pimentel 2003), so evenaer adopting CAFO production methods, a grainbaseddiet for poultry maintains some advantagescompared with other types <strong>of</strong> livestock.Despite its advantages for weight gain, heavy dependenceon feed grain can only occur if it is lessexpensive than alternatives such as forage. is isbecause feed is a large part <strong>of</strong> <strong>CAFOs</strong>’ productioncosts—about 60 percent for hogs and broilers(Starmer, Witteman, and Wise 2006). As discussedat length in the following chapter, the low cost <strong>of</strong>grain in recent decades has been largely supportedby federal government policies that 1) provide taxpayersubsidies for cheap grain and 2) have eliminatedgrain supply controls, allowing prices to fall.Because feed comprises such a large expense for theCAFO industry, the cost to taxpayers for this subsidyis high.Low-cost inputs such as grain favor CAFO expansionwhen prices for animal products are low.is has generally been the case during the past severaldecades. Low-cost inputs spread the high fixedcosts <strong>of</strong> confinement infrastructure (such as thebuildings that contain the animals) over many units<strong>of</strong> production. <strong>CAFOs</strong> can compensate for lowpr<strong>of</strong>it margins per animal by producing large numbers<strong>of</strong> animals. By contrast, small and diversifiedproducers oen have relatively lower fixed costs andhigher variable costs, and may attempt to lowertheir costs by reducing production when prices arelow. In this way, <strong>CAFOs</strong> may expand at the expense<strong>of</strong> smaller operations.Another factor in CAFO efficiency is economies<strong>of</strong> scale. Hypothetically, a large facility may be ableto afford machinery that greatly improves productionefficiency because its cost is distributed over alarge amount <strong>of</strong> finished product (in this case,processed animals). A smaller facility could not takeadvantage <strong>of</strong> such efficiency because the cost <strong>of</strong> themachinery would be spread over too few products.Studies <strong>of</strong> this factor in the hog industry (e.g.,McBride and Key 2003) suggest that economies <strong>of</strong>scale exist, but are oen minimal for animal producerslarger than medium-sized AFOs or small<strong>CAFOs</strong>. erefore, economies <strong>of</strong> scale do not significantlyfavor <strong>CAFOs</strong> over medium-sized operations.A summary <strong>of</strong> several studies comparing theproduction costs <strong>of</strong> hog operations by size showedthat smaller and medium-sized hog farms had coststhat, compared with the largest farms, ranged fromthe same to 15 to 28 percent higher (Weida 2004a).For example, in one <strong>of</strong> the cited studies, three years’worth <strong>of</strong> data suggested that the optimal operationsize based on cost <strong>of</strong> production was 120 sows (producingabout 2,400 hogs per year). Typical costs inother studies were about 5 to 11 percent higher forthe smaller farms <strong>of</strong> 150 to 250 sows (producingabout 3,000 to 5,000 hogs per year) compared withoperations <strong>of</strong> 3,500 sows. Medium-sized AFOs weretypically more efficient than the smallest operations.Pr<strong>of</strong>its per hog for the best third <strong>of</strong> producers in another<strong>of</strong> the cited studies, regardless <strong>of</strong> operationsize, averaged about $10 per hog in 1999 dollars.Smaller to medium-sized independent hog producersspan a range <strong>of</strong> production efficiencies, and
<strong>CAFOs</strong> <strong>Uncovered</strong> 19the more efficient <strong>of</strong> these operations are cost-competitivewith larger <strong>CAFOs</strong> (Ikerd 2004; McBrideand Key 2003). ese more-efficient smaller, independentoperations produce hogs at about the samecost as the larger <strong>CAFOs</strong>. In a more recent study,costs for very large hog feeder-to-finish <strong>CAFOs</strong> averagedabout 9 percent less than medium-sized operations(500 to 1,999 head). However, 38 percent <strong>of</strong>medium-sized operations had costs below $40 perhundredweight (cwt), compared with 64 percent <strong>of</strong>very large <strong>CAFOs</strong>. A similar percentage <strong>of</strong> mediumsizedoperations, and about 16 percent <strong>of</strong> smallones, had the same or lower production costs thanthe average very large hog CAFO. Many mediumsizedoperations used production practices associatedwith higher efficiency, such as “all-in-all-out”production and “phase feeding” (McBride and Key2007). 10 ese data suggest that management skillsmay oen be more important than size in determiningefficiency, and that medium-sized and somesmall AFOs are capable <strong>of</strong> production as cost-effectiveas <strong>CAFOs</strong>—even without considering the externalities<strong>of</strong> manure that <strong>CAFOs</strong> impose in greateramounts than smaller operations. 11Comparisons based on scale are difficult whencomparing fundamentally different types <strong>of</strong> animalproduction. For example, such comparisons may beuseful when comparing <strong>CAFOs</strong> to smaller but otherwisesimilar AFOs. Various alternative livestockand poultry production methods, however, may differsubstantially from <strong>CAFOs</strong> in the technology,capital, and labor processes they employ, and theconsumer markets they target. In those cases, factorsother than scale may also be important in determiningefficiency or economic viability.For example, hog hoop barns that use deep beddingare generally a substantially less expensive alternativeto hog CAFO shelters. On the other hand,because hoop barns typically allow more space peranimal (especially if the hogs are provided with outdooraccess), fewer animals may be raised per unit<strong>of</strong> land. Bedding in hoop barns—typically smallgrainstraw or corn stalks—also adds expense, becausehog <strong>CAFOs</strong> typically have no bedding. Inaddition, feed conversion rates in Iowa (where moststudies <strong>of</strong> hoop barns have taken place) are somewhatlower in typically unheated hoop barns in winter(Kliebenstein et al. 2003). us, comparisonsbetween hoop barns and <strong>CAFOs</strong> based primarily onscale may not be appropriate to determine the financialviability <strong>of</strong> these alternative methods forraising hogs.Processor-driven market controlAnother major factor in the growing predominance<strong>of</strong> <strong>CAFOs</strong> is the integrated structure <strong>of</strong> the industry.Animal production and processing has become increasinglyintegrated and concentrated over the pastseveral decades. In particular, a few very large animalprocessors largely control the supply <strong>of</strong> animalsthrough ownership or contracting arrangements.And because <strong>of</strong> increasing functional integration,processors have gained considerable economicpower over producers, who depend on processors toslaughter their animals and distribute their products.In most cases, contracts (especially productioncontracts) have become the primary marketingarrangement between animal producers and processorsor packers (oen referred to as “integrators”).Industry concentration has risen substantiallyover the past several decades, to a point where itmay have a substantial impact on producers. An industryin which the market share <strong>of</strong> the four largestfirms (“four-firm concentration” or CR4) totalsmore than 40 percent is oen considered to threatenfree-market mechanisms by giving those firms too10All-in-all-out production keeps animals <strong>of</strong> the same age together in discrete batches, rather than mingling animals <strong>of</strong> different ages. Phase feeding matchesanimals’ diets to their specific life stage.11It has been observed that many operators <strong>of</strong> smaller and independent hog farms are older and preparing for retirement (McBride and Key 2003). eseolder owners may be less willing to invest in newer management approaches or make capital improvements that would improve efficiency. Younger or newerproducers, on the other hand, may be more attracted to CAFO production methods such as contract arrangements with processors for several reasons; reduction<strong>of</strong> risk has been suggested as one. Better availability <strong>of</strong> credit has also been associated with contract production, and because <strong>of</strong> the high capital expensesassociated with <strong>CAFOs</strong>, may be a significant motivating factor (MacDonald et al. 2004; Knoeber and urman 1995). Insufficient open-market options for independentproducers may be another reason.
20 <strong>Union</strong> <strong>of</strong> <strong>Concerned</strong> <strong>Scientists</strong>much control over pricing and supply (Heffernan2000). e broiler chicken processing industry’sCR4 is 56 percent, the beef industry’s is 83.5 percent,and the hog industry’s is 64 percent, and eachhas been rising steadily for the past several decades.In 1990 these numbers were 44 percent, 72 percent,and 40 percent, respectively (Hendrickson and Heffernan2005). In 1987, the pork packers’ CR4 was 37percent, and the broiler processors’ was 35 percentin 1986—both below the 40 percent benchmark.e dairy processing industry is more complex thanother sectors, but is also undergoing increasing concentration(Hendrickson et al. 2001).Several <strong>of</strong> the largest companies, such as Cargill,ConAgra, Smithfield, and Tyson, have substantialholdings in several livestock sectors, and also ownlarge numbers <strong>of</strong> animals. For example, Smithfield isby far the largest owner <strong>of</strong> hogs in the country.Cargill and ConAgra are also grain suppliers (Hendricksonand Heffernan 2005). Growing ownershipby processors (called “captive supply”), a high percentage<strong>of</strong> production contracts, and shrinkingopen (or “spot”) markets have the potential to distortmarkets in favor <strong>of</strong> lower prices for producers.Despite this growing industry concentration,the federal authority charged with oversight <strong>of</strong> theprocessor industry, the USDA’s Grain Inspection,Packers and Stockyards Administration (GIPSA),has been strongly criticized for lax regulation <strong>of</strong>anti-competitive practices under the Packers andStockyards Act (PSA). In reports beginning in 2000,the Government Accountability Office (GAO, formerlythe General Accounting Office) and theUSDA’s Office <strong>of</strong> Inspector General (OIG) foundthat GIPSA lacked the organizational structure andprocesses needed to effectively monitor and enforcePSA provisions (GAO 2000). In particular, GIPSAdid not adequately involve attorneys from its Office<strong>of</strong> General Counsel in its investigations <strong>of</strong> potentialanti-competitive practice violations.Although GIPSA agreed to many <strong>of</strong> the recommendations<strong>of</strong> the GAO’s 2000 report, later investigationsby the GAO and OIG found that importantagreed-upon improvements had not been implemented(USDA 2006; GAO 2005), and lawyers hadnot been adequately integrated into GIPSA actions.e GAO noted that GIPSA senior managementthwarted investigations through delays and inaction,and that GIPSA <strong>of</strong>ficials had not adequatelyresponded to the GAO and OIG reports (GAO2006). e investigations <strong>of</strong> GIPSA oversight <strong>of</strong> theprocessor industry suggest that anti-competitivepractices against smaller and independent animalproducers are unlikely to be prevented under thecurrent system.e limited access <strong>of</strong> small and medium-sizedproducers to slaughterhouses is exacerbated byUSDA inspection requirements. With the exception<strong>of</strong> small chicken producers in many states that selldirectly to consumers, health inspections are necessaryfor marketing, and federal inspections are requiredfor sales across state lines. Access toregulator-approved facilities is therefore needed toensure broad market access. In other words, difficultyin gaining access to processors not only impedesproducers’ ability to slaughter their animals,but also may restrict their ability to market theirproducts. e resulting bottleneck between producerand consumer can reduce the viability <strong>of</strong> smaller andalternative producers even when their products maybe competitive based on production costs.Poultry processors, for example, have becomelarger and have built larger slaughterhouses. At thesame time, smaller processors and processing plantshave le the industry (Ollinger, MacDonald, andMadison 2005). e remaining large processorspreferentially contract with large producers (i.e.,<strong>CAFOs</strong>) and do not accept chickens or hogs fromindependent producers. is problem is exacerbatedby the need for slaughterhouses to be close to producersdue to the potential harm done to animalsduring transportation.Contracts are key features <strong>of</strong> the CAFO system.Broiler and egg production, the first types <strong>of</strong> animalproduction to develop <strong>CAFOs</strong>, were almost entirelydominated by contracting in 2001 (as shown inTable 3), with 88 percent <strong>of</strong> production under contract.Almost 61 percent <strong>of</strong> hogs were also produced
<strong>CAFOs</strong> <strong>Uncovered</strong> 21under contract in 2001, while only 31 percent wereproduced under contract from 1994 to 1995. Dairycontracts jumped from about 37 percent between1991 and 1993 to about 57 percent between 1994and 1995. Beef cattle were the only animals consideredin this report <strong>of</strong> which less than half (21 percent)were produced under contract (MacDonaldet al. 2004).Furthermore, only the largest producers typicallyuse contracts. For example, 65 percent <strong>of</strong> thelargest hog producers ($1 million production valueor greater) were under contract in 2001, while onlyabout 8 percent <strong>of</strong> small hog farms (less than$250,000 production value) used contracts. Evenmore dramatically, 92 percent <strong>of</strong> the total value <strong>of</strong>hog production was produced under contract thatyear (MacDonald et al. 2004).The role <strong>of</strong> integrators in contract processingProcessors are oen referred to as integrators becausethey combine the production and processingaspects <strong>of</strong> the industry through animal ownershipor contracts. Integrators have preferences about thesize <strong>of</strong> livestock producers with which they contract,so their decisions may have an important bearingon producer size.As noted above, most livestock are producedunder contractual arrangements with large integrators.erefore, access to processors for slaughterand distribution <strong>of</strong> animal products may oen dependon the producers’ ability to enter into contractswith processors. Because processors favorcontracts with large feeding operations, smaller oralternative animal producers can have difficulty processingand marketing their products, even if theyproduce these products at competitive prices. Andbecause the large majority <strong>of</strong> animals and productsare processed under contract, independent producersmay have difficulty in finding processors thatwill buy their products (or buy them at a fair price).Probably most important, however, is the need<strong>of</strong> large processing plants to operate near full capacityto realize economies <strong>of</strong> scale (MacDonald et al.2000). is encourages the use <strong>of</strong> contracts withlarge suppliers and captured supply, which canensure processing at full capacity.In the case <strong>of</strong> hog and beef processors,economies <strong>of</strong> scale at the largest processing plantsprovide only about a 3 to 5 percent cost savings forbeef and hog slaughter compared with plants onequartertheir size, and these savings are only realizedif the slaughterhouses run near full capacity.is favors processors that reduce their risk <strong>of</strong> operatingbelow capacity by contracting with <strong>CAFOs</strong>(MacDonald et al. 2000).Economies <strong>of</strong> scale are greater for poultry processing,and may be more directly associated withthe growth in large processing plants. e largestplants realized cost savings <strong>of</strong> about 8 percentcompared with smaller plants in 1992. erefore,Table 3. Percent <strong>of</strong> Livestock Production under Contract by SectorCommodity 1991–1993 1994–1995 1996–1997 1998–2000 2001Livestock 32.8 42.9 44.8 48.0 46.8Cattle na 19.0 17.0 24.3 20.9Hogs na 31.1 34.2 55.1 60.6Poultry and Eggs 88.7 84.6 84.0 88.8 88.1Dairy 36.8 56.7 58.2 53.6 53.1Other Livestock 0.2 9.3 4.9 10.9 9.3na=not availableData drawn from USDA Farm Costs and Returns Survey (1991–1995); USDA Agricultural Resource Management Survey (1996–2001)SOURCE: MacDonald et al. 2004.
22 <strong>Union</strong> <strong>of</strong> <strong>Concerned</strong> <strong>Scientists</strong>economies <strong>of</strong> scale may explain a substantialamount <strong>of</strong> the consolidation in the poultry processingindustry (Ollinger, MacDonald, and Madison2000). Although economies <strong>of</strong> scale are less pronouncedfor swine processors, that sector seems tobe following a similar pattern.e increasing size <strong>of</strong> meat slaughtering operationshas occurred alongside the growth <strong>of</strong> <strong>CAFOs</strong>.is has led to the disappearance <strong>of</strong> smaller processorsthat might be more accessible to smaller producers(Ollinger, MacDonald, and Madison 2005).By 1992 large plants processed 88 percent <strong>of</strong> chickens(Ollinger, MacDonald, and Madison 2005), andas <strong>of</strong> 1997, four firms handled almost 80 percent <strong>of</strong>steer and heifer slaughter—twice as much as twodecades earlier. Large plants handled 38 percent <strong>of</strong>hog slaughter in 1977, but 88 percent by 1997(Table 4).With the increase in large processors and largeplants operating through contracts with producers,and a simultaneous decrease in smaller processors,it is becoming increasingly difficult for smaller independentand alternative producers to find slaughterhouseswilling to process their animals (Fanatico2003). is problem is exacerbated for specialty producersin niche markets such as pastured-raisedbeef, which require segregation <strong>of</strong> their productsfrom mainstream products.An alternative to contracts is open bidding (alsocalled a competitive or “spot” market), which wasthe common means for producers to sell to processorsprior to the predominance <strong>of</strong> contracting. Ascontracting has expanded, spot markets have becomemore restricted in many regions, which maylimit them as a marketing option for smaller producers(MacDonald et al. 2004). An added problemis that when spot markets become too small theymay no longer function efficiently, which can lowerprices for producers.Although cattle producers may be unhappy withspot market prices, the data show only modestlylower spot prices compared with contracts (MacDonaldet al. 2004). Nevertheless, because low prices foranimals may occur for both contract and spot marketsdue to the economic concentration <strong>of</strong> processorsand their ability to cross-subsidize different sectors <strong>of</strong>their business (Heffernan 2000), spot market pricesthat are only modestly lower than contracts do notnecessarily reflect fair pricing for producers.In summary, the evidence suggests that severalfactors have influenced the expansion <strong>of</strong> <strong>CAFOs</strong>over the past several decades, including the availability<strong>of</strong> low-cost grain and coordination between<strong>CAFOs</strong> and large processors through contracts andownership. e ability <strong>of</strong> <strong>CAFOs</strong> to shi the costs <strong>of</strong>their pollution onto society has also been important,but is considered separately in Chapter 3.Economies <strong>of</strong> scale exist for some <strong>CAFOs</strong> but areoen modest, while many medium-sized AFOs areas efficient as the largest <strong>CAFOs</strong>.Table 4. Percent <strong>of</strong> Animals Slaughtered in Large PlantsSlaughter Classes and Size Cut<strong>of</strong>f*Report YearAll Cattle Steers/Heifers Cows/Bulls Hogs(
<strong>CAFOs</strong> <strong>Uncovered</strong> 23Are CAFO Alternatives Cost-effective?Smaller to medium-sized AFOs that are adequatelydistributed geographically may address some <strong>of</strong> theconcerns posed by <strong>CAFOs</strong>. But what about other alternativesthat may avoid more <strong>of</strong> the problems that<strong>CAFOs</strong> cause? Are these alternatives cost-effective?Although the following review is not intendedto be comprehensive, it shows that several <strong>of</strong> thebetter-researched alternatives can indeed competewith confinement operations. is is something <strong>of</strong> asurprise considering that the great majority <strong>of</strong> researchdollars have been devoted to improvingCAFO performance while largely neglecting alternativemethods. In fact, one <strong>of</strong> the oen-touted advantages<strong>of</strong> <strong>CAFOs</strong> is their ability to adopttechnological advances such as breeds that gainweight quickly—advances that are sometimes availableonly to large producers.e disparity in research effort also suggests thatthere may be substantial opportunities to improvethe efficiency <strong>of</strong> alternatives. is review is thereforeonly a snapshot <strong>of</strong> an evolving picture, and as suchprovides only a rough indication <strong>of</strong> the possibilities.Hog production alternativesSome <strong>of</strong> the best-studied alternatives to <strong>CAFOs</strong> involvehog production. One <strong>of</strong> these alternatives ishoop barns—open-ended structures with curvedro<strong>of</strong>s, in which hogs are allowed to “nest” in strawbedding. Hogs may also be raised on pasture.In one test, hogs raised in hoop barns in NorthDakota provided 6.63 percent higher net incomeper pig than conventional confinement. is testalso evaluated pasture-raised hogs and found thatthe net return was 4.07 percent higher than confinement(Landblom et al. 2001). ese results are alsosupported by Iowa Livestock Enterprise budgets calculatedfor confined and pasture-raised hogs for2003. at report determined the break-even sellingprice for pasture-raised hogs was $43.56/cwt, comparedwith $43.60/cwt for confined hogs (May, Edwards,and Lawrence 2003). Mid-gestation swineraised on alfalfa pasture, with only 40 percent <strong>of</strong>their diet from corn, gained weight and performedas well as swine fed an exclusively corn/soy diet(Honeyman and Roush 1999).Financial viability based on net returns (includingamortization <strong>of</strong> infrastructure and debt) hasbeen used to determine how well hoop barns comparewith confinement operations. Because hoopbarn production is more sensitive to different inputparameters than confinement, it will perform betteror worse than <strong>CAFOs</strong> under different circumstances.For example, in one test conducted in Iowaduring winter, when feed conversion efficiency ispoorer than for confinement systems, hoop barnsdo less well by comparison. In warmer months,when conversion efficiencies are comparable, hoopbarns oen do as well or better than confinementproduction (Honeyman and Harmon 2003;Kliebenstein et al. 2003).Poorer winter conversion efficiency, which resultsin a slightly poorer overall efficiency, meansthat the financial viability <strong>of</strong> hoop barns is likely tobe more sensitive to grain prices than <strong>CAFOs</strong>. Forinstance, hoop barns will do less well by comparisonparticularly when grain prices are high and thegrain must be purchased rather than raised on thefarm. is alternative is also more sensitive to returnson investment: hoop barns delivered a higherreturn at prices over $54/cwt, while confinementoperations delivered better returns at lower prices.In addition, slightly more labor (three to six minutesper pig) was needed for hoop barns, so net returns forconfinement hogs were about 20 percent higher inthis test.An additional consideration not evaluated inthese studies is the effect <strong>of</strong> geographic location oneconomic efficiency. For example, hoop barns mayperform better in locations where the climate ismilder than Iowa and the feed conversion ratios willthus be higher. On the other hand, because Iowa—the country’s top hog-producing state—is alsolocated in the country’s corn belt, its grain prices arelower than some other regions <strong>of</strong> the country. ismay favor production in hoop barns in Iowa even iffeed conversion efficiencies are lower than in statesthat have milder climates but little grain production.
26 <strong>Union</strong> <strong>of</strong> <strong>Concerned</strong> <strong>Scientists</strong>Impact on global warmingOne important externality <strong>of</strong> livestock productionis the emission <strong>of</strong> heat-trapping gases such asmethane. Cattle are a major source <strong>of</strong> methane,which is produced during both the fermentation <strong>of</strong>feed in the animal’s gut and the anaerobic fermentation<strong>of</strong> manure in CAFO lagoons and other manureholding structures.Cows that feed on pasture or forage producemore methane during digestion than grain-fed cows(Clemens and Ahlgrimm 2001). ough this may bereduced substantially by optimizing productivitythrough MIRG (DeRamus et al. 2003), it is not clearthat methane levels can be reduced to those <strong>of</strong>grain-fed cattle.Production <strong>of</strong> the heat-trapping gas nitrousoxide from the breakdown <strong>of</strong> fertilizer used to producegrain must also be weighed against the production<strong>of</strong> nitrous oxide from manure produced by<strong>CAFOs</strong> and their alternatives. erefore the net effecton global warming pollution from pasture- versusgrain-fed livestock is unclear (Liebig et al. 2005).It should be noted, however, that althoughmethane production may be about 125 percenthigher on pasture operations compared with<strong>CAFOs</strong> (Boody et al. 2005), the atmospheric impactwould likely be <strong>of</strong>fset by higher capture <strong>of</strong> carbondioxide (Russelle, Entz, and Franzluebbers 2007).e results <strong>of</strong> several studies suggest that perennialpasture may capture about 0.9 metric ton <strong>of</strong> carbondioxide per hectare per year, while commoditycrops in Minnesota—even when grown under conservationtillage—capture only one-third thatamount (Boody et al. 2005).On balance, it appears likely that alternativeproduction systems that reduce the size and geographicdensity <strong>of</strong> animal feeding operations havesubstantial benefits compared with <strong>CAFOs</strong>. It is notpossible at this time to determine whether lowerglobal warming pollution is one <strong>of</strong> those benefits,but alternative integrated animal and crop productionsystems will likely substantially reduce otherexternalities associated with <strong>CAFOs</strong>.Conclusionse small sample <strong>of</strong> studies discussed above cannotbe used to draw sharp conclusions about the productivity<strong>of</strong> alternative animal production methodscompared with <strong>CAFOs</strong>. Many variables can affectboth productivity and pr<strong>of</strong>itability, including managementcapability, geography (e.g., regional climate),and availability <strong>of</strong> processors and markets.Some important parameters also change over timeas research develops new innovations and breeds oras the prices <strong>of</strong> grain, energy, and other inputschange.Despite these data limitations, however, thisoverview <strong>of</strong> alternative animal production and historictrends related to animal feeding operations allowsus to draw some broad conclusions about<strong>CAFOs</strong> and alternative animal production methods.First, although <strong>CAFOs</strong> oen exhibit someminor economies <strong>of</strong> scale, superior managementmay oen be more important in determining productionefficiency in at least some sectors. Wellmanagedsmaller to medium-sized swineoperations, for example, are as economically efficientas large <strong>CAFOs</strong>. Alternative systems can oenproduce animal products cost-effectively, and at anet pr<strong>of</strong>it to producers.Second, the largest obstacle facing alternativesis not the inability to produce animals efficiently,but the effects <strong>of</strong> processor-related market power.Challenges in this regard (vertically coordinatedproduction contracts between <strong>CAFOs</strong> and processors,elimination <strong>of</strong> smaller processors, and shrinking<strong>of</strong> efficient spot markets in some areas) couldhamper smaller and alternative producers evenwhen they may otherwise produce animals in acost-effective and pr<strong>of</strong>itable manner.Finally, alternatives that integrate animal andcrop production can provide benefits to farms andsociety alike, in the form <strong>of</strong> higher pr<strong>of</strong>itability andreduced externalities. Linking manure to croppingsystems, for example, creates major economic, social,and environmental benefits for an entire
egion. Considering the relatively limited researchcurrently available on ways to improve alternativeanimal farming systems, further research is neededto expand these benefits.<strong>CAFOs</strong> <strong>Uncovered</strong> 27
<strong>CAFOs</strong> <strong>Uncovered</strong> 29C h a p t e r 2DIRECT AND INDIRECT SUBSIDIES TO <strong>CAFOs</strong>The price consumers pay for animal products atthe grocery store does not reflect all <strong>of</strong> the costssociety as a whole pays for these products. One <strong>of</strong>the important ways these costs are masked isthrough the provision <strong>of</strong> subsidies to <strong>CAFOs</strong>. Somesubsidies may go directly to <strong>CAFOs</strong>; others (socalledindirect or implicit subsidies) go to otherparts <strong>of</strong> the economy and are then passed on to<strong>CAFOs</strong>. ese indirect subsidies may easily go unnoticedby the general public, but are just as importantto <strong>CAFOs</strong> in facilitating their operation andgrowth. Where subsidies go to <strong>CAFOs</strong> preferentiallyover other production systems, they provide an especiallyimportant advantage.In this chapter, several types <strong>of</strong> subsidies thathave been given to the CAFO industry are examined.One particularly substantial indirect subsidyhas been payments made to commodity crop growers,largely for corn and soybeans, which is passedon to the CAFO industry in the form <strong>of</strong> artificiallylow feed grain prices. ese low prices have largelybeen the result <strong>of</strong> the elimination <strong>of</strong> grain supplycontrols that were intended to keep prices at a reasonablelevel. is and other changes in federal farmlegislation have allowed the price <strong>of</strong> feed grains todrop below the cost <strong>of</strong> production in many years. Inresponse, lawmakers have compensated grain growersfor most <strong>of</strong> the difference between their cost <strong>of</strong>production and low market prices. Such indirectcrop subsidies have amounted to a windfall <strong>of</strong> severalbillion dollars per year for the CAFO industry.e second type <strong>of</strong> subsidy examined in this reportis direct payments made to the CAFO industrythrough the federal Environmental Quality IncentivesProgram (EQIP), which provides about$100 million per year to <strong>CAFOs</strong> to reduce some <strong>of</strong>the environmental damage they cause. EQIP subsidies,like commodity crop subsidies, are ultimatelypaid for by taxpayers, and could become increasinglyimportant as pressure is applied to the industryto clean up its practices.Although the reduction <strong>of</strong> harm caused by<strong>CAFOs</strong> is desirable, EQIP payments raise legitimatequestions about whether the public should underwrite<strong>CAFOs</strong> in this way. is is especially importantwhen considered in the context <strong>of</strong> alternativeproduction systems that are efficient, cause fewerproblems, and have greater societal benefits.Subsidies are appropriate buffers for the agriculturalsector against the uncertainties <strong>of</strong> nature andprice dips due to overproduction, and they encourageconservation and technological innovation.However, it is essential that subsidies also encourageand support desirable agricultural practices.How Crop Subsidies Have Propped Up <strong>CAFOs</strong>Livestock raised in confinement eat an enormousamount <strong>of</strong> corn and soybeans. Grain and animalproduction (and their respective costs) are thereforeinseparable when evaluating CAFO production.Over the last 80 years or so, U.S. farm policy hassubsidized the production <strong>of</strong> commodity crops suchas corn and soybeans in a variety <strong>of</strong> ways; currently,some payments are made to commodity farmers regardless<strong>of</strong> market prices or production costs. Herewe examine whether these subsidies have contributedto the growth <strong>of</strong> <strong>CAFOs</strong>, which are the primaryusers <strong>of</strong> these crops.A majority <strong>of</strong> the two most widely cultivatedcrops in the United States, corn and soybeans, is fedto livestock. In 2007, corn was grown on about
30 <strong>Union</strong> <strong>of</strong> <strong>Concerned</strong> <strong>Scientists</strong>93 million acres and soybeans on about 64 millionacres. Alfalfa is grown for livestock forage on about22 million acres (out <strong>of</strong> the 60 million total acres devotedto various types <strong>of</strong> hay); sorghum (mostly forfeed) is grown on about 8 million acres and substantialamounts <strong>of</strong> corn stover (stalks and leaves) arealso used for cattle forage or silage.By contrast, wheat (the crop most widely grownprimarily for food in the United States) is plantedon about 60 million acres, and rice on less than3 million acres. Most familiar vegetable and fruitcrops are grown on even smaller acreages. For example,potatoes are grown on about 1.1 millionacres, tomatoes on about 425,000 acres, apples onabout 360,000 acres, lettuce on about 310,000 acres,and carrots on about 100,000 acres (NASS 2008).e tremendous amount <strong>of</strong> corn and soybeansgrown for animal feed reflects the huge amount <strong>of</strong>animal production in the United States. 13 Feed graincosts make up a large proportion <strong>of</strong> the cost <strong>of</strong> raisinganimals in <strong>CAFOs</strong>: corn and soybeans generallymake up about 50 to 60 percent <strong>of</strong> the cost <strong>of</strong> producingchickens, eggs, and pork, and somewhat lessfor dairy and beef. Because cows can efficiently digestthe cellulose that comprises most <strong>of</strong> a plant’sstalks and leaves, cattle could survive on those parts<strong>of</strong> crops rather than on kernels or beans. However,in <strong>CAFOs</strong> a cow’s diet is largely composed <strong>of</strong> grain,which has high caloric or protein content, can beeasily transported to the animals compared withbulkier forages, and is relatively cheap.Because <strong>of</strong> the close connection between cropprices and CAFO costs, it is important to understandthe forces that determine grain prices in theUnited States. Federal government policy, for one,has a significant effect on the price <strong>of</strong> corn, soybeans,and a few other crops. e government hasimplemented various programs under Title I <strong>of</strong> thefarm bill to buffer farmers against loss (such aslosses resulting from farmers’ tendency to overproducecommodity crops, leading to crop prices thatare oen below the cost <strong>of</strong> production). Farmersalso tend to accept lower market prices because theyare not as economically concentrated as farm inputindustries or food processors and retailers, and theircommodities are perishable.e farm bill has been reenacted and modifiedapproximately every five years since the 1930s. Priorto the 1980s, its commodity programs focused primarilyon controlling the supply and price <strong>of</strong> thecovered crops. Such policies have included governmentpurchase <strong>of</strong> grain surpluses and the transfer <strong>of</strong>grain acreage into government-supported conservationset-aside and reserve programs. Policies directedat controlling the supply <strong>of</strong> grain have thegeneral effect <strong>of</strong> keeping the market price high(above the cost <strong>of</strong> production), thereby allowingfarmers to make a pr<strong>of</strong>it (Ray, De La Torre Ugarte,and Tiller 2003). ough price supports and supplycontrols from farm bills prior to 1996 could onlymoderate rather than completely prevent below-costproduction, they nonetheless had a substantial impacton prices. 14Since the 1980s, and especially since 1996, Title Iprograms have moved away from controlling thesupply or price <strong>of</strong> commodity crops (Ray, De LaTorre Ugarte, and Tiller 2003). e newer programssupport commodity crop farmers with disasteremergency payments, marketing loan gains, andloan deficiency payments when the cost <strong>of</strong> productionexceeds the crop price. Until the past two years<strong>of</strong> rising market prices, these programs compensatedfor much <strong>of</strong> the difference between productioncosts and low prices. As a consequence, the price <strong>of</strong>grains was allowed to fall as the crops were overproduced.Between the passage <strong>of</strong> the 1996 farm billand 2005, for example, corn prices dropped 32 percentand soybean prices fell 21 percent, while cornproduction increased by 28 percent and soybeanproduction rose 42 percent (ERS 2005). One study13 It is also a reflection <strong>of</strong> the fact that it takes several pounds <strong>of</strong> grain to produce one pound <strong>of</strong> animal product. is is an extremely important issue in terms<strong>of</strong> agricultural sustainability, but is beyond the scope <strong>of</strong> this report.14 e tendency toward low commodity prices is primarily a function <strong>of</strong> farm economics, and only partially altered by subsidies (Ray, De La Torre Ugarte,and Tiller 2003).
32 <strong>Union</strong> <strong>of</strong> <strong>Concerned</strong> <strong>Scientists</strong>e EPA definition <strong>of</strong> hog <strong>CAFOs</strong> used for thisreport includes operations <strong>of</strong> more than 2,500 animals,but USDA data used to calculate the grainsubsidy for hog <strong>CAFOs</strong> do not include a size categorythat corresponds exactly to the EPA’s lowerlimit <strong>of</strong> 2,500 hogs. e calculations that come closestto the EPA category used in this report comefrom a study <strong>of</strong> hog operations larger than 2,000 animals(Starmer and Wise 2007a), which generallyuse production methods similar to larger <strong>CAFOs</strong>. 16is study found that the average indirect subsidyfor hog operations <strong>of</strong> 2,000 animals or moreamounted to more than $945 million per year since1997. In 2006, 2,910 operations containing morethan 2,000 pigs held 88 percent <strong>of</strong> U.S. hog inventory(NASS 2007). A rough estimate <strong>of</strong> the subsidyfor each large hog CAFO is therefore about$325,000 per operation per year.Hog operation ownership data allow furtherbreakdown <strong>of</strong> savings by size <strong>of</strong> operation; 17 for example,owners <strong>of</strong> operations totaling 50,000 or morehogs produced 54 percent <strong>of</strong> total U.S. hog inventoryin 2006, or about 61 percent <strong>of</strong> the CAFO inventory.e largest CAFO owners thereforebenefited from about $576 million in subsidies forthe year. e 115 owners <strong>of</strong> operations with morethan 50,000 hogs each received an average subsidy<strong>of</strong> about $5.01 million for the year. By contrast, the1,690 owners <strong>of</strong> operations totaling between 2,000and 4,999 hogs held 10.8 percent <strong>of</strong> the CAFO inventory,and therefore averaged about $60,000 insubsidies per owner.Indirect Subsidies to Beef and Dairy <strong>CAFOs</strong>Grain makes up a smaller but still significant portion<strong>of</strong> the production costs <strong>of</strong> raising cattle—13 to17 percent <strong>of</strong> the costs <strong>of</strong> producing feedlot beef cattle.is industry’s overall production costs were reducedan average <strong>of</strong> about 5 percent per year overthe past 10 years due to indirect subsidies given tograin growers.e composition <strong>of</strong> feed for dairy cows is lessuniform than other sectors, but remains a substantialcost <strong>of</strong> dairy production. Data from Iowa,Kansas, Ohio, and Wisconsin between 2002 and2003 show that feed represents between 38 and 43percent <strong>of</strong> production costs, <strong>of</strong> which corn representsbetween 11 and 22 percent. erefore, if thetrue cost <strong>of</strong> production was paid for feed corn, totalproduction costs would be raised by about 4 to 7percent for these states, with the weighted averageover 6 percent (Starmer 2007).Calculations for this report (Starmer 2007)using the same methods as for poultry and hogs(Starmer, Witteman, and Wise 2006) show that Title Icrop payments also provide large indirect subsidiesto beef and dairy <strong>CAFOs</strong>. Although the cost data fordairy <strong>CAFOs</strong> are limited and expected to vary byyear and region, we can arrive at a rough estimate <strong>of</strong>the indirect subsidies given to these operations.USDA statistics do not include a category thatcorresponds exactly to the EPA definition <strong>of</strong> a dairyCAFO (700 or more animals). We therefore used theclosest USDA category—more than 500 cows—forour calculations. e annual national feed savingsfor such dairies, as extrapolated from Iowa, Kansas,Ohio, and Wisconsin, amounts to about $733 millionper year. In 2006 there were 3,143 dairy operationswith 500 or more cows, accounting for 46.7percent <strong>of</strong> the U.S. inventory (NASS 2007). erefore,the average subsidy for each CAFO is roughlyestimated to have been about $233,000 per year.As with hogs, the largest dairy <strong>CAFOs</strong> benefitmore than their smaller counterparts from the lowcost <strong>of</strong> grain. Confined operations <strong>of</strong> more than2,000 animals contained 21.6 percent <strong>of</strong> the U.S. inventoryin 2006, or about 46 percent <strong>of</strong> dairy CAFOinventory. ere were 573 <strong>of</strong> these very large opera-16 e entire class <strong>of</strong> hog operations containing 2,000 to 4,999 hogs comprises only 9.5 percent <strong>of</strong> hog production, according to NASS data for 2006.erefore, hog operations between 2,000 and 2,499 hogs likely produced less than 1.6 percent <strong>of</strong> hogs.17 A single owner may own multiple operations, and owners with the largest number <strong>of</strong> operations also maintain the largest operations in size.
<strong>CAFOs</strong> <strong>Uncovered</strong> 33tions nationally (NASS 2007), receiving an averagesubsidy <strong>of</strong> about $588,000 each per year. By contrast,smaller <strong>CAFOs</strong> (700 to 999 cows) andmedium-sized AFOs (500 to 699 cows) collectivelycontained 12.6 percent <strong>of</strong> U.S. dairy cow inventory,or about 27 percent <strong>of</strong> dairy CAFO inventory. ese1,700 operations therefore benefited from an averagesubsidy <strong>of</strong> about $116,000 each.Data collected by the USDA on feedlot beef cattleare not as extensive as for other sectors, so datafrom several states have been used to approximatethe indirect subsidies paid to feedlot beef cattle<strong>CAFOs</strong>. As with the dairy industry, these calculationsmust be understood to be a small sample <strong>of</strong>the costs and feed compositions that may occur invarious parts <strong>of</strong> the country. And unlike the data fordairy cattle, data from Iowa and Minnesota for feedlotcattle span the longer period <strong>of</strong> 1997 to 2003.Corn makes up a larger share <strong>of</strong> the feed costcompared with dairy cows (an average <strong>of</strong> 72 percent),but feed in general makes up a similar share<strong>of</strong> the total production costs compared with dairycows (about 16 percent) and a smaller share comparedwith hogs or poultry. is is largely becausecalves (purchased by beef cattle feedlots), make up alarger share <strong>of</strong> beef cattle production costs than animalsin other sectors, and therefore grain makes upcorrespondingly less <strong>of</strong> the total cost <strong>of</strong> producingbeef cattle than dairy cows or other livestock. Extrapolatedto national production levels, our calculationsfind that the implicit subsidies for feedlotcattle <strong>CAFOs</strong> average about $500 million per year,or about 5 percent <strong>of</strong> total production costs per yearbetween 1997 and 2003.According to the USDA, extremely large feedlotsnow dominate beef cattle marketing. Feedlotssmaller than 1,000 animals sold only about 14 percent<strong>of</strong> beef cattle but made up almost 98 percent <strong>of</strong>all feedlots (GIPSA 2002). Feedlots <strong>of</strong> 1,000 to32,000 animals sold about 22 percent <strong>of</strong> beef cattleand represented about 26 percent <strong>of</strong> beef <strong>CAFOs</strong>,thereby receiving an average subsidy <strong>of</strong> about$72,000 each. e 168 largest beef feedlots (over32,000 animals) sold more than 64 percent <strong>of</strong> feedlotcattle and represented about 74 percent <strong>of</strong> beef<strong>CAFOs</strong> (GIPSA 2002). ese huge operations receivedan average <strong>of</strong> about $2.2 million per feedlotin grain subsidies per year.Indirect Subsidies across SectorsIn summary, commodity crop subsidies that compensatefor low grain prices contributed about$34.74 billion between 1997 and 2005 to poultry,swine, beef, and dairy <strong>CAFOs</strong> (see also Starmer andWise 2007b). is amounts to about $3.86 billionper year, with the proviso that data for dairy cowsand beef cattle are limited by region and year, andtherefore nationwide averages over time are providedfor illustration purposes rather than as highlyaccurate values for these sectors. e data from thepreceding analyses are summarized in Table 5(p. 34).Because <strong>of</strong> integration in the animal productsindustry, these savings are a boon to processors aswell as <strong>CAFOs</strong>. For example, the four largest broilercompanies saved approximately $5.6 billion from1997 to 2005, and the four largest swine processorssaved about $4.3 billion (Starmer and Wise 2007b).Subsidies for Alternative Production MethodsIt is useful to ask whether alternative methods <strong>of</strong>producing livestock have also benefited from Title Icrop subsidies. Have these subsidies favored <strong>CAFOs</strong>over other means <strong>of</strong> producing livestock that havefewer externalities? Diversified farms—those thatproduce both grain and livestock—are one alternativeto specialized <strong>CAFOs</strong>, which grow little or nograin. 18 For example, national survey data (Boessen,Lawrence, and Grimes 2004) found that 94 percent<strong>of</strong> small hog producers grew corn and 90 percentgrew soybeans, while 84 percent <strong>of</strong> medium-sizedproducers grew corn and 80 percent grew soybeans.Fewer hog <strong>CAFOs</strong> grew corn (73 percent) and soybeans(68 percent). ese data did not include asubcategory for the largest hog <strong>CAFOs</strong>, which couldhave indicated whether these very large operations
34 <strong>Union</strong> <strong>of</strong> <strong>Concerned</strong> <strong>Scientists</strong>Table 5. Indirect Subsidies to the CAFO Industry, 1997–2005Average Annual Average Annual Average Annual AverageSector Subsidy Subsidy per Subsidy per Reduction inCAFO Large CAFO Cost <strong>of</strong> ProductionBroilers $1.25 billion $766,000 na 13%Dairy $733 million $233,000 $588,000 6%Eggs $432 million $388,000 na 13%Feedlot Beef $500 million $72,000 $2.20 million 5%Swine $945 million $325,000 $5.01 million 15%Total$3.86 billionna=not availableSOURCES: Starmer 2007; Starmer and Wise 2007a; Starmer, Witteman, and Wise 2006.also grow some <strong>of</strong> their own grain, and did not revealthe percentage <strong>of</strong> feed grain produced on-farmin each size category.Other data indicate that <strong>CAFOs</strong> have much lesscropland available, relative to the amount <strong>of</strong> animals,compared with smaller operations (Kellogget al. 2000). Medium-sized operations <strong>of</strong> 150 to 300AU (animal units) had 0.17 AU per acre <strong>of</strong> croplandavailable to receive manure in 1997, while <strong>CAFOs</strong>had 1.7 AU per acre—or 10 times less land per animal.Smaller and medium-sized diversified farmswould generally be expected to use all <strong>of</strong> the manureproduced by their animals, in an economically andenvironmentally favorable manner (provided theircropland is near the livestock operation).Changes in the 1990 farm bill allowed farmersto retain the grain they produce but still receive loandeficiency payments. erefore, diversified farmscould benefit from Title I subsidies even if they retainedtheir grain as feed for their own animalsrather than opting to sell it. However, grain subsidiesdo not necessarily entirely compensate for lowgrain prices. One study (Ray, De La Torre Ugarte,and Tiller 2003) found that, over a two-year period,Title I subsides usually did not fully compensatefarmers for the difference between production costsand grain prices, creating a “subsidy gap.” Even withsubsidies, returns for corn were 6 percent belowproduction costs for 2000 and 1 percent above productioncosts for 2001; soybean returns were 9 percentand 11 percent below production costs,respectively.<strong>CAFOs</strong> that buy grain would not experiencethis subsidy gap because they would purchase grainat the low market price, while diversified farmerswould have to contend with production costs notentirely compensated by subsidies. Even though diversifiedfarms could benefit from crop subsidies,they would not receive as great a benefit as <strong>CAFOs</strong>that purchase grain.To illustrate the subsidy gap, our calculationsshow the lower feed cost for <strong>CAFOs</strong> compared withhog farmers who grew their own grain in 2000 and2001 (Table 6). Title I subsidies would thereforehave favored the development <strong>of</strong> <strong>CAFOs</strong> over diversifiedfarms. It should also be noted that even withsubsidies for diversified farms that grow their owngrain, such farms may generally have produced thisgrain at a loss.Indirect subsidies for pasture systemsTo the extent that alternative means <strong>of</strong> livestockproduction do not use subsidized grain, they wouldnot benefit from Title I crop subsidies. In particular,18 e term “diversified farm” is used here in the very narrow sense <strong>of</strong> a farm that produces both grain and livestock. However, in other contexts, this termhas been used to define farms that produce many different crops as well as livestock. Such highly diverse farms oen have additional sustainability advantages.
<strong>CAFOs</strong> <strong>Uncovered</strong> 35Table 6. Comparison <strong>of</strong> Subsidies for <strong>CAFOs</strong> and Diversified FarmsHog <strong>CAFOs</strong> 2000 2001Diversified HogFarms2000 2001Market Price for Feed $92.72 $92.48 Cost <strong>of</strong> Feed Production $103.06 $97.94($/ton)Minus Subsidies ($/ton)True Cost <strong>of</strong> Feed $137.35 $126.86 True Cost <strong>of</strong> Feed $138.38 $127.41Production ($/ton)Production ($/ton)Indirect Feed Subsidy 48% 37% Feed Subsidy 34% 30%SOURCE: Starmer 2007; calculations based on differences between subsidies and production costs from Ray, De La Torre Ugarte, and Tiller 2003.pasture production and non-grain forages are notsubsidized and are therefore put at a disadvantageby these non-market practices.The Effect <strong>of</strong> Changing Grain PricesRising demand for fuel ethanol in the United Stateshas dramatically changed the economics <strong>of</strong> grainproduction by pushing corn prices to historic highs,from around two dollars per bushel in 2005 to threedollars per bushel in 2006 and $3.88 in December2007 (NASS 2008a and 2008b). Many experts such asthe Food and Agricultural Policy Research Institute(FAPRI), upon which the federal government oenrelies for agricultural analyses, predict that cornprices will remain high at least through 2011.e price <strong>of</strong> corn is no longer below the cost <strong>of</strong>production, and soybean prices are expected tocome closer to the cost <strong>of</strong> production over the comingyears. Under these circumstances, the feed pricesubsidies that have benefited <strong>CAFOs</strong> historicallyseem to be rapidly coming to an end—at least for thenext several years. It is therefore relevant to ask howthese higher feed prices may affect <strong>CAFOs</strong> in comingyears.Increased demand has, in turn, led to increasedplanting <strong>of</strong> corn: about 93 million acres in 2007compared with 82 million acres in 2005 (NASS2008a). Although such large increases in acreagewould have driven prices down in the past, thisseems unlikely in the near future because <strong>of</strong> increasingdemand for ethanol and growing internationaldemand. Continued growth in ethanol demand willdepend in part on resolving limitations in productionand distribution infrastructure, the price <strong>of</strong> importedethanol, and continuing domestic ethanolsubsidies, but is not likely to disappear entirely. Accordingto estimates based on current technology,the entire domestic corn crop would meet onlyabout 12 percent <strong>of</strong> U.S. gasoline and 6 percent <strong>of</strong>U.S. diesel needs (Hill et al. 2006). erefore, evenmodest percentage increases in ethanol fuel usecould continue to put heavy demand on corn.Calculations using FAPRI data determine thecost-price margins for corn and soybeans from 2006to 2011 (Starmer 2007). Corn is expected to continueselling at a price that exceeds the cost <strong>of</strong> production,while soybean prices move closer topr<strong>of</strong>itability over the next several years. If currenttrends continue, corn would exceed the cost <strong>of</strong> productionby 25 percent in 2011. Overall feed pricesfor hogs would average about 3 percent over the cost<strong>of</strong> production for the period. Because hog productionbenefited from an indirect subsidy averagingabout 13 percent from 1997 to 2005, the net increasein production costs between 2007 and 2011 wouldbe about 15 percent. Similar calculations wouldapply to the other livestock sectors discussed in thisreport. Given the rapidly changing prices for graincrops, these data are likely to become outdated19 It should be noted that cost <strong>of</strong> crop production is determined in part by the prices <strong>of</strong> farm supplies. Some sectors <strong>of</strong> the farm supply industry, notably theseed industry, have become more economically concentrated over the past several decades. Resulting price increases in seeds or other farm supplies mayerode the pr<strong>of</strong>its <strong>of</strong> grain farmers.
36 <strong>Union</strong> <strong>of</strong> <strong>Concerned</strong> <strong>Scientists</strong>quickly, but nonetheless illustrate that the indirectsubsidies <strong>of</strong> the past have largely disappeared. 19As the market price <strong>of</strong> corn or other feed grainsexceeds the cost <strong>of</strong> production, diversified farmsthat produce their own grain gain some economicadvantages. As noted in Table 6, specialized <strong>CAFOs</strong>benefit more from crop subsidies than diversifiedfarms. Conversely, as grain prices rise, <strong>CAFOs</strong> loserelatively more <strong>of</strong> this benefit compared with diversifiedfarms that grow their own grain. Rising grainprices allow diversified farms to avoid paying thedifference between the costs <strong>of</strong> production and thehigher price they would otherwise have to pay forfeed if they did not produce their own grain. Additionally,production systems that use pasture andforage rely less on grain than <strong>CAFOs</strong> and may alsoacquire an economic advantage.To the extent that the FAPRI projections are fulfilledor exceeded, <strong>CAFOs</strong>’ costs could rise substantiallyin coming years. e elimination <strong>of</strong> thesubsidy gap and a lower cost for growing ratherthan buying feed grain could eliminate some <strong>of</strong> theeconomic advantage that large hog and other<strong>CAFOs</strong> currently maintain over diversifiedmedium-sized animal operations.It is not clear, however, whether such a change inpr<strong>of</strong>itability would result in substantial increases inalternative animal farming. As noted in Chapter 1,several alternative production methods includingwell-managed medium-sized AFOs are alreadyroughly cost-competitive with <strong>CAFOs</strong>, but oenhave difficulty gaining market access. Structural barriersto alternative animal production, such as thepreference <strong>of</strong> processors to contract with large producers,are not eliminated by increasing grain prices.e possible cost advantages that alternative productionmethods could acquire may not be dramaticenough to overcome these structural barriers, andpoint to the need for policies that will facilitate thegrowth <strong>of</strong> beneficial animal production methods.The role <strong>of</strong> feed alternativesAnother consideration that may affect the feedcosts for <strong>CAFOs</strong> and other grain-feeding operationsis the use <strong>of</strong> feed alternatives that may be lessexpensive than grain, such as the major by-product<strong>of</strong> the ethanol fermentation process: so-called drieddistillers grains with solubles (DDGS). DDGS hasconsiderable nutritional value, is enriched in proteincontent compared with corn, and may be considerablyless expensive under some circumstances.Most <strong>of</strong> the starch, the readily available carbohydratesource in corn (and the main source <strong>of</strong> easilydigestible calories for livestock), is converted intoethanol and thereby removed from the grain. eoverall nutrient content, however, is concentratedin DDGS compared with corn, and fiber digestibilityis increased, compensating in part for loststarch.Several factors currently limit the use <strong>of</strong> DDGSas a substitute for corn and other grains. A recenthog-finishing study showed that although a dietwith 10 percent DDGS provided good performance,diets that included 20 to 30 percent DDGS reduceddaily weight gain (Whitney et al. 2006).Although feed costs were lowered compared withcorn priced at two to four dollars per bushel, thisdid not compensate for the lower weight gain, makingDDGS economical only at the 10 percent feedlevel. erefore, the study authors recommendedthat DDGS should make up less than 20 percent <strong>of</strong>a hog-finishing diet.Similarly, recent research on broilers demonstratedthat substituting DDGS for 15 percent <strong>of</strong>grain did not reduce the weight or quality <strong>of</strong> thechickens, but 30 percent DDGS adversely affectedgrowth rates even when alternating with 0 percentDDGS on a weekly basis (Wang et al. 2007). Cattlecan utilize greater concentrations <strong>of</strong> DDGS in theirfeed, with dairy cows using about 20 percent andbeef cows about 30 percent or more (Hicks 2007;Schingoethe 2006).A second limitation <strong>of</strong> DDGS is that it containsconsiderable moisture. is greatly limits storagetime due to spoilage, and increases transportationcosts compared with dry grains. DDGS can bedried and formed into pellets, but drying adds expenseand uses energy. For these reasons, DDGS is
<strong>CAFOs</strong> <strong>Uncovered</strong> 37currently most feasible—to the extent they can beused—for cattle located close to <strong>CAFOs</strong>.Finally, major changes in livestock diet mayhave unanticipated consequences. Recent work indicatesthat beef cattle fed 25 percent DDGS may producesignificantly higher levels <strong>of</strong> Escherichia coliO157 than beef cattle fed a conventional diet (Jacobet al. 2007). Increased levels <strong>of</strong> this serious foodbornepathogen would be an undesirable side effect<strong>of</strong> using DDGS, counteracting the benefit <strong>of</strong> lowerproduction costs with another potential publichealth threat.Summary <strong>of</strong> Indirect Subsidies to <strong>CAFOs</strong>Title I farm bill crop subsidies have provided hugeindirect subsidies to <strong>CAFOs</strong>: estimated at $3.8 billiona year over the eight-year period from 1997 to2005 (Starmer 2007; Starmer and Wise 2007b). isnot only makes <strong>CAFOs</strong> appear more economicallyefficient than they actually are, but also gives<strong>CAFOs</strong> an advantage over alternative means <strong>of</strong> producinganimal products that do not benefit (or benefitless) from these subsidies.Rising grain costs driven by corn ethanol demandhave made such alternatives more favorableeconomically, but structural barriers may prevent orslow the ability <strong>of</strong> alternatives to penetrate the market.Alternative feeds for <strong>CAFOs</strong>, especially DDGSproduced in large quantities as an ethanol by-product,currently have several limitations that preventthem from displacing more than a small to moderateamount <strong>of</strong> corn feed.Direct Subsidies to <strong>CAFOs</strong>In addition to the indirect subsidies <strong>CAFOs</strong> receivein the form <strong>of</strong> crop support and lack <strong>of</strong> accountabilityfor externalities, direct government subsidiesalso encourage the proliferation <strong>of</strong> <strong>CAFOs</strong>. Wheredirect subsidies favor <strong>CAFOs</strong> over other ways <strong>of</strong>raising livestock, they may also discourage otherwiseviable alternatives. At the national level, perhapsthe largest single direct subsidy to <strong>CAFOs</strong> isthe Environmental Quality Incentives Program(EQIP), originally intended to help small andmedium-sized livestock farms address pollution issues.We examine EQIP in some detail, but it shouldbe kept in mind that many similar initiatives at thestate level may collectively contribute substantial additionalsubsidies to <strong>CAFOs</strong>.EQIP originated as part <strong>of</strong> the 1985 farm billand was renewed in all subsequent farm bills includingthe 2002 version. e intent <strong>of</strong> the program wasto provide subsidies and incentives that would helpboth crop and livestock farmers prevent environmentalharm. In the case <strong>of</strong> livestock operations,<strong>CAFOs</strong> (defined as operations with 1,000 AU ormore) were specifically excluded from the earlierversions <strong>of</strong> the program, which focused on pasturebasedanimal farms and other smaller operationsthat may have difficulty acquiring the funds neededto implement pollution control. e program wasrelatively modest at the time; for example, the versionpassed in 1996 allocated a total <strong>of</strong> $200 millionper year in federal funding.In 2002, however, the program’s emphasis waschanged dramatically, making <strong>CAFOs</strong> a majorfunding recipient. e upper cap for contracts withindividual farms was raised dramatically from$50,000 to $450,000 per project, and total programfunding rose from $400 million in 2002 to a projected$1.36 billion in 2007 (NRCS 2003).At the same time, the program’s regulatory languagemandates that 60 percent <strong>of</strong> EQIP fundingshould be devoted to animal farming, ensuring alarge amount <strong>of</strong> funds are available for these operations(NRCS 2003). ough the language does notspecifically base funding on operation size (NRCS2003), priorities are described that favor projects capable<strong>of</strong> achieving the greatest reduction in environmentaldegradation (which favors <strong>CAFOs</strong>). In awhite paper prepared prior to finalizing the 2002program, the USDA’s Natural Resources ConservationService (NRCS) explicitly suggested that becausesimilar amounts <strong>of</strong> effort and cost are neededto implement each EQIP contract, more benefitmight be garnered by allocating funds to large
38 <strong>Union</strong> <strong>of</strong> <strong>Concerned</strong> <strong>Scientists</strong><strong>CAFOs</strong> rather than a greater number <strong>of</strong> smalleroperations (NRCS 2002).e new EQIP regulation prioritizes activitiesthat only <strong>CAFOs</strong> typically have the need to pursue,such as improvement <strong>of</strong> waste storage facilities,comprehensive nutrient management plans, andtransportation <strong>of</strong> manure tied to environmentallyand agronomically sound crop application rates. eexplicit rationale provided for this ranking is thatgreater environmental improvement can beachieved by alleviating CAFO-related problemsthan pasture-related problems.EQIP funding also favors <strong>CAFOs</strong> by holding thefarming operation responsible for a portion <strong>of</strong> theproject costs; the share <strong>of</strong> costs supplied by EQIPtypically stops at 65 percent. While remediation associatedwith several CAFO waste management methodsis oen funded at the program maximum <strong>of</strong> 75percent <strong>of</strong> the total project cost, EQIP recommends amaximum funding level for pasture-based practices<strong>of</strong> only 55 percent (NRCS 2003). is means thatpasture-based farmers can expect to pay for relativelymore <strong>of</strong> an EQIP project themselves than CAFOowners. is may discourage some pasture-basedfarmers from applying for EQIP funds, thereby reducing<strong>CAFOs</strong>’ competition for EQIP funds.e prioritizing <strong>of</strong> applications seeking EQIPfunds is important because the total funds availableare greatly exceeded by the demand. Most EQIP applicationstherefore remain unfunded.Estimating EQIP subsidies to <strong>CAFOs</strong>e most straightforward way to determine whether<strong>CAFOs</strong> are now favored in EQIP funding oversmaller and alternative operations would be a directcomparison <strong>of</strong> disbursements based on farm sizeand type and the practice addressed by the EQIP allocation.However, such data do not appear to bereadily available at the state or national level. Because<strong>of</strong> this lack <strong>of</strong> data, we cannot determine eitherhow great the subsidizing <strong>of</strong> <strong>CAFOs</strong> has beenor the relative amount <strong>of</strong> subsidizing compared withother types <strong>of</strong> animal farming operations. Despitethis limitation, it is clear that the relative subsidy to<strong>CAFOs</strong> compared with other animal operationsmust be considerably higher than in previous farmbills, because <strong>CAFOs</strong> were formerly excludedaltogether.A rough approximation <strong>of</strong> the national <strong>CAFOs</strong>ubsidy can be made using the recommendationsmade by the NRCS in finalizing the EQIP rule forthe 2002 farm bill. e NRCS estimated at the timethat approximately $563 million, or 12.5 percent <strong>of</strong>the total funding, would go to <strong>CAFOs</strong> over a fiveyearperiod (NRCS 2003), an average <strong>of</strong> about$94 million per year. Another approach is to considerthat 60 percent <strong>of</strong> EQIP funding is slated foranimal farming, and 25 percent <strong>of</strong> that allocation isintended for <strong>CAFOs</strong> (NRCS 2003). at means15 percent <strong>of</strong> EQIP funding would go to <strong>CAFOs</strong>—about $676 million, or an average <strong>of</strong> $113 millionper year.It is not possible to clearly determine which approachis more accurate, due to a lack <strong>of</strong> appropriatedata collection that would distinguish allocations bysize and type <strong>of</strong> operation. Based on rankings favoringincentives to <strong>CAFOs</strong>, these values might be expectedto be a minimum allocation. is amountcould also include livestock such as turkeys andsheep that are not evaluated in this report, but presentsimilar concerns as other <strong>CAFOs</strong>.In 2006, about $152 million was allocated explicitlyfor confined livestock operations, whileabout $85 million was allocated to unconfined operations(Figure 3, p. 43). In addition, about $247 millionwas allocated for “undistinguishable” practices(i.e., those that could apply to either confined or unconfinedanimal operations); the amount allocatedto each type <strong>of</strong> operation is unknown. However, ifwe assume that the distribution between confinedand unconfined operations in this category is thesame as with the known disbursements, some estimate<strong>of</strong> the additional amount going to <strong>CAFOs</strong> canbe calculated.In the known categories, about 64 percent <strong>of</strong>funding went to confinement operations and 36 percentto unconfined operations. Using this same proportionfor the undistinguishable category, another
<strong>CAFOs</strong> <strong>Uncovered</strong> 39$158 million would have been disbursed to confinementoperations, for a total <strong>of</strong> about $310 million. If25 percent <strong>of</strong> this total went to <strong>CAFOs</strong>, these operationswould have received about $77.5 million in2006. However, as noted above, there are reasons tobelieve that <strong>CAFOs</strong> may have actually received aconsiderably higher percentage <strong>of</strong> the funds.For 2007, the total EQIP disbursement was projectedto be $1.3 billion (NRCS 2003). If 60 percent<strong>of</strong> this amount went to animal agriculture, and 64percent <strong>of</strong> that went to confined operations, and 25percent <strong>of</strong> confinement funds went to <strong>CAFOs</strong>, thenthe expected CAFO subsidy would have been$125 million in 2007. (e uncertainties in thesecalculations due to a lack <strong>of</strong> public data show thatbetter national accounting <strong>of</strong> CAFO fund distributionbased on operation type, size, and use isneeded.)<strong>CAFOs</strong> first became eligible for EQIP funds atthe same time as the Clean Water Act was expandedto cover CAFO pollution. EQIP subsidies thereforecame at a fortuitous time for <strong>CAFOs</strong>, which werefacing new manure management requirements.Each state determines how it will distribute federalEQIP funds, and maintains online informationabout its implementation <strong>of</strong> EQIP programs. Statesoen provide details on the practices for whichEQIP funds are allocated and the amount <strong>of</strong> the disbursements.Although the size and types <strong>of</strong> operationsare not revealed, some practices that arelargely or exclusively limited to <strong>CAFOs</strong>, <strong>CAFOs</strong> andAFOs combined, or pasture-based operations allowus to draw inferences about EQIP disbursements.For example, manure transportation subsidies areunlikely to apply to pasture-based operations andare most oen important for <strong>CAFOs</strong>. Several <strong>of</strong> theEQIP programs <strong>of</strong> major CAFO states are brieflydiscussed below.EQIP subsidies in CaliforniaAs shown in Figure 3 (p. 43), dairy operations receivethe largest share <strong>of</strong> federal EQIP subsidies forconfined animal operations (42 percent). Californiahas more dairy cows and <strong>CAFOs</strong> than any otherstate, and therefore likely receives a substantial proportion<strong>of</strong> these funds. In 2007, a California EQIPprogram for waste storage and alternative wastetreatment practices split the share <strong>of</strong> costs betweenAFOs larger and smaller than 300 AU. e programspecifies that most <strong>of</strong> the funds would be distributedto those AFOs below 300 AU (smaller to mediumsizedoperations).On the other hand, a California EQIP waterquality initiative is directed at animal operationsfacing new state and federal waste permit requirements.Changes in the federal Clean Water Act requiringpermits and comprehensive nutrientmanagement plans are largely specific to <strong>CAFOs</strong>(more than 700 dairy cows) rather than smallerAFOs or pasture-based animal farms. is waterquality initiative may therefore predominantly target<strong>CAFOs</strong>, but state programs may affect the distribution<strong>of</strong> these subsidies because the states haveconsiderable authority in implementing EQIP. iswater quality initiative represents California’s largestEQIP budget item, at $10 million, or 21 percent <strong>of</strong>the budget (NRCS 2007b).EQIP subsidies in Arkansas and GeorgiaArkansas and Georgia are the two states that producethe most broiler chickens. Arkansas targeted25 percent <strong>of</strong> its 2008 EQIP funds for animal wastemanagement, and an additional 2 percent to “wastesystems closure” (NRCS 2008a). In 2007, Arkansasallocated $2.9 million to livestock waste managementfor water quality (NRCS 2007d). Arkansas also<strong>of</strong>fered an incentive program subsidizing littertransfer to crop fields; this program may target<strong>CAFOs</strong> because it requires applicants to document“excess manure produced on the farm.” Becausemany smaller or medium-sized farms usually haveenough <strong>of</strong> their own land to apply manure at appropriaterates (Kellogg et al. 2000), most farms thatneed to transfer manure are likely to be <strong>CAFOs</strong>.Georgia also implemented a pilot litter transferprogram for 2007–2008, funded by EQIP at up to$10 per ton and up to $10,000 per year per farm.Figure 4 (p. 44) shows the counties targeted in the
40 <strong>Union</strong> <strong>of</strong> <strong>Concerned</strong> <strong>Scientists</strong>program, with red designating those counties producingand contributing litter, and green designatingthose counties receiving litter during the firstyear <strong>of</strong> the program. e program specifies that onlythese counties may receive subsidies. e distancebetween the nearest contributing and receivingcounties is close to 50 miles, while typical distancescould exceed 100 miles; since large distances are notusually required for manure transfer from smalleror medium-sized operations, we can infer that thisprogram may subsidize <strong>CAFOs</strong> more than small tomedium-sized operations. ese distances wouldalso have a substantial impact on an operation’stransportation costs and energy use.Aer the first year <strong>of</strong> the program, additionalmanure-receiving counties were added and countieswere prioritized by a point system. A few moderateprioritycounties closer to manure sources wereadded, but most high-priority manure-receivingcounties remain in central Georgia.EQIP subsidies in Iowa and North CarolinaIowa and North Carolina are the two states withthe most swine <strong>CAFOs</strong>. Requirements for EQIPfunding in Iowa give considerable weight to<strong>CAFOs</strong>; in 2008, for example, several <strong>of</strong> the state’shighest-ranked eligibility criteria pertained to concernsabout the animal waste produced by <strong>CAFOs</strong>,including “Surface and subsurface water quality relatedto the presence <strong>of</strong> excessive nutrients and organicsrelated to livestock production byconcentrated animal feeding operation’s (CAFO’s)[sic] on open feedlots” (NRCS 2008b). One <strong>of</strong> thefour major criteria used for disbursement <strong>of</strong> fundsfavors those counties with the most livestock.In North Carolina, animal farming practicesclearly pertaining to AFOs and <strong>CAFOs</strong> comprise alarge proportion <strong>of</strong> EQIP funding. Allocations forwaste storage facilities, for example, amounted to$4.5 million in 2007 (30 percent <strong>of</strong> total allocations),compared with $2.9 million in 2002. The2007 amount is at least three times larger than thenext largest categories <strong>of</strong> fencing, composting, andclosure <strong>of</strong> waste impoundments, which each representedabout 6 to 10 percent <strong>of</strong> allocations(NRCS 2008c).e state paid almost $1 million in 2007 to closewaste storage facilities, which were oen abandoned(NRCS 2008c). Disbursement data do not typicallymention operation size, but the data on waste storagefacilities show dramatically increasing amountsper operation since 2001. In that year, the averagesubsidy was about $10,000 per unit; by 2007 it hadgrown to about $36,000 per unit, favoring largeroperations.A new EQIP program to be launched in NorthCarolina in 2008, the ground and surface water conservationsupplement, will be exclusively allocatedto operations that raise confined swine. Contractswill be capped at $10,000 each.Summary <strong>of</strong> Direct CAFO Subsidies Under EQIPEQIP changed in 2002 from a program specificallyaimed at smaller farming operations to one that included—andfavored—<strong>CAFOs</strong>. is represents a significantchange <strong>of</strong> emphasis from the first 17 years <strong>of</strong>the program, and provides <strong>CAFOs</strong> with a new competitiveadvantage. In addition, because the programhas grown substantially in total available funding,the actual subsidies are more than six times largerthan they were seven years ago. In other words, moremoney is going to support <strong>CAFOs</strong> now than smallerfarms received a decade ago (although a substantialamount <strong>of</strong> small-farm support likely remains).Overall, EQIP CAFO subsidies for the pastseveral years were likely to have totaled about$100 million or more per year, although it must benoted that this can only serve as a very rough estimatebecause disbursement data by operation sizeare not readily available. Because <strong>of</strong> growing concernabout the environmental impact <strong>of</strong> <strong>CAFOs</strong> (asreflected in new Clean Water Act provisions recentlydirected at CAFO pollution), data should becollected and made public based on operation sizeand type.
<strong>CAFOs</strong> <strong>Uncovered</strong> 41C h a p t e r 3EXTERNALIZED COSTS OF <strong>CAFOs</strong>Raising livestock and poultry can cause substantialharm to people and the environment. Asdiscussed in Chapter 1, the costs associated withthis harm (which are not included in the costs <strong>of</strong>production) are called externalities.Nutrients from manure can become externalitiesby entering the air via volatilization (Walkeret al. 2000) or by entering ground or surface water(Burkholder et al. 2007; Mallin and Cahoon 2003).Large waste spills from <strong>CAFOs</strong> have been documented(Mallin 2000), and when hundreds <strong>of</strong> thousandsor millions <strong>of</strong> gallons <strong>of</strong> animal waste spillinto a stream, river, or estuary, a series <strong>of</strong> cascadingeffects results in externalities such as the death <strong>of</strong>thousands <strong>of</strong> fish, expenditure <strong>of</strong> many hours bystate personnel to assess the damages, closure <strong>of</strong>local marinas and recreational facilities due to contaminationby pathogenic microbes, lost work dayscaused by illness, closure <strong>of</strong> downstream shellfishbeds, and negative effects on the local food web(such as the death <strong>of</strong> aquatic organisms that otheranimals depend on for food).Typically the CAFO operator will be assessed arelatively small fine for such a spill. us, taxpayersand local residents or businesspeople will be forcedto shoulder the cost <strong>of</strong> externalities by paying forfish restocking and overtime for regulatory personnel,and by absorbing losses from fishing, shellfishing,and other water-related industries. Similarharmful effects can result from water pollutioncaused by the over-application <strong>of</strong> CAFO manure t<strong>of</strong>armland, leakage from manure holding facilities,and the redeposition <strong>of</strong> airborne CAFO ammonia.It is oen difficult to assign a monetary value toexternalities, but in some instances it is possible. Forexample, odors and noxious gas emissions are acommon adverse effect <strong>of</strong> high animal concentrations(Wing and Wolf 2000), but the resulting reductionin quality <strong>of</strong> life for people living near<strong>CAFOs</strong> is difficult to quantify directly. However,these costs may be reflected in depressed residentialproperty values that have been quantified (Weida2004). In this chapter, both quantified and unquantifiedexternalities will be considered.Whether quantified or not, externalized costs areborne by society rather than the industry that causedthe damage. If the costs to prevent (or remediate) thedamage were instead borne by the industry, its cost<strong>of</strong> production would increase and could be reflectedin the marketplace by higher prices. is could facilitatecompetition by alternatives that do not causethese externalities. To the extent that the costs <strong>of</strong> externalitiesare avoided, they constitute a form <strong>of</strong> subsidyto the industry that caused them.Below we discuss in detail several <strong>of</strong> the majorexternalized costs <strong>of</strong> <strong>CAFOs</strong>. In particular, costs tothe environment in the form <strong>of</strong> water and air pollutionare considered at length. One important consideration<strong>of</strong> nutrient pollution is the trade<strong>of</strong>fbetween water and air pollution. Reducing waterpollution, if not done properly, can exacerbate airpollution and, ironically, fail to resolve water pollutionon a regional scale. is trade<strong>of</strong>f has seriousimplications for nutrient management policies. Wealso discuss the harm from pathogens, especiallyantibiotic-resistant pathogens, and the harm torural communities.For each topic, we describe the damage done by<strong>CAFOs</strong> and how we might estimate the monetarycosts associated with that damage. Although comprehensiveeconomic assessments <strong>of</strong> the monetarycosts are not available, efforts have been made to
42 <strong>Union</strong> <strong>of</strong> <strong>Concerned</strong> <strong>Scientists</strong>provide cost estimates for certain aspects <strong>of</strong> these externalities,which are useful in providing a generalsense <strong>of</strong> the extent <strong>of</strong> the subsidy represented by externalizedcosts. Other important topics such aswater and energy use we leave for future evaluations.Pollution Caused by CAFO ManureManure from <strong>CAFOs</strong> is a major source <strong>of</strong> water pollutionbecause these operations produce too muchmanure in too small an area, and this manure israrely treated to eliminate potentially harmful componentsbefore being applied to crop fields or storedin facilities such as lagoons or pits (EPA 2003). Bycomparison, the majority <strong>of</strong> human waste isprocessed by municipal wastewater facilities or septicsystems before it can re-enter our water. e manureproduced by individual <strong>CAFOs</strong> exceeds thatproduced by smaller AFOs or alternative animalfarming operations, and as we will discuss, is alsomore likely to harm the environment and publichealth than that produced on other types <strong>of</strong> farms.Most <strong>CAFOs</strong> collect and store manure prior toits application on farmland or fields. e most commonstorage structures for manure from dairy cattleand hogs are either lagoons or pits; poultry manure,because it has lower water content than cattle or hogmanure, can be gathered into piles. Poultry manureis also oen mixed with material such as wood chipsthat are spread on the floor <strong>of</strong> broiler facilities severaltimes a year. e resulting combination <strong>of</strong> poultrymanure, wood chips, wasted feed, and beddingmaterial is referred to as litter. Poultry manure thathas higher water content is stored in lagoons. Manurepits and lagoons may leak below the soil surfaceand contaminate groundwater, which mayinfiltrate wells that supply potable water (Volland,Zupancic, and Chappelle 2003; Huffman andWesterman 1995).Most <strong>of</strong> the nitrogen in manure begins in eithera complex organic form or as ammonia. Much <strong>of</strong>the ammonia is converted in aerobic environments,as on crop fields, into nitrate. Nitrogen in the form<strong>of</strong> nitrate is highly mobile in soils and is the constituent<strong>of</strong> manure most likely to have an adverse effectin drinking water. Concentrations <strong>of</strong> 10 mg/l <strong>of</strong>nitrate in drinking water may cause methemoglobinemia,or “blue baby syndrome,” which may causemortality (Fan and Steinberg 1996; Johnson andKoss 1990). Nitrate consumption has also beenlinked to certain cancers.Groundwater pollutionStudies by the Kansas Geological Survey found thatcontamination in 42 percent <strong>of</strong> tested wells derivedfrom animal waste (cited in Volland, Zupancic, andChappelle 2003). U.S. Geological Survey (USGS)testing determined that animal waste was responsiblefor contamination <strong>of</strong> wells at 9 <strong>of</strong> 35 swine feedingoperations in Oklahoma where nitrate levelsexceeded the EPA safe drinking water limit <strong>of</strong> 10mg/l (Becker, Peter, and Masoner 2002). In NorthCarolina, groundwater near 11 swine lagoons hadan average nitrogen concentration <strong>of</strong> 143 mg/l(Huffman and Westerman 1995). Groundwater maymove laterally and eventually enter surface watersources such as rivers, and may thereby contributeto eutrophication (the potentially harmful proliferation<strong>of</strong> plant life in nutrient-rich water) or otherproblems. Symptoms <strong>of</strong> eutrophication include nuisanceor toxic algal blooms, low levels <strong>of</strong> dissolvedoxygen (which can cause fish die-<strong>of</strong>fs), aquatic foodweb disruptions, and taste, odor, or aesthetic problemsin water resources.Movement <strong>of</strong> leaked nitrogen from CAFO manurelagoons may continue to be a threat to groundwatereven aer a CAFO closes and the lagoon isemptied. Increased exposure to air may allow ammoniapreviously leaked into the soil under the lagoonto be converted into nitrate. Because nitrate ishighly mobile in soil, it may reach groundwatermore readily than ammonia. Ignoring the contaminatedsoil beneath a closed lagoon could thereforeallow substantial quantities <strong>of</strong> nitrate to reachgroundwater.One study (Volland, Zupancic, and Chappelle2003) estimated that the cost to remediate the contaminatedsoil under dairy and hog <strong>CAFOs</strong> incontinued on page 51
<strong>CAFOs</strong> <strong>Uncovered</strong> 43Figure 3. Federal EQIP Funding for 2006Total Confined Unconfined Practices NumberLivestock Cost-Share Cost-Share Cost-Share Undistinguishable <strong>of</strong>Type Approved Approved Approved Cost-Share Approved ContractsSheep $6,552,097 $701,466 $2,246,764 $3,603,867 296Beef $312,634,324 $43,062,776 $71,465,241 $198,106,306 17,605Dairy $90,101,196 $62,284,196 $3,372,295 $24,444,705 1,951Other $20,410,903 $3,198,336 $6,526,001 $10,686,566 1,118Poultry $28,478,004 $23,036,577 $629,270 $4,812,157 1,252Swine $25,570,331 $20,116,235 $327,272 $5,126,824 658Subtotal $483,746,854 $152,399,586 $84,566,843 $246,780,425 22,880Non-Livestock $304,220,696 $0 $0 $0 18,310Total $787,967,550 $152,399,586 $84,566,843 $246,780,425 41,190National FY2006 Confined Livestock Cost-Share ApprovedSheep 0%Swine 13%Poultry 15%Beef 28%Other 2%Dairy 42%National FY2006 Unconfined Livestock Cost-Share ApprovedPoultry 1%Swine 0%Other 8% Sheep 3%Dairy 4%Beef 84%SOURCE: NRCS 2007.
44 <strong>Union</strong> <strong>of</strong> <strong>Concerned</strong> <strong>Scientists</strong>Figure 4. Counties Eligible for EQIP Subsidies in Georgia's Poultry Litter Transfer Program, 2006DADECHATTOOGAFLOYDCATOOSAWALKERPOLKHARALSONWHITFIELDCARROLLBARTOWMURRAYGORDONCoosa RiverPAULDINGWest GeorgiaCOBBGILMERLimestone ValleyDOUGLASPICKENSCHEROKEEFULTONFAYETTEBlue Ridge MountainCLAYTONFANNINDEKALBDAWSONFORSYTHHENRYUNIONLUMPKINGWINNETTWHITEHALLWALTONNEWTONTOWNSRABUNHABERSHAMUpper Chattahoochee RiverSeven MetroROCKDALEBANKSJACKSONOconee RiverBARROWUpperOcmulgeeRiverMORGANSTEPHENSOCONEEPUTNAMFRANKLINMADISONCLARKEGREENEHARTELBERTBroad RiverOGLETHORPEPiedmontWILKESTALIAFERROWARRENLINCOLNColumbiaMCDUFFIECOLUMBIAContributingRICHMONDEQIP Funding Unit BoundaryCounty RankingHighMediumLowReceivingHighMediumLowNot ParticipatingHEARDCOWETASPALDINGBUTTSJASPERHANCOCKGLASCOCKBrier CreekTROUPMERIWETHERRooseveltPIKELAMARTowaligaMONROEJONESBALDWINWASHINGTONJEFFERSONBURKESCREVENUPSONBIBBWILKINSONJENKINSHARRISTALBOTPine MountainTAYLORCRAWFORDPEACHTWIGGSCentral GeorgiaJOHNSONEMANUELBULLOCHMUSCOGEEEFFINGHAMCHATTAHOOCHEEMARIONSCHLEYMACONBLECKLEYHOUSTONOcmulgee RiverPULASKILAURENSTREUTLENOhoopee RiverMONTGOMERYCANDLEROgeechee RiverEVANSDOOLYDODGEWHEELERTOOMBSBRYANCHATHAMSTEWARTWEBSTERSUMTERWILCOXTELFAIRTATTNALLCoastalQUITMANLower Chattahoochee RiverTERRELLLEECRISPTURNERBEN HILLJEFF DAVISAPPLINGLONGLIBERTYCLAYRANDOLPHMiddle South GeorgiaIRWINAltamaha RiverBACONCOFFEEWAYNEMCINTOSHCALHOUNDOUGHERTYWORTHTIFTPIERCEEARLYBAKERBERRIENSatilla RiverGLYNNMILLERFlint RiverMITCHELLCOLQUITTCOOKLANIERATKINSONAlapahaWAREBRANTLEYCAMDENSEMINOLETHOMASCLINCHCHARLTONBROOKSDECATURGRADYLOWNDESECHOLSNSOURCE: NRCS 2007e.0 15 30 60 miles1 inch=40 miles
<strong>CAFOs</strong> <strong>Uncovered</strong> 45Figure 5. Average Atmospheric Ammonium Ion Concentration, 1985–20021985–1987 1990–1992####### ##########################1995–1997 2000–2002##### ################### ##### ###### ########## #### #### # ## ###### ############# # ########################################SOURCE: NADP 2003.Average Ammonium Ion Concentration as NH + (mg/L)40.10 0.15 0.20 0.25 0.30 0.35 0.40 0.45 0.50 0.55Figure 6. Wet Deposition <strong>of</strong> Ammonium Nitrogen, 20020.40.6#0.81.90.90.91.53.32.01.60.73.42.02.10.8 1.0 3.1#3.43.3 1.50.22.04.63.4 1.70.31.04.9 4.64.4 4.02.73.46.11.64.4 3.92.25.57.22.40.20.85.73.73.04.62.20.31.42.00.20.74.93.53.83.30.8 1.63.75.1 2.24.82.23.9 3.52.54.42.92.32.23.03.83.5 3.22.80.44.0 4.43.8 3.43.7 3.51.91.0#1.90.90.8 1.63.6 3.8 3.43.22.8#0.73.33.92.10.72.51.40.5 1.32.93.02.33.22.10.60.5 0.6 2.4#3.00.6#1.10.93.64.02.71.22.71.44.64.92.41.9#0.63.9 2.94.11.92.03.0 2.7##0.62.31.90.82.43.6 3.62.63.42.52.21.90.72.8 2.24.7 1.70.1#2.1 2.02.40.62.93.10.84.63.6 3.2 1.10.11.0 1.41.11.12.11.93.2 2.02.31.41.21.12.3 1.6 1.21.41.41.91.51.71.31.21.71.71.8Ammonium as NH +4(kg/ha)≤ 0.50.5-1.01.0-1.51.5-2.02.0-2.52.5-3.03.0-3.53.5-4.04.0-4.5>4.5
46 <strong>Union</strong> <strong>of</strong> <strong>Concerned</strong> <strong>Scientists</strong>Figure 7. Wet Deposition <strong>of</strong> Ammonia and Nitrate Nitrogen, 20021.01.8Sites not pictured:Alaska (2001)Alaska (2003)California (1995)Hawaii (1999)Virgin Islands (2001)1.53.41.21.22.03.82.93.21.14.52.43.01.0 1.7 4.74.46.0 3.10.42.55.76.0 3.40.71.36.7 6.46.2 6.44.46.07.83.36.4 6.44.611.3 5.10.31.17.49.17.23.76.74.60.41.84.40.30.96.65.86.26.31.3 2.35.99.8 4.2 4.66.7 5.7 5.65.36.04.55.12.44.57.66.1 5.55.30.55.2 5.95.8 5.37.1 6.31.91.73.71.21.3 2.05.6 5.7 6.5#4.71.55.16.2 5.43.80.94.61.91.0 2.04.74.93.94.84.71.11.3 0.9 3.05.31.0 2.21.14.86.25.41.64.12.96.27.54.93.61.06.4 4.96.33.53.74.6 4.70.94.43.41.14.14.2 5.34.65.93.63.93.31.13.9 3.55.7 3.40.13.7 3.54.20.94.25.21.36.15.5 4.62.80.21.6 2.02.71.73.53.04.8 3.24.32.62.71.54.7 3.7 2.63.12.03.93.72.93.13.42.53.60.4 kg/ha0.6 kg/ha0.1 kg/ha0.9 kg/ha0.9 kg/ha3.3N(kg/ha)≤ 1.01.0-2.02.0-3.03.0-4.04.0-5.05.0-6.06.0-7.0>7.0National Atmospheric Deposition Program/National Trends NetworkSOURCE: NADP 2003.Figure 8. Geographic Concentration <strong>of</strong> Hog Production, 1997–20021 dot=2,500 Hogs andPigs Increase1 dot=2,500 Hogs andPigs DecreaseUnited States Net Decrease:-783,046SOURCE: NASS 2002b.
<strong>CAFOs</strong> <strong>Uncovered</strong> 47Figure 9. Geographic Concentration <strong>of</strong> Dairy Cows, 1997–20021 dot=500 Cows Increase1 dot=500 Cows DecreaseUnited States Net Decrease:-35,853SOURCE: NASS 2002b.Figure 10. Geographic Concentration <strong>of</strong> Broiler Production, 1997–20021 dot=400,000Broilers Increase1 dot=400,000Broilers DecreaseUnited States Net Decrease:+1,133,786,901SOURCE: NASS 2002b.
48 <strong>Union</strong> <strong>of</strong> <strong>Concerned</strong> <strong>Scientists</strong>Figure 11. CAFO Manure LagoonLiquid manure from <strong>CAFOs</strong> is <strong>of</strong>ten stored in open-air reservoirs.Photo credit: Courtesy <strong>of</strong> USDA.Figure 12. Environmental Danger <strong>of</strong> <strong>CAFOs</strong>In this 1999 image, raw manure from hog <strong>CAFOs</strong> overflows duringflooding caused by Hurricane Floyd.Photo credit: Courtesy <strong>of</strong> Rick Dove, www.doveimaging.comand www.neuseriver.com.Figure 13.CAFO Manure PileThis enormous pile <strong>of</strong> manurewas CAFO-generated.Photo credit: Courtesy <strong>of</strong>Factoryfarm.org.Figure 14.CAFO Manure LagoonManure is flushed with water intoa lagoon at this North Carolinahog CAFO.Photo credit: Courtesy <strong>of</strong> USDA.
<strong>CAFOs</strong> <strong>Uncovered</strong> 49Figure 15.UnsanitaryConditionsin Cattle CAFOThese feedlot cowsare caked in manure.Photo credit:Courtesy <strong>of</strong>CARE/Factoryfarm.org.Figure 16. Alternative Cattle ProductionWell-maintained pasture systems are efficient and safer for theenvironment than <strong>CAFOs</strong>.Photo credit: Courtesy <strong>of</strong> SARE.aboveFigure 17. Crowding in Chicken CAFOAt least 30,000 birds are packed into chicken <strong>CAFOs</strong>.Photo credit: Courtesy <strong>of</strong> USDA.rightFigure 18. Alternative Poultry ProductionPasture-raised chickens consume forageand insects as well as grain.Photo credit: Courtesy <strong>of</strong> Stan Skillington.
50 <strong>Union</strong> <strong>of</strong> <strong>Concerned</strong> <strong>Scientists</strong>Figure 19.Crowding in Hog CAFOAmimals in <strong>CAFOs</strong> arepacked tightly together.Photo credit: Courtesy <strong>of</strong>Farmsanctuary.com.Figure 20. Hog Hoop BarnHoop barns give pigs straw beddingmaterial and more room to move.Photo credit: Courtesy <strong>of</strong> North CarolinaState University.Figure 21. Alternative Pork ProductionPasture-raised pigs are free to forage onthis Colorado ranch.Photo credit: Courtesy <strong>of</strong> Doug and Kim Wiley.
<strong>CAFOs</strong> <strong>Uncovered</strong> 51continued from page 42Kansas alone could amount to $56 million—andKansas is not a national leader in either dairy or hogproduction. States that have a larger number <strong>of</strong> such<strong>CAFOs</strong> (e.g., California, Iowa, Minnesota, NorthCarolina, Wisconsin) may face much more extensivelagoon or pit leakage problems than Kansas, dependingon geology and other factors. It has been notedthat the North Carolina coastal plain features manyrisk factors for waste run<strong>of</strong>f and leakage, such as soilpercolation potential (Mallin and Cahoon 2003).e extent <strong>of</strong> leakage and penetration intogroundwater depends on a number <strong>of</strong> factors thatvary considerably between <strong>CAFOs</strong>, includingwhether the pit or lagoon is lined, the type <strong>of</strong> lining,the type <strong>of</strong> subsoil, the depth <strong>of</strong> groundwater andaquifers, and the age <strong>of</strong> the facility. It is clear, however,that leakage is a common problem. It is alsoimportant to consider that once pollution hasreached an aquifer, it may remain for years, decades,or longer.We have used the Kansas data to calculate arough estimate <strong>of</strong> the total cost <strong>of</strong> soil remediationunder U.S. dairy and swine <strong>CAFOs</strong>. By dividing thetotal number <strong>of</strong> swine and dairy <strong>CAFOs</strong> by thenumber <strong>of</strong> such <strong>CAFOs</strong> in Kansas (NASS 2002a),then multiplying that figure by $56 million, we arrivedat a national cost <strong>of</strong> $4.1 billion. 20 We did notextend these calculations to poultry and beef<strong>CAFOs</strong> because their manure storage methods areoen considerably different than hog and dairy<strong>CAFOs</strong>. However, poultry and beef <strong>CAFOs</strong> alsomay contribute to manure leaching into groundwaterunder their manure collection structures.Compared with nitrate, phosphorus is usuallymuch less soluble in agricultural soils. It has thereforebeen thought that the primary means by whichmanure phosphorus enters water is through therun<strong>of</strong>f <strong>of</strong> phosphorus bound to soil particles, whichin turn has led to a focus on conservation practicesintended to limit run<strong>of</strong>f and soil erosion. Accumulation<strong>of</strong> phosphorus in soil over a number <strong>of</strong> yearscan also lead to increased dissolved phosphorus(Toth et al. 2006; Boesch 2001). Recent data suggestthat over several years, phosphorus application atrates above that which can be utilized by crops resultsin leaching <strong>of</strong> dissolved phosphorus intogroundwater in saturated and organic soils (Koopmanset al. 2007; van Es et al. 2004). Measurements<strong>of</strong> crop field drainage tiles showed substantial dissolvedphosphorus from some soils aer manure application(van Es et al. 2004).Groundwater pollution can also result in surfacewater pollution, because groundwater may entersurface water such as streams or rivers.Surface water pollutionManure may spill from holding structures intonearby waterways due to severe weather or poor designor construction. Particularly dramatic instances<strong>of</strong> surface water contamination have occurred,drawing attention to the vulnerability <strong>of</strong> these structuresand the impact they can have on watersheds.In 1995, for example, 25 million gallons <strong>of</strong> rawswine waste was released from a single failed lagooninto North Carolina’s New River and its estuary, pollutingapproximately 22 miles <strong>of</strong> river. is spillcaused fish kills, algal blooms, and fecal bacteriacontamination, as did a poultry lagoon failure thesame year (Burkholder et al. 1997; Mallin et al.1997). Massive contamination also occurred whenHurricanes Fran, Bonnie, and Floyd hit the NorthCarolina coast in the 1990s (Mallin and Corbett2006). Several large spills have also been recorded inother states (Mallin 2000), along with numeroussmaller spills.Although catastrophic failures <strong>of</strong> manure lagoonshave garnered the most public attention, themost common source <strong>of</strong> water pollution from<strong>CAFOs</strong> may be the intentional application <strong>of</strong> manureonto farmland. Nutrients and other pollutants20 As noted in Chapter 2, NASS data do not have categories corresponding exactly to the EPA definitions <strong>of</strong> hog and dairy <strong>CAFOs</strong>, so we used the closestcategories available: 500 or more diary cows and 2,000 or more hogs. e number <strong>of</strong> Kansas hog <strong>CAFOs</strong> was obtained by multiplying the number <strong>of</strong> hogfarms larger than 1,000 animals in the state by a factor equal to the number <strong>of</strong> U.S. hog farms larger than 2,000 animals divided by the number <strong>of</strong> U.S. hogfarms larger than 1,000 animals. is estimate may differ from that used in Volland, Zupancic, and Chappelle 2003.
52 <strong>Union</strong> <strong>of</strong> <strong>Concerned</strong> <strong>Scientists</strong>such as antibiotics, other pharmaceuticals, andheavy metals can move from fields where manurehas been applied (Barker and Zublena 1995) due tostorm run<strong>of</strong>f into streams or leaching into the soilbelow plant root levels (Karr et al. 2001), eventuallyreaching groundwater or surface water (by transportthrough field drainage tiles). Vegetation buffers intendedto deter the movement <strong>of</strong> run<strong>of</strong>f and nutrientsinto streams and rivers are oen inadequatebecause nutrients—especially nitrogen—may passunder them (Karr et al. 2001).Damage to aquatic ecosystemsAs indicated above, the two main contributors towater pollution from <strong>CAFOs</strong> are soluble nitrogencompounds (such as nitrate and ammonia) andphosphorus. Both nitrogen compounds and phosphoruscontribute to the eutrophication <strong>of</strong> bodies <strong>of</strong>water characterized by algal blooms and fish die<strong>of</strong>fs.Phosphorus tends to be the key factor in causingfreshwater eutrophication, while nitrogen ismore oen important in open marine environments,but both can be important in either environment.In addition, nitrogen in the form <strong>of</strong> ammoniacan be directly toxic to aquatic organisms, and nitrousoxides (another product <strong>of</strong> manure) are potentheat-trapping gases. Ammonia pollution can alsolower the level <strong>of</strong> dissolved oxygen in streams, lakes,and estuaries through the process <strong>of</strong> nitrification, bywhich bacteria oxidize ammonia into nitrite and nitrate(Clark et al. 1977).Eutrophication has led to hypoxia (oxygen deficiency)in extensive areas <strong>of</strong> the Gulf <strong>of</strong> Mexico andChesapeake Bay (Boesch, Brinsfield, and Magnien2001; Rabalais, Turner and Wiseman 2001). eseareas are oen called “dead zones” because the levels<strong>of</strong> oxygen found there are too low to support manytypes <strong>of</strong> animals, such as many species <strong>of</strong> commerciallyimportant fish and shrimp. Hypoxia thereforehas a substantial economic impact. e hypoxiczone in the Gulf <strong>of</strong> Mexico is associated with nitrogenentering from the Mississippi River, and hasbeen expanding in recent years. From 1985 to 1992,the hypoxic zone averaged 8,000 to 9,000 km 2 ; from1993 to 2000 it reached as much as 16,000 to 20,000km 2 (Rabalais, Turner, and Wiseman 2001).Manure and synthetic fertilizers applied to cropsare largely responsible for the nitrogen that pollutesbodies <strong>of</strong> water. Animal agriculture that depends ongrain production is also indirectly responsible formuch <strong>of</strong> the nitrogen from crops, because mostgrain—and therefore most grain crop acreage—isused to feed animals. Livestock have been estimatedto contribute about 15 percent <strong>of</strong> the inorganic nitrogenentering the Gulf <strong>of</strong> Mexico (Goolsby et al.1999), but more recent research has raised the possibilitythat this figure may actually underestimatethat contribution (Weldon and Hornbuckle 2006).Pollution and hypoxia in coastal water and estuariesmay be especially important because manyopen-ocean fish spawn at these sites (Boesch et al.2001). For example, up to 90 percent <strong>of</strong> AtlanticCoast striped bass (Morone saxatilis), an importantcommercial and sport fish, spawn in the ChesapeakeBay (Chesapeake Bay Project 2007). Catches<strong>of</strong> striped bass in the bay have been declining, ashave those <strong>of</strong> blue crab (Callinectes sapidus), themost important commercial species in the bay(Chesapeake Bay Project 2007). Although these declinesare likely attributable to several factors, bothspecies inhabit parts <strong>of</strong> the bay (for parts <strong>of</strong> their lifecycles) that may be subject to hypoxia. In addition,increased turbidity (poor transmission <strong>of</strong> lightthrough the water) due in part to eutrophic planktonblooms contributes to a decline in submergedgrasses that provide vital habitat for blue crab andother marine life (Boesch et al. 2001). e docksidevalue to Maryland and Virginia <strong>of</strong> this single fishery(without considering economic multiplier effects)was estimated to be about $52 million in 2002(Chesapeake Bay Commission 2003).Pollution from airborne nitrogenManure components, especially nitrogen compounds,can be important sources <strong>of</strong> air pollution.Volatilized nitrogen (in the form <strong>of</strong> ammonia) isalso an important source <strong>of</strong> terrestrial and waterpollution because, as discussed below, most <strong>of</strong> it
<strong>CAFOs</strong> <strong>Uncovered</strong> 53Regulation <strong>of</strong> CAFO ManureThe regulation <strong>of</strong> pollution from CAFO manurehas a significant impact on whether this pollutioncontinues to be an externalized cost <strong>of</strong>production, and therefore whether <strong>CAFOs</strong>continue to receive a competitive advantageover alternative types <strong>of</strong> animal production byavoiding these costs.As noted earlier, recent changes in theClean Water Act target CAFO water pollutioncaused by over-application <strong>of</strong> manure to fields(EPA 2003). One way the Clean Water Act regulatesCAFO pollution is through the issuanceand enforcement <strong>of</strong> permits under the NationalPollution Discharge Elimination System(NPDES). Regulatory changes proposed bythe EPA would affect the issuance <strong>of</strong> NPDESpermits as well as related effluent standardsand comprehensive nutrient managementplans.After the EPA made some initial changesto the system in 2003, several environmentalgroups sued the agency, claiming the additionalchanges it had proposed would be inadequateto prevent CAFO pollution. The courtupheld some aspects <strong>of</strong> the plaintiffs’ argumentswhile disagreeing with others. This ledto the development <strong>of</strong> new proposed regulationsthat would require some <strong>CAFOs</strong> to holdpermits for manure management and wouldset standards for manure application rates toprevent water pollution (Centner 2006; EPA2006). Compliance with these new standardscould be expensive, but will depend in part onthe specifics <strong>of</strong> the final rule, which the EPAplans to complete by early 2009 (EPA 2007).In addition, programs such as EQIP couldsubsidize compliance.Potential roadblocksThe wording <strong>of</strong> the EPA’s proposed NPDESregulation has raised a question aboutwhether <strong>CAFOs</strong> could legally avoid the permittingprocess in the absence <strong>of</strong> a determinationthat they actually “discharge” manure pollution(Centner 2006). Under the current language,the EPA would require “only the owners andoperators <strong>of</strong> those <strong>CAFOs</strong> that discharge orpropose to discharge to seek coverage undera permit” (EPA 2006). If this qualification is part<strong>of</strong> the final rule, it may give CAFO owners agreat degree <strong>of</strong> discretion in deciding whetherto obtain a permit (and develop an accompanyingnutrient management plan) in the absence<strong>of</strong> actual contamination data.Furthermore, inconsistent enforcement <strong>of</strong>permit regulations has been a concern in thepast and may be under the new rule as well.For example, although Michigan and Wisconsineach had more than 100 <strong>CAFOs</strong>, Wisconsinhad issued 110 permits but Michigan hadissued none (GAO 2003).How these issues are resolved will haveserious implications for whether <strong>CAFOs</strong> continueto avoid accountability for the water pollutioncaused by their manure.
54 <strong>Union</strong> <strong>of</strong> <strong>Concerned</strong> <strong>Scientists</strong>returns to the earth within 80 km <strong>of</strong> its origin(Walker et al. 2000), where it harms vegetation andreaches water sources. Nitrous oxide, another gasproduced from manure and synthetic fertilizers, isan important heat-trapping gas, but the impact <strong>of</strong><strong>CAFOs</strong> on global warming is not considered here.Livestock are the biggest source <strong>of</strong> anthropogenic(i.e., influenced by human activity) ammoniaemissions in the United States. Animal waste isresponsible for about 3 x 10 9 kg <strong>of</strong> airborne ammoniaper year, while the next largest source, syntheticfertilizer, produces about 8 x 10 8 kg <strong>of</strong> ammonia.According to some estimates, animal sources contributeas much as 75 percent <strong>of</strong> anthropogenic ammonia,and fertilizer contributes about 20 percent,with all other human sources such as transportationand industry accounting for only about 5 percent(Anderson, Strader, and Davidson 2003). By contrast,dairy cows raised on pasture have been estimatedto produce about 5 to 10 times less ammoniaemissions than confined livestock (Anderson,Strader, and Davidson 2003). Recent changes in themethods used by the EPA to determine ammoniaemissions from livestock reduce estimates by about33 percent compared with previous methods, due tomore refined partitioning <strong>of</strong> animal manure handling(EPA 2004). Nevertheless, this newer method continuesto rank livestock as the largest producer <strong>of</strong> ammonia,by several times more than any other source.Nitrogen is found in several different forms inmanure, and these different forms have differentfates and effects on the environment. A largeamount <strong>of</strong> the nitrogen in manure lagoons and pits,for example, takes the form <strong>of</strong> ammonia—typicallyabout 60 percent for dairy manure, 90 percent forbeef cattle run<strong>of</strong>f ponds, 73 percent for poultry, and63 percent for hogs (Soil Conservation Service1992). Feed characteristics can alter these values.Ammonia is a simple compound that does not containcarbon, and is the primary form <strong>of</strong> inorganicnitrogen in manure.Much <strong>of</strong> the rest <strong>of</strong> the nitrogen in manure isfound in carbon-containing molecules referred to asorganic nitrogen. is organic nitrogen is convertedinto ammonia and other forms <strong>of</strong> nitrogen.How manure is stored and applied to fieldslargely determines how much <strong>of</strong> the ammoniavolatilizes. Open manure lagoons or pits, for example,allow substantial amounts <strong>of</strong> ammonia to escapeinto the air. e amount <strong>of</strong> inorganic nitrogenin manure and how it is applied to the soil is importantas well. When over-applied, the type <strong>of</strong> applicationmethod largely determines whether theammonia is volatilized and creates air pollution(and, indirectly, water pollution), or remains in thesoil where some <strong>of</strong> it can pollute water resources.Phosphorus from manure, unlike ammonia,does not form a gas, and therefore does not typicallyleave manure via the atmosphere. is differencebetween ammonia and phosphorus has importantimplications for the distribution <strong>of</strong> manure ont<strong>of</strong>armland and for trade<strong>of</strong>fs between air and waterpollution discussed below.A large percentage <strong>of</strong> volatilized ammonia findsits way back to the ground or water locally or regionally.is can occur through dry deposition orwet deposition (facilitated by rain or snow). Researchin Europe showed that about 50 percent <strong>of</strong>volatilized ammonia is deposited within approximately50 km <strong>of</strong> the source (Ferm 1998). Calculationshave also predicted that 38,000 <strong>of</strong> 43,000 shorttons <strong>of</strong> volatilized ammonia produced by NorthCarolina’s 2,295 <strong>CAFOs</strong>, or 88 percent, is depositedwithin a radius <strong>of</strong> 50 km (Murray 2003). is suggeststhat most <strong>of</strong> the ammonia that is eithervolatilized from <strong>CAFOs</strong> directly or aer applicationonto farmland will be redeposited across the region.e growing number <strong>of</strong> <strong>CAFOs</strong> has occurredalongside, and may be correlated with, dramaticallyincreased airborne ammonium ion concentrationsin several parts <strong>of</strong> the United States over the past 18years (Figure 5, p. 45). Ammonia ions are rapidlyformed in the atmosphere from volatilized ammonia.In many areas ammonium ion concentrations haveincreased by a factor <strong>of</strong> two to four, and areas <strong>of</strong> highammonium concentration (over 0.5 mg/l) have expandedsubstantially. e areas <strong>of</strong> greatest ammoniumconcentration correspond roughly with thoseareas that have the largest number <strong>of</strong> dairy, beef, andhog <strong>CAFOs</strong>, although areas with the highest num-
<strong>CAFOs</strong> <strong>Uncovered</strong> 55bers <strong>of</strong> broiler <strong>CAFOs</strong> (in the southern part <strong>of</strong> thecountry) do not show increased ammonium.Figure 6 (p. 45) illustrates wet deposition <strong>of</strong> ammoniafor 2002, showing that in many areas, substantialamounts <strong>of</strong> ammonia reach the ground orwater. Areas <strong>of</strong> high deposition generally correspondwith regions <strong>of</strong> high CAFO concentrations,with California an exception. Dry deposition, whichis not measured in this figure, can contribute substantialadditional amounts <strong>of</strong> ammonia, perhaps asmuch as or more than wet deposition under someconditions (Ferm 1998). In North Carolina, ammoniumconcentrations have increased significantly inrecent years in the Neuse River (Burkholder et al.2006) and the northeastern portion <strong>of</strong> the Cape FearRiver (Burkholder et al. 2006; Mallin and Cahoon2003). ese rivers drain the largest swine-producingareas on the East Coast, which are also areas withhigh levels <strong>of</strong> ammonia wet deposition (Figure 6,p. 45).When ammonia returns to the earth, either bywet or dry deposition, it can directly damage terrestrialecosystems or move through the soil pr<strong>of</strong>ileinto ground and surface water, causing water pollution<strong>of</strong> the types discussed earlier. Unlike nitrogenthat enters ground or surface water from crop fieldsor manure storage facilities, airborne nitrogen canbe deposited in unmanaged terrestrial ecosystemssuch as grasslands, forests, and deserts. Many naturalecosystems have evolved under relatively lownitrogen availability, and increased nitrogen depositionmay reduce biodiversity in such ecosystems byfavoring those species that benefit from high nitrogenlevels (Vitousek et al. 1997).Furthermore, ammonia (NH3) typically formsammonium ions (NH4 + ) aer entering the atmosphere,which can contribute to acidification <strong>of</strong> soilsaer deposition (Krupa 2003; Vitousek et al. 1997).Soils and lakes that are not well buffered againstchanges in pH are particularly susceptible to acidification,which harms plants and the ecosystems thatdepend on them.e concentration <strong>of</strong> ammonia deposition inmany areas <strong>of</strong> the United States now exceeds theamount that may harm forests (termed the “criticalload”). For example, the critical load for deciduousforests has been calculated to range from about 5 to20 kg <strong>of</strong> nitrogen (N) per hectare per year, and forconiferous forests, from 3 to 15 kg N/ha per year(Ferm 1998). When ammonia wet deposition iscombined with nitrate wet deposition (Figure 7,p. 46), areas at risk for exceeding these critical loadsare revealed, along with higher levels <strong>of</strong> nitrogendeposition (note the difference in scales used forFigures 6 and 7).e contribution to water pollution from nitrogendeposited from the atmosphere can be considerable.A recent study <strong>of</strong> 10 estuaries along the EastCoast estimated that atmospheric nitrogen depositionaccounted for 15 to 42 percent <strong>of</strong> total nitrogeninput (Castro and Driscoll 2002). Studies <strong>of</strong> theChesapeake Bay have attributed 25 to 80 percent <strong>of</strong>the total nitrogen to airborne deposition, but morerecent modeling has suggested a figure closer to 20percent or less (Sheeder, Lynch, and Grimm 2002).However, this remains an important contribution,since other work has estimated that nitrogen inputmay have to be reduced by almost 90 percent toeliminate hypoxia (Boesch et al 2001).In addition to ammonia, manure from <strong>CAFOs</strong>contributes to air pollution through the emission <strong>of</strong>hydrogen sulfide, particulates, odors, and pathogens.Fine particulates formed from ammonia canbe a cause <strong>of</strong> respiratory disease. (Ammonia is alsoan irritant when inhaled, and can cause respiratoryproblems in both livestock and CAFO workers.)Ammonia ions that form from volatilized ammoniacan be an important component <strong>of</strong> fine particulatematter (categorized as PM2.5). ese smallparticles—less than 2.5 microns in diameter—areparticularly hazardous to respiratory health becausethey lodge more deeply in the lungs than the largerparticles that were previously the main focus <strong>of</strong> concern(McCubbin et al. 2002). PM2.5 may form whenammonia from <strong>CAFOs</strong> combines in the air with nitrogenoxides or sulfur dioxide from automobiles, industry,or power plants. As <strong>of</strong> 1995, ammonia comprised47 percent <strong>of</strong> PM2.5 by mass in the eastern UnitedStates (Anderson, Strader, and Davidson 2003).
56 <strong>Union</strong> <strong>of</strong> <strong>Concerned</strong> <strong>Scientists</strong>Manure and livestock also produce globalwarming pollution in the form <strong>of</strong> methane and nitrousoxides. ese gases are not as abundant as carbondioxide (the primary contributor to climatechange) but are much more potent in trapping heat:methane by a factor <strong>of</strong> about 24 and nitrous oxidesby a factor <strong>of</strong> about 295.The Costs <strong>of</strong> Manure DisposalBecause manure is an effective and valuable fertilizer,it might be assumed that <strong>CAFOs</strong> could readilyfind nearby farmers willing to accept or even buy it.is is oen not the case. In some situations, adequatefarmland is simply too far away from <strong>CAFOs</strong>for manure transport to be a viable option, but evenwhen farmland is nearby, manure is not always accepted.For example, corn and soybeans are themost widely grown crops in the United States, butdata show that on average, only about 17 percent <strong>of</strong>corn and 2 to 9 percent <strong>of</strong> soybean acreage acceptmanure (Ribaudo et al. 2003). For wheat, grown inareas where beef <strong>CAFOs</strong> are prevalent, the manureacceptance rate has been about 3 percent.One important consideration for farmers is thatthe nutrient content <strong>of</strong> manure can vary considerablyfrom batch to batch depending on the type <strong>of</strong>manure (i.e., the animal source), what the animalswere fed, how the manure was stored, and how it isapplied to the field. is lack <strong>of</strong> uniformity requirestesting to determine nutrient content and howmuch manure a field will therefore need.Noxious odors are a second reason oen givento explain low manure acceptance rates. Odor is primarilya problem associated with manure from<strong>CAFOs</strong> rather than smaller animal operations duein part to the way it is stored and applied to fields.CAFO manure stored in pits or lagoons is oen lowin oxygen, which can lead to the production <strong>of</strong>volatile compounds with <strong>of</strong>fensive odors. esecompounds include hydrogen sulfide (a gas thatsmells <strong>of</strong> rotten eggs), ammonia, phenol, indoles,skatole, volatile fatty acids, acetic acid, cresol, anddimethyl sulfide. Besides being disagreeable, prevalentCAFO odors have been linked to psychologicaldisturbances and health problems in both livestockand people (Mackie, Stroot, and Varel 1998).Smaller operations do not oen store large amounts<strong>of</strong> manure in pits and lagoons, so the low-oxygenconditions that exacerbate odors are not as likely todevelop.As a consequence <strong>of</strong> the small number <strong>of</strong> farmerswilling to use CAFO manure and the huge amount <strong>of</strong>manure concentrated in a small locality, <strong>CAFOs</strong>must oen transport their manure substantial distancesto distribute it over enough farmland to avoidpollution problems and comply with Clean WaterAct standards. Small and medium-sized operations,on the other hand, oen have enough available croplandto apply manure at rates that do not cause substantialwater pollution (Ribaudo et al. 2003).Manure is heavy due to its high water content,and therefore expensive to transport. Manure storedin holding facilities such as lagoons or pits has particularlyhigh water content because it is a mixture<strong>of</strong> feces and urine that is oen flushed out <strong>of</strong> livestockhousing facilities with water. For example,dairy cow, poultry, and pig manure held in lagoonstypically consists <strong>of</strong> more than 99 percent water.Poultry litter has lower water content: about 24 percentfor broilers and 50 percent for layers. Dairycow waste is about 80 to 85 percent water as excreted,while hog and beef cattle waste is about 90percent water (Soil Conservation Service 1992).is high water content has encouraged the spraying<strong>of</strong> this waste onto “sprayfields” close to lagoons.ere can be substantial regional differences inthe amount <strong>of</strong> farmland in an area and the percentagewilling to accept manure. ese regional limitationscan increase costs by requiring greatertransportation distances. Because <strong>CAFOs</strong> have beenable to “decouple” the growing <strong>of</strong> feed, especiallycorn and soybeans, from animal production, 21 theydo not necessarily need to be located in the same21 Because grain is relatively light when dried, it can be shipped long distances at relatively low cost (as long as fuel costs are low). <strong>CAFOs</strong>, by relying on grainas their primary feed component, have therefore been able to locate their operations geographically separated, or decoupled, from the areas that producethis feed.
<strong>CAFOs</strong> <strong>Uncovered</strong> 57regions where feed is grown. For example, the Midwest’scorn belt has a lot <strong>of</strong> cropland but relativelyfewer hog <strong>CAFOs</strong> per acre <strong>of</strong> cropland than theMid-Atlantic and West (Ribaudo et al. 2003); if thetrend observed over the past several decades <strong>of</strong> substantialCAFO growth in these latter regions continues,crop availability for CAFO manure maybecome even more <strong>of</strong> a problem.Other factors contributing to this problem arethe geographic concentration <strong>of</strong> <strong>CAFOs</strong> and the increasingsize <strong>of</strong> individual feeding operations. eenvironmental risks associated with these factorsare oen outweighed by financial considerations.For example, some poultry processors demand increasinglylarger numbers <strong>of</strong> animals to run throughtheir operations (Ollinger, MacDonald, and Madison2005), and need the animals to be raised nearprocessing plants because transportation can lead tosignificant mortality and weight loss.A substantial percentage <strong>of</strong> hog production hasbecome concentrated in the Mid-Atlantic, especiallyNorth Carolina, over the past two decades. NorthCarolina now trails only Iowa in hog production,but was ranked sixth as recently as 1990 (NASS2008a). Hog <strong>CAFOs</strong> may even be in the process <strong>of</strong>becoming more geographically concentrated withinstates. Figure 8 (p. 46) shows the increasing concentration<strong>of</strong> hog production in specific regions and thesimultaneous decrease in production in surroundingareas. is trend was already occurring in the1980s and especially the 1990s.Most beef cattle feedlots have moved to five westernGreat Plains states. California has emerged as thelargest dairy-producing state even though it does notgrow large amounts <strong>of</strong> corn or soybeans, joining theranks <strong>of</strong> such traditional dairy producers as NewYork, Pennsylvania, and Wisconsin (NASS 2008a).As already mentioned, broiler chicken productionis concentrated in the Southeast (Figure 10,p. 47), another region without enough cropland toadequately utilize all <strong>of</strong> the manure its <strong>CAFOs</strong> produce.is concentration has dramatically increasedin recent decades due to rising demand for broilerchickens.Regional CAFO expansion may make it increasinglydifficult for greater amounts <strong>of</strong> manure to beadequately spread onto cropland. As CAFO productionin a given region becomes more dense, accessto local crop fields may decrease while the distanceneeded to reach available fields increases.Methods for calculating manure disposal costsOne way <strong>of</strong> estimating the costs <strong>of</strong> CAFO pollutionis to determine the amount <strong>of</strong> money CAFO ownerswould have to pay to transport manure away fromtheir operations in order to reduce pollution. esecalculations do not include costs from other sources<strong>of</strong> harm caused by <strong>CAFOs</strong>, such as leakage frommanure lagoons, and therefore are incomplete costestimates. Nonetheless, it can be said with certaintythat the various costs involved in addressing the unhealthyconcentrations <strong>of</strong> manure on <strong>CAFOs</strong>amount to a large subsidy for the industry.Another way to consider the harm done by externalitiesis to calculate the value <strong>of</strong> the societalbenefits lost as a result. Accurate calculations aredifficult because benefits are numerous and dispersedthroughout society. e EPA, for example,calculated the benefits from implementation <strong>of</strong> the2003 Clean Water Act amendments at about$290 million per year nationally (EPA 2003), butsubstantially underestimated the total by not addressingsome specific benefits <strong>of</strong> reduced CAFOpollution (e.g., reduced estuary eutrophication, reducedantibiotic use, and benefits to rural communitiessuch as increased property values and betterhealth). And because this regulation does not addressair pollution, no values were assigned for benefitssuch as reduced harm to forests and reducedhealth problems related to fine particulate matter.Calculations that estimate the cost <strong>of</strong> reducingmanure pollution through better land distributionmay be more accurate. is approach would addressmore <strong>of</strong> the environmental damage and some <strong>of</strong> thehealth damage caused by manure than the limitedanalyses <strong>of</strong> lost benefits currently available.Substantial expense would be required to complywith Clean Water Act standards for manure
58 <strong>Union</strong> <strong>of</strong> <strong>Concerned</strong> <strong>Scientists</strong>application in all parts <strong>of</strong> the country. One study estimatedthe cost <strong>of</strong> compliance for various <strong>CAFOs</strong>under different assumptions about farmers’ willingnessto accept manure (WTAM) as a substitute forsynthetic fertilizer, including WTAM levels considerablyhigher than the current actual percentage(Ribaudo et al. 2003). e study authors acknowledgedthat a 20 percent WTAM may represent amore realistic national average than some <strong>of</strong> thehigher WTAM values also used in the study. Calculationsfor applying manure to fields in the ChesapeakeBay watershed using a WTAM <strong>of</strong> 20 percentfor a nitrogen-limited standard arrived at a total annualcost <strong>of</strong> $133.8 million.Environmentally acceptable manure applicationrates can be set based on either nitrogen or phosphoruslimits; the choice should be determined bywhichever nutrient has the greater potential forcausing pollution. is in turn depends on specificcharacteristics <strong>of</strong> the accepting farm, including thecontent <strong>of</strong> each nutrient in the soil, the types <strong>of</strong>crops grown, and soil type. Phosphorus oen representsmore <strong>of</strong> a problem than nitrogen, so applicationrates based on phosphorus limits may oen bemore appropriate.Total costs for the Chesapeake Bay regionbased on a phosphorus-limited application ratehave been estimated at $152.8 million, using a 60percent WTAM (Ribaudo et al. 2003). Because fuelcosts have risen dramatically in recent years, thecurrent costs would undoubtedly be higher. Thesame study notes that without such a high WTAMvalue, there is not enough farmland in the regionto adequately distribute manure under a phosphorusstandard. Determining the cost <strong>of</strong> achieving aphosphorus standard with a WTAM less than 60percent would therefore be complicated by the factthat excess manure would have to be disposed <strong>of</strong>by other means, with uncertain costs. For example,at a 20 percent WTAM in the Chesapeake Bay region,more than 1.5 million tons <strong>of</strong> manure wouldremain after proper field application. Disposing <strong>of</strong>this manure by other means would add substantiallyto the total cost. This dilemma illustrates thedifficulty <strong>of</strong> achieving adequate distribution <strong>of</strong>CAFO manure.The authors note that the net return for animalproduction in the Chesapeake Bay region at thetime was $313 million. Therefore, the cost <strong>of</strong>proper manure application calculated above comprisesabout 43 to 49 percent <strong>of</strong> the net return foranimal production in the region. Even at a WTAM<strong>of</strong> 100 percent, the cost <strong>of</strong> proper field applicationunder a phosphorus standard is calculated to be$143 million, or about 46 percent <strong>of</strong> net return.Even at low levels <strong>of</strong> manure acceptance, thestudy found that smaller animal farms could findenough nearby cropland to accept all <strong>of</strong> their manure,thereby avoiding the costs associated withlonger transportation distances. Because the animalson smaller farms are more dispersed than in<strong>CAFOs</strong>, more <strong>of</strong> the farmland will meet EPA applicationstandards, making manure an asset ratherthan a liability for these farms. For small tomedium-sized animal operations that also growcrops or pasture (diversified farms), some or all <strong>of</strong>the manure produced by the livestock could be usedon the farm.Costs <strong>of</strong> reducing air and water pollutionough the proper application <strong>of</strong> manure on fieldswill reduce air pollution from <strong>CAFOs</strong>, it may increasewater pollution. Conversely, some <strong>of</strong> themethods that reduce water pollution from fieldswhere manure is applied increase air pollution. isis because practices such as spraying manure ont<strong>of</strong>ields, applying manure on top <strong>of</strong> fields withoutspraying, and leaving manure in uncovered storagefacilities for prolonged periods <strong>of</strong> time all allow substantialamounts <strong>of</strong> ammonia to volatilize. Currently,the primary way <strong>of</strong> avoiding this trade<strong>of</strong>fbetween air and water pollution requires both thestorage <strong>of</strong> manure in ways that reduce ammoniavolatilization and access to more land for manuredistribution, and manure spreading methods thatreduce ammonia volatilization.Water and air pollution caused by <strong>CAFOs</strong> aretherefore inextricably linked, and addressing one
<strong>CAFOs</strong> <strong>Uncovered</strong> 59without the other can have unanticipated harmfulconsequences. ere is currently little incentive tolimit air pollution from manure, however, becauseour primary air pollution law, the Clean Air Act,does not typically address ammonia volatilizationfrom manure. e National Research Council recognizedthe need to reduce these emissions andrecommended that controls be designed and implemented(NRC 2004).A resulting increase in costs may be a disincentivefor CAFO owners to adopt practices such ascovering manure lagoons or injecting manure int<strong>of</strong>ield soil; the latter reduces ammonia emissions byabout 50 percent for shallow injection and almostentirely for deep injection (Rotz 2004), but costsmore than spraying or broadcasting manure (Ailleryet al. 2005). e loss <strong>of</strong> ammonia nitrogen tovolatilization also reduces the quality <strong>of</strong> the manureas fertilizer, due to the resulting decrease in nitrogen-to-phosphorusratio.What, then, would it cost to apply CAFO manureto enough land to prevent or greatly reduceboth water and air pollution? A detailed USDAstudy built upon previous studies <strong>of</strong> the amount <strong>of</strong>farmland needed to avoid water pollution fromCAFO manure, under the assumption that ammoniagas reduction measures would apply to all AFOsand water pollution reduction would be based on eithernitrogen or phosphorus limits for <strong>CAFOs</strong> (Allieryet al. 2005). e report also considered theindustry’s possible responses to increased costs,such as passing some costs on to consumers and reducingproduction in the case <strong>of</strong> hogs.Simply complying with the new Clean WaterAct provisions discussed earlier (i.e., without reducingair pollution from ammonia) would cost <strong>CAFOs</strong>a total <strong>of</strong> $534.46 million annually. When bothwater and air pollution reduction practices wereconsidered, the total annual costs rose to as much as$1.16 billion.Several <strong>of</strong> the assumptions and values used in theUSDA’s calculations may have substantially underestimatedthe actual costs. For example, the reportused a WTAM <strong>of</strong> 30 percent—well above the currentlevels for corn, soybeans, and wheat noted above. Inaddition, the cost <strong>of</strong> airborne ammonia abatementwas only calculated for values up to a maximum reduction<strong>of</strong> 40 percent, because the cost <strong>of</strong> greater reductionscould not be accurately determined.Current ammonia wet deposition data suggest that a40 percent reduction in airborne ammonia wouldcontinue to leave many areas with deposition ratesthat may exceed soil critical load levels and cause environmentalharm. is may be even more <strong>of</strong> a problemif dry deposition <strong>of</strong> ammonia and nitrate areconsidered along with wet deposition.On the other hand, some aspects <strong>of</strong> this analysismay have overestimated the costs <strong>of</strong> reducing airand water pollution. In particular, the report consideredair pollution reduction for all AFOs, despitethe fact that <strong>CAFOs</strong> produce about 65 percent <strong>of</strong> alllivestock manure. erefore, if the costs <strong>of</strong> reducingairborne ammonia were proportional to the amount<strong>of</strong> manure produced, about two-thirds <strong>of</strong> the costwould be borne by <strong>CAFOs</strong>.e USDA’s analysis nevertheless represents themost complete national estimates currently availablefor the costs associated with reducing both air andwater pollution from <strong>CAFOs</strong>. e measures consideredwould only partially prevent such pollution,and do not address other dangers such as antibioticresistantpathogens and harm to rural communities(discussed below). It is therefore important to rememberthat these values only partially cover thecosts <strong>of</strong> preventing harm from <strong>CAFOs</strong>.Other Externalized Costs<strong>CAFOs</strong> have numerous environmental, health, andsocial impacts in addition to the ecological harmcaused by manure. Many <strong>of</strong> these generate costs thatare currently borne by society as a whole; here we willspecifically consider some <strong>of</strong> the costs to rural communitieslocated near <strong>CAFOs</strong> and some <strong>of</strong> the costsfrom antibiotic-resistant pathogens that develop inpart due to the overuse <strong>of</strong> antibiotics in <strong>CAFOs</strong>. Wewill also briefly discuss how the genetic uniformityencouraged by <strong>CAFOs</strong> and meat processors to
60 <strong>Union</strong> <strong>of</strong> <strong>Concerned</strong> <strong>Scientists</strong>facilitate their production methods may also contributeto increased disease among livestock.Public health risks in rural communities<strong>CAFOs</strong> oen reduce the quality <strong>of</strong> life and thehealth <strong>of</strong> people living near these operations. eodors emanating from <strong>CAFOs</strong> may be substantialfor up to several miles and have been found to havenegative effects on well-being. Even worse, exposureto pathogens, harmful airborne particles, and contaminatedwater supplies is oen higher for peoplewho live close to <strong>CAFOs</strong>—especially for employees<strong>of</strong> <strong>CAFOs</strong> and their families. Any <strong>of</strong> these factorscan lower property values in the surrounding areas.And because <strong>CAFOs</strong> are oen situated near lowincomecommunities (Donham et al. 2007),residents may be more vulnerable to the dangersbecause these communities typically have lesspolitical clout than others.Studies show that at least 25 percent <strong>of</strong> CAFOworkers suffer from respiratory diseases such aschronic bronchitis and occupational asthma (Donhamet al. 2007; u 2001). People living near swine<strong>CAFOs</strong> have a higher incidence <strong>of</strong> specific diseasescompared with control groups in several studies(Donham et al. 2007; Wing and Wolf 2000; uet al. 1997). is is likely due to the fact that <strong>CAFOs</strong>produce substantial levels <strong>of</strong> substances that may beresponsible for respiratory illness, including ammonia,hydrogen sulfide, particulate matter, and endotoxin(a by-product <strong>of</strong> bacterial membranes).Adverse effects are oen significant at distances<strong>of</strong> up to two or three miles from <strong>CAFOs</strong>, and becomemore severe as operation size increases. Onestudy in particular noted a strong correlation betweenthe types <strong>of</strong> symptoms reported by residentsand those studied in CAFO workers, especially respiratoryand gastrointestinal distress, strongly suggestingthat <strong>CAFOs</strong> were the cause (Wing andWolf 2000).Populations living near <strong>CAFOs</strong> may be at higherrisk <strong>of</strong> exposure to pathogens in the air or water, orthrough direct contact with animals. Furthermore,these pathogens may have developed resistance toantibiotics used at the CAFO (see below). Substantiallevels <strong>of</strong> antibiotic-resistant pathogens or indicatorspecies (bacteria that are not themselvespathogenic, but are oen found together withpathogens) have been isolated from the air in swine<strong>CAFOs</strong> (Chapin et al. 2005), and potentially pathogenicbacteria—especially Staphylococcus aureus—were found up to 150 m downwind from swine<strong>CAFOs</strong> (Green et al. 2006), suggesting that significantrisk from airborne pathogens is greatest relativelyclose to <strong>CAFOs</strong>. However, because pathogenssuch as S. aureus may also spread between peopleaer acquisition, infection originating in or near<strong>CAFOs</strong> may be further spread by contact betweenpeople.Water sources near <strong>CAFOs</strong> may also act as vectors<strong>of</strong> infection for the nearby population. Antibiotic-resistantbacteria or resistance genes thatoriginated at swine and other <strong>CAFOs</strong> have been detectedin ground and surface water by several studies(Sapkota et al. 2007; Sayah et al. 2005; Chee-Sanfordet al. 2001). Because groundwater supplies 97 percent<strong>of</strong> rural drinking water (USGS 1995) and waterfrom individual wells is oen untreated, exposurefrom these sources could be significant. For example,one study found fecal indicator bacteria (Enterococciand coliforms) in test wells 250 and 400 mdowngradient from swine <strong>CAFOs</strong> (i.e., wheregroundwater is at a deeper level than directly belowthe CAFO), at levels that exceeded EPA safe drinkingwater guidelines (Sapkota et al. 2007). ese bacteriaalso had substantially higher levels <strong>of</strong> resistanceto several antibiotics compared with samples recoveredupgradient from <strong>CAFOs</strong>.Another study found tetracycline-resistant bacteria250 m downgradient from a swine CAFO(Chee-Sanford et al. 2001); these bacteria were continuouslypresent over a three-year period (Koikeet al. 2007). Soil-dwelling bacteria found in groundwaterdowngradient from <strong>CAFOs</strong> carried identicaltetracycline-resistance genes as those found in swinemanure lagoons, while bacteria from upgradientsites did not (Koike et al. 2007). is strongly suggestsnot only that lateral gene transfer had occurred
<strong>CAFOs</strong> <strong>Uncovered</strong> 61between CAFO bacterial species and those betteradapted to surviving and spreading in soil, but alsothat the spread <strong>of</strong> resistance may be facilitated bytransfer to environmentally adapted species.Some data suggest that hog <strong>CAFOs</strong> may representa particularly serious threat to communityhealth. For example, one study showed that althougha swine CAFO appeared to have significanteffects on the health <strong>of</strong> nearby residents, a dairyconfinement operation did not (Wing and Wolf2000). It should be noted that the hog CAFO in thisstudy was much larger (6,000 head) than the dairyoperation (300 head). As noted earlier, larger operationsaffect people at greater distances than smalleroperations. Most studies to date appear to have focusedon the deleterious health effects <strong>of</strong> hog<strong>CAFOs</strong>, but elevated levels <strong>of</strong> substances associatedwith harm to hog CAFO workers have also beenfound in other sectors.Economic costs to rural communities<strong>CAFOs</strong> also have a more adverse economic impacton rural communities compared with smaller andless industrialized animal farms. One study identifiedseveral ways that hog <strong>CAFOs</strong> threaten the viability<strong>of</strong> rural life: reduced property values, fewerjobs, smaller tax base, increased expenses such asroad repair, and lower or absent economic multipliereffects (Weida 2004b).Multiplier effects indicate the number <strong>of</strong> timesmoney is exchanged within a region and reflect thehigher economic value to the region <strong>of</strong> an enterprisethat uses its revenues locally compared with an enterprisethat moves money out <strong>of</strong> the region. Severalstudies suggest that the multiplier effects <strong>of</strong> smallerand independent hog operations are higher thanthose <strong>of</strong> <strong>CAFOs</strong>. For example, smaller farms tend topurchase more <strong>of</strong> their inputs locally or regionallythan larger operations; farms with gross incomes <strong>of</strong>$100,000 or less made 95 percent <strong>of</strong> their expenditureslocally compared with less than 20 percent forfarms making more than $900,000 (Chism andLevins 1994). A study examining hog farms in Iowafound that smaller farms purchased about75 percent <strong>of</strong> their feed from local suppliers, comparedwith 43 percent for larger operations(Lawrence, Otto, and Meyer 1997). Independentand smaller hog operations also generate more jobsfor a given amount <strong>of</strong> revenue compared with verticallyintegrated <strong>CAFOs</strong>—almost three times asmany in one study (Weida 2004b).<strong>CAFOs</strong> also reduce the local tax base while potentiallyincreasing community expenses. For instance,<strong>CAFOs</strong> can take advantage <strong>of</strong> tax breaks forindustry or farming operations, but several communitieshave noted higher road maintenance costs dueto CAFO truck traffic (Weida 2004b). Water treatmentcosts may also be substantial for communitiesdownstream from <strong>CAFOs</strong> or drawing water fromcontaminated aquifers, such as cities in Oklahomaand Texas that sued nearby <strong>CAFOs</strong> due to pollution<strong>of</strong> the watersheds that supply these cites with drinkingwater (Martin 2006). And because property valuesare reduced near <strong>CAFOs</strong>, the residential taxbase may suffer as well. Overall, economic growthwas 55 percent slower in communities near hog<strong>CAFOs</strong> compared with communities with smallerhog operations (Weida 2004b).One <strong>of</strong> the most tangible indicators <strong>of</strong> the harmcaused by <strong>CAFOs</strong> in rural communities is the substantialreduction in property values. Several studieshave found considerably lower values—5 to 40 percentlower or more—within distances <strong>of</strong> about threemiles from hog <strong>CAFOs</strong> (e.g., Weida 2004b). Onestudy estimated an average loss <strong>of</strong> about $2.68 millionfor the land within three miles <strong>of</strong> each CAFO inMissouri (Mubarak, Johnson, and Miller 1999).ese values cannot be accurately extrapolatedto all <strong>CAFOs</strong> nationwide because <strong>of</strong> the large number<strong>of</strong> differences between CAFO sites, includingthe size and type <strong>of</strong> operation, management practices,local property values, and distribution <strong>of</strong><strong>CAFOs</strong>. At any site, the impact on property valuesmay be greater or less than that determined in thestudies described here. It is likely however, that on anational basis the reduction in property values iswidespread and considerable. It is therefore instructiveto calculate these costs based on the Missouri
62 <strong>Union</strong> <strong>of</strong> <strong>Concerned</strong> <strong>Scientists</strong>data to convey the general magnitude rather than aprecise value: using a conservative estimate <strong>of</strong> 9,884<strong>CAFOs</strong> nationwide, the total loss in property valuewould be $26.5 billion.Contribution to antibiotic resistanceAn important disease risk associated with <strong>CAFOs</strong> isthe evolution <strong>of</strong> antibiotic-resistant pathogens resultingfrom the misuse and overuse <strong>of</strong> antibioticsin livestock operations. Non-therapeutic use <strong>of</strong> antibioticsin such operations has been estimated tosurpass all human use by a factor <strong>of</strong> about eight(Mellon, Benbrook, and Benbrook 2001).Crowding, stress, and unsanitary conditionsfound in <strong>CAFOs</strong> result in a reliance on largeamounts <strong>of</strong> antibiotics not only to treat illness, butalso to promote growth and prevent disease. Becausemany animals are therefore exposed to antibioticsthroughout their lives (oen in the form <strong>of</strong> a feedadditive), increasing resistance to these antibioticsmay result in diseases that are more difficult to treatin humans and therefore cause greater harm thantheir antibiotic-susceptible counterparts. e administration<strong>of</strong> antibiotics is not allowed under organicstandards and may also be less prevalent amongCAFO alternatives such as pasture-based systems.e use <strong>of</strong> antibiotics—particularly at the lowlevels and over the long periods typical for growthpromotion—is widely acknowledged to increase theprevalence <strong>of</strong> antibiotic-resistant bacteria (Ingliset al. 2005; Shea et al. 2004; Lipsitch 2002; Smithet al. 2002). e non-therapeutic use <strong>of</strong> antibiotics in<strong>CAFOs</strong> may even lead to high levels <strong>of</strong> resistancemore quickly than therapeutic applications, whichuse higher concentrations <strong>of</strong> antibiotics (Bacquero2001). erapeutic uses may also contribute to resistance(WHO 2003), especially if animals are raisedunder conditions that facilitate disease. On a positivenote, when the European <strong>Union</strong> prohibited the use<strong>of</strong> antibiotics for growth promotion, the prevalence<strong>of</strong> antibiotic-resistant bacteria generally decreased(Emborg et al. 2003; Aarestrup et al. 2001).Diseases caused by antibiotic-resistant pathogensare oen more difficult to treat. In some cases, antibioticresistance may also be associated with increasedvirulence, and initial use <strong>of</strong> ineffective antibioticsdelays effective treatment. Such antibioticsmay oen be initially prescribed because the susceptibility<strong>of</strong> the infectious agent will not be known, andthe resulting delay in effective treatment can sometimeslead to worse outcomes including longer hospitalstays or death. For some pathogens, such asmultiple-drug-resistant strains <strong>of</strong> Enterococcus faecium,few effective antibiotics may remain.Higher health costs resulting from antibiotic resistanceto food-borne pathogens have been repeatedlydocumented, especially for Campylobacterjejuni and Salmonella (Varma et al. 2005a; Varmaet al. 2005b; Molbak 2005; Engberg et al. 2004;Swartz 2002; Travers and Barza 2002). Some studies,however, have argued that farm use is not generallyresponsible, or that higher therapeutic use followingthe discontinuation <strong>of</strong> use for growth promotionmay be responsible (Phillips et al. 2004). Antibioticresistantstrains <strong>of</strong> Salmonella have been associatedwith hospitalization rates more than 2.5 timeshigher than antibiotic-susceptible strains (Varmaet al. 2005a), and with serious bloodstream infectionsresulting in higher rates <strong>of</strong> morbidity andmortality (Varma et al. 2005b). In addition, the duration<strong>of</strong> illness associated with quinilone-resistantstrains <strong>of</strong> Campylobacter (13.2 d) was 28 percentlonger than that associated with quinilone-sensitivestrains (10.3 d) (Engberg et al. 2004).Although illness from food-borne bacteria isnot always treated with antibiotics, a subset <strong>of</strong> patientsrequires hospitalization and antibiotic use.erefore, antibiotic-resistant strains that developdue to CAFO practices may increase hospital costsand suffering compared with non-resistant strains.Campylobacter and Salmonella cause large numbers<strong>of</strong> illnesses: between 2 and 2.4 million Campylobacterinfections per year in the United States andabout 1.4 million Salmonella infections (Mead et al.1999). Treatment <strong>of</strong> Salmonella with antibiotics inthe United States may be as high as 40 percent <strong>of</strong>cases (Molbak 2005), and about 10 percent <strong>of</strong>Campylobacter infections require hospitalization
<strong>CAFOs</strong> <strong>Uncovered</strong> 63(Swartz 2002). Several factors may account for increasedmorbidity and mortality from antibioticresistantpathogens, including reduced efficacy <strong>of</strong>initial antibiotic choices, more limited choice <strong>of</strong>treatment options aer diagnosis, and possible increasedvirulence <strong>of</strong> strains carrying antibioticresistancegenes (Molbek 2005).Resistance generated in animals also extends beyondfamiliar pathogens to commensal bacteria(those that commonly reside in animals and peoplewithout causing illness). is is a concern becauseresistance traits may be passed between bacterialspecies—from food-borne bacteria to commensalbacteria residing in our gastrointestinal tract, for example(Nikolich et al. 1994). Some typically commensalbacteria—Enterococci, S. aureus, anduropathogenic strains <strong>of</strong> Escherichia coli—may alsocause serious disease under certain circumstances(e.g., during surgery, in patients with a compromisedimmune system, in patients using catheters).In addition to causing disease through food consumption,other farm animal-associated bacteria,including S. aureus, may be passed to farmers, veterinarians,and their families and communities throughdirect contact with animals. Serious “communityacquired”strains <strong>of</strong> such bacteria (those not acquiredin hospitals) have emerged in the past several years,with nearly 14 percent <strong>of</strong> MRSA infections acquiredoutside hospitals (Klevins et al. 2007). 22Recent work in the Netherlands has shown thata newly identified strain <strong>of</strong> MRSA has apparentlyemerged from farm animals and now comprisesmore than 20 percent <strong>of</strong> MRSA infections in thatcountry (van Loo et al. 2007). e new strain hasbeen found on pigs and cattle, and human infectionhas a strong geographic association with regionswhere these animals are raised. More recently, thisstrain has been isolated from pigs and pig farmers inCanada, and another strain found on Canadian pigsis known to cause infections in humans in theUnited States (Khanna et al. 2007).Some urinary tract infections (UTIs) have recentlybeen associated with antibiotic-resistant bacteriapossibly acquired from animal products. Abouthalf <strong>of</strong> all women experience at least one UTI duringtheir lifetime, oen requiring antibiotic treatment,and the resulting cost <strong>of</strong> community-acquiredUTIs in the United States has been estimated to be$1.6 billion per year (Foxman 2002). Althoughmany are resolved relatively easily, some can lead tomore serious outcomes such as pyelonephritis orsepticemia.Strains <strong>of</strong> antibiotic-resistant uropathogenicE. coli have been identified that bear substantial similarityto strains found on livestock (Ramchandaniet al. 2005). In addition, UTIs caused by strains <strong>of</strong>E. coli resistant to multiple antibiotics, or by strainsresistant to ampicillin or cephalosporin antibiotics,have been associated with higher consumption <strong>of</strong>poultry or pork, respectively (Manges et al. 2007).ese studies suggest that antibiotic-resistant UTIsmay be acquired from food sources, and that such infectionsmay lead to higher physician or hospitalcosts and other consequences <strong>of</strong> increased diseaseseverity.Antibiotic-resistant strains that develop at<strong>CAFOs</strong> may continue to exist at high frequencieseven aer antibiotic use in animals has been discontinuedor reduced, as demonstrated with vancomycin-resistantEnterococci in Denmark (Heueret al. 2002a and 2002b). Resistance can sometimespersist due to changes in the bacteria; for example,antibiotic-resistant pathogens that are less fit in theabsence <strong>of</strong> the antibiotic may acquire compensatorymutations over time that increase their ability topersist (Bjorkman et al. 2000; Levin and Bergstrom2000). Such mutations have been observed, as haveinherently high fitness levels, in antibiotic-resistantstrains <strong>of</strong> food-borne Campylobacter and Salmonella(Zhang 2006).22 S. aureus may be responsible for about 478 million hospitalizations per year in the United States, with MRSA strains causing about 19,000 deaths per year(Klevins et al. 2007).
64 <strong>Union</strong> <strong>of</strong> <strong>Concerned</strong> <strong>Scientists</strong>The economic impact <strong>of</strong> antibiotic resistanceOne way to quantify the externalities associatedwith the overuse <strong>of</strong> antibiotics in <strong>CAFOs</strong> is to calculatethe costs <strong>of</strong> the harm caused by antibiotic-resistantbacteria. ese costs include lost work days andthe increased medical costs involved in treatingmore severe disease.One widely cited study estimated the total annualcost <strong>of</strong> antibiotic resistance approaches $30 billion(Phelps 1989); Salmonella infections aloneaccount for about $2.5 billion per year (ERS 2008).e majority <strong>of</strong> these costs—about 88 percent—aredue to premature deaths. Because multi-drug resistancecontributes substantially to disease severityand poor outcomes, this factor is likely to contributesubstantially to the cost <strong>of</strong> premature deaths, althoughno specific calculations are available.Assuming most U.S. consumers eat animalproducts, eliminating the non-therapeutic use <strong>of</strong> animalantibiotics would cost about $5 to $10 per personper year, or an annual total <strong>of</strong> about $1.5 billionto $3 billion, due to increased production costs thatthe industry would pass on to consumers (NRC1999). ese estimates do not consider costs associatedwith reducing therapeutic antibiotic use, whichmay be more common in <strong>CAFOs</strong> than some alternativetypes <strong>of</strong> animal production. ough these estimatesare crude values, they serve to illustrate thesubstantial societal cost <strong>of</strong> antibiotic resistance associatedwith livestock production.Health risks related to genetic uniformityAlthough disease in animals is an important concernwith any kind <strong>of</strong> livestock production, somediseases may be exacerbated in <strong>CAFOs</strong> and otherAFOs. Concentrating animals in close proximity toone another generally enhances the potential transmission<strong>of</strong> microorganisms (Gilchrist et al 2007).Under conditions <strong>of</strong> confinement, the naturalresistance <strong>of</strong> livestock to pathogens is therefore anespecially important factor in limiting the spread <strong>of</strong>disease—a factor generally strengthened by geneticdiversity among animals (Hedrick 2002; Wills andGreen 1995). Genetic diversity includes specificvariations known to play a role in disease resistance,such as polymorphic alleles in the major histocompatibilitycomplex (MHC) genes <strong>of</strong> the immune system(Vila, Seddon, and Ellegren 2005). Conversely,greater genetic uniformity increases the probabilitythat pathogens to which animals are susceptible willspread and cause harm.Unlike natural animal populations, which typicallyhave considerable genetic diversity, animals in<strong>CAFOs</strong> have been bred for uniformity to facilitateindustrial-scale production, processing, and productconsistency. Research has determined that thecontinuing intensification <strong>of</strong> livestock production,with its emphasis on a few breeds and geneticsources, is contributing to reduced genetic diversity,and that the animals bred for such industrial-scaleproduction may have less ability to resist diversepathogens (FAO 2007).at study also found that at least 20 percent,and likely more, <strong>of</strong> the world’s livestock breeds are atrisk for extinction. Although the genetic diversity <strong>of</strong>livestock remains relatively high globally, much <strong>of</strong>this diversity exists on small and subsistence farms,and diversity is declining both within breeds andthrough a reduction in the number <strong>of</strong> breeds. estudy concludes that, without intervention to stopthese trends, reduced genetic diversity could havenegative consequences for disease resistance andour ability to adapt varied methods <strong>of</strong> raising livestock,such as pasture-based production, to awarmer climate.Livestock breeding for <strong>CAFOs</strong> specifically emphasizescharacteristics such as meat quality andease <strong>of</strong> processing, rate <strong>of</strong> weight gain or milk production,and related properties (Blackburn et al.2003). is results in increasing genetic uniformityfor many species and breeds, reduced diversitywithin breeds, and a reduction in the number <strong>of</strong> primarybreeds. For example, the U.S. dairy herd isnow largely dominated by Holsteins, with muchsmaller numbers <strong>of</strong> Jerseys and a few other breeds.Swine operations rely on a few paternal lines includingDuroc, Hampshire, and Berkshire, and maternalYorkshire and Landrace breeds. Because the poultry
<strong>CAFOs</strong> <strong>Uncovered</strong> 65sector uses proprietary lines, it is more difficult todetermine genetic diversity, but it is believed to benarrow.In contrast to industrialized livestock production,alternative production systems oen requirebroader genetic diversity to match the needs <strong>of</strong> regionalmarkets, climates, and other considerations.e growth <strong>of</strong> such systems has been recognized asan important means <strong>of</strong> preserving genetic diversity(Blackburn et al. 2003).Summary <strong>of</strong> CAFO Externalities<strong>CAFOs</strong> produce water and air pollution that harmsfisheries and forests, drinking water, and recreationalfacilities. Other externalities include healthproblems caused by fine particles that lodge in thelungs, foul odors, and antibiotic-resistant pathogens.All <strong>of</strong> these problems are caused largely by the excessivenumbers and crowding <strong>of</strong> animals in<strong>CAFOs</strong>, which result in too much manure in toosmall an area and the overuse <strong>of</strong> antibiotics to compensatefor the stressful and unsanitary conditions.Although it is difficult to attach monetary valuesto the harm caused by <strong>CAFOs</strong>, studies have estimatedthe cost <strong>of</strong> preventing at least some <strong>of</strong> thisharm through the proper distribution <strong>of</strong> CAFO manureon farm fields. Even modest reductions <strong>of</strong>water and air pollution would cost more than $1 billionper year, and calculations based on more realisticrates <strong>of</strong> manure distribution would likely pushthis number considerably higher.Other types <strong>of</strong> damage caused by <strong>CAFOs</strong> thatcannot be completely addressed by proper manuredistribution include reduced quality <strong>of</strong> life for ruralcommunities (as indicated by lower property values),antibiotic-resistant pathogens, and increased geneticuniformity among livestock. Although these externalitiescannot be adequately monetized at this time, theylikely add billions <strong>of</strong> dollars to the cost <strong>of</strong> <strong>CAFOs</strong>.
<strong>CAFOs</strong> <strong>Uncovered</strong> 67C h a p t e r 4CONCLUSIONS AND RECOMMENDATIONSContrary to what many people believe, the pollutingand unhealthy system <strong>of</strong> raising livestockin crowded confinement facilities is not the most efficientway to produce eggs, meat, and milk in an industrialsociety, nor is it the inevitable outcome <strong>of</strong>market forces that provide the United States withsufficient food. is report shows that the <strong>CAFOs</strong>ystem is driven not by efficiency but primarily bythe market power held by large processors and publicpolicy. Deliberate government policies that costtaxpayers billions <strong>of</strong> dollars every year helped to establishthis system and now keep it afloat.Food animal production in the United States isdominated by a small number <strong>of</strong> very large processorsthat either own animals or purchase themthrough production contracts—a system that favors<strong>CAFOs</strong> and limits market access for smaller independentproducers. <strong>CAFOs</strong> also have relied on artificiallycheap grain to <strong>of</strong>fset the high fixed costs <strong>of</strong>the facilities and practices needed to produce largenumbers <strong>of</strong> animals. e consequences <strong>of</strong> this systemcan be measured in environmental, economic,societal, and health costs.In contrast, alternatives to <strong>CAFOs</strong>—especiallymid-sized operations and those centered on pasture—havebeen shown to produce plentiful animalproducts at a comparable cost, and oen at a higherpr<strong>of</strong>it than <strong>CAFOs</strong>.Can Technology Fix <strong>CAFOs</strong>?Increasing attention has been paid in recent years totechnological means <strong>of</strong> reducing the harm causedby <strong>CAFOs</strong>. ese technological “fixes” include feedformulations intended to reduce the nitrogen andphosphorus in manure, use <strong>of</strong> alum in manure holdingfacilities to remove much <strong>of</strong> the phosphorus,and lagoon covers and injection <strong>of</strong> manure into cropsoils to reduce ammonia volatilization. Althoughthese techniques and others may be useful—but inmost cases, imperfect—ways <strong>of</strong> reducing individualproblems caused by <strong>CAFOs</strong>, they all add to the cost<strong>of</strong> production while failing to address the biggerpicture. Supporting alternative production methodsthat fundamentally avoid many <strong>of</strong> the problems associatedwith <strong>CAFOs</strong> would be a better and morecost-effective approach.One technological fix that has been attractingconsiderable attention involves the capture <strong>of</strong>methane from manure to produce natural gas (or“biogas”) that can be used as fuel. As discussed inthis report, methane is produced under the anaerobicconditions found in many manure holding facilitiessuch as lagoons.While this technology would help reduce theodors and heat-trapping pollution created by<strong>CAFOs</strong>, it currently suffers from several limitations.First and most important, methane capture does notreduce the amount <strong>of</strong> nitrogen, phosphorus (inmost schemes), or water in manure. All <strong>of</strong> thesecomponents contribute to serious problems discussedthroughout this report. Biogas productionalso does not enhance manure’s value as a fertilizer,because <strong>CAFOs</strong> will face the same costs and hurdlesto distribute this technology’s liquid residues onfields as with liquid manure.Finally, biogas production does not address animalhealth or ethics issues related to overcrowdingand stress, the overuse <strong>of</strong> antibiotics that can compromisehuman health and increase health costs, orsome <strong>of</strong> the economic impacts <strong>of</strong> <strong>CAFOs</strong> on ruralcommunities (such as reduced multiplier effects).
68 <strong>Union</strong> <strong>of</strong> <strong>Concerned</strong> <strong>Scientists</strong>Wanted: Sound Agricultural PolicySystems that are propped up by billions <strong>of</strong> dollars inpublic subsidies are not inevitable. e CAFO systemhas been nurtured by government policies thatfavor intensive, industrial-style production—oenat the public’s expense. ese policies include heavilysubsidized feed grain, lack <strong>of</strong> accountability forwater and air pollution, counterproductive technologicalfixes such as the non-therapeutic use <strong>of</strong> antibioticsin livestock, and an ill-equipped regulatorysystem that looks the other way rather than confrontingthe growing economic power <strong>of</strong> largeprocessors.Because the success <strong>of</strong> <strong>CAFOs</strong> has dependedon favorable policies rather than any inherent advantagesin production methods, better policiescould reverse the damaging ways agriculture iscurrently practiced in this country. Such policieswould eliminate the artificial advantages currentlygranted to <strong>CAFOs</strong>, force <strong>CAFOs</strong> to take financialresponsibility for the environmental harm theycause, and support research that would furtherimprove alternative animal farming methods thathave already proven safer and better for ruralcommunities than <strong>CAFOs</strong>. Needed actions include:• Strict and vigorous enforcement <strong>of</strong> antitrustand anti-competitive practice laws under thePackers and Stockyards Act (which covercaptive supply, transparency <strong>of</strong> contracts, andaccess to open markets)• Strong enforcement <strong>of</strong> the Clean Water Act asit pertains to <strong>CAFOs</strong>, including improvedoversight at the state level or the takeover <strong>of</strong> responsibilitiescurrently delegated to the statesfor approving and monitoring NPDES permits;improvements could include more inspectorsand inspections, better monitoring and enforcement<strong>of</strong> manure-handling practices, andmeasurement <strong>of</strong> the effectiveness <strong>of</strong> pollutionprevention practices• Development <strong>of</strong> new regulations under theClean Air Act that would reduce emissions <strong>of</strong>ammonia and other air pollutants from <strong>CAFOs</strong>,and ensure that CAFO operators cannot avoidsuch regulations by encouraging ammoniavolatilization• Continued monitoring and reporting <strong>of</strong> ammoniaand hydrogen sulfide emissions as requiredunder the Comprehensive EnvironmentalResponse, Compensation, and Liability Act(CERCLA, commonly referred to as the “Superfund”)and the Emergency Planning andCommunity Right-to-Know Act (EPCRA)• Replacement <strong>of</strong> farm bill commodity cropsubsidies with subsidies that strengthen conservationprograms and support prices whensupplies are high (rather than allowing pricesto fall below the cost <strong>of</strong> production)• Reduction <strong>of</strong> the current $450,000 EQIP projectcap to levels appropriate to smaller farms, witha focus on support for sound animal farmingpractices• Revision <strong>of</strong> slaughterhouse regulations to facilitatelarger numbers <strong>of</strong> smaller processors,including the elimination <strong>of</strong> requirements notappropriate for smaller facilities, combined withpublic health measures such as providingadequate numbers <strong>of</strong> federal inspectors orempowering and training state inspectors• Substantial funding for research to improvealternative animal production methods (especiallypasture-based) that are beneficial to theenvironment, public health, and ruralcommunitiesWe believe that if <strong>CAFOs</strong> were required to takefinancial responsibility for the harm they cause, andentry into markets for alternatives was not held backby a heavily concentrated processing industry andpublic policies, efficient and safer alternatives wouldflourish.
<strong>CAFOs</strong> <strong>Uncovered</strong> 71REFERENCESAarestrup, F.M., A.M. Seyfarth, H.-D. Emborg, K.Pedersen, R.S. Hendriksen, and F. Bager. 2001. Effect<strong>of</strong> abolishment <strong>of</strong> the use <strong>of</strong> antimicrobialagents for growth promotion on occurrence <strong>of</strong> antimicrobialresistance in fecal Enterococci from foodanimals in Denmark. Antimicrobial Agents andChemotherapy 45(7):2054–2059.Aillery, M., N. Gollehon, R. Johansson, J. Kaplan, N.Key, and M. Ribaudo. 2005. Managing manure toimprove air and water quality. Report no. 9.Economic Research Service, U.S. Department<strong>of</strong> Agriculture.Anderson, N., R. Strader, and C. Davidson. 2003.Airborne reduced nitrogen: Ammonia emissionsfrom agriculture and other sources. Environment International29:277–286.Badgley, C., J. Moghtader, E. Quintero, E. Zakem,M.J. Chappell, K. Avilés-Vázquez, A. Samulon, andI. Perfecto. 2007. Organic agriculture and the globalfood supply. Renewable Agriculture and Food Systems22(2):86–108.Baquero, F. 2001. Low-level antibacterial resistance:A gateway to clinical resistance. Drug Resistance Update4(2):93–105.Barker, J.C., and J.P. Zublena. 1995. Livestock manurenutrient assessment in North Carolina. Final report.North Carolina Agricultural ExtensionService, North Carolina State University.Becker, M.F., K.D. Peter, and J. Masoner. 2002. Possiblesources <strong>of</strong> nitrate in ground water at swine licensed-managedfeeding operations in Oklahoma,2001. WRI report 02–4257. U.S. Geological Survey.Bjorkman, J., I. Nagaev, O.G. Berg, D. Hughes, andD.I. Andersson. 2000. Effects <strong>of</strong> environment oncompensatory mutations to ameliorate costs <strong>of</strong> antibioticresistance. Science 287:1479–1481.Blackburn, H.D., T. Stewart, D. Bixby, P. Siegal, andE. Bradford. 2003. United States <strong>of</strong> America countryreport. In State <strong>of</strong> the world’s animal genetic resources(Food and Agriculture Organization, United Nations).Agricultural Research Service, U.S. Department<strong>of</strong> Agriculture.Boesch, D.F, R.B. Brinsfield, and R.E. Magnien.2001. Chesapeake Bay eutrophication: Scientific understanding,ecosystem restoration, and challengesfor agriculture. Journal <strong>of</strong> Environmental Quality30:303–320.Boessen, C., J.D. Lawrence, and G. Grimes. 2004.Production and marketing characteristics <strong>of</strong> U.S. porkproducers—2003. Working paper no. AEWP 2004-04. Department <strong>of</strong> Agricultural Economics, University<strong>of</strong> Missouri.Boody, G., B. Vondracek, D. Andow, M. Krinke, J.Westra, J. Zimmerman, and P. Welle. 2005. Multifunctionalagriculture in the United States. Bio-Science 55(1):27–38.Burkart, M., D. James, M. Liebman, and C. Herndl.2005. Impacts <strong>of</strong> integrated crop–livestock systemson nitrogen dynamics and soil erosion in westernIowa watersheds. Journal <strong>of</strong> Geophysical Research110:G01009, doi:10.1029/2004JG000008.
72 <strong>Union</strong> <strong>of</strong> <strong>Concerned</strong> <strong>Scientists</strong>Burkholder, J.M., D.A. Dickey, C. Kinder, R.E. Reed,M.A. Mallin, G. Melia, M.R. McIver, L.B. Cahoon,C. Brownie, N. Deamer, J. Springer, H.B. Glasgow,D. Toms, and J. Smith. 2006. Comprehensive trendanalysis <strong>of</strong> nutrients and related variables in a largeeutrophic estuary: A decadal study <strong>of</strong> anthropogenicand climatic influences. Limnology and Oceanography51:463–487.Burkholder, J.M., M.A. Mallin, H.B. Glasgow, Jr.,L.M. Larsen, M.R. McIver, G.C. Shank, N. Deamer-Melia, D.S. Briley, J. Springer, B.W. Touchette, andE.K. Hannon. 1997. Impacts to a coastal river andestuary from rupture <strong>of</strong> a large swine waste holdinglagoon. Journal <strong>of</strong> Environmental Quality 26:1451–1466.Castro, M.S., and C.T. Driscoll. 2002. Atmosphericnitrogen deposition to estuaries in the mid-Atlanticand northeastern United States. Environmental Scienceand Technology 36:3242–3249.Centner, T.J. 2006. Governmental oversight <strong>of</strong> dischargesfrom concentrated animal feeding operations.Environmental Management 37(6):745–752.Chapin, A, A. Rule, K. Gibson, T. Buckley, and K.Schwab. 2005. Airborne multidrug-resistant bacteriaisolated from a concentrated swine feeding operation.Environmental Health Perspectives 113(2):137–142.Chee-Sanford, J.C., R.I. Aminov, I.J. Krapac, N. Garrigues-Jeanjean,and R.I. Mackie. 2001. Occurrenceand diversity <strong>of</strong> tetracycline resistance genes in lagoonsand groundwater underlying two swine productionfacilities. Applied and EnvironmentalMicrobiology 67(4):1494–1502.Chesapeake Bay Commission. 2003. e blue crab2003: Status <strong>of</strong> the Chesapeake population and itsfisheries. Blue Crab Technical Work Group.Online at http://www.chesbay.state.va.us/Publications/Blue%20Crab%202003.pdf,accessed on March 11, 2008.Chesapeake Bay Project. 2007. Striped bass. Onlineat www.chesapeakebay.net/bfg_striped_bass.aspx?menuitem=14491, accessed on March 11, 2008.Chism, J.W., and R.A. Levins. 1994. Farm spendingand local selling: How do they match up? MinnesotaExtension Service, University <strong>of</strong> Minnesota.Minnesota Agricultural Economist 676:1–4.Clark, J.W., W. Viessman, Jr., and M.J. Hammer.1977. Water supply and pollution control. ird edition.New York: IEP.Clemens, J., and H-J. Ahlgrimm. 2001. Greenhousegases from animal husbandry: Mitigation options.Nutrient Cycling in Agroecosystems 60:287–300.DeRamus, H.A., T.C. Clement, D.D. Giampola, andP.C. Dickison. 2003. Methane emissions <strong>of</strong> beef cattleon forages: Efficiency <strong>of</strong> grazing managementsystems. Journal <strong>of</strong> Environmental Quality 32(1):269–277.DiGiacomo, G., C.J. Iremonger, L. Kemp, C. vanSchaik, and H. Murray. 2001. Sustainable farmingsystems: Demonstrating environmental and economicperformance. Minnesota Institute for SustainableAgriculture, University <strong>of</strong> Minnesota.Donham, K.J., S. Wing, D. Osterberg, J.L. Flora, C.Hodne, K.M. u, and P.S. orne. 2007. Communityhealth and socioeconomic issues surrounding<strong>CAFOs</strong>. Environmental Health Perspectives115(2):317–320.Economic Research Service (ERS). 2008. Foodborneillness cost calculator. U.S. Department <strong>of</strong> Agriculture.Online at http://www.ers.usda.gov/Data/FoodborneIllness.Economic Research Service (ERS). 2005. Historicand recent costs and returns. U.S. Department <strong>of</strong>Agriculture.
<strong>CAFOs</strong> <strong>Uncovered</strong> 73Emborg, H.D., J.S. Andersen, A.M. Seyfarth, S.R.Andersen, J. Boel, and H.C. Wegener. 2003. Relationsbetween the occurrence <strong>of</strong> resistance to antimicrobialgrowth promoters among Enterococcusfaecium isolated from broilers and broiler meat.International Journal <strong>of</strong> Food Microbiology 84:273–284.Emborg, H.D., and A.M. Hammerum. 2007. DAN-MAP 2006: Use <strong>of</strong> antimicrobial agents and occurrence<strong>of</strong> antimicrobial resistance in bacteria from foodanimals, foods and humans in Denmark. Online athttp://www.danmap.org/pdfFiles/Danmap_2006.pdf,accessed on March 11, 2008.Engberg, J., J. Neimann, E.M. Nielsen, F.M. Aarestrup,and V. Fussing. 2004. Quinolone-resistantCampylobacter infections in Denmark: Risk factorsand clinical consequences. Emerging Infectious Diseases10(6):1056–1063.Environmental Protection Agency (EPA). 2007. 40CFR Parts 122 and 412 proposed revised compliancedates under the National Pollutant DischargeElimination System permit regulations and effluentlimitations guidelines and standards for concentratedanimal feeding operations. Federal Register72(90):26582–26587.Environmental Protection Agency (EPA). 2006. 40CFR Parts 122 and 412 revised National PollutantDischarge Elimination System permit regulationand effluent limitation guidelines for concentratedanimal feeding operations in response to Waterkeeperdecision; proposed rule. Federal Register71(126):37744–37787.Environmental Protection Agency (EPA). 2005.National emission inventory—ammonia emissionsfrom animal husbandry operations. Revised drareport. Online at p://p.epa.gov/EmisInventory/2002finalnei/documentation/nonpoint/nh3inventory_dra_042205.pdf, accessed onMarch 11, 2008.Environmental Protection Agency (EPA). 2003. NationalPollutant Discharge Elimination System permitregulation and effluent limitation guidelines andstandards for concentrated animal feeding operations(<strong>CAFOs</strong>). Federal Register 68(29):7176–7274.Environmental Protection Agency (EPA). 2002.Technical support document for the revisions to theNational Pollutant Discharge Elimination Systemregulations for concentrated animal feeding operations.Water Permits Division, Office <strong>of</strong> WastewaterManagement. Online at http://www.epa.gov/npdes/pubs/cafo_tech_support.pdf, accessed onMarch 11, 2008.Fan, A.M., and V.E. Steinberg. 1996. Health implications<strong>of</strong> nitrate and nitrite in drinking water: An updateon methemoglobinemia occurrence andreproductive and developmental toxicity. RegulatoryToxicology and Pharmacology 23:35–43Fanatico, A. 2003. Small-scale poultry processing.National Center for Appropriate Technology.Online at http://attra.ncat.org/attra-pub/PDF/poultryprocess.pdf, accessed on March 11, 2008.Ferm, M. 1998. Atmospheric ammonia and ammoniumtransport in Europe and critical loads: A review.Nutrient Cycling in Agroecosystems 51:5–17.Food and Agriculture Organization (FAO). 2007.e state <strong>of</strong> the world’s animal genetic Resources forfood and agriculture. United Nations.Foxman, B. 2002. Epidemiology <strong>of</strong> urinary tract infections:Incidence, morbidity, and economic costs.American Journal <strong>of</strong> Medicine 113(suppl. 1A):5S–13SGegner, L. 2004. Hog production alternatives. NationalCenter for Appropriate Technology. Online athttp://www.attra.org/attra-pub/PDF/hog.pdf, accessedon March 11, 2008.
74 <strong>Union</strong> <strong>of</strong> <strong>Concerned</strong> <strong>Scientists</strong>General Accounting Office (GAO). 2003. IncreasedEPA oversight will improve environmental programfor concentrated animal feeding operations. Reportno. GAO-03-285.General Accounting Office (GAO). 2000. Packersand stockyards program: Actions needed to improveinvestigations <strong>of</strong> competitive practices. Report no.GAO/RCED-00-242.Gilchrist, M.J., C. Greko, D.B. Wallinga, G.W. Beran,D.G. Riley, and P.S. orne. 2007. e potential role<strong>of</strong> concentrated animal feeding operations in infectiousdisease epidemics and antibiotic resistance.Environmental Health Perspectives 115(2):313–316.Goolsby, D.A., W.A. Battaglin, G.B. Lawrence, R.S.Artz, B.T. Aulenbach, R.P. Hooper, D.R. Keeney, andG.J. Stensland. 1999. Flux and sources <strong>of</strong> nutrients inthe Mississippi-Atchafalaya River Basin. Topic paperno. 3. Integrated Assessment on Hypoxia in the Gulf<strong>of</strong> Mexico, NOAA Coastal Ocean Program decisionanalysis series no. 17. National Oceanic and AtmosphericAdministration.Government Accountability Office (GAO). 2006.Packers and stockyards programs: Continuing problemswith GIPSA investigations <strong>of</strong> competitive practices.Report no. GAO-06-532T.Government Accountability Office (GAO). 2005.Livestock market reporting: USDA has taken somesteps to ensure quality, but additional efforts areneeded. Report no. GAO-06-202.Grain Inspection, Packers, and Stockyards Administration(GIPSA). 2002. Captive supply <strong>of</strong> cattle andGIPSA’s reporting <strong>of</strong> captive supply. U.S. Department<strong>of</strong> Agriculture.Green, C.F., S.G. Gibbs, P.M. Tarwater, L.C. Mota,and P.V. Scarpino. 2006. Bacterial plume emanatingfrom the air surrounding swine confinement operations.Journal <strong>of</strong> Occupational and EnvironmentalHygiene 3:9–15.Hayes, D.J., and H.H. Jensen. 2003. Lessons fromthe Danish ban on feed-grade antibiotics. Briefingpaper 03-BP 41. Center for Agricultural and RuralDevelopment, Iowa State University.Hedrick, P.W. 2002. Pathogen resistance and geneticvariation at MHC loci. Evolution 56(10):1902–1908.Heffernan, W.D. 2000. Concentration <strong>of</strong> ownershipand control in agriculture. In Hungry for pr<strong>of</strong>it: eagribusiness threat to farmers, food, and the environment,edited by F. Magd<strong>of</strong>f, J.B. Foster, and F.H. Buttel.New York: Monthly Review Press, 61–76.Hendrickson, M., and W. Heffernan. 2005. Concentration<strong>of</strong> agricultural markets, January 2005. Department<strong>of</strong> Rural Sociology, University <strong>of</strong> Missouri.Online at http://www.foodcircles.missouri.edu/CRJanuary05.pdf.Hendrickson, M., W. Heffernan. P H. Howard, andJ.B. Heffernan. 2001. Consolidation in food retailingand dairy: Implications for farmers and consumersin a global food system. National Farmers <strong>Union</strong>.Online at http://www.foodcircles.missouri.edu/whstudy2.pdfHeuer O.E., K. Pedersen, J.S. Andersen, and M.Madsen. 2002a. Vancomycin-resistant enterococci(VRE) in broiler flocks 5 years aer the avoparcinban. Microbial Drug Resistance 8(2):133–138.Heuer, O.E., K. Pedersen, L.B. Jensen, M. Madsen,and J.E. Olsen. 2002b. Persistence <strong>of</strong> vancomycinresistantenterococci (VRE) in broiler houses aerthe avoparcin ban. Microbial Drug Resistance8(4):355–361.Hicks, B. 2007. Beef cattle research update. OklahomaState University. Online at http://oaes.pss.okstate.edu/goodwell/Publications/Animal%20Science/OSU%20Beef%20Cattle%20Research%20Update%20June%202007.pdf, accessed onMarch 11, 2008.
<strong>CAFOs</strong> <strong>Uncovered</strong> 75Hill, J., E. Nelson, D. Tilman, S. Polasky, andD.Tiffany. 2006. Environmental, economic, and energeticcosts and benefits <strong>of</strong> biodiesel and ethanolbi<strong>of</strong>uels. Proceedings <strong>of</strong> the National Academy <strong>of</strong> Sciences103(30):11206–11210.Honeyman, M.S., and J.D. Harmon. 2003. Performance<strong>of</strong> finishing pigs in hoop structures and confinementduring winter and summer. Journal <strong>of</strong>Animal Science 81:1663–1670.Honeyman, M.S., J.D. Harmon, S.C. Shouse, W.D.Busby, and D.L. Maxwell. 2008. Feasibility <strong>of</strong> beddedhoop barns for market beef cattle in Iowa: Cattleperformance, bedding use, and environment.Applied Engineering in Agriculture 24(2):1–6.Honeyman, M.S., and W.B. Roush. 1999. Supplementation<strong>of</strong> mid-gestation swine grazing alfalfa.American Journal <strong>of</strong> Alternative Agriculture14(3):103–108.Hoshide, A.K., T.J. Dalton, and S.N. Smith. 2006.Pr<strong>of</strong>itability <strong>of</strong> coupled potato and dairy farms inMaine. Renewable Agriculture and Food Systems21(4):261–272.Hubbard, R.K., G.L. Newton, and G.M. Hill. 2003.Water quality and the grazing animal. Journal <strong>of</strong> AnimalScience 82(suppl. E):E255–E263.Huffman, R.L., and P.W. Westerman.1995. Estimatedseepage losses from established swine wastelagoons in the lower coastal plain <strong>of</strong> North Carolina.Transactions <strong>of</strong> the American Society <strong>of</strong> AgriculturalEngineers 38:449–453.Ikerd, J. 2004. Do we need large-scale confinementanimal feeding operations? Online at http://web.missouri.edu/~ikerdj/papers/Kellogg-Taho-<strong>CAFOs</strong>.htm, accessed on March 11, 2008.Inglis, G.D., T.A. McAllister, H.W. Busz, L.J. Yanke,D.W. Morck, M.E. Olson, and R.R. Read. 2005. Effects<strong>of</strong> subtherapeutic administration <strong>of</strong> antimicrobialagents to beef cattle on the prevalence <strong>of</strong>antimicrobial resistance in Campylobacter jejuni andCampylobacter hyointestinalis. Applied and EnvironmentalMicrobiology 71(7):3872–3881.Jacob, M.E., J.T. Fox, J.S. Drouillard, D.G. Renter,and T.G. Nagaraja. 2007. Effects <strong>of</strong> dried distillers’grain on fecal prevalence and growth <strong>of</strong> Escherichiacoli O157 in batch culture fermentations from cattle.Applied and Environmental Microbiology 74(1):38–43.Johnson, C.J., and B.C. Kross. 1990. Continuing importance<strong>of</strong> nitrate contamination <strong>of</strong> groundwaterand wells in rural areas. American Journal <strong>of</strong> IndustrialMedicine 18:449–456.Karr, J.D., W.J. Showers, J.W. Gilliam, and A.S. Andres.2001. Tracing nitrate transport and environmentalimpact from intensive swine farming usingdelta nitrogen-15. Journal <strong>of</strong> Environmental Quality30:1163–1175.Kellogg, R.L., C.H. Lander, D.C. M<strong>of</strong>fit, and N.Gollehon. 2000. Manure nutrients relative to the capacity<strong>of</strong> cropland and pastureland to assimilate nutrients:Spatial and temporal trends for the UnitedStates. Natural Resources Conservation Service,U.S. Department <strong>of</strong> Agriculture.Key, N., and W. McBride. 2003. Production contractsand productivity in the U.S. hog sector. AmericanJournal <strong>of</strong> Agricultural Economics 85(1):121–133.Khanna T., R. Friendship, C. Dewey, and J.S. Weese.2007. Methicillin-resistant Staphylococcus aureuscolonization in pigs and pig farmers. Veterinary Microbiology128(3-4):298–303, doi:10.1016/j.vetmic.2007.10.006.
76 <strong>Union</strong> <strong>of</strong> <strong>Concerned</strong> <strong>Scientists</strong>Klevens, R.M., M.A. Morrison, J. Nadle, S. Petit, K.Gershman, S. Ray, L.H. Harrison, R. Lynfield, G.Dumyati, J.M. Townes, A.S. Craig, E.R. Zell, G.E.Fosheim, L.K. McDougal, R.B. Carey, and S.K. Fridkin.2007. Invasive methicillin-resistant Staphylococcusaureus infections in the United States. Journal <strong>of</strong>the American Medical Association 298(15):1763–1771.Kliebenstein, J., B. Larson, M. Honeyman, and A.Penner. 2003. A comparison <strong>of</strong> production costs, returnsand pr<strong>of</strong>itability <strong>of</strong> swine finishing systems. Department<strong>of</strong> Economics Working Papers Series,Iowa State University.Knoeber, C.R., and W.N. urman. 1995. “Don’tcount your chickens . . . ”: Risk and risk shiing inthe broiler industry. American Journal <strong>of</strong> AgriculturalEconomics 77:486–496.Koike, S., I.G. Krapac, H.D. Oliver, A.C. Yannarell,J.C. Chee-Sanford, R.I. Aminov, and R.I. Mackie.2007. Monitoring and source tracking <strong>of</strong> tetracyclineresistance genes in lagoons and groundwateradjacent to swine production facilities over a 3-yearperiod. Applied and Environmental Microbiology73(15):4813–4823.Koopmans, G.F., W.J. Chardon, and R.W. McDowell.2007. Phosphorus movement and speciation in asandy soil pr<strong>of</strong>ile aer long-term animal manure applications.Journal <strong>of</strong> Environmental Quality 36:305–315.Krupa, S.V. 2003. Effects <strong>of</strong> atmospheric ammonia(NH3) on terrestrial vegetation: A review. EnvironmentalPollution 124:179–221.Kuhn, I., A. Iversen, M. Finn, C. Greko, L.G. Burman,A.R. Blanch, X. Vilanova, A. Manero, H. Taylor,J. Caplin, L. Domınguez, I.A. Herrero, M.A.Moreno, and R. Mollby. 2005. Occurrence and relatedness<strong>of</strong> vancomycin-resistant Enterococci in animals,humans, and the environment in differentEuropean regions. Applied and Environmental Microbiology71(9):5383–5390.Lambert, D.K., and W.W. Wilson. 2003. Valuing varietieswith imperfect output quality measurement.American Journal <strong>of</strong> Agricultural Economics 85(1):95–107.Landblom, D.G., W.W. Poland, B. Nelson, and E.Janzen. 2001. An economic analysis <strong>of</strong> swine rearingsystems for North Dakota. Annual report. DickinsonResearch Extension Center, North Dakota StateUniversity. Online at http://www.ag.ndsu.nodak.edu/dickinso/research/2000/swine00c.htm, accessed onMarch 11, 2008.Lawrence, J., D. Otto, and S. Meyer. 1997. Purchasingpatterns <strong>of</strong> hog producers: Implications for ruralagribusiness. Journal <strong>of</strong> Agribusiness 15:1–18.Levin, B.R., and C.T. Bergstrom. 2000. Bacteria aredifferent: Observations, interpretations, speculations,and opinions about the mechanisms <strong>of</strong> adaptiveevolution in prokaryotes. Proceedings <strong>of</strong> theNational Academy <strong>of</strong> Sciences 97(13):6981–6985.Liebig, M.A., J.A. Morgan, J.D. Reeder, B.H. Ellert,H.T. Gollany, and G.E. Schuman. 2005. Greenhousegas contributions and mitigation potential <strong>of</strong> agriculturalpractices in northwestern U.S.A. and westernCanada. Soil Tillage Research 83:25–52.Lipsitch, M., R.S. Singer, and B.R. Levin. 2002. Antibioticsin agriculture: When is it time to close thebarn door? Proceedings <strong>of</strong> the National Academy <strong>of</strong>Sciences 99(9):5752–5754.MacDonald, J.M., M.C. Ahearn, and D. Banker.2004. Organizational economics in agriculture policyanalysis. American Journal <strong>of</strong> Agricultural Economics86(3):744–749.MacDonald, J.M., M. Ollinger, K.E. Nelson, andC.R. Handy. 2000. Consolidation in U.S. meatpacking.Agricultural economic report no. 785. EconomicResearch Service, U.S. Department <strong>of</strong>Agriculture.
<strong>CAFOs</strong> <strong>Uncovered</strong> 77MacDonald, J., J. Perry, M. Ahearn, D. Banker, W.Chambers, C. Dimitri, N. Key, K. Nelson, and L.Southard. 2004. Contracts, markets, and prices: Organizingthe production and use <strong>of</strong> agricultural commodities.Agricultural economic report no. 837.Economic Research Service, U.S. Department <strong>of</strong>Agriculture.Mackie, R.I., P.G. Stroot, and V.H. Varel. 1998. Biochemicalidentification and biological origin <strong>of</strong> keyodor components in livestock waste. Journal <strong>of</strong> AnimalScience 76:1331–1342.Mallin, M.A. 2000. Impacts <strong>of</strong> industrial-scale swineand poultry production on rivers and estuaries.American Scientist 88:26–37.Mallin, M.A., J.M. Burkholder, M.R. McIver, G.C.Shank, H.B. Glasgow, Jr., B.W. Touchette, and J.Springer. 1997. Comparative effects <strong>of</strong> poultry andswine waste lagoon spills on the quality <strong>of</strong> receivingstreamwaters. Journal <strong>of</strong> Environmental Quality26:1622–1631.Mallin, M.A., and L.B. Cahoon. 2003. Industrializedanimal production: A major source <strong>of</strong> nutrient andmicrobial pollution to aquatic ecosystems. Populationand Environment 24(5):369–385.Mallin, M.A., and C.A. Corbett. 2006. Multiplehurricanes and different coastal systems: How hurricaneattributes determine the extent <strong>of</strong> environmentalimpacts. Estuaries and Coasts 29:1046–1061.Manges, A.R., S.P. Smith, B.J. Lau, C.J. Nuval, J.N.Eisenberg, P.S. Dietrich, and L.W. Riley. 2007. Retailmeat consumption and the acquisition <strong>of</strong> antimicrobialresistant Escherichia coli causing urinary tractinfections: A case-control study. FoodbornePathogens and Disease 4(4):419–431.Martin, A. 2006. Fowl run<strong>of</strong>f spurs fierce poultryfight: Amid suits over water pollution from manure,the chicken industry asks Congress for relief.Chicago Tribune, June 13. Online at http://www.redorbit.com/news/science/536438/fowl_run<strong>of</strong>f_spurs_fierce_poultry_fight_amid_suits_over_water/index.html, accessed on March 11, 2008.Mattocks, J. 2002. Pastured-raised poultry nutrition.Heifer International. Online at http://www.sustainablepoultry.ncat.org/downloads/chnutritionhpinew.pdf, accessed on March 11, 2008.May, G., W. Edwards, and J. Lawrence. 2003. Livestockenterprise budgets for Iowa: 2003. Iowa StateUniversity Extension.McBride, W.D., and N. Key. 2007. Characteristicsand production costs <strong>of</strong> U.S. hog farms, 2004. Economicinformation bulletin no. 32. Economic ResearchService, U.S. Department <strong>of</strong> Agriculture.McBride, W.D., and N. Key. 2003. Economic andstructural relationships in U.S. hog production.Agricultural economic report no. 818. ResourceEconomics Division, Economic Research Service,U.S. Department <strong>of</strong> Agriculture.McCubbin, D.R., B.J. Apelberg, S. Roe, and F. Divita,Jr. 2002. Livestock ammonia management and particulate-relatedhealth benefits. Environmental Scienceand Technology 36(6):1141–1146.Mead, P.S., L. Slutsker, V. Dietz, L.F. McCaig, J.S.Bresee, C. Shapiro, P.M. Griffin, and R.V. Tauxe.1999. Food-related illness and death in the UnitedStates. Emerging Infectious Diseases 5(5):607–625.Mellon, M., C. Benbrook, and K.L. Benbrook. 2002.Hogging it! Estimates <strong>of</strong> antimicrobial abuse in livestock.Cambridge, MA: <strong>Union</strong> <strong>of</strong> <strong>Concerned</strong><strong>Scientists</strong>.
78 <strong>Union</strong> <strong>of</strong> <strong>Concerned</strong> <strong>Scientists</strong>Molbak, K. 2005. Human health consequences <strong>of</strong>antimicrobial drug-resistant Salmonella and otherfoodborne pathogens. Clinical Infectious Diseases41:1613–1620.Mubarak, H., T.G. Johnson, and K.K. Miller. 1999.e impacts <strong>of</strong> animal feeding operations on ruralland values. Report R-99-02. College <strong>of</strong> Agriculture,Food and Natural Resources, University <strong>of</strong> Missouri–Columbia.Murray, B. 2003. Full economic feasibility assessment<strong>of</strong> the Smithfield Foods agreement: Environmentalmodeling and benefits components. Progress report.Animal and Poultry Waste Management Center,North Carolina State University. Online at http://www.p2pays.org/ref/32/31218/RTImodelingbenefits.pdf, accessed on March 11, 2008.National Agricultural Statistics Service (NASS).2008a. Quick stats. U.S. Department <strong>of</strong> Agriculture.Online at http://www.nass.usda.gov/Statistics_by_Subject/index.asp, accessed on March 11, 2008.National Agricultural Statistics Service (NASS).2008b. Agricultural prices. U.S. Department <strong>of</strong> Agriculture.Online at http://www.nass.usda.gov/Charts_and_Maps/Agricultural_Prices, accessed onMarch 11, 2008.National Agricultural Statistics Service (NASS).2007. Farms, land in farms, and livestock operations:2006 summary. U.S. Department <strong>of</strong>Agriculture.National Agricultural Statistics Service (NASS).2002a. Census <strong>of</strong> agriculture. U.S. Department <strong>of</strong>Agriculture. Online at http://www.agcensus.usda.gov/ Publications/2002/index.asp.National Agricultural Statistics Service (NASS).2002b. Agricultural atlas <strong>of</strong> the United States: Livestock,poultry, and other animals. U.S. Department<strong>of</strong> Agriculture. Online at http://www.nass.usda.gov/research/atlas02.National Atmospheric Deposition Program(NADP). 2003. 2002 annual summary. Data report2003-01. Champaign, IL: Illinois State Water Survey.National Research Council (NRC). 2004. Air emissionsfrom animal feeding operations: Current knowledge,future needs. National Academies <strong>of</strong> Science.Washington, DC: National Academies Press.National Research Council (NRC). 1999. e use <strong>of</strong>drugs in food animals: Benefits and risks. NationalAcademies <strong>of</strong> Science. Washington, DC: NationalAcademies Press.Natural Resources Conservation Service (NRCS).2008a. Arkansas 2008 state EQIP sign-up and applicationinformation. U.S. Department <strong>of</strong> Agriculture.Online at p://p-fc.sc.egov.usda.gov/AR/eqip/Arkansas_2008_State_EQIP_Policy.pdf, accessedon March 11, 2008.Natural Resources Conservation Service (NRCS).2008b. Iowa EQIP. U.S. Department <strong>of</strong> Agriculture.Online at http://www.ia.nrcs.usda.gov/programs/stateeqip.html, accessed on March 11, 2008.Natural Resources Conservation Service (NRCS).2008c. Environmental quality incentives program(EQIP): North Carolina. U.S. Department <strong>of</strong> Agriculture.Online at http://www.nc.nrcs.usda.gov/Programs/EQIP/index.html, accessed onMarch 11, 2008.Natural Resources Conservation Service (NRCS).2007a. Environmental quality incentives program:FY-2006 national livestock cost-share data. U.S. Department<strong>of</strong> Agriculture. Online at http://www.nrcs.usda.gov/programs/eqip/2006_Livestock/2006_national_livestock.pdf, accessed on March 11, 2008.Natural Resources Conservation Service (NRCS).2007b. Statewide EQIP program initiatives andfunding information. U.S. Department <strong>of</strong> Agriculture.Online at http://www.ca.nrcs.usda.gov/programs/eqip/2007/statepriorities2007.html,accessed on March 11, 2008.
<strong>CAFOs</strong> <strong>Uncovered</strong> 79Natural Resources Conservation Service (NRCS).2007c. Environmental quality incentives [sic] program(EQIP) California NRCS statewide waterquality initiative: Dairy-confined animal operationprogram—fiscal year 2007. U.S. Department <strong>of</strong>Agriculture. Online at p://p-fc.sc.egov.usda.gov/CA/programs/EQIP/2007/AFO_EQIP_FY07_PD.pdf,accessed on March 11, 2008.Natural Resources Conservation Service (NRCS).2007d. 2007 Arkansas annual report. U.S. Department<strong>of</strong> Agriculture. Online at p://p-fc.sc.egov.usda.gov/AR/pubs/07_annual_report.pdf, accessedon March 11, 2008.Natural Resources Conservation Service (NRCS).2007e. 2006 Environmental Quality Incentives Program.Online at http://www.ga.nrcs.usda.gov/programs/eqip06.html.Natural Resources Conservation Service (NRCS).2003. Environmental quality incentives program.Federal Register 68(104):32337–32355.Natural Resources Conservation Service (NRCS).2002. Risk assessment for the EQIP program. U.S.Department <strong>of</strong> Agriculture. Online at http://www.nrcs.usda.gov/programs/Env_Assess/EQIP/EQIP_RA_121002.pdf, accessed on March 11, 2008.Nikolich, M.P., G. Hong, N.B. Shoemaker, and A.A.Salyers. 1994. Evidence for natural horizontal transfer<strong>of</strong> tetQ between bacteria that normally colonizehumans and bacteria that normally colonize livestock.Applied and Environmental Microbiology60(9):3255–3260.Ollinger, M., J.M. MacDonald, and M. Madison.2005. Technological change and economies <strong>of</strong> scalein U.S. poultry processing. American Journal <strong>of</strong>Agricultural Economics 87(1):116–129.Ollinger, M., J. MacDonald, and M. Madison. 2000.Structural change in U.S. chicken and turkey slaughter.Agricultural economic report no. 787. EconomicResearch Service, U.S. Department <strong>of</strong> Agriculture.Phelps, C.E. 1989. Bug/drug resistance. MedicalCare 27:194–203.Phillips, I., M. Casewell, T. Cox, B. De Groot, C.Friis, R. Jones, C. Nightingale, R. Preston, and J.Waddell. 2004. Does the use <strong>of</strong> antibiotics in foodanimals pose a risk to human health? A critical review<strong>of</strong> published data. Journal <strong>of</strong> AntimicrobialChemotherapy 53:28–52.Pimentel, D., and M. Pimentel. Sustainability <strong>of</strong>meat-based and plant-based diets and the environment.American Journal <strong>of</strong> Clinical Nutrition78(suppl.):660S–663SRabalais, N.N., R.E. Turner, and W.J. Wiseman, Jr.2001. Hypoxia in the Gulf <strong>of</strong> Mexico. Journal <strong>of</strong> EnvironmentalQuality 30:320–329.Ramchandani, M., A.R. Manges, C. DebRoy, S.P.Smith, J.R. Johnson, L.W. Riley. 2005. Possible animalorigin <strong>of</strong> human-associated, multidrug-resistant,uropathogenic Escherichia coli. Clinical andInfectious Disease 40(2):251–257.Ray, D., D. De La Torre Ugarte, and K. Tiller. 2003.Rethinking US agricultural policy: Changing course tosecure farmer livelihoods worldwide. AgriculturalPolicy Analysis Center, University <strong>of</strong> Tennessee.Ribaudo, M., N. Gollehon, M. Aillery, J. Kaplan, R.Johansson, J. Agap<strong>of</strong>f, L. Christensen, V. Breneman,and M. Peters. 2003. Manure management for waterquality: Costs to animal feeding operations <strong>of</strong> applyingmanure nutrients to land. Agricultural economicreport no. 824. Economic Research Service, ResourceEconomics Division, U.S. Department <strong>of</strong>Agriculture.Rotz, C.A. 2004. Management to reduce nitrogenlosses in animal production. Journal <strong>of</strong> Animal Science82(suppl. E):E119–E137.Russelle, M.P., M.H. Entz, and A.J. Franzluebbers.2007. Reconsidering integrated crop–livestock systemsin North America. Agronomy Journal 99:325–334.
80 <strong>Union</strong> <strong>of</strong> <strong>Concerned</strong> <strong>Scientists</strong>Sapkota, A.R., F.C. Curriero, K.E. Gibson, and K.J.Schwab. 2007. Antibiotic-resistant Enterococci andfecal indicators in surface water and groundwaterimpacted by a concentrated swine feeding operation.Environmental Health Perspectives 115:1040–1045.Sayah, R.S., J.B. Kaneene, Y. Johnson, and R. Miller.2005. Patterns <strong>of</strong> antimicrobial resistance observedin Escherichia coli isolates obtained from domesticandwild-animal fecal samples, human septage, andsurface water. Applied and Environmental Microbiology17:1394–1404.Schingoethe, D.J. 2006. Utilization <strong>of</strong> DDGS by cattle.In Proceedings <strong>of</strong> the 27th Western NutritionConference, 61–74. Online at http://www.ddgs.umn.edu/articles-dairy/2006-Schingoethe-%20Utilization%20<strong>of</strong>%20DDGS%20by%20cattle.pdf,accessed on March 11, 2008.Shea, K.M. 2004. Nontherapeutic use <strong>of</strong> antimicrobialagents in animal agriculture: Implications forpediatrics. Pediatrics 114:862–868.Sheeder, S.A., J.A. Lynch, and J.Grimm. 2002. Modelingatmospheric nitrogen deposition and transportin the Chesapeake Bay watershed. Journal <strong>of</strong>Environmental Quality 31:1194–1206.Singh, K.V., G.M. Weinstock, and B.E. Murray.2002. An Enterococcus faecalis ABC homologue(Lsa) is required for the resistance <strong>of</strong> this species toclindamycin and quinupristin-dalfopristin. AntimicrobialAgents and Chemotherapy 46(6):1845–1850.Smith, D.L., A.D. Harris, J.A. Johnson, E.K. Silbergeld,and J.G. Morris, Jr. 2002. Animal antibioticuse has an early but important impact on the emergence<strong>of</strong> antibiotic resistance in human commensalbacteria. Proceedings <strong>of</strong> the National Academy <strong>of</strong> Sciences99(9):6434–6439.Soil Conservation Service. 1992. Agricultural wastecharacteristics. In Agricultural waste managementfield handbook. U.S. Department <strong>of</strong> Agriculture.Starmer, E. 2007. Personal communication with theauthor.Starmer, E., and T.A. Wise. 2007a. Living high on thehog: Factory farms, federal policy, and the structuraltransformation <strong>of</strong> swine production. Working paperno. 07-04. Global Development and EnvironmentInstitute, Tus University.Starmer, E., and T.A.Wise. 2007b. Feeding at thetrough: Industrial livestock firms saved $35 billionfrom low feed prices. Policy brief no. 07–03. GlobalDevelopment and Environment Institute, TusUniversity.Starmer, E., A. Witteman, and T.A. Wise. 2006.Feeding the factory farm: Implicit subsidies to thebroiler chicken industry. Working paper no. 06–03.Global Development and Environment Institute,Tus University.Swartz, M.H. 2002. Human diseases caused by foodbornepathogens <strong>of</strong> animal origin. Clinical InfectiousDiseases 34(suppl. 3):S111–S122.u, K. 2001. Public health concerns for neighbors<strong>of</strong> large-scale swine production operations. Journal<strong>of</strong> Agricultural Safety and Health 8(2):175–184.u, K., K. Donham, R. Ziegenhorn, S. Reynolds, P.orne, P. Subramanian, P. Whitten, and J. Stookesberry.1997. A control study <strong>of</strong> the physical andmental health <strong>of</strong> residents living near a large-scaleswine operation. Journal <strong>of</strong> Agricultural Safety andHealth 3(1):13–26.Tilman, D., K.G. Cassman, P.A. Matson, R. Naylor,and S. Polasky. 2002. Agricultural sustainability andintensive production practices. Nature 418:671–677.Toth, J.D., Z. Dou, J.D. Ferguson, D.T. Galligan, andC.F. Ramberg, Jr. 2006. Nitrogen- vs. phosphorusbaseddairy manure applications to field crops: Nitrateand phosphorus leaching and soil phosphorusaccumulation. Journal <strong>of</strong> Environmental Quality35:2302–2312.
<strong>CAFOs</strong> <strong>Uncovered</strong> 81Travers, K., and M. Barza. 2002. Morbidity <strong>of</strong> infectionscaused by antimicrobial-resistant bacteria.Clinical and Infectious Diseases 34(suppl. 3):S131–S134.U.S. Department <strong>of</strong> Agriculture (USDA). 2006.Grain Inspection, Packers and Stockyards Administration’smanagement and oversight <strong>of</strong> the packersand stockyards programs. Audit report no. 30601-01-Hy. Office <strong>of</strong> Inspector General, Northeast Region.Online at http://www.usda.gov/oig/webdocs/30601-01-HY.pdf.U.S. Geological Survey (USGS). 1995. Groundwater. Fact sheet FS-058-95. Online at http://water.usgs.gov/wid/html/GW.html, accessed onMarch 11, 2008.van Es, H.M., R.R. Schindelbeck, and W.E. Jokela.2004. Effect <strong>of</strong> manure application timing, crop, andsoil type on phosphorus leaching. Journal <strong>of</strong> EnvironmentalQuality 33:1070–1080.van Loo, I., X. Huijsdens, E. Tiemersma, A. de Neeling,N. van de Sande-Bruinsma, D. Beaujean, A.Voss, and J. Kluytmans. 2007. Emergence <strong>of</strong> methicillin-resistantStaphylococcus aureus <strong>of</strong> animal originin humans. Emerging Infectious Diseases13(12):1834–1839.Varma, J.K., K.D. Greene, J. Ovitt, T.J. Barrett, F.Medalla, and F.J. Angulo. 2005. Hospitalization andantimicrobial resistance in Salmonella outbreaks,1984–2002. Emerging Infectious Diseases 11(6):943–946.Varma, J.K., K. Mølbak, T.J. Barrett, J.L. Beebe, T.F.Jones, T. Rabatsky-Ehr, K.E. Smith, D.J. Vugia, H.-G.H. Chang, and F.J. Angulo. 2005. Antimicrobialresistantnontyphoidal Salmonella is associated withexcess bloodstream infections and hospitalizations.Journal <strong>of</strong> Infectious Diseases 191:554–561.Vila, C., J. Seddon, and H. Ellegren. 2005. Genes <strong>of</strong>domestic mammals augmented by backcrossingwith wild ancestors. Trends in Genetics 21(4):214–218.Vitousek, P.M., J.D. Aber, R.W. Howarth, G.E.Likens, P.A. Matson, D.W. Schindler, W.H.Schlesinger, and D.G. Tilman. 1997. Human alteration<strong>of</strong> the global nitrogen cycle: Sources and consequences.Ecological Applications 7(3):737–750.Volland, C, J. Zupancic, and J. Chappelle. 2003. Cost<strong>of</strong> remediation <strong>of</strong> nitrogen-contaminated soilsunder CAFO impoundments. Journal <strong>of</strong> HazardousSubstance Research 4:1–18.Vukina, T. 2004. Livestock production contracts,waste management and the environment. NorthCarolina State Economist, January/February.Walker, J.T., V.P. Aneja, and D.A. Dickey. 2000. Atmospherictransport and wet deposition on ammoniumin North Carolina. Atmospheric Environment34:3407–3418.Wang, Z., S. Cerrate, C. Coto, F. Yan, and P.W. Waldroup.2007. Effect <strong>of</strong> rapid and multiple changes inlevel <strong>of</strong> distillers dried grain with solubles (DDGS)in broiler diets on performance and carcass characteristics.International Journal <strong>of</strong> Poultry Science6(10):725–731.Weida, W.J. 2004a. Considering the rationales for factoryfarming. Presentation. Environmental HealthImpacts <strong>of</strong> <strong>CAFOs</strong>: Anticipating Hazards—Searchingfor Solutions, March 29, Iowa City, IA.Weida, W. 2004b. e CAFO: Implications for ruraleconomies in the US. Global Resource Action Centerfor the Environment (GRACE).Weldon, M.B., and K.C. Hornbuckle. 2006. Concentratedanimal feeding operations, row crops, andtheir relationship to nitrate in eastern Iowa rivers.Environmental Science and Technology 40:3168–3173.
82 <strong>Union</strong> <strong>of</strong> <strong>Concerned</strong> <strong>Scientists</strong>Whitney, M.H., G.C. Shurson, L.J. Johnston, D.M.Wulf, and B.C. Shanks. 2006. Growth performanceand carcass characteristics <strong>of</strong> grower-finisher pigsfed high-quality corn distillers dried grain with solublesoriginating from a modern Midwesternethanol plant. Journal <strong>of</strong> Animal Science 84:3356–3363.Wills, C., and D.R. Green. 1995. A genetic herd-immunitymodel for the maintenance <strong>of</strong> MHC polymorphism.Immunological Reviews 143:263–292.Wing, S., and S. Wolf. 2000. Intensive livestock operations,health, and quality <strong>of</strong> life among easternNorth Carolina residents. Environmental Health Perspectives108(3):233–238.World Health Organization (WHO). 2003. Impacts<strong>of</strong> antimicrobial growth promoter termination inDenmark: e WHO international review panel’sevaluation <strong>of</strong> the termination <strong>of</strong> the use <strong>of</strong> antimicrobialgrowth promoters in Denmark. Foulum, Denmark:Department <strong>of</strong> Communicable Diseases,Prevention and Eradication, Centre for AntimicrobialResistance in Foodborne Pathogens.Zhang, Q., O. Sahin, P.F. McDermott, and S. Payot.2006. Fitness <strong>of</strong> antimicrobial-resistant Campylobacterand Salmonella. Microbes and Infection 8:1972–1978.
<strong>CAFOs</strong> <strong>Uncovered</strong> 83GLOSSARYAFO (animal feeding operation)A facility or feedlot where animals are confined athigh densities and fed grain for at least 45 days ayear. Includes <strong>CAFOs</strong> as well as smaller operations.Alternative animal productionAnimal farming other than <strong>CAFOs</strong>, including sustainablepractices such as access to pasture andmaintaining animals in small enough numbers or atlow enough densities that the nearby land can safelyabsorb the animals’ manure.Animal unit (AU)A value for counting animals that allows comparisonbetween livestock species. For example, the EPAdefines one AU as equal to one beef cow <strong>of</strong> feedlotsize (typically at least 500 lb. when entering thefeedlot) or 2.5 hogs over 55 lb.BiogasCombustible fuel produced from the methane inCAFO manure.CAFO (confined animal feeding operation)A large facility with at least 1,000 animal units(AU). e EPA defines a CAFO as a facility thathouses at least 700 dairy cows, 1,000 beef cattle,2,500 hogs over 55 lb., 30,000 broiler chickens producingwet manure, 125,000 broiler chickens producingdry manure (litter), or 82,000 laying hens.e EPA also defines smaller operations as <strong>CAFOs</strong>if they discharge manure directly into waterways.Captive supplyLivestock owned or controlled (through contractarrangements) by a meat processor. High percentages<strong>of</strong> captive supply can reduce spot markets, potentiallyresulting in lower prices for producers thanin a healthy open market.Clean Water Acte federal law that regulates water pollution.CommensalOrganisms, such as bacteria, living in close associationwith other organisms in an arrangement that isbeneficial to one party and does not harm eitherparty. Some bacteria have a commensal relationshipwith their livestock hosts but are pathogenic tohumans.Commodity cropsCrops that are eligible to receive subsidies underTitle I <strong>of</strong> the federal farm bill, including corn,wheat, rice, soybeans, and cotton.Contract productionLivestock production based on an agreement tohouse, feed, and maintain animals supplied by ameat processor, then return the animals forprocessing when ready.Conversion efficiencye amount <strong>of</strong> feed needed to produce a unit <strong>of</strong> animalproduct.
84 <strong>Union</strong> <strong>of</strong> <strong>Concerned</strong> <strong>Scientists</strong>CR4 (or four-firm concentration)e amount <strong>of</strong> market share held by the four largestcompanies within an industry. A value higher than40 percent oen indicates a level <strong>of</strong> concentrationthat can interfere with free-market mechanisms.Critical loade maximum amount <strong>of</strong> nitrogen that can be depositedon a specific type <strong>of</strong> soil before damage(such as decreased biodiversity) will occur.Direct subsidyPayment to a business that reduces or compensatesfor production costs. Direct subsidies provided infederal farm bills have compensated grain farmerswhen market prices fell below the cost <strong>of</strong> production.Diversified farmFor the purposes <strong>of</strong> this report, a farm that raisesboth livestock and crops. More generally, a farmthat raises multiple crops or crops and livestock.DowngradientA point within the earth toward which water from ahigher reference point will flow. In the case <strong>of</strong>groundwater, the gradient may not be reflected in aslope at the surface.Dried distillers grains with solubles (DDGS)e residue that remains aer corn has been fermentedto produce ethanol. Can be used to supplementlivestock feed.Economies <strong>of</strong> scaleReductions in the cost <strong>of</strong> production that accruespecifically to large facilities or companies because1) their costs are distributed over many units <strong>of</strong> productionand 2) they may have access to efficiencyimprovingtechnologies that are not accessible tosmaller companies.EQIP (Environmental Quality Incentives Program)A federal program that pays farmers to preventsome <strong>of</strong> the environmental damage they cause.Eutrophicatione degradation <strong>of</strong> a body <strong>of</strong> water due to thegrowth and subsequent death <strong>of</strong> vegetation thatlowers oxygen content as it decays, killing fish andother aquatic organisms. Excess nitrogen or phosphorusfrom <strong>CAFOs</strong> oen produces eutrophicconditions.Externalized costsEnvironmental and health costs (related to pollutionor increased illness, for example) that are borne bysociety instead <strong>of</strong> the enterprise responsible.Farm billA package <strong>of</strong> federal laws that establishes U.S. agriculturalpolicy and is typically renewed everyfive years.FeedlotsConfined areas that are open to the air or partiallyro<strong>of</strong>ed and house thousands <strong>of</strong> beef cattle while theanimals are fattened on grain prior to slaughter.Finishing operationsFacilities where animals (beef cattle, hogs, broilerchickens) are fattened on grain prior to slaughter.Large finishing operations are usually <strong>CAFOs</strong>.ForagePlant material eaten by livestock, such as alfalfa andgrasses, stems, and leaves.Hoop barnsFacilities that house small to medium-sized inventories<strong>of</strong> hogs in structures with curved ro<strong>of</strong>s and haybedding, oen with access to the outdoors. A moresustainable method <strong>of</strong> hog production than <strong>CAFOs</strong>.HypoxiaIn the context <strong>of</strong> this report, a condition <strong>of</strong> low oxygencontent in bodies <strong>of</strong> water, oen caused byeutrophication. Hypoxia related to CAFO pollutionhas contributed to the production <strong>of</strong> “dead zones” inthe Gulf <strong>of</strong> Mexico and estuaries along the EastCoast that cannot support fish or shellfish.
<strong>CAFOs</strong> <strong>Uncovered</strong> 85Indicator speciesOrganisms such as bacteria whose presence suggeststhe simultaneous presence <strong>of</strong> other organisms thatmay be more difficult to detect.Indirect subsidySupport a business receives as a result <strong>of</strong> direct subsidiespaid to another party (e.g., low prices for suppliesresulting from subsidies paid to the supplier).InputsSupplies such as the feed, water, and antibiotics usedto produce livestock.Integration (or vertical integration/coordination)Ownership or control <strong>of</strong> multiple stages <strong>of</strong> productionby a single entity. In the context <strong>of</strong> animal production,meat processors oen control multipleproduction stages (e.g., breeding, rearing, finishing,slaughter, processing, distribution) through livestockownership or contract arrangements with ananimal producer (such as a CAFO).LagoonsOpen-air reservoirs that store liquid manure from<strong>CAFOs</strong>.Littere mixture <strong>of</strong> poultry manure, excess feed, andbedding material (such as wood chips) that buildsup in broiler facilities.LivestockAnimals raised for their meat, milk, and eggs. Forthe purposes <strong>of</strong> this report, the term includes chickensalong with cattle and pigs.Loan deficiency paymentsDirect subsidies paid by the federal government tocompensate commodity crop growers for low marketprices.Management intensive rotational grazing (MIRG)A method <strong>of</strong> raising livestock on pasture in whichthe animals are moved periodically so no single areais overgrazed. e rate <strong>of</strong> livestock movement isbased on the optimum grazing levels for different foragespecies under different environmental conditions.MorbidityDisease, or the incidence <strong>of</strong> disease, in a population.Multiplier effectAmplification <strong>of</strong> the value <strong>of</strong> money by its circulation(exchange) in the local community (throughthe purchase <strong>of</strong> goods and services). e effect increasesas circulation in the community increases.National Pollution Discharge Elimination System(NPDES)A pollution control program under the Clean WaterAct that 1) sets limits on the amount <strong>of</strong> specific pollutantsthat may be discharged from an individual sitesuch as a CAFO, 2) issues permits for pollution discharge,and 3) enforces monitoring and reporting requirements.e program is administered by the EPA.PM2.5Fine particulate matter (2.5 microns in diameter orless) that can cause respiratory disease when inhaled.Processinge slaughter <strong>of</strong> livestock, carcass dressing, andpackaging and distribution <strong>of</strong> the finished animalproducts.Spot marketA real-time open market for sales <strong>of</strong> animal products;functions as an alternative to contractproduction.SprayfieldLand that is close to a manure storage facility andfertilized with liquid manure distributed bysprayers.
86 <strong>Union</strong> <strong>of</strong> <strong>Concerned</strong> <strong>Scientists</strong>SubsidiesPayments that artificially support an industry by <strong>of</strong>fsettingits costs <strong>of</strong> production or compensating producersfor low market prices.TurbidityCondition in which the passage <strong>of</strong> light throughwater is impeded.UpgradientA point within the earth toward which water from alower reference point will not flow. In the case <strong>of</strong>groundwater, the gradient may not be reflected in aslope at the surface.Volatilizatione transformation <strong>of</strong> pollutants (such as the ammoniain manure) into their airborne form.Willingness to accept manure (WTAM)e percentage <strong>of</strong> farmers willing to accept manurefrom <strong>CAFOs</strong> or AFOs for application on their cropfields or pastures. Typical rates are between 5 and 20percent for farmers <strong>of</strong> commodity crops such ascorn, soybeans, and wheat.
The U.S. livestock industry—a large and vital part <strong>of</strong>agriculture in this country—has been undergoing adrastic change over the past several decades. Huge <strong>CAFOs</strong>(confined animal feeding operations) have become thepredominant method <strong>of</strong> raising livestock, and the crowdedconditions in these facilities have increased water and airpollution and other types <strong>of</strong> harm to public health and ruralcommunities.National HeadquartersTwo Brattle SquareCambridge, MA 02238-9105Phone: 617-547-5552Toll-Free: 800-666-8276Fax: 617-864-9405Washington, DC, Office1825 K Street NW, Suite 800Washington, DC 20006-1232Phone: 202-223-6133Fax: 202-223-6162West Coast Office2397 Shattuck Avenue, Suite 203Berkeley, CA 94704-1567Phone: 510-843-1872Fax: 510-843-3785Emailucs@ucsusa.org<strong>CAFOs</strong> are not the inevitable result <strong>of</strong> market forces.Instead, these unhealthy operations are largely the result <strong>of</strong>misguided public policy that can and should be changed.In this report, the <strong>Union</strong> <strong>of</strong> <strong>Concerned</strong> <strong>Scientists</strong>analyzes both the policies that have facilitated the growth<strong>of</strong> <strong>CAFOs</strong> and the enormous costs imposed on society by<strong>CAFOs</strong>. We also discuss sophisticated and efficientalternatives for producing affordable animal products,and <strong>of</strong>fer policy recommendations that can begin to leadus toward a healthy and sustainable food system.Webwww.ucsusa.orgPrinted on recycled paper usingsoy-based inks<strong>Union</strong> <strong>of</strong> <strong>Concerned</strong> <strong>Scientists</strong>Citizens and <strong>Scientists</strong> for Environmental Solutions