Probabilistic Model Checking for Systems Biology - PRISM
Probabilistic Model Checking for Systems Biology - PRISM
Probabilistic Model Checking for Systems Biology - PRISM

Create successful ePaper yourself
Turn your PDF publications into a flip-book with our unique Google optimized e-Paper software.
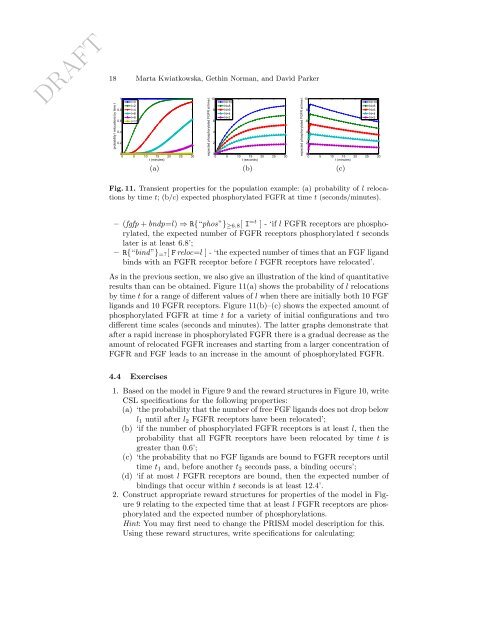
DRAFT18 Marta Kwiatkowska, Gethin Norman, and David Parkerprobability l relocations by time t10.80.60.40.2l=0l=2l=4l=6l=8l=1000 5 10 15 20 25 30t (minutes)(a)expected phosphorylated FGFR at time t108642N=10N=8N=6N=4N=200 5 10 15 20 25 30t (seconds)(b)expected phosphorylated FGFR at time t108642N=10N=8N=6N=4N=200 5 10 15 20 25 30t (minutes)(c)Fig. 11. Transient properties <strong>for</strong> the population example: (a) probability of l relocationsby time t; (b/c) expected phosphorylated FGFR at time t (seconds/minutes).– (fgfp + bndp=l) ⇒ R{“phos”} ≥6.8 [ I =t ] - ‘if l FGFR receptors are phosphorylated,the expected number of FGFR receptors phosphorylated t secondslater is at least 6.8’;– R{“bind”} =? [ F reloc=l ] - ‘the expected number of times that an FGF ligandbinds with an FGFR receptor be<strong>for</strong>e l FGFR receptors have relocated’.As in the previous section, we also give an illustration of the kind of quantitativeresults than can be obtained. Figure 11(a) shows the probability of l relocationsby time t <strong>for</strong> a range of different values of l when there are initially both 10 FGFligands and 10 FGFR receptors. Figure 11(b)–(c) shows the expected amount ofphosphorylated FGFR at time t <strong>for</strong> a variety of initial configurations and twodifferent time scales (seconds and minutes). The latter graphs demonstrate thatafter a rapid increase in phosphorylated FGFR there is a gradual decrease as theamount of relocated FGFR increases and starting from a larger concentration ofFGFR and FGF leads to an increase in the amount of phosphorylated FGFR.4.4 Exercises1. Based on the model in Figure 9 and the reward structures in Figure 10, writeCSL specifications <strong>for</strong> the following properties:(a) ‘the probability that the number of free FGF ligands does not drop belowl 1 until after l 2 FGFR receptors have been relocated’;(b) ‘if the number of phosphorylated FGFR receptors is at least l, then theprobability that all FGFR receptors have been relocated by time t isgreater than 0.6’;(c) ‘the probability that no FGF ligands are bound to FGFR receptors untiltime t 1 and, be<strong>for</strong>e another t 2 seconds pass, a binding occurs’;(d) ‘if at most l FGFR receptors are bound, then the expected number ofbindings that occur within t seconds is at least 12.4’.2. Construct appropriate reward structures <strong>for</strong> properties of the model in Figure9 relating to the expected time that at least l FGFR receptors are phosphorylatedand the expected number of phosphorylations.Hint: You may first need to change the <strong>PRISM</strong> model description <strong>for</strong> this.Using these reward structures, write specifications <strong>for</strong> calculating: