VEGIUM lab.pdf - Saratoga High School
VEGIUM lab.pdf - Saratoga High School
VEGIUM lab.pdf - Saratoga High School
- No tags were found...

Create successful ePaper yourself
Turn your PDF publications into a flip-book with our unique Google optimized e-Paper software.
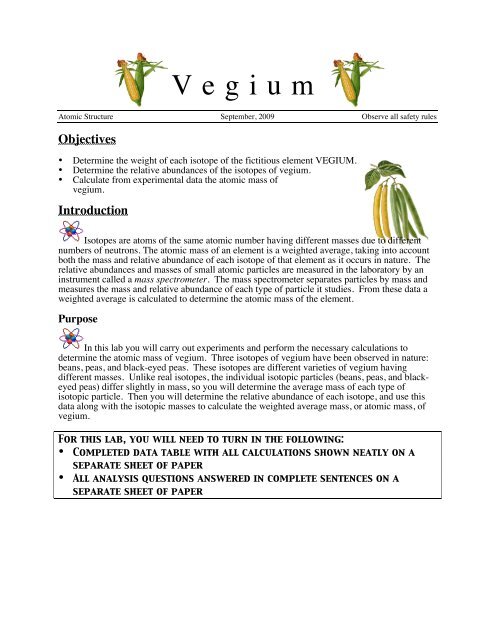
V e g i u mAtomic Structure September, 2009 Observe all safety rulesObjectives• Determine the weight of each isotope of the fictitious element <strong>VEGIUM</strong>.• Determine the relative abundances of the isotopes of vegium.• Calculate from experimental data the atomic mass ofvegium.IntroductionIsotopes are atoms of the same atomic number having different masses due to differentnumbers of neutrons. The atomic mass of an element is a weighted average, taking into accountboth the mass and relative abundance of each isotope of that element as it occurs in nature. Therelative abundances and masses of small atomic particles are measured in the <strong>lab</strong>oratory by aninstrument called a mass spectrometer. The mass spectrometer separates particles by mass andmeasures the mass and relative abundance of each type of particle it studies. From these data aweighted average is calculated to determine the atomic mass of the element.PurposeIn this <strong>lab</strong> you will carry out experiments and perform the necessary calculations todetermine the atomic mass of vegium. Three isotopes of vegium have been observed in nature:beans, peas, and black-eyed peas. These isotopes are different varieties of vegium havingdifferent masses. Unlike real isotopes, the individual isotopic particles (beans, peas, and blackeyedpeas) differ slightly in mass, so you will determine the average mass of each type ofisotopic particle. Then you will determine the relative abundance of each isotope, and use thisdata along with the isotopic masses to calculate the weighted average mass, or atomic mass, ofvegium.For this <strong>lab</strong>, you will need to turn in the following:• Completed data table with all calculations shown neatly on aseparate sheet of paper• All analysis questions answered in complete sentences on aseparate sheet of paper
Materials & Equipmenta sample of vegiumelectronic balance50mL beaker (to act as a weighing dish)Experimental ProcedureCarry out the following steps and record your results in yourdata table. Show all calculations neatly on a separate sheetof paper. Report all numbers to four significant figures.1. Weigh all the beans, then all the peas, then all the blackeyepeas. Record your data.2. Count all the beans, then all the peas, then all the black-eye peas. Record your data.3. Divide the total mass of each isotope by the number of each isotope to get the average massof each isotope.Note: In all rows except the average mass in the table, the numbers in the "total" column canbe obtained by adding the numbers across each row. Step 3 is an exception because it doesnot take into account the fact that there are different numbers of each type of particle. Ratherthan adding across, calculate this number using the same method you used to calculate theother numbers in step 3.4. Divide the number of each isotope by the total number of atoms, and multiply by 100 to getthe percent abundance of each isotope.5. Divide the percent abundance from step 4 by 100 to get therelative abundance of each isotope.6. Multiply the relative abundance from step 5 by the averagemass of each isotope to get the relative weight of each isotope.7. Add the relative weights to get the average mass of allparticles in vegium, the atomic mass.8. Return your first sample of vegium in its ziploc bag. Obtain asecond sample of vegium and do the experiments to determine itsatomic mass.
Data Table (a part of your Results section)Beans Peas B.E. Peas TotalTrial 1 Trial 2 Trial 1 Trial 2 Trial 1 Trial 2 Trial 1 Trial 2Mass of each isotopeNumber of each isotopeAverage mass of each "atom"Percent abundanceRelative abundanceRelative weightTrial 1: Sample #Trial 2: Sample #Atomic mass:Atomic mass:Analysis Questions:Use your experimental data and your knowledge of atomic structure and isotopes to answer thefollowing questions:1. Which of your data (in the table) can be measured and which had to be calculated?2. What is the difference between percent abundance and relative abundance?3. What is the result when you total the individual percent abundances? The individual relativeabundances?4. What is the difference between the average mass you calculated in step 3 and the relativeweight you calculated in step 6?5. Can atomic masses be calculated the way the total for row 3 was calculated? Explain whyyour results using this method would or would not be the same as those you obtained byusing step 7.6. Explain any differences between the atomic masses of your two samples of vegium. Explainwhy the differences would be smaller if larger samples were used.7. In what ways does this <strong>lab</strong> succeed in imitating “real-life” isotope calculations?In what ways does it do a poor job at simulating real-life?