Description of methods and sources for Albania - INSTAT
Description of methods and sources for Albania - INSTAT
Description of methods and sources for Albania - INSTAT
- No tags were found...
You also want an ePaper? Increase the reach of your titles
YUMPU automatically turns print PDFs into web optimized ePapers that Google loves.
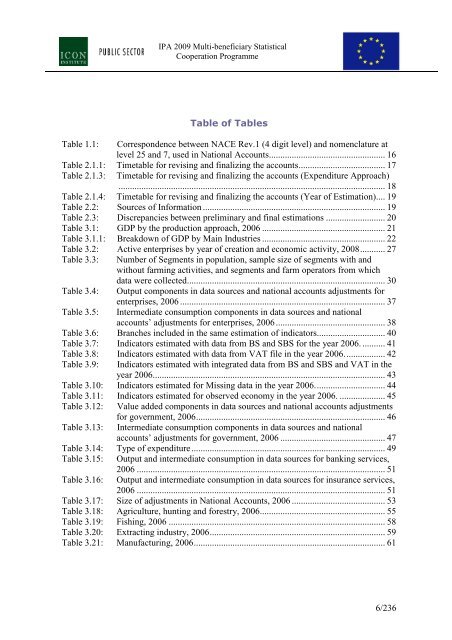
IPA 2009 Multi-beneficiary StatisticalCooperation ProgrammeTable <strong>of</strong> TablesTable 1.1: Correspondence between NACE Rev.1 (4 digit level) <strong>and</strong> nomenclature atlevel 25 <strong>and</strong> 7, used in National Accounts................................................... 16Table 2.1.1: Timetable <strong>for</strong> revising <strong>and</strong> finalizing the accounts...................................... 17Table 2.1.3:Timetable <strong>for</strong> revising <strong>and</strong> finalizing the accounts (Expenditure Approach)..................................................................................................................... 18Table 2.1.4: Timetable <strong>for</strong> revising <strong>and</strong> finalizing the accounts (Year <strong>of</strong> Estimation).... 19Table 2.2: Sources <strong>of</strong> In<strong>for</strong>mation ................................................................................ 19Table 2.3: Discrepancies between preliminary <strong>and</strong> final estimations .......................... 20Table 3.1: GDP by the production approach, 2006 ...................................................... 21Table 3.1.1: Breakdown <strong>of</strong> GDP by Main Industries ...................................................... 22Table 3.2: Active enterprises by year <strong>of</strong> creation <strong>and</strong> economic activity, 2008........... 27Table 3.3:Table 3.4:Table 3.5:Number <strong>of</strong> Segments in population, sample size <strong>of</strong> segments with <strong>and</strong>without farming activities, <strong>and</strong> segments <strong>and</strong> farm operators from whichdata were collected....................................................................................... 30Output components in data <strong>sources</strong> <strong>and</strong> national accounts adjustments <strong>for</strong>enterprises, 2006 .......................................................................................... 37Intermediate consumption components in data <strong>sources</strong> <strong>and</strong> nationalaccounts’ adjustments <strong>for</strong> enterprises, 2006................................................ 38Table 3.6: Branches included in the same estimation <strong>of</strong> indicators.............................. 40Table 3.7: Indicators estimated with data from BS <strong>and</strong> SBS <strong>for</strong> the year 2006. .......... 41Table 3.8: Indicators estimated with data from VAT file in the year 2006.................. 42Table 3.9: Indicators estimated with integrated data from BS <strong>and</strong> SBS <strong>and</strong> VAT in theyear 2006...................................................................................................... 43Table 3.10: Indicators estimated <strong>for</strong> Missing data in the year 2006............................... 44Table 3.11: Indicators estimated <strong>for</strong> observed economy in the year 2006. .................... 45Table 3.12: Value added components in data <strong>sources</strong> <strong>and</strong> national accounts adjustments<strong>for</strong> government, 2006................................................................................... 46Table 3.13: Intermediate consumption components in data <strong>sources</strong> <strong>and</strong> nationalaccounts’ adjustments <strong>for</strong> government, 2006 .............................................. 47Table 3.14: Type <strong>of</strong> expenditure..................................................................................... 49Table 3.15:Table 3.16:Output <strong>and</strong> intermediate consumption in data <strong>sources</strong> <strong>for</strong> banking services,2006 ............................................................................................................. 51Output <strong>and</strong> intermediate consumption in data <strong>sources</strong> <strong>for</strong> insurance services,2006 ............................................................................................................. 51Table 3.17: Size <strong>of</strong> adjustments in National Accounts, 2006 ......................................... 53Table 3.18: Agriculture, hunting <strong>and</strong> <strong>for</strong>estry, 2006....................................................... 55Table 3.19: Fishing, 2006 ............................................................................................... 58Table 3.20: Extracting industry, 2006............................................................................. 59Table 3.21: Manufacturing, 2006.................................................................................... 616/236


