Description of methods and sources for Albania - INSTAT
Description of methods and sources for Albania - INSTAT
Description of methods and sources for Albania - INSTAT
- No tags were found...
You also want an ePaper? Increase the reach of your titles
YUMPU automatically turns print PDFs into web optimized ePapers that Google loves.
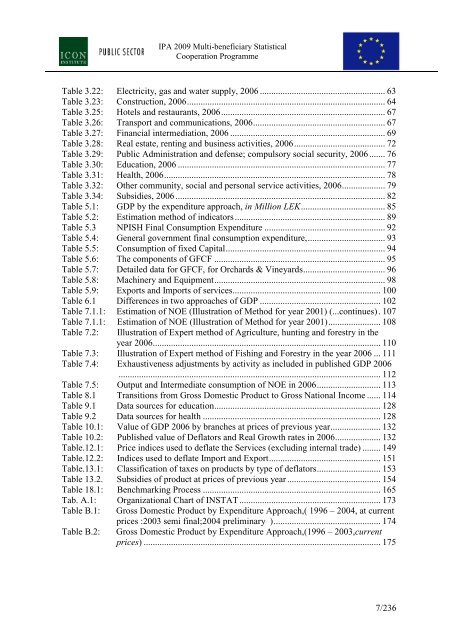
IPA 2009 Multi-beneficiary StatisticalCooperation ProgrammeTable 3.22: Electricity, gas <strong>and</strong> water supply, 2006 ....................................................... 63Table 3.23: Construction, 2006....................................................................................... 64Table 3.25: Hotels <strong>and</strong> restaurants, 2006........................................................................ 67Table 3.26: Transport <strong>and</strong> communications, 2006.......................................................... 67Table 3.27: Financial intermediation, 2006 .................................................................... 69Table 3.28: Real estate, renting <strong>and</strong> business activities, 2006........................................ 72Table 3.29: Public Administration <strong>and</strong> defense; compulsory social security, 2006....... 76Table 3.30: Education, 2006 ........................................................................................... 77Table 3.31: Health, 2006................................................................................................. 78Table 3.32: Other community, social <strong>and</strong> personal service activities, 2006................... 79Table 3.34: Subsidies, 2006 ............................................................................................ 82Table 5.1: GDP by the expenditure approach, in Million LEK..................................... 85Table 5.2: Estimation method <strong>of</strong> indicators.................................................................. 89Table 5.3 NPISH Final Consumption Expenditure ..................................................... 92Table 5.4: General government final consumption expenditure,.................................. 93Table 5.5: Consumption <strong>of</strong> fixed Capital...................................................................... 94Table 5.6: The components <strong>of</strong> GFCF ........................................................................... 95Table 5.7: Detailed data <strong>for</strong> GFCF, <strong>for</strong> Orchards & Vineyards.................................... 96Table 5.8: Machinery <strong>and</strong> Equipment........................................................................... 98Table 5.9: Exports <strong>and</strong> Imports <strong>of</strong> services................................................................. 100Table 6.1 Differences in two approaches <strong>of</strong> GDP ..................................................... 102Table 7.1.1: Estimation <strong>of</strong> NOE (Illustration <strong>of</strong> Method <strong>for</strong> year 2001) (...continues). 107Table 7.1.1: Estimation <strong>of</strong> NOE (Illustration <strong>of</strong> Method <strong>for</strong> year 2001)....................... 108Table 7.2:Illustration <strong>of</strong> Expert method <strong>of</strong> Agriculture, hunting <strong>and</strong> <strong>for</strong>estry in theyear 2006.................................................................................................... 110Table 7.3: Illustration <strong>of</strong> Expert method <strong>of</strong> Fishing <strong>and</strong> Forestry in the year 2006 ... 111Table 7.4: Exhaustiveness adjustments by activity as included in published GDP 2006................................................................................................................... 112Table 7.5: Output <strong>and</strong> Intermediate consumption <strong>of</strong> NOE in 2006............................ 113Table 8.1 Transitions from Gross Domestic Product to Gross National Income ...... 114Table 9.1 Data <strong>sources</strong> <strong>for</strong> education......................................................................... 128Table 9.2 Data <strong>sources</strong> <strong>for</strong> health .............................................................................. 128Table 10.1: Value <strong>of</strong> GDP 2006 by branches at prices <strong>of</strong> previous year...................... 132Table 10.2: Published value <strong>of</strong> Deflators <strong>and</strong> Real Growth rates in 2006.................... 132Table.12.1: Price indices used to deflate the Services (excluding internal trade) ........ 149Table.12.2: Indices used to deflate Import <strong>and</strong> Export................................................. 151Table.13.1: Classification <strong>of</strong> taxes on products by type <strong>of</strong> deflators............................ 153Table 13.2. Subsidies <strong>of</strong> product at prices <strong>of</strong> previous year ......................................... 154Table 18.1: Benchmarking Process .............................................................................. 165Tab. A.1: Organizational Chart <strong>of</strong> <strong>INSTAT</strong>.............................................................. 173Table B.1:Table B.2:Gross Domestic Product by Expenditure Approach,( 1996 – 2004, at currentprices :2003 semi final;2004 preliminary )............................................... 174Gross Domestic Product by Expenditure Approach,(1996 – 2003,currentprices) ........................................................................................................ 1757/236


