Microeconomics Cue Card - the Educator Login page!
Microeconomics Cue Card - the Educator Login page!
Microeconomics Cue Card - the Educator Login page!
- No tags were found...

You also want an ePaper? Increase the reach of your titles
YUMPU automatically turns print PDFs into web optimized ePapers that Google loves.
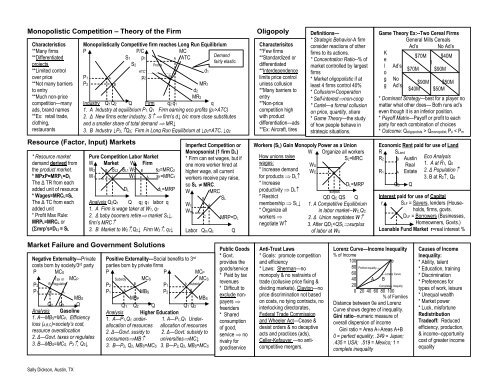
Monopolistic Competition – Theory of <strong>the</strong> FirmCharacteristics**Many firms**Differentiatedprojects**Limited controlover price**Not many barriersto entry**Much non-pricecompetition—manyads, brand names**Ex: retail trade,clothing,restaurantsResource (Factor, Input) Markets* Resource marketdemand derived from<strong>the</strong> product market.* MPxP=MRPL=DLThe Δ TR from eachadded unit of resource* Wages=MRCL=SLThe Δ TC from eachadded unit* Profit Max Rule:MRPL=MRCL or(mrp’s=DL) = SLMonopolistically Competitive firm reaches Long Run EquilibriumP P/C MCS1 p1 A ATCDemandfairly elastic.S2ProfitsATC1 _ _ _ _ _ _ _ _ _ _ _P1 A p2BP2 B MR1MR2Industry Q1 Q2 Q Firm q2 q1 q1. A Industry at equilibrium P1, Q1 Firm earning eco profits (p1>ATC)2. Δ New firms enter industry, S firm’s d↓ b/c more close substitutesand a smaller share of total demand MR↓3. B Industry ↓P2,Q2; Firm in Long Run Equilibrium at ↓p2=ATC, ↓q2Pure Competition Labor MarketW Market W FirmW2 B SL2 SL1 W2 B s2=MRC2W1 A W1 A s1=MRC1DLdL=MRPAnalysis Q2Q1 Q q2 q1 labor q1. A Firm is wage taker at W1, q12. Δ baby boomers retire market SL↓,firm’s MRC3. B Market to W2,Q2↓ Firm W2, q2↓d2d1Imperfect Competition orMonopsonist (1 firm DL)* Firm can set wages, but ifone more worker hired athigher wage, all currentworkers receive pay raise,so SL MRC.W MRCWcWmBCALabor Qm QcSLMRP=DLQOligopolyCharacterisitcs**Few firms**Standardized ordifferentiated**Interdependencelimits price controlunless collusion**Many barriers toentry**Non-pricecompetition highwith productdifferentiation—ads**Ex: Aircraft, tiresDefinitions—* Strategic Behavior-A firmconsider reactions of o<strong>the</strong>rfirms to its actions.* Concentration Ratio--% ofmarket controlled by largestfirms* Market oligopolistic if atleast 4 firms control 40%* Collusion=Cooperation* Self-interestnon-coop* Cartel—a formal collusionon price, quantity, share* Game Theory—<strong>the</strong> studyof how people behave instrategic situations.Workers (SL) Gain Monopoly Power as a UnionW Organize all workersSL=MRCHow unions raisewages:* Increase demandfor products DL* Increaseproductivity DL* Restrictmembership SL↓* Organize allworkers negotiate WWUWCAsurplusDL=MRPQD QC QS Q1. A Competitive Equilibriumin labor market--WC,QC2. Δ Union negotiates W3. After QDL Qmonopolist; Po < PmEconomic Rent paid for use of LandR SLandR2 B Austin Eco AnalysisReal 1. A at R1, Q0R1 A Estate 2. Δ Population3. B at R2, Q0Q0 QInterest paid for use of Capitalr SLF = Savers, lenders (Households,firms, govts.DLF = Borrowers (Businesses,Homeowners, Govts.)Loanable Fund Market r=real interest %Market Failure and Government SolutionsNegative Externality—Privatecosts born by society/3 rd partyP MCSTax or MCPP2B RegulationP1 C AMBSQ2 Q1 QAnalysis Gasoline1. A—MBS=MCP, Efficiencyloss (A,B,C)=society’s cost,resource overallocation2. Δ—Govt. taxes or regulates3. B—MBS=MCS, P2, Q2↓Positive Externality—Social benefits to 3 rdparties born by private firmsP P MCPSubsidy MCS MCSP2BP1A SubsidyP1AMBS P2BMBPMBSQ 1 Q2 Q Q1 Q2Analysis Higher Education1. A—P1,Q1, under- 1. A—P1,Q1 Underallocationof resources allocation of resources2. Δ—Govt. susidy to 2. Δ—Govt. subsidy toconsumersMB universitiesMC↓3. B—P2, Q2, MBS=MCS 3. B—P2,Q2, MBS=MCSPublic Goods* Govt.provides <strong>the</strong>goods/service* Paid by taxrevenues* Difficult toexclude nonpayersfreeriders* Sharedconsumptionof good,service norivalry forgood/serviceAnti-Trust Laws* Goals: promote competitionand efficiency* Laws: Sherman—nomonopoly & no restraints oftrade (collusive price fixing &dividing markets), Clayton—noprice discrimination not basedon costs, no tying contracts, nointerlocking directorates,Federal Trade Commissionand Wheeler Act—Cease &desist orders & no deceptiveacts and practices (ads),Celler-Kefauver —no anticompetitivemergers.Lorenz Curve—Income Inequality% of Income100 e80 Perfect equality60 Lorenz Curve40 A B20 Complete Inequlity0 20 40 60 80 100% of FamiliesDistance between 0e and LorenzCurve shows degree of inequality.Gini ratio--numeric measure ofoverall dispersion of incomeGini ratio = Area AAreas A+B0 = perfect equality; .249 = Japan;.435 = USA; .519 = Mexico; 1 =complete inequalityCauses of IncomeInequality:* Ability, talent* Education, training* Discrimination* Preferences fortypes of work, leisure* Unequal wealth* Market power* Luck, misfortuneRedistributionTradeoff: Reducedefficiency, production,& income--opportunitycost of greater incomeequalitySally Dickson, Austin, TX