2012 CAFR - Encina Wastewater Authority
2012 CAFR - Encina Wastewater Authority
2012 CAFR - Encina Wastewater Authority

Create successful ePaper yourself
Turn your PDF publications into a flip-book with our unique Google optimized e-Paper software.
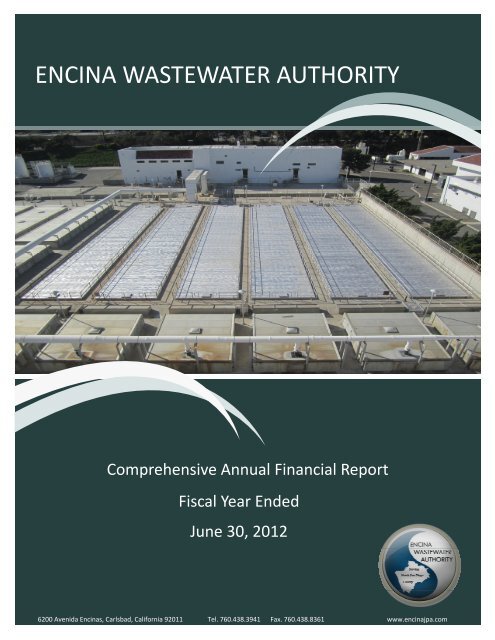
ENCINA WASTEWATER AUTHORITYComprehensive Annual Financial ReportFiscal Year EndedJune 30, <strong>2012</strong>6200 Avenida <strong>Encina</strong>s, Carlsbad, California 92011 Tel. 760.438.3941 Fax. 760.438.8361 www.encinajpa.com
ENCINA WASTEWATER AUTHORITYMission StatementAs an environmental leader, EWA provides sustainable andfiscally responsible wastewater services to the communitiesit serves while maximizing the use of alternative andrenewable resources.Proudly serving:City of CarlsbadCity of VistaCity of EncinitasLeucadia <strong>Wastewater</strong> DistrictBuena Sanitation DistrictVallecitos Water District
ENCINA WASTEWATER AUTHORITYComprehensive Annual Financial ReportFiscal Year Ended June 30, <strong>2012</strong>TABLE OF CONTENTSINTRODUCTORY SECTIONLetter of Transmittal ................................................................................................................. 1GFOA Certificate of Achievement.............................................................................. ...............8List of Officials .......................................................................................................................... .9Organization Chart .................................................................................................................. 10Service Area Map .................................................................................................................... 11FINANCIAL SECTIONIndependent Auditor’s Report ................................................................................................ 12Management’s Discussion and Analysis .................................................................................. 14Basic Financial Statements:Statements of Net Assets .................................................................................................. 19Statements of Revenues, Expenses, and Changes in Net Assets ...................................... 20Statements of Cash Flows ................................................................................................. 21Notes to Financial Statements ................................................................................................ 23Supplementary Information:Schedule of Investment in Capital Assets ......................................................................... 43Schedule of Operating Program Budget Performance............................. ............ ............44Schedule of Operating Expenses by Major Category.......................................... ..............45Summary Schedule of Operating Program Amount Due From/(To)Member Agencies .......................................................................................................... 46Detail Schedule of Operating Program Amount Due From/(To)Member Agencies ............................................................................................................. 47Schedule of Operating Program Expense Summary by Member Agency.............. ....... ...48Schedule of Operating Program Expense Summary by Cost Center……… ................... ……51Schedule of Changes in Net Assets Restricted - Capital Improvement Program .............. 55Schedule of Net Assets Restricted by Project - Capital Improvement Program ............... 56Schedule of Net Assets Restricted by Member Agency – CapitalImprovement Program .................................................................................................. 57Schedule of Continuing Capital Improvement Program Appropriations ......................... 58i
ENCINA WASTEWATER AUTHORITYComprehensive Annual Financial ReportFiscal Year Ended June 30, 201TABLE OF CONTENTS(Continued)STATISTICAL SECTIONOverview........................................................................................................ ...................60Net Assets ....................................................................................................... ..................61Changes in Net Assets...................................................................................... .................62Investment in Capital Assets..............................................................................................64Demographic and Economic Information........................................... ........... ...................65Facts and Figures............................................................................................. ..................66Full-time Equivalent Employees by Function.................................................. ..................67Operating Revenues and Expenses by Major Source and Use.......................... ................69Operating Revenues and Expenses by Member Agency................................. ..................70Operating Expenses per Million Gallons............................................ ............ ...................71ii
INTRODUCTORY SECTIONLetter of TransmittalGFOA Certificate of AchievementList Of OfficialsService Area Map
THIS PAGE IS INTENTIONALLY LEFT BLANK
ENCINA WASTEWATER AUTHORITY____________________________________________________________________________________A PUBLIC AGENCY6200 Avenida <strong>Encina</strong>sCarlsbad, CA 92011-1095Telephone (760) 438-3941Facsimile (760) 431-7493March 27, 2013The Board of Directors<strong>Encina</strong> <strong>Wastewater</strong> <strong>Authority</strong>6200 Avenida <strong>Encina</strong>sCarlsbad, CA 92011-1095We are pleased and proud to submit the Comprehensive Annual Financial Report (Report) of the <strong>Encina</strong><strong>Wastewater</strong> <strong>Authority</strong> (EWA) for the Fiscal Year ended June 30, <strong>2012</strong>. EWA staff remains committed toreach and maintain the highest possible standards in financial reporting now and in the future.EWA’s Certified Public Accounting firm of Leaf & Cole, LLP and accounting staff prepared the data in thisReport. White Nelson Diehl Evans, LLP independently audited the financial statements. Nonetheless,EWA bears the responsibility for the accuracy of all data presented in this Report. We, EWA’s chiefexecutive and financial officers, assume the responsibility for the Report’s completeness and fairness ofpresentation, including all disclosures. We affirm that, to the best of our knowledge and belief,information in this Report provides an accurate and fair representation of EWA’s financial position andthe status of its operations during the fiscal year ended June 30, <strong>2012</strong>. We believe that this Reportcontains all information and disclosures needed to clearly understand EWA’s Fiscal Year <strong>2012</strong> financialactivities.White Nelson Diehl Evans, LLP has issued an unqualified (“clean”) opinion on EWA’s financial statementsfor the fiscal year ended June 30, <strong>2012</strong>. The independent auditors report is located at the front of thefinancial section of this report.Management’s discussion and analysis (MD&A) immediately follows the independent auditors reportand provides a narrative introduction, overview, and analysis of the basic financial statements. MD&Acomplement this letter of transmittal and should be read in conjunction with it.BackgroundOn July 13, 1961 the City of Carlsbad and Vista Sanitation District entered into a Basic Agreement tocreate a joint powers authority (JPA) for the purpose of acquiring and constructing a joint sewer system.In 1963, the City of Vista incorporated and assumed membership in the JPA. Between 1964 and 1971,
ENCINA WASTEWATER AUTHORITYTRANSMITTAL LETTERFiscal Year Ended June 30, <strong>2012</strong>additional partners became members of the JPA including: the Buena Sanitation District (January 1964);the Vallecitos Water District (March 1965); and, the Leucadia <strong>Wastewater</strong> District and City of Encinitas(August 1971). These six member agencies remain EWA’s partners. There are no current plans to alterthe EWA purpose or membership.From 1963 to 1979, the County of San Diego managed the JPA. In 1963, the partners acquired a twentyfiveacre site in south Carlsbad near the confluence of the Pacific Ocean and <strong>Encina</strong>s Creek. The partnerscompleted construction of the <strong>Encina</strong> Water Pollution Control Facilities (EWPCF) including a 4.5 milliongallon per day (MGD) treatment plant and ocean outfall in 1965. By 1971, the Phase I expansionincreased treatment capacity to 6.75 MGD. In 1975, the Phase II expansion extended the <strong>Encina</strong> OceanOutfall and increased capacity to 13.75 MGD.The Leucadia <strong>Wastewater</strong> District managed the JPA from 1979 to 1988. During this time, the Phase IIIexpansion increased capacity to 22.5 MGD and wastewater treatment facilities were enhanced to meetstringent secondary treatment level standards. The Phase III Expansion Project also added criticaleffluent pumping facilities to the <strong>Encina</strong> Ocean Outfall system. In addition, cogeneration facilities weredesigned and placed in service to convert treatment process by-product methane and purchased naturalgas to the electricity and compressed air required for plant operations.In 1988, the partners amended the Basic Agreement through a Revised Basic Agreement (RBA). A shorttime later, JPA’s membership created an independent public entity called the <strong>Encina</strong> AdministrativeAgency (EAA) to operate, maintain, and administer the EWPCF, the Agua Hedionda Pump Station, andthe Buena Vista Pump Station. In 1991, EAA changed its name to the <strong>Encina</strong> <strong>Wastewater</strong> <strong>Authority</strong>.Completed in 1992, the Phase IV Expansion Project increased liquid treatment capacity to 36.0 MGD;enhanced solids treatment capacity to 38.0 MGD; provided interim wastewater flow equalizationfacilities to optimize treatment plant and Ocean Outfall operations; and, implemented extensive odorcontrol facilities to better serve the growing population of the service area. In 1995, EWA purchased thethirty-seven (37) acres adjacent to the southern boundary of the EWPCF now known, and referred to inthis Report, as the South Parcel.The Phase V Expansion Project commenced construction in September 2006 to meet anticipatedwastewater flows through 2025. The Phase V Project included replacement of existing dewateringequipment with two solid bowl decanter centrifuges and the installation of a triple-pass rotary drumheat dryer that produces Class A biosolids pellets. The Phase V Expansion was substantially complete inFebruary 2009 and dedicated in May 2009. The <strong>Authority</strong>’s Board of Directors took final acceptance ofthe project in December 2009. Permitted Phase V capacity is 43.3 MGD.Organization and Governance
ENCINA WASTEWATER AUTHORITYTRANSMITTAL LETTERFiscal Year Ended June 30, <strong>2012</strong>EWA is organized under the Joint Powers Act (California Government Code 6500 et seq). The <strong>Encina</strong>member agencies adopted the Revised Establishment Document (RED) on December 17, 1990 “to (a)retain EWA as the Operator/Administrator of the <strong>Encina</strong> Joint Powers and (b) reestablish theorganization, administration, rules and specific powers of the EWA.” The powers enumerated in theRED are exercised subject to the restrictions of the County Water District Law (California Water Code30000 et seq.). The RED provides for EWA’s governance by two elected officials appointed to EWA’sBoard of Directors at the discretion of each Member Agency.Members and officers of the Board of Directors on June 30, <strong>2012</strong> were:Member Agency Representative RepresentativeCity of Encinitas Kristin Gaspar, Vice Chair Mark MuirVallecitos Water District Darrell Gentry Jim PoltlCity of Vista & Buena Sanitation District Steve Gronke Judy Ritter, ChairLeucadia <strong>Wastewater</strong> District Elaine Sullivan Allan JuliussenCity of Carlsbad Keith Blackburn Ann KulchinCurrent ServicesThe EWA service area is comprised of approximately 123 square miles of coastal north San Diego Countywith a population of roughly 352,000. <strong>Wastewater</strong> is collected from the six districts and arrives at theEWPCF through gravity and force main piping manifolds. During the fiscal year ended June 30, <strong>2012</strong>, theEWPCF treated and disposed of 9.1 billion gallons of wastewater. EWA also enforces industrialpretreatment regulations in the <strong>Encina</strong> service area. Additionally, EWA produces tactical and businessplanning documents that ensure the <strong>Encina</strong> Joint Facilities continue to meet member agency needs incompliance with local, state, and federal regulations.The EWPCF include state-of-the art wastewater treatment and disposal facilities. Primary wastewatertreatment facilities include an influent junction structure, bar screens, grit and sedimentation tanks.Secondary wastewater treatment facilities include aeration basins, clarifiers and dissolved air floatationunits to dewater residual secondary biosolids. Anaerobic digesters stabilize solids generated by theprimary and secondary treatment. After 15-20 days in the digesters, wastewater solids are pumped tothe dewatering building where centrifuges spin the solids to remove excess water. The resultantproduct, which is approximately 23% solids, is considered Class B biosolids. Uses for Class B biosolidsare restricted by U.S. Environmental Protection Agency (EPA) regulations.With the Phase V expansion project, a triple-pass rotary drum heat dryer was placed in service.Biosolids from the centrifuges are pumped to the dryer and heated to approximately 200 degreesFahrenheit. The heat drying process produces pellets that are more than 90% solids and consideredClass A biosolids. The system normally operates five days per week and produces about 26 tons per day
ENCINA WASTEWATER AUTHORITYTRANSMITTAL LETTERFiscal Year Ended June 30, <strong>2012</strong>of Class A biosolids pellets. Class A biosolids have unrestricted use, which provides EWA with moreoptions for reuse of the product.In June 2009, the <strong>Authority</strong> entered into a five year agreement to sell 70% of Class A biosolids pelletmonthly production to CEMEX, Incorporated for use in its cement manufacturing process. During fiscalyear <strong>2012</strong>, 4938 wet tons of class A biosolids pellets were sold to CEMEX, which represent 78.7%percent of all Class A biosolids produced. The remaining Class A biosolids pellets were land applied orutilized in development of tier II markets.The Phase V expansion project also incorporated an upgrade to the <strong>Authority</strong>’s cogeneration facility,including four 1,000hp Caterpillar engines driving 750kW generators. The engines can be fueled byeither biogas or natural gas and recovered engine heat is used to heat the plant’s anaerobic digesters.These anaerobic digesters produce up to 600,000 cubic feet of digester gas daily to fuel the enginegenerators. This power system produces approximately sixty percent of electricity used at the EWPCF.Equalization basins optimize outfall operations and a bottom feed cylindrical dynasand filter producesTitle 22 compliant recycled water for use in irrigation, engine cooling, odor reduction, and other EWPCFprocesses. Treated wastewater not beneficially reused is discharged into the Pacific Ocean through the<strong>Encina</strong> Ocean Outfall pipe, which extends 1.5 miles offshore.EWA’s Laboratory conducts approximately 33,600 tests annually to assist in EWPCF source controloperations, monitor compliance with ocean discharge permits, and, provide contractual services to<strong>Encina</strong> member agencies for waste, recycled, potable and storm water quality testing.EWA also operates and maintains the Agua Hedionda, Buena Vista, and Raceway Basin Pump Stations,the Buena Sanitation District Facilities and the Carlsbad Water Reclamation Facility under contracts withtheir respective owner agencies.Major Service InitiativesEWA’s 2013 Business Plan serves as the road map to accomplish the Board of Director’s policy goals andestablishes the basis for EWA’s program, budgets, and other resource allocation determinations. TheBusiness Plan links the key issues identified by the Board of Directors with management strategies andobjectives to address those key issues. The key issues are:1. AB 32 required Greenhouse Gas emission reporting creates opportunities to demonstrateexcellence and innovation.2. Emerging regional water recycling goals present opportunities to leverage EWA’s uniqueposition to assist Member Agencies in achieving water reuse objectives.3. Creating and maintaining an “employer of choice” workplace requires values based onexcellence and innovation from EWA’s leadership team.
ENCINA WASTEWATER AUTHORITYTRANSMITTAL LETTERFiscal Year Ended June 30, <strong>2012</strong>4. Execution of EWA’s Comprehensive Asset Management Plan (CAMP) enables EWA and itsMember Agencies to effectively and efficiently deliver important public health services.5. Additional resource recovery and investment creates the opportunity for energy independence.6. Fiscal responsibility is a primary decision criterion.7. Continuous improvement and regional partnering sustain excellence.8. Public affairs outreach builds community understanding of EWA, its Mission, and its Vision.9. Heightened regulatory scrutiny presents opportunities and challenges that may impactoperation, maintenance, and administration of the <strong>Encina</strong> Joint Facilities.Future PlansEnergy and EmissionsThe Board of Directors received and filed an Energy and Emissions Strategic Plan (EESP) in April 2011.The EESP identifies improvement projects that will move the EWPCF toward energy independence.Technologies were presented into seventeen scenarios largely structured around key electricalgenerating technologies including internal combustion engine generators, fuel cells and solarphotovoltaic panels. An interactive model was developed to evaluate the scenario variables includingcost, self generation capacity, air emissions rate, and energy purchases. The scenarios that leveragedexisting assets and expanded engine based systems were generally more cost effective than fuel cell orsolar panel based scenarios.Elements of the top ranked scenario recommendation include energy efficiency measures, engineexhaust catalyst and biogas treatment, waste to energy process, additional absorption chiller capacity,and a fifth cogeneration engine. The year 2020 projected results from investing about $11,700,000 are:• Increasing self generated electricity from 52% of demand to about 95% of demand.• Increasing self generated total energy from 57% of demand to about 81% of demand.• Reducing carbon monoxide emissions from 97 ton/year to 27 ton/year.• Reducing operations and maintenance cost of related facilities from $3.2 million/year to $2.5million/year.Biosolids ManagementThe production of Class A biosolids pellets by the Phase V facilities gives the <strong>Authority</strong> opportunities forbeneficial reuse in markets that are not available to Class B biosolids products. EWA’s BiosolidsManagement Plan (BMP) establishes long-term strategies that ensure EWA successfully manages thereuse and disposal of Class A biosolids pellets and Class B biosolids cake as operating and/or marketconditions change over time.The BMP identifies two tiers of markets. Tier 1 was implemented in the last year and includes landfilldisposal, contract agriculture, and biofuels. The current agreement with CEMEX for purchase of Class A
ENCINA WASTEWATER AUTHORITYTRANSMITTAL LETTERFiscal Year Ended June 30, <strong>2012</strong>pellets as a biofuel is expected to provide estimated revenue of $42,000 in FY <strong>2012</strong>. Tier 2 uses includefertilizer distributors, soil blenders, specialty agriculture, local communities, and golf courses/turfmanagement. Product trials are underway.Finance and Human ResourcesInternal ControlsEWA’s management has established and maintains internal controls designed to ensure assets areadequately protected from loss, theft or misuse. The objectives of an internal control structure are toensure that transactions are executed in accordance with EWA policies and transactions are recordedproperly to allow preparation of financial statements in conformity with accounting principles generallyaccepted in the United States of America. The internal control structure is designed to providereasonable, but not absolute, assurance that these objectives are met.Budgetary ControlsEach year, EWA adopts annual Operating and Capital Improvement Program budgets in conformancewith the RBA. Each budget sets forth expenditure plans and the allocation of related expendituresamong the member agencies. The annual budgetary appropriation and control resolution limitsmanagement’s discretion to amend adopted budgets and contracts approved by the Board of Directors.Accounting MethodEWA operates on the accrual method of accounting. Funds are encumbered as each purchase isauthorized in conformance with EWA policy and procedure. Encumbered funds are not carried forwardwithout specific Board of Director’s authorization.Debt AdministrationEWA has no long-term debt nor has any contracts granting access to debt facilities of any kind.Cash ManagementEWA retrospectively bills member agencies and maintains appropriate cash reserves in accordance withthe Financial Reserve Policy adopted by Resolution No. 08-9. Any temporarily idle cash is invested inaccordance with the California Government Code and a conservative formal investment policy that isannually reviewed and adopted by the Board of Directors. During the year, all temporarily idle fundswere invested in the State of California’s Local Agency Investment Fund.Independent AuditEWA’s financial accounts and records are independently audited each year in conformance withrequirements prescribed by the State Controller for special districts and accounting principles generallyaccepted in the United States of America. EWA has met this requirement and the opinion and report ofits independent auditor, White Nelson Diehl Evans LLP, Certified Public Accountants, is included in thisReport.
ENCINA WASTEWATER AUTHORITYTRANSMITTAL LETTERFiscal Year Ended June 30, <strong>2012</strong>Human ResourcesFederal and state law, EWA ordinance and resolution establish employee wages, hours and workingconditions. EWA contributes to the California Public Employees Retirement System (CalPERS), a costsharingmultiple-public employee defined benefit pension plan. CalPERS provides retirement anddisability benefits, and death benefits to plan members and beneficiaries. CalPERS acts as a commoninvestment and administrative agent for participating public entities within the State of California. Inaddition, EWA offers employees a deferred compensation plan created in accordance with InternalRevenue Code Section 457. Participation is optional and EWA has no fiduciary responsibility for thedeferred compensation plan.Awards and AcknowledgementsThe Government Finance Officers Association (GFOA) awarded a Certificate of Achievement forExcellence in Financial Reporting to the <strong>Encina</strong> <strong>Wastewater</strong> <strong>Authority</strong> for its comprehensive annualfinancial report (<strong>CAFR</strong>) for the fiscal year ended June 30, 2011. In order to be awarded a Certificate ofAchievement, the government had to publish an easily readable and efficiently organized <strong>CAFR</strong> thatsatisfied both generally accepted accounting principles and applicable legal requirements. A Certificateof Achievement is valid for a period of one year only.Each of EWA’s sixty-five staff contributed to this report through unwavering dedication to theirprofession and by helping create an environment that stimulates and values teamwork. Together, weare a model of excellence and innovation. Additionally, a special note of appreciation goes to Mike Zizziand Joe Spence, Leaf & Cole, LLP, LeeAnn Warchol, EWA’s Administrative Services Manager, Sally Samra,EWA’s Accounting Technician, the Member Agency Finance Officers, and Harvey Schroeder, Partner,White Nelson Diehl Evans, LLP for their assistance and counsel. Finally, this Report would not bepossible without the continuing support of EWA’s Board of Directors whose leadership and commitmentserve as the foundation for our accomplishments.Kevin M. HardyGeneral ManagerMichael F. SteinlichtAssistant General Manager,Treasurer/Auditor
ENCINA WASTEWATER AUTHORITYList of OfficialsJune 30, <strong>2012</strong>Board of Directors and OfficersJudy Ritter, ChairKristin Gaspar, Vice ChairAnn KulchinKeith BlackburnMark MuirDarrell GentryAllan JuliussenElaine SullivanSteve GronkePaula ClowarMichael F. SteinlichtCity of Vista and Buena Sanitation DistrictCity of EncinitasCity of CarlsbadCity of CarlsbadCity of EncinitasVallecitos Water DistrictLeucadia <strong>Wastewater</strong> DistrictLeucadia <strong>Wastewater</strong> DistrictCity of Vista and Buena Sanitation DistrictSecretaryAssistant General Manager/Treasurer/AuditorManagementKevin M. Hardy, M.P.A., J.D.Michael F. SteinlichtDebra BiggsDuane Larson, P.E.Garry ParkerDoug CampbellLeeAnn WarcholGeneral ManagerAssistant General ManagerDirector of OperationsDirector of EngineeringDirector of General ServicesDirector of Environmental ComplianceAdministrative Services ManagerGeneral CounselGregory V. MoserProcopio Cory Hargreaves & Savitch, LLPFor additional information visit our website at www.encinajpa.com
<strong>Encina</strong> <strong>Wastewater</strong> <strong>Authority</strong>Recommend FY <strong>2012</strong> Positions: 65.5EWA Board of DirectorsOffice of the General ManagerDirector of Engineering Director of FinanceAssistantManagementAnalystPrincipalManagementAnalystAccountingTechnicianAssistantGeneral ManagerHuman ResourcesManagerAdministrativeAssistant [3]AssociateManagement AnalystEnvironmental Services GroupOperational Services GroupGeneral Services GroupDirector – Environmental ComplianceDirector – OperationsLaboratory ManagerChief Plant OperatorMaintenance ManagerChemist – [4]Shift Supervisor – [5]Fabrication TechnicianSource Control ManagerOperator – [13.5]Mech. Technician – [7]Inspector – [2]Resource Recovery ManagerMaintenance PlannerSafety & Training ManagerCogeneration SupervisorInventory SpecialistShift SupervisorSystems ManagerOperator – [3]Sys. Technician – [2]Elect. Technician – [3]
THIS PAGE IS INTENTIONALLY LEFT BLANK
Financial SectionIndependent Auditor’s ReportManagement’s Discussion and AnalysisBasic Financial StatementsNotes to Financial StatementsSupplementary Information
THIS PAGE IS INTENTIONALLY LEFT BLANK
INDEPENDENT AUDITORS' REPORTBoard of Directors<strong>Encina</strong> <strong>Wastewater</strong> <strong>Authority</strong>Carlsbad, CaliforniaWe have audited the accompanying basic financial statements of <strong>Encina</strong> <strong>Wastewater</strong> <strong>Authority</strong> as of and for theyear ended June 30, <strong>2012</strong>, as listed in the table of contents. These basic financial statements are theresponsibility of the <strong>Encina</strong> <strong>Wastewater</strong> <strong>Authority</strong>’s management. Our responsibility is to express an opinion onthese financial statements based on our audit. The financial statements of <strong>Encina</strong> <strong>Wastewater</strong> <strong>Authority</strong> as ofJune 30, 2011, were audited by other auditors whose report dated January 25, <strong>2012</strong>, expressed an unqualifiedopinion on those statements.We conducted our audit in accordance with auditing standards generally accepted in the United States ofAmerica, the State Controller’s Minimum Audit Requirements for California Special Districts, and the standardsapplicable to financial audits contained in Government Auditing Standards, issued by the Comptroller Generalof the United States. Those standards require that we plan and perform the audit to obtain reasonable assuranceabout whether the financial statements are free of material misstatement. An audit includes consideration ofinternal control over financial reporting as a basis for designing audit procedures that are appropriate in thecircumstances, but not for the purpose of expressing an opinion on the effectiveness of the <strong>Authority</strong>’s internalcontrol over financial reporting. Accordingly, we express no such opinion. An audit includes examining, on atest basis, evidence supporting the amounts and disclosures in the financial statements. An audit also includesassessing the accounting principles used and significant estimates made by management, as well as evaluatingthe overall financial statement presentation. We believe that our audit provides a reasonable basis for ouropinion.In our opinion, the basic financial statements referred to above present fairly, in all material respects, thefinancial position of the <strong>Encina</strong> <strong>Wastewater</strong> <strong>Authority</strong> as of June 30, <strong>2012</strong>, and the respective changes infinancial position and cash flows for the year then ended in conformity with accounting principles generallyaccepted in the United States of America.In accordance with Government Auditing Standards, we have also issued our report dated March 5, 2013 on ourconsideration of the <strong>Authority</strong>’s internal control over financial reporting and our tests of its compliance withcertain provisions of laws, regulations, contracts, grant agreements and other matters. The purpose of that reportis to describe the scope of our testing of internal control over financial reporting and compliance and the resultsof that testing, and not to provide an opinion on the internal control over financial reporting or on compliance.That report is an integral part of an audit performed in accordance with Government Auditing Standards andshould be considered in assessing the results of our audit.122965 Roosevelt Street, Carlsbad, CA 92008-2389 • Tel: 760.729.2343 • Fax: 760.729.2234Offices located in Orange and San Diego Counties
Accounting principles generally accepted in the United States of America require that the management’sdiscussion and analysis be presented to supplement the basic financial statements. Such information, althoughnot a part of the basic financial statements, is required by the Governmental Accounting Standards Board, whoconsiders it to be an essential part of financial reporting for placing the basic financial statements in anappropriate operational, economic, or historical context. We have applied certain limited procedures to therequired supplementary information in accordance with auditing standards generally accepted in the UnitedStates of America, which consisted of inquiries of management about the methods of preparing the informationand comparing the information for consistency with management’s responses to our inquiries, the basic financialstatements, and other knowledge we obtained during our audit of the basic financial statements. We do notexpress an opinion or provide any assurance on the information because the limited procedures do not provideus with sufficient evidence to express an opinion or provide any assurance.Our audit was conducted for the purpose of forming an opinion on the financial statements that collectivelycomprise the <strong>Encina</strong> <strong>Wastewater</strong> <strong>Authority</strong>’s financial statements as a whole. The introductory section,statistical section, schedule of operating program budget performance and schedule of continuing capitalimprovement program appropriations are presented for purposes of additional analysis and are not a requiredpart of the financial statements. The schedule of investment in capital assets, schedule of operating expenses bymajor category, summary schedule of operating program amount due from/(to) member agencies, detailschedule of operating program amount due from/(to) member agencies, schedule of operating program expensesummary by member agency, schedule of operating program expense summary by cost center, schedule ofchanges in net assets restricted-capital improvement program, schedule of net assets restricted by project –capital improvement program and schedule of net assets restricted by member agency- capital improvementprogram are the responsibility of management and were derived from and related directly to the underlyingaccounting and other records used to prepare the financial statements. The information has been subjected to theauditing procedures applied in the audit of the financial statements and certain additional procedures, includingcomparing and reconciling such information directly to the underlying accounting and other records used toprepare the financial statements or to the financial statements themselves, and other additional procedures inaccordance with auditing standards generally accepted in the United States of America. In our opinion, theinformation is fairly stated in all material respects in relation to the financial statements as a whole. Theintroductory section, statistical section, schedule of operating program budget performance and schedule ofcontinuing capital improvement program appropriations have not been subjected to the auditing proceduresapplied in the audit of the basic financial statements and, accordingly, we do not express an opinion or provideany assurance on them.March 5, 2013Carlsbad, California13
MANAGEMENT’S DISCUSSION AND ANALYSISOur discussion and analysis of the financial performance of <strong>Encina</strong> <strong>Wastewater</strong> <strong>Authority</strong> (the “<strong>Authority</strong>”)provides an overview of the <strong>Authority</strong>’s financial activities for the year ended June 30, <strong>2012</strong>. Please read it inconjunction with the <strong>Authority</strong>’s financial statements, which follow this section.Financial StatementsThis discussion and analysis provides an introduction and a b rief description of the <strong>Authority</strong>’s financialstatements, including the relationship of the statements to each other and the significant differences in theinformation they provide. The <strong>Authority</strong>’s financial statements include four components:• Statements of Net Assets• Statements of Revenues, Expenses and Changes in Net Assets• Statements of Cash Flows• Notes to the Financial StatementsThe Statements of Net Assets include all the <strong>Authority</strong>’s assets and liabilities, with the difference between thetwo reported as net assets. Net assets may be displayed in the categories:• Invested in Capital Assets, Net of Related Debt• Restricted Net Assets• Unrestricted Net AssetsThe Statements of Net Assets provide the basis for computing rate of return, evaluating the capital structure ofthe <strong>Authority</strong> and assessing the liquidity and financial flexibility of the <strong>Authority</strong>.The Statements of Revenues, Expenses and Changes in Net Assets present information which shows how the<strong>Authority</strong>’s net assets changed during the year. Revenues and expenses are recorded when the underlyingtransaction occurs, regardless of the timing of the related cash flows. The statement of revenues, expenses andchanges in net assets measures the success of the <strong>Authority</strong>’s operations and determines whether the <strong>Authority</strong>has recovered its costs through user fees and other charges.The Statements of Cash Flows provide information regarding the <strong>Authority</strong>’s cash receipts and cashdisbursements during the year. These statements may report cash activity in four categories:• Operations• Capital and related financing• Noncapital financing• InvestingThis statement differs from the Statement of Revenues, Expenses and Changes in Net Assets because thestatement of cash flows only accounts for transactions that result in cash receipts or cash disbursements.The Notes to the Financial Statements provide a description of the accounting policies used to prepare thefinancial statements and present material disclosures required by generally accepted accounting principles thatare not otherwise present in the financial statements.14
MANAGEMENT’S DISCUSSION AND ANALYSISFinancial Highlights• The <strong>Authority</strong>’s net assets decreased by $917,397 or 0.74 percent.• During the year the <strong>Authority</strong>’s total revenues increased by $38,290 or 0.3 percent, and total expensesincreased by $2,477,206 or 13.1 percent, as a result of increasing acquisitions and construction of capitalassets increasing depreciation expense and net loss on disposal of capital assets.Financial Analysis of the <strong>Authority</strong>Net AssetsThe following is a summary of the <strong>Authority</strong>’s statements of net assets at June 30:<strong>2012</strong> 2011 2010Assets :Current and other assets $ 12,605,406 $ 13,155,030 $ 12,707,464Capital assets 113,893,325 114,067,928 114,030,234Total Assets $ 126,498,731 $ 127,222,958 $ 126,737,698Liabilities :Noncurrent liabilities $ 1,244,380 $ 1,182,654 $ 956,483Other liabilities 1,737,049 1,605,605 939,738Total Liabilities $ 2,981,429 $ 2,788,259 $ 1,896,221Net Assets :Invested in capital assets $ 113,893,325 $ 114,067,928 $ 114,030,234Restricted for capital program 7,623,977 8,366,771 8,811,243Unrestricted 2,000,000 2,000,000 2,000,000Total Net Assets $ 123,517,302 $ 124,434,699 $ 124,841,477As you can see from the table above, net assets decreased by $917,397 from Fiscal Year 2011 to <strong>2012</strong>.Looking more carefully you will note that most of the change was in Net Assets Restricted, which decreased$742,794 in Fiscal Year <strong>2012</strong>. This decrease is the result of restricted capital being used for the purchase ofcapital assets in accordance with adopted accounting policies.Unrestricted Net Assets (those that can be used to finance day-to-day operations) were unchanged and, inaccordance with the <strong>Authority</strong>’s Financial Reserve Policy, has it assigned as follows:Operating Reserve $ 1,000,000 Unit I weighted ownershipInventory Reserve 850,000 Unit I weighted ownershipRemote Facility Reserve 150,000 Specific ownership$ 2,000,000Net Assets Invested in Capital Assets decreased $174,603 as the <strong>Authority</strong>’s depreciation expense and loss ondiscontinued construction projects exceeded the investment in capital assets.15
MANAGEMENT’S DISCUSSION AND ANALYSISFinancial Analysis of the <strong>Authority</strong> (Continued)Revenues, Expenses and Changes in Net AssetsThe following is a summary of the <strong>Authority</strong>’s revenues, expenses and changes in net assets for the FiscalYear ended June 30:<strong>2012</strong> 2011 2010Operating Revenues $ 12,649,520 $ 12,603,281 $ 13,148,783Nonoperating Revenues 16,791 24,740 39,688Total Revenues 12,666,311 12,628,021 13,188,471Depreciation Expense 7,899,653 6,259,835 5,986,307Other Operating Expense 12,649,520 12,603,281 13,148,783Nonoperating Expense 840,705 49,556 849,179Total Expenses 21,389,878 18,912,672 19,984,269Capital Contributions 7,806,170 5,877,873 4,657,893Change in Net Assets (917,397) (406,778) (2,137,905)Net Assets at Beginning of Year 124,434,699 124,841,477 126,979,382Net Assets at End of Year $ 123,517,302 $ 124,434,699 $ 124,841,477Operating Revenues in Fiscal Year <strong>2012</strong> were $12,649,520, an increase of 0.37% compared to the prior fiscalyear. Operating revenues represent assessments to member agencies for reimbursement of operatingexpenses, as well as revenues from laboratory services, insurance dividends and industrial environmentalcompliance activities. The fluctuation in operating revenues is primarily driven by operating expenses.Operating Expenses, before Depreciation, during Fiscal Year <strong>2012</strong>, totaled $12,649,520, an increase of 0.37%compared to Fiscal Year 2011.A loss on disposal of capital assets results when capital items are replaced before they are fully depreciated, orwhen capital funds have been used towards early development or construction of a c apital project, butmanagement has subsequently determined to discontinue the project or has determined there is no futureasset value to the funds expended and must expense the capital project in accordance with generally acceptedaccounting principles (GAAP). A loss on disposal of capital assets totaled $840,705 in Fiscal Year <strong>2012</strong> forprojects relating to the South Parcel Planning, the Grit and Screening Study, and various additional PlantRehabilitation Projects. I nvestment earnings totaled $16,791 in Fiscal Year <strong>2012</strong> and $24,740 in Fiscal Year2011, a decrease of ($7,949) which is primarily the result of a lower average interest earning rate within theinvestment account throughout Fiscal Year <strong>2012</strong>.Capital contributions totaled $7,806,170 in Fiscal Year <strong>2012</strong>, an increase of 32.81% from Fiscal Year 2011.Current year contributions principally supported the major plant rehabilitation program and the plannedasset replacement.16
MANAGEMENT’S DISCUSSION AND ANALYSISFinancial Analysis of the <strong>Authority</strong> (Continued)Revenues, Expenses and Changes in Net Assets (Continued)The Revised Basic Agreement (RBA) requires the member agencies to pay EWA only the actual costs ofmaterials and supplies used or purchased for the operation, maintenance, administration, or capitalimprovement of the Joint System, contracts let by EWA for the performance of budgeted operations andmaintenance work or capital improvement projects, and the salaries and wages of EWA employees.Accounts billed to member agencies for operating expenses are offset by other operating revenues andproceeds from the sale of capital assets. I n conformance with these limitations, EWA has never billedmember agencies for depreciation expense. However, the RBA ensures member agencies will provide thenecessary and appropriate funding for the replacement of EWA’s depreciable assets pursuant torecommendations by the Board of Directors and the Joint Advisory Committee. T hus, operating programlosses attributable to non-billable depreciation expenses are expected and thus do not reflect a deteriorationof EWA’s financial position.Capital AssetsCapital assets consist of the following at June 30:<strong>2012</strong> 2011 2010Capital Assets Not Being Depreciated:Land $ 3,598,173 $ 3,598,173 $ 3,598,173Construction in progress 4,054,328 3,509,708 1,658,195Total Capital Assets Not Being Depreciated 7,652,501 7,107,881 5,256,368Capital Assets Being Depreciated:Joint wastewater treatment (Unit I) 202,104,971 196,253,370 192,795,916Joint ocean outfall facilities (Unit J) 14,102,005 14,102,005 14,102,005Furnishings and office equipment 2,341,392 2,112,950 1,884,990Pump station facilities 6,749,955 6,581,287 6,433,788Flow metering system 299,059 299,059 299,059Total Capital Assets Being Depreciated 225,597,382 219,348,671 215,515,758Less: Accumulated Depreciation (119,356,558) (112,388,624) (106,741,892)Net Capital Assets Being Depreciated 106,240,824 106,960,047 108,773,866Net Capital Assets $ 113,893,325 $ 114,067,928 $ 114,030,234The net additions of capital assets being depreciated for Fiscal Year <strong>2012</strong> totaled $6,248,711. Capital assetadditions consisted of aeration pipeline infrastructure repairs, the replacement of a waste digester gas flaresystem, and rehabilitation of aging clarifiers.17
MANAGEMENT’S DISCUSSION AND ANALYSISEconomic Factors and Next Year’s BudgetAs a regional environmental agency providing wholesale treatment and disposal, industrial waste control,laboratory, and facility operations and maintenance services, EWA’s revenue, and therefore its budget, aresomewhat less sensitive to regional, national, and international economic trends than its six public entityMember Agencies. However, such trends do impact EWA’s expenses, and therefore its budget, when the priceof raw goods and labor increases the cost of the chemicals, energy, and construction projects required toeffectively operate, maintain, and administer the <strong>Encina</strong> Joint System.The recommended Fiscal Year 2013 operating budget is $13,537,021, an increase of approximately (4.5%) fromFiscal Year <strong>2012</strong>. The Fiscal Year 2013 budget reflects EWA’s continuing commitment to provide sustainable andfiscally responsible wastewater services to the communities it serves. Notable increases reflect: additionalsafety equipment ($120,000); outsourced professional financial management services ($102,000); NationalPollution Discharge Elimination System (NPDES) permit related charges passed through to <strong>Encina</strong> MemberAgencies from the State Water Resources Control Board ($93,000); and funding to support execution of FY2013Business Plan Objectives ($70,000). T he Fiscal Year 2013 operating budget amount includes $514,000 incontingency accounts to ensure the Member Agencies appropriate sufficient funding for EWA’s operations andlabor negotiations as part of their annual budgeting processes. The Fiscal Year 2013 Appropriation Resolution#<strong>2012</strong>-10 requires Board of Directors Approval to expend the recommended contingency account.The Capital Improvement Program for Fiscal Year 2013 is budgeted at $9,996,047, with an additional $4,030,721in appropriations continued from Fiscal Year <strong>2012</strong> for on-going projects, for a total Fiscal Year 2013 capitalbudget of $14,028,768.The Fiscal Year 2013 budgets reflect 65 authorized positions supporting EWA facilities and five regional facilitiestotaling more than $225 million in investments in regional clean water infrastructure. EWA employees’ provenability to provide sustainable wastewater services in a cost effective manner demonstrates their commitment tomaintain a workplace based on excellence and innovation.Contacting the <strong>Authority</strong>This financial report is designed to provide our citizens, customers, investors, and creditors with a generaloverview of the <strong>Authority</strong>’s finances and to demonstrate the <strong>Authority</strong>’s accountability for the money itreceives. If you have questions about this report or need additional financial information, contact the <strong>Encina</strong><strong>Wastewater</strong> <strong>Authority</strong> at (760) 438-3941 or via the internet at www.encinajpa.com.18
ENCINA WASTEWATER AUTHORITYSTATEMENTS OF NET ASSETSJUNE 30, <strong>2012</strong> AND 2011ASSETS<strong>2012</strong> 2011Current Assets: (Notes 1 and 2)Cash equivalents - operating $ 200,000 $ 200,000Member receivables - operating billed 2,178,817 1,948,301Amounts due from member agencies - operating unbilled 437,276 219,574Other receivables 12,386 46,598Prepaid expenses 61,797 69,532Inventory 1,198,897 1,196,245Total Current Assets 4,089,173 3,680,250Noncurrent Assets: (Notes 1, 2, 3 and 4)Cash equivalents - capital program 4,888,870 3,288,018Member receivables - capital program 3,622,831 4,543,989Member receivables - west interceptor pipeline - 1,638,733Interest receivable - capital program 4,532 4,040Total assets restricted for capital program 8,516,233 9,474,780Capital assets, net 113,893,325 114,067,928Total Noncurrent Assets 122,409,558 123,542,708TOTAL ASSETS $ 126,498,731 $ 127,222,958Current Liabilities: (Notes 1 and 5)Accounts payable - operating $ 687,886 $ 329,337Accounts payable - capital program 732,839 932,016Accrued liabilities 240,380 145,006Amounts due to member agencies - operating - 142,427Compensated absences 75,944 56,819Total Current Liabilities 1,737,049 1,605,605Noncurrent Liabilities: (Notes 1, 5 and 6)Retentions payable - capital program 159,417 175,993Net OPEB obligation 111,639 73,469Compensated absences 973,324 933,192Total Noncurrent Liabilities 1,244,380 1,182,654Total Liabilities 2,981,429 2,788,259Commitments and Contingencies (Notes 7 and 9)LIABILITIES AND NET ASSETSNet Assets: (Notes 1 and 4)Invested in capital assets 113,893,325 114,067,928Restricted for capital program 7,623,977 8,366,771Unrestricted 2,000,000 2,000,000Total Net Assets 123,517,302 124,434,699TOTAL LIABILITIES AND NET ASSETS $ 126,498,731 $ 127,222,958See accompanying independent auditors' report and notes to the financial statements.19
ENCINA WASTEWATER AUTHORITYSTATEMENTS OF REVENUES, EXPENSES AND CHANGES IN NET ASSETSFOR THE YEARS ENDED JUNE 30, <strong>2012</strong> AND 2011<strong>2012</strong> 2011Operating Revenues:Member agency assessments $ 12,383,770 $ 12,249,354Other operating revenues 265,750 353,927Total Operating Revenues 12,649,520 12,603,281Operating Expenses:Depreciation 7,899,653 6,259,835Unit I - EWPCF usage costs 5,904,095 5,809,849Unit I - EWPCF ownership costs 3,754,456 3,800,212Unit J - <strong>Encina</strong> ocean outfall 307,639 368,458Directors meetings 56,995 70,153Flow metering 272,903 274,072Source control 623,461 591,609Agua Hedionda pump station 247,392 201,953Buena Vista pump station 348,184 343,044Buena sanitation district facilities 215,234 314,303Carlsbad water reclamation facilities 772,107 703,253Raceway basin pump station 147,054 126,375Total Operating Expenses 20,549,173 18,863,116Operating (Loss) (7,899,653) (6,259,835)Nonoperating Revenues (Expenses):Investment & other capital income 16,791 24,740Net (loss) on disposal of capital assets (840,705) (49,556)Total Nonoperating Revenues (Expenses) (823,914) (24,816)(Loss) Before Contributions (8,723,567) (6,284,651)Capital contributions 7,806,170 5,877,873Change in Net Assets (917,397) (406,778)Total Net Assets at Beginning of Year 124,434,699 124,841,477TOTAL NET ASSETS AT END OF YEAR $ 123,517,302 $ 124,434,699See accompanying independent auditors' report and notes to the financial statements.20
ENCINA WASTEWATER AUTHORITYSTATEMENTS OF CASH FLOWSFOR THE YEARS ENDED JUNE 30, <strong>2012</strong> AND 2011<strong>2012</strong> 2011Cash Flows From Operating Activities:Receipts from Member Agencies $ 11,793,125 $ 12,136,295Cash received from other operating activities 299,962 362,225Cash payments to suppliers for goods and services (7,020,644) (7,432,075)Cash payments to employees for services (5,072,443) (5,066,445)Net Cash Provided by (Used in) Operating Activities - -Cash Flows From Capital and Related Financing Activities:Acquisition and construction of capital assets (8,582,331) (6,171,092)Capital contributions 10,166,884 2,825,854Net Cash Provided by (Used in) Capitaland Related Financing Activities 1,584,553 (3,345,238)Cash Flows From Investing Activities:Investment income 16,299 29,783Net Cash Provided by Investing Activities 16,299 29,783Net Increase (Decrease) in Cash and Cash Equivalents 1,600,852 (3,315,455)Cash and Cash Equivalents at Beginning of Year 3,488,018 6,803,473CASH AND CASH EQUIVALENTS AT END OF YEAR $ 5,088,870 $ 3,488,018See accompanying independent auditors' report and notes to the financial statements.21
ENCINA WASTEWATER AUTHORITYSTATEMENTS OF CASH FLOWS (CONTINUED)FOR THE YEARS ENDED JUNE 30, <strong>2012</strong> AND 2011<strong>2012</strong> 2011Reconciliation of Operating (Loss) to NetCash Used in Operating Activities:Operating (loss) $ (7,899,653) $ (6,259,835)Adjustments to reconcile operating (loss)to net cash provided by (used in) operating activities:Depreciation 7,899,653 6,259,835Change in current assets and liabilities:Member receivables - operating billed (230,516) (85,823)Amounts due from member agencies - operating unbilled (217,702) (89,293)Other receivables 34,212 8,298Prepaid expenses 7,735 6,426Inventory (2,652) (15,330)Accounts payable - operating 358,549 36,869Accrued liabilities 95,374 (3,633)Amounts due to member agencies - operating (142,427) 62,057Net OPEB obligation 38,170 37,206Compensated absences 59,257 43,223Net Cash Provided by (Used In) Operating Activities $ - $ -Cash and Cash Equivalents:Financial Statement Classification:Cash and cash equivalents $ 200,000 $ 200,000Restricted cash and cash equivalents 4,888,870 3,288,018Total Cash and Cash Equivalents $ 5,088,870 $ 3,488,018See accompanying independent auditors' report and notes to the financial statements.22
ENCINA WASTEWATER AUTHORITYNOTES TO FINANCIAL STATEMENTSJUNE 30, <strong>2012</strong> AND 2011Note 1 - Organization and Significant Accounting Policies:OrganizationOn July 13, 1961, the Vista Sanitation District and the City of Carlsbad entered into a joint exercise of poweragreement for a joint sewerage system. This “basic agreement” provided for the establishment, construction,operation, and maintenance of facilities for the transmission, treatment, and disposal of wastewater.By virtue of subsequent amendments and supplements to this basic agreement, Leucadia <strong>Wastewater</strong>District, Buena Sanitation District, Vallecitos Water District, and the City of Encinitas also became participantsin the facility. The Vista Sanitation District was dissolved in September 1983 and its functions were assumedby the City of Vista. On December 17, 1990, the basic agreement and supplemental was amended and rewritten.Leucadia <strong>Wastewater</strong> District (District) was previously the operator and administrator of the facility and wasresponsible for the management, maintenance, and operations of the joint system. A Revised EstablishedDocument was entered into on August 1, 1988 creating the <strong>Encina</strong> Administrative Agency. The Agency wasassigned the duties previously performed by the District. On December 11, 1991, the Agency changed itsname to <strong>Encina</strong> <strong>Wastewater</strong> <strong>Authority</strong> (<strong>Authority</strong>).The criteria used in determining the scope of the reporting entity are based on the provisions of GASBStatement 14, as amended by GASB Statement 39. Th e <strong>Authority</strong> is the primary government unit.Component units are those entities which are financially accountable to the primary government, eitherbecause the <strong>Authority</strong> appoints a voting majority of the component unit’s board, or because the componentunit will provide a financial benefit or impose a fin ancial burden on the <strong>Authority</strong>. The <strong>Authority</strong> has nocomponent units.Significant Accounting PoliciesA summary of the <strong>Authority</strong>’s significant accounting policies consistently applied in the preparation of theaccompanying financial statements follows:Method of AccountingThe <strong>Authority</strong> utilizes accounting principles appropriate for an enterprise fund to record its activities.Accordingly, the statements of net assets and the statements of revenues, expenses and changes in net assetshave been prepared using the economic resources measurement focus and the accrual basis of accounting.The <strong>Authority</strong> has not elected to apply the option allowed in Paragraph 7 of the Governmental AccountingStandards Board (GASB) Statement No. 20, “Accounting and Financial Reporting for Proprietary Activities”and as a consequence will continue to apply GASB statements and interpretations.See accompanying independent auditors’ report.23
ENCINA WASTEWATER AUTHORITYNOTES TO FINANCIAL STATEMENTSJUNE 30, <strong>2012</strong> AND 2011Note 1 - Organization and Significant Accounting Policies: (Continued)Significant Accounting Policies (Continued)EstimatesThe preparation of financial statements in conformity with accounting principles generally accepted in theUnited States of America requires management to make estimates and assumptions that affect the reportedamounts of assets and liabilities and disclosure of contingent assets and liabilities at the date of the financialstatements and the reported amounts of revenues and expenses during the reporting period. Actual resultscould differ from those estimates.Revenue RecognitionThe <strong>Authority</strong> recognizes revenues from wastewater treatment services and other fees when they areearned. Operating activities generally result from providing services and producing and delivering goods. Assuch, the <strong>Authority</strong> considers fees received from sewer services and other fees to be operating revenues.InvestmentsInvestments are stated at their fair value which represents the quoted or stated market value. Investmentsthat are not traded on a market, such as investments in external pools, are valued based on the stated fairvalue as represented by the external pool.Allowance for Doubtful AccountsManagement believes that all receivables were fully collectible; therefore no allowance for doubtful accountswas recorded as of June 30, <strong>2012</strong> and 2011.InventoryInventory consists primarily of materials used in the construction and maintenance of capital assets and isvalued at weighted average cost using the first-in, first-out (FIFO) method.Capital AssetsCapital assets purchased or acquired with a cost exceeding $2,000 and an estimated useful life of more thanone year are reported at historical cost. Contributed assets are recorded at fair market value as of the datereceived. A dditions, improvements and other capital outlays that significantly extend the useful life of anasset are capitalized. Other costs incurred for repairs and maintenance are expensed as incurred.Depreciation is calculated on the straight-line method over the following estimated useful lives:See accompanying independent auditors’ report.24
ENCINA WASTEWATER AUTHORITYNOTES TO FINANCIAL STATEMENTSJUNE 30, <strong>2012</strong> AND 2011Note 1 - Organization and Significant Accounting Policies: (Continued)Significant Accounting Policies (Continued)Capital Assets (Continued)Joint wastewater treatment (Unit I)Joint ocean outfall facilities (Unit J)Furnishings and office equipmentPump station facilitiesFlow metering system7 - 40 years25 - 75 years5 - 7 years7 - 40 years10 yearsDepreciation totaled $7,899,653 and $6,259,835 for the years ended June 30, <strong>2012</strong> and 2011, respectively.Classification of LiabilitiesCertain liabilities which are currently payable have been classified as noncurrent because they will be fundedfrom restricted assets.Compensated AbsencesAccumulated unpaid vacation and sick leave totaling $1,049,268 and $990,011 is accrued when incurred andincluded in noncurrent liabilities at June 30, <strong>2012</strong> and 2011, respectively.Risk ManagementThe <strong>Authority</strong> is exposed to various risks of loss related to torts; theft of, damage to, and destruction ofassets; errors and omissions; injuries to employees; and natural disasters. The <strong>Authority</strong> is a member of theCalifornia Sanitation Risk Management <strong>Authority</strong> (CSRMA), a public entity risk pool. The <strong>Authority</strong> pays adeposit to cover estimated losses for a fiscal year. CSRMA also serves as a joint insurance purchasing entitywith respect to certain coverage. Ba sed on pool performance, CSRMA makes additional assessments orrefunds excess pool deposits to its members based on a retrospective risk rating adjustment.The <strong>Authority</strong>’s participation in the general liability program of CSRMA provides coverage up to $15,500,000with a $25,000 deductible. Excess insurance of $20,000,000 has been purchased. The <strong>Authority</strong>’sparticipation in the workers’ compensation program of CSRMA provides coverage up to $1,000,000 with nodeductible. CSRMA has a self-insured retention of $750,000 and excess insurance for workers’ compensationstatutory limits have been purchased.The <strong>Authority</strong> pays annual premiums for this coverage. They are subject to retrospective adjustments basedon claims experienced. The nature and amounts of the adjustments cannot be estimated and are charged toexpense as invoiced. The <strong>Authority</strong>’s insurance expense and workers compensation insurance expense was$273,799 and $301,413, for the years ended June 30, <strong>2012</strong> and 2011, respectively. There were no instancesin the past three years where a settlement exceeded the <strong>Authority</strong>’s coverage.See accompanying independent auditors’ report.25
ENCINA WASTEWATER AUTHORITYNOTES TO FINANCIAL STATEMENTSJUNE 30, <strong>2012</strong> AND 2011Note 1 - Organization and Significant Accounting Policies: (Continued)Significant Accounting Policies (Continued)Allocation of CostsExpenses are allocated to the various member agencies in accordance with their capacity ownershippercentages of the respective units, on usage (strength and/or wastewater flow), on direct costs, and basedupon other special allocations, as provided for in the annual budgetary process.ReservesIn accordance with the Revised Basic Agreement, each member agency agrees to pay its actual portion ofoperating and capital costs on a q uarterly basis. As such, the <strong>Authority</strong> is not dependent on economicperformance, nor is it directly impacted by major structural changes in federal and state government fiscalpolicy. The <strong>Authority</strong> has adopted a Financial Reserve Policy to maintain an appropriate amount of cashresources necessary to meet demands during any quarterly period.The policy was amended in July 2008 by Resolution 2008-9 and provides the following:• Operating reserve amount of $1,000,000 allocated on the basis of Weighted Unit I Ownership (seeNote 8).• Remote Facility reserve amount of $50,000 from each member agency that owns, in whole or in part,a remote facility or facilities operated and maintained by the <strong>Authority</strong>.• Inventory reserve amount of $850,000 allocated on the basis of Weighted Unit I Ownership.• Capital Reserve amount not to exceed $10,000,000 or less than $3,000,000 as established in theannual Budget Appropriation Resolution.The total operating, remote facility, and inventory reserve of $2,000,000 is reported as Net AssetsUnrestricted. The capital reserve is reported as a component of Net Assets Restricted for Capital Program.Member AgencyOperatingReserveRemoteFacilityReserveInventoryReserveCapitalReserveTotal<strong>2012</strong>Total2011Buena Agency $ 81,600 $ 50,000 $ 69,360 $ 212,850 $ 413,810 $ 413,810City of Carlsbad 248,100 50,000 210,885 1,324,606 1,833,591 1,833,591City of Encinitas 48,400 - 41,140 157,252 246,792 246,792Leucadia <strong>Wastewater</strong> District 203,400 - 172,890 530,559 906,849 906,849Vallecitos Water District 202,400 - 172,040 1,742,286 2,116,726 2,116,726City of Vista 216,100 50,000 183,685 2,032,447 2,482,232 2,482,232Total Reserves $ 1,000,000 $ 150,000 $ 850,000 $ 6,000,000 $ 8,000,000 $ 8,000,000See accompanying independent auditors’ report.26
ENCINA WASTEWATER AUTHORITYNOTES TO FINANCIAL STATEMENTSJUNE 30, <strong>2012</strong> AND 2011Note 1 - Organization and Significant Accounting Policies: (Continued)Significant Accounting Policies (Continued)Budgetary ControlsThe <strong>Authority</strong> prepares a budget that is approved by the Board of Directors and recommended for memberagency approval by the Joint Advisory Committee. Up on approval by all M ember Agencies, the <strong>Authority</strong>adopts a resolution appropriating funds and establishing controls on changes in said appropriations. TheGeneral Manager is authorized to transfer appropriations between accounts within the operating or capitalprograms in an amount up to $50,000 per transfer up to $100,000 on any particular contract or agreement,and may also authorize expenditures up to $50,000. The Board of Directors must approve any expenditure ortransfer in excess of $50,000 and any transfer between operating and capital programs. The <strong>Authority</strong>adhered to the prescribed budget appropriation policy for the year ended June 30, <strong>2012</strong>.Unspent appropriations for the operating budget lapse at Fiscal Year-end unless designated by Board actionto be carried forward to the next budget period. Unspent appropriations for ongoing capital projects arecarried forward to the next budget period.Cash and Cash EquivalentsFor purposes of statement of cash flows, the <strong>Authority</strong> considers all investment instruments purchased with amaturity of three months or less to be cash equivalents.Subsequent EventsIn preparing these financial statements, the <strong>Authority</strong> has evaluated events and transactions for potentialrecognition or disclosure through March 4, 2013, the date the financial statements were available to be issued.See also subsequent events discussed in Note 10.Note 2 - Cash and Investments:Investments Authorized by the California Government Code and the <strong>Authority</strong>’s Investment PolicyThe table below identifies the investment types that are authorized for the <strong>Authority</strong> by the CaliforniaGovernment Code. The table also identifies certain provisions of the California Government Code that addressinterest rate risk, and concentration of credit risk:See accompanying independent auditors’ report.27
ENCINA WASTEWATER AUTHORITYNOTES TO FINANCIAL STATEMENTSJUNE 30, <strong>2012</strong> AND 2011Note 2 - Cash and Investments: (Continued)Investments Authorized by the California Government Code and the <strong>Authority</strong>’s Investment Policy (Continued)Authorized Investment TypeMaximumMaturityMaximumPercentageof PortfolioQualityRequirementsLocal Agency Bonds 5 years None NoneU.S. Treasury Obligations 5 years None NoneState Obligations 5 years None NoneCA Local Agency Obligations 5 years None NoneUS Agencies 5 years None NoneBankers’ Acceptances 180 days 40% NoneCommercial Paper 270 days 25% A1Negotiable Certificates of Deposit 5 years 30% NoneRepurchase Agreements 1 year None NoneReverse Repurchase Agreements 92 days 20% NoneMedium-Term Notes (CorporationDebt Investment Grade) 5 years 30% A RatingMutual Funds N/A 20% MultipleMoney Market Mutual Funds N/A 20% MultipleCollateralized Bank Deposits 5 years None NoneMortgage Pass-Through Securities 5 years 20% AA RatingTime Deposits 5 years None NoneCalifornia Local Agency InvestmentFunds (LAIF) N/A None NoneCertificates of Deposit in CaliforniaBanks or Savings and Loans 1 year None NoneThe <strong>Authority</strong>’s Investment Policy is more restrictive than the California Government Code. The policyrestricts the <strong>Authority</strong> from investing in anything other than the California Local Agency Investment Fund, theCalifornia Asset Management Program, or certificates of deposit. In addition, all certificates of deposit mustbe collateralized by U.S. Treasury obligations.Cash and equivalents held by the <strong>Authority</strong> were comprised of the following at June 30:Maturity in Years1 Year or Less <strong>2012</strong> Total 2011 TotalPetty cash $ 600 $ 600 $ 600California Local Agency Investment Fund (LAIF) 4,890,972 4,890,972 3,399,673Deposits with financial institutions 197,298 197,298 87,745Total Cash and Investments $ 5,088,870 $ 5,088,870 $ 3,488,018Financial Statement Classification:Current:Cash equivalents - operating $ 200,000 $ 200,000Cash equivalents - capital program 4,888,870 3,288,018Total Cash and Investments $ 5,088,870 $ 3,488,018See accompanying independent auditors’ report.28
ENCINA WASTEWATER AUTHORITYNOTES TO FINANCIAL STATEMENTSJUNE 30, <strong>2012</strong> AND 2011Note 2 - Cash and Investments: (Continued)Disclosures Relating to Interest Rate RiskInterest rate risk is the risk that changes in market interest rates will adversely affect the fair v alue of aninvestment. Generally, the longer the maturity of an investment, the greater the sensitivity of its fair value tochanges in market interest rates. One of the ways that the <strong>Authority</strong> manages its exposure to interest raterisk is by purchasing shorter term investments in order to provide the cash flows and liquidity needed foroperations.Information about the sensitivity of the fair values of the <strong>Authority</strong> investments to market interest ratefluctuations is provided in the previous table that shows the distribution of the <strong>Authority</strong>’s investments bymaturity as of June 30, <strong>2012</strong>.Disclosures Relating to Credit RiskGenerally, credit risk is the risk that an issuer of an investment will not fulfill its obligation to the holder of theinvestment. T his is measured by the assignment of a rat ing by a n ationally recognized statistical ratingorganization. Presented below is the actual rating as of the year end for each investment type.InvestmentCalifornia Local Agency Investment Fund (LAIF)Rating as of Year EndStandard & Poor’sNot RatedConcentration of Credit RiskConcentration of credit is the risk of loss attributed to the magnitude to the <strong>Authority</strong>’s investment in asingle issue.The investment policy of the <strong>Authority</strong> contains no limitations on the amount that can be invested in any oneissuer beyond that stipulated by the California Government Code, except that the <strong>Authority</strong>’s investmentpolicy restricts the <strong>Authority</strong> to only investing in the California Local Agency Investment Fund and Certificatesof Deposit that are collateralized by U.S. Treasury obligations. The <strong>Authority</strong> holds no investments in any oneissuer (other than external investment pools) that represent 5% or more of total <strong>Authority</strong> investments.See accompanying independent auditors’ report.29
ENCINA WASTEWATER AUTHORITYNOTES TO FINANCIAL STATEMENTSJUNE 30, <strong>2012</strong> AND 2011Note 2 - Cash and Investments: (Continued)Custodial Credit RiskCustodial credit risk for deposits is the risk that, in the event of the failure of a depository financial institution,the <strong>Authority</strong> will not be able to recover its deposits or will not be able to recover collateral securities thatare in the possession of an outside party. The custodial credit risk for investments is the risk that, in theevent of the failure of the counter-party (e.g., broker-dealer) the <strong>Authority</strong> will not be able to recover thevalue of its investment or collateral securities that are in the possession of another party. T he CaliforniaGovernment Code and the <strong>Authority</strong>’s investment policy do not contain legal or policy requirements thatwould limit the exposure to custodial credit risk for deposits or investments, other than the followingprovision for deposits: The California Government Code requires that a financial institution secure depositsmade by state or local governmental units by pledging securities in an undivided collateral pool held by adepository regulated under state law (unless so waived by the governmental unit). The market value of thepledged securities in the collateral pool must equal at least 110% of the total amount deposited by the publicagencies. California law also allows financial institutions to secure <strong>Authority</strong> deposits by pledging first trustdeed mortgage notes having a value of 150% of the secured public deposits.At June 30, <strong>2012</strong>, none of the <strong>Authority</strong>’s deposits with financial institutions in excess of federal depositoryinsurance limits were held in uncollateralized accounts. A t June 30, <strong>2012</strong>, no <strong>Authority</strong> investments wereheld by the same broker-dealer (counterparty) that was used by the <strong>Authority</strong> to buy the securities.Investment in State Investment PoolThe <strong>Authority</strong> is a v oluntary participant in the Local Agency Investment Fund (LAIF) that is regulated byCalifornia Government Code under the oversight of the Treasurer of the State of California. The fair value ofthe <strong>Authority</strong>’s investment in this pool is reported in the accompanying financial statements at amountsbased upon the <strong>Authority</strong>’s pro-rata share of the fair value provided by LAIF for the entire LAIF portfolio (inrelation to the amortized cost of that portfolio). Th e balance available for withdrawal is based on theaccounting records maintained by LAIF, which are recorded on an amortized cost basis.The statements of cash flows have been prepared by considering all investment instruments purchased witha maturity of three months or less to be cash equivalents. Following is a detail:<strong>2012</strong> 2011California Local Agency Investment Fund (LAIF) $ 4,890,972 $ 3,399,673Deposits with financial institutions 197,298 87,745Petty cash 600 600Total $ 5,088,870 $ 3,488,018See accompanying independent auditors’ report.30
ENCINA WASTEWATER AUTHORITYNOTES TO FINANCIAL STATEMENTSJUNE 30, <strong>2012</strong> AND 2011Note 3 - Restricted Assets:Restricted assets were provided by and are to be used for the following at June 30:Funding Source Use<strong>2012</strong> 2011Capital contributions from memberagencies and interest earningsCapital program$ 8,516,233 $ 9,474,780When both restricted and unrestricted resources are available for use, it is the <strong>Authority</strong>’s policy to userestricted resources first, and then unrestricted resources as necessary.Note 4 - Capital Assets:Capital assets consist of the following at June 30:<strong>2012</strong>Balance atJune 30, 2011 Additions DeletionsBalance atJune 30, <strong>2012</strong>Capital Assets Not Being Depreciated:Land $ 3,598,173 $ - $ - $ 3,598,173Construction in progress 3,509,708 6,777,471 (6,232,851) 4,054,328Total Capital Assets Not Being Depreciated 7,107,881 6,777,471 (6,232,851) 7,652,501Capital Assets Being Depreciated:Joint wastewater treatment (Unit I) 196,253,370 6,716,412 (864,811) 202,104,971Joint ocean outfall facilities (Unit J) 14,102,005 - - 14,102,005Furnishings and office equipment 2,112,950 228,442 - 2,341,392Pump station facilities 6,581,287 235,576 (66,908) 6,749,955Flow metering system 299,059 - - 299,059Total Capital Assets Being Depreciated 219,348,671 7,180,430 (931,719) 225,597,382Less Accumulated Depreciation For:Joint wastewater treatment (Unit I) (95,955,326) (7,068,826) 864,815 (102,159,337)Joint ocean outfall facilities (Unit J) (11,071,615) (293,828) - (11,365,443)Furnishings and office equipment (1,280,080) (274,829) - (1,554,909)Pump station facilities (3,811,741) (259,250) 66,904 (4,004,087)Flow metering system (269,862) (2,920) - (272,782)Total Accumulated Depreciation (112,388,624) (7,899,653) 931,719 (119,356,558)Net Capital Assets Being Depreciated 106,960,047 (719,223) - 106,240,824Net Capital Assets $ 114,067,928 $ 6,058,248 $ (6,232,851) $ 113,893,325See accompanying independent auditors’ report.31
ENCINA WASTEWATER AUTHORITYNOTES TO FINANCIAL STATEMENTSJUNE 30, <strong>2012</strong> AND 2011Note 4 - Capital Assets: (Continued)2011Balance atJune 30, 2010 Additions DeletionsBalance atJune 30, 2011Capital Assets Not Being Depreciated:Land $ 3,598,173 $ - $ - $ 3,598,173Construction in progress 1,658,195 4,713,638 (2,862,125) 3,509,708Total Capital Assets Not Being Depreciated 5,256,368 4,713,638 (2,862,125) 7,107,881Capital Assets Being Depreciated:Joint wastewater treatment (Unit I) 192,795,916 4,044,478 (587,024) 196,253,370Joint ocean outfall facilities (Unit J) 14,102,005 - - 14,102,005Furnishings and office equipment 1,884,990 230,187 (2,227) 2,112,950Pump station facilities 6,433,788 220,907 (73,408) 6,581,287Flow metering system 299,059 - - 299,059Total Capital Assets Being Depreciated 215,515,758 4,495,572 (662,659) 219,348,671Less Accumulated Depreciation For:Joint wastewater treatment (Unit I) (90,974,356) (5,567,990) 587,020 (95,955,326)Joint ocean outfall facilities (Unit J) (10,777,787) (293,828) - (11,071,615)Furnishings and office equipment (1,113,704) (168,602) 2,226 (1,280,080)Pump station facilities (3,609,103) (226,495) 23,857 (3,811,741)Flow metering system (266,942) (2,920) - (269,862)Total Accumulated Depreciation (106,741,892) (6,259,835) 613,103 (112,388,624)Net Capital Assets Being Depreciated 108,773,866 (1,764,263) (49,556) 106,960,047Net Capital Assets $ 114,030,234 $ 2,949,375 $ (2,911,681) $ 114,067,928Note 5 - Noncurrent Liabilities:Noncurrent liabilities consist of the following at June 30:<strong>2012</strong>Balance atJune 30, 2011 Additions DeletionsBalance atJune 30, <strong>2012</strong>Amountdue withinone yearRetentions payable - Capital program $ 175,993 $ 570,517 $ (587,093) $ 159,417 $ -Net OPEB obligation (Note 6) 73,469 38,822 (652) 111,639 -Compensated absences 990,011 647,454 (588,197) 1,049,268 75,944Total Noncurrent Liabilities $ 1,239,473 $ 1,256,793 $ (1,175,942) $ 1,320,324 $ 75,9442011Balance atJune 30, 2010 Additions DeletionsBalance atJune 30, 2011Amountdue withinone yearRetentions payable - Capital program $ - $ 204,773 $ (28,780) $ 175,993 $ -Net OPEB obligation (Note 6) 36,263 37,559 (353) 73,469 -Compensated absences 946,788 643,849 (600,626) 990,011 56,819Total Noncurrent Liabilities $ 983,051 $ 886,181 $ (629,759) $ 1,239,473 $ 56,819Retentions payable represents amounts withheld from certain construction contracts. Once projects arecomplete and accepted by the <strong>Authority</strong>’s Board of Directors, retentions payable are released thirty daysfollowing a Notice of Completion filing with the county recorder’s office. All retention amounts are expected tobe paid out during Fiscal Year 2013.See accompanying independent auditors’ report.32
ENCINA WASTEWATER AUTHORITYNOTES TO FINANCIAL STATEMENTSJUNE 30, <strong>2012</strong> AND 2011Note 6 - Postretirement Benefits:Plan DescriptionThe <strong>Authority</strong> provides medical (including prescription drug benefits) coverage to eligible employees andtheir eligible dependents through the CalPERS Health Program. The CalPERS Health Program provides accessto continued coverage to eligible employees at retirement. Eligible employees are employees who retireunder CalPERS on or after age 50, with at least 5 years of service. The <strong>Authority</strong>’s contribution will continuefor the lifetime of the retiree and any surviving eligible spouse. The <strong>Authority</strong> currently provides a monthlycontribution of $22.40 per retiree who elects to continue coverage. There are four and two retirees receivingthe monthly contribution for the years ended June 30, <strong>2012</strong> and 2011, respectively. Th e monthlycontribution is adjusted annually to reflect changes in the medical component of the Consumer Price Index.Funding Policy and Annual OPEB CostsThe contribution requirements of the <strong>Authority</strong> are established and may be amended annually by the Board ofDirectors. T he <strong>Authority</strong>’s annual other post-employment benefit (OPEB) cost (expense) for the Plan iscalculated based on the annual required contribution of the <strong>Authority</strong> (ARC), an amount actuarially determinedin accordance with the parameters of GASB Statement No. 45. The ARC represents a level of funding that, ifpaid on an ongoing basis, is projected to cover normal costs each year and to amortize any unfunded actuarialliabilities (or funding excess) over a period not to exceed thirty years. The <strong>Authority</strong>’s Board of Directors hasestablished a policy to contribute on a “pay as you go” basis. The following table shows the components of the<strong>Authority</strong>’s annual OPEB cost for the years ended June 30, <strong>2012</strong> and 2011, the amount actually contributed tothe Plan including benefits paid to retirees, and changes in the <strong>Authority</strong>’s net OPEB obligation:<strong>2012</strong> 2011Annual required contribution $ 38,822 $ 37,559Interest on net OPEB obligation - -Adjustment to annual required contribution - -Annual OPEB cost 38,822 37,559Contributions (including benefits paid) (652) (353)Increase in net OPEB obligation 38,170 37,206Net OPEB obligation - Beginning of Year 73,469 36,263Net OPEB obligation - End of Year $ 111,639 $ 73,469The <strong>Authority</strong>’s annual OPEB cost, the percentage of annual OPEB cost contributed to the Plan, and the netOPEB obligation for <strong>2012</strong> and the two preceding years were as follows:Fiscal YearAnnualOPEB CostPercentage ofAPC ContributedNet PensionObligationJune 30, 2010 $ 36,356 0.3% $ 36,263June 30, 2011 37,559 0.9% 73,469June 30, <strong>2012</strong> 38,822 1.7% 111,639See accompanying independent auditors’ report.33
ENCINA WASTEWATER AUTHORITYNOTES TO FINANCIAL STATEMENTSJUNE 30, <strong>2012</strong> AND 2011Note 6 - Postretirement Benefits: (Continued)Funding Status and Funding ProgressAs of July 1, <strong>2012</strong>, the most recent actuarial valuation date, the Plan was not yet funded. The <strong>Authority</strong>’sactuarial accrued liability for benefits at June 30, <strong>2012</strong> was $354,564 and the covered payroll (annual payrollof active employees covered by the Plan) was $5,798,143, with a ratio of the UAAL to the covered payroll of6.12%. The normal cost payments made during the year ended June 30, <strong>2012</strong> of $652 funded 1.7% of theannual required contribution (ARC) leaving a net OPEB obligation of $111,639.ActuarialValuationDateActuarialValue ofAssetsActuarialAccruedLiabilityUnfundedAAL(UAAL)FundedStatusCoveredPayrollUAAL as aPercentageof CoveredPayroll(A) (B) (B-A) (A/B) (C) [(B-A)/C]July 1, 2009 N/A $ 188,983 $ 188,983 0.0% $ 5,498,944 3.44%July 1, <strong>2012</strong> N/A $ 354,564 $ 354,564 0.0% $ 5,798,143 6.12%Actuarial valuations of an ongoing Plan involve estimates of the value of reported amounts and assumptionsabout the probability of occurrence of events far into the future. Examples include assumptions about futureemployment, mortality, and the healthcare cost trend. Amounts determined regarding the funded status ofthe Plan and the annual required contributions of the employer are subject to continual revision as actualresults are compared with past expectations and new estimates are made about the future. The schedule offunding progress presents multiyear trend information that shows whether the actuarial value of plan assetsis increasing or decreasing over time relative to the actuarial accrued liabilities for benefits.Actuarial Methods and AssumptionsProjections of benefits for financial reporting purposes are based on the substantive plan (the plan asunderstood by the employer and the plan members) and include the types of benefits provided at the time ofeach valuation and the historical pattern of sharing benefits and costs between employer and plan membersto that point. The actuarial methods and assumptions used include techniques that are designed to reducethe effects of short-term volatility in actuarial accrued liabilities and the actuarial assets, consistent with thelong-term perspective of the calculations.The actuarial cost method used for determining the benefits obligations is the Projected Unit Credit CostMethod. The actuarial assumptions included a 5% investment rate of return, which is the expected long-terminvestment return on plan assets, a p rojected salary increase assumption rate of 3.25%, and an annualhealthcare cost trend rate of 5 to 8 percent. The UAAL is being amortized as a level percentage of projectedpayroll over 30 years.See accompanying independent auditors’ report.34
ENCINA WASTEWATER AUTHORITYNOTES TO FINANCIAL STATEMENTSJUNE 30, <strong>2012</strong> AND 2011Note 7 - Defined Benefit Pension Plan:Plan DescriptionThe <strong>Authority</strong> contributes to the California Public Retirement Plan System (CalPERS), a c ost sharing multipleemployerdefined benefit pension plan. The <strong>Authority</strong> participates in the miscellaneous 2.7% at 55 pool. CalPERSprovides retirement and disability benefits, annual cost-of-living adjustments; and death benefits to planmembers and beneficiaries. CalPERS acts as a common investment and administrative agent for participatingpublic employers within the State of California. CalPERS requires agencies with less than 100 active members inthe plan to participate in a risk pool. A menu of benefit provisions as well as other requirements is established byState Statutes within the Public Employees Retirement Law. The Plan selects optional benefit provisions fromthe benefit menu by contract with CalPERS and adopts those benefits through <strong>Authority</strong> resolution. C alPERSissues a separate comprehensive annual financial report. Copies of the CalPERS’ annual financial report may beobtained from the CalPERS executive office - 400 P Street - Sacramento, California 95814.Funding PolicyActive plan members are required to contribute 8% of their annual covered salary. For the year endedJune 30, <strong>2012</strong>, the <strong>Authority</strong> elected to make contributions on behalf of its employees at 3% and theemployees contributed 5%. The <strong>Authority</strong> is required to contribute the actuarially determined remainingamounts necessary to fund the benefits for its members. The actuarial methods and assumptions are thoseadopted by the CalPERS Board of Administration. T he required employer contribution rate for the FiscalYears ended June 30, <strong>2012</strong> and 2011 were 21.98% and 19.03%, respectively. The contribution requirementsof the plan members and the <strong>Authority</strong> are established and may be amended by CalPERS. Total contributionsfor the years ended June 30, <strong>2012</strong>, 2011 and 2010 were $1,665,688, $1,486,365 and $1,498,821, respectively,which were equal to the required contributions each year.Note 8 - Ownership and Usage Allocations:Phase IV OwnershipAll of the Phase IV expansion and upgrades, except for the widening of Avenida <strong>Encina</strong>s, were completed inApril of 1993. Unit I was enlarged from 24.4 million gallons per day (MGD) liquid capacity and 27.91 MGDsolids capacity to 36 MGD and 38 MGD, respectively. The Unit I and Unit J capacities and ownership of PhaseIV are as follows:UNIT I - Treatment PlantUNIT J - Ocean OutfallLiquids Solids DisposalAgency MGD % MGD % MGD %Vista 8.05 22.36 8.05 21.18 8.05 21.18Carlsbad 9.24 25.67 9.24 24.32 9.24 24.32Buena 2.26 6.28 3.51 9.24 3.51 9.24Vallecitos 7.54 20.94 7.54 19.84 7.54 19.84Leucadia 7.11 19.75 7.86 20.68 7.86 20.68Encinitas 1.80 5.00 1.80 4.74 1.80 4.74Total 36.00 100.00 38.00 100.00 38.00 100.00See accompanying independent auditors’ report.35
ENCINA WASTEWATER AUTHORITYNOTES TO FINANCIAL STATEMENTSJUNE 30, <strong>2012</strong> AND 2011Note 8 - Ownership and Usage Allocations:Phase IV Ownership (Continued)Allocation of Unit I - <strong>Encina</strong> plant ownership costs are based on the above two percentages weighted by thedesign engineers’ replacement value breakdown, at July 27, 1995, of areas within the facility that pertain toliquids or solids processing. The following are the weighted average percentages used to allocate <strong>Encina</strong>plant ownership costs:Unit IWeighted AveragePercentagesCity of Vista 21.61%City of Carlsbad 24.81%Buena Sanitation District 8.16%Vallecitos Water District 20.24%Leucadia <strong>Wastewater</strong> District 20.34%City of Encinitas 4.84%100.00%<strong>Wastewater</strong> Flow and Usage Allocation - Unit I Treatment PlantAdministrative, maintenance, and operation expenses for Unit I of the Joint System are allocated to themember agencies based on each agency’s percentage of ownership and usage (actual flow and strength) ofUnit I influent wastewater. Insurance, administrative, maintenance, laboratory costs, and other costs whichare incurred irrespective of the amount of wastewater which enters Unit I are allocated based on ownership.Chemicals, utilities, disposal fees, and other costs which result from wastewater entering Unit I are allocatedbased on usage (average daily wastewater flows (ADF)), biochemical oxygen demand (BOD), and suspendedsolids (SS) received at the <strong>Encina</strong> plant.<strong>Wastewater</strong> flow usage is averaged on an annual basis. The usage and percentage of total flow by memberagency for the Fiscal Years ended June 30, <strong>2012</strong> and 2011 are as follows:MGD ADF UNIT IUsageFlow PercentageAgency <strong>2012</strong> 2011 Change <strong>2012</strong> 2011 ChangeVista 5.36 6.08% (0.72) 23.75% 25.11 (1.35)%Carlsbad 6.92 7.57 (0.65) 30.66 31.27 (0.60)Buena 1.63 1.71 (0.08) 7.22 7.05 0.16Vallecitos 3.47 3.64 (0.17) 15.37 15.04 0.34Leucadia 4.11 4.18 (0.07) 18.21 17.25 0.95Encinitas 1.08 1.04 0.04 4.79 4.28 0.50Total 22.57 24.22% (1.65) 100.00% 100.00 0.00%See accompanying independent auditors’ report.36
ENCINA WASTEWATER AUTHORITYNOTES TO FINANCIAL STATEMENTSJUNE 30, <strong>2012</strong> AND 2011Note 8 - Ownership and Usage Allocations: (Continued)<strong>Wastewater</strong> Flow and Usage Allocation - Unit I Treatment Plant (Continued)Biochemical oxygen demand usage is averaged on a three year basis. The usage and percentage of total BODby member agency for the Fiscal Years ended June 30, <strong>2012</strong> and 2011 are as follows:Agency <strong>2012</strong> 2011BOD LBS/DAY UNIT IBODBOD %Change <strong>2012</strong>BOD %2011BOD %ChangeVista 12,346 13,509 (1,163) 21.40 % 23.00 % (1.60) %Carlsbad 16,584 17,291 (707) 28.60 29.40 (0.80)Buena 5,778 5,644 134 10.00 9.60 0.40Vallecitos 11,653 11,038 615 20.20 18.80 1.40Leucadia 8,470 8,345 125 14.70 14.20 0.50Encinitas 2,938 2,921 17 5.10 5.00 0.10Total 57,769 58,748 (979) 100.00 % 100.00 % 0.00 %Suspended solids are averaged on a three year basis. T he usage and percentage of total SS by memberagency for the Fiscal Years ended June 30, <strong>2012</strong> and 2011 are as follows:Agency <strong>2012</strong> 2011SolidsChangeSS LBS/DAY UNIT ISS Lbs/Day %<strong>2012</strong>SS Lbs/Day %2011Solids %ChangeVista 10,016 10,969 (953) 17.30 % 19.30 % (2.00) %Carlsbad 16,699 17,050 (351) 29.00 29.90 (0.90)Buena 3,859 3,710 149 6.70 6.50 0.20Vallecitos 15,448 13,806 1,642 26.70 24.30 2.40Leucadia 8,668 8,532 136 15.00 15.00 0.00Encinitas 3,084 2,827 257 5.30 5.00 0.30Total 57,774 56,894 880 100.00 % 100.00 % 0.00 %Treated wastewater flow discharged through Unit J is averaged on an annual basis. The change for the FiscalYears ended June 30, <strong>2012</strong> and 2011 for Unit J are as follows:<strong>2012</strong> 2011 Increase (Decrease)Agency MGD % of total MGD % of total MGD % of totalVista 5.36 24.70 % 6.08 25.83 % (0.72) (17.78) %Carlsbad 6.00 27.60 6.77 28.76 (0.77) 78.95Buena 1.63 7.50 1.71 7.26 (0.08) (17.78)Vallecitos 3.99 18.40 4.10 17.42 (0.11) (24.44)Leucadia 3.66 16.80 3.84 16.31 (0.18) (40.00)Encinitas 1.08 5.00 1.04 4.42 0.04 21.05Total 21.72 100.00 % 23.54 100.00 % (1.82) 100.00 %See accompanying independent auditors’ report.37
ENCINA WASTEWATER AUTHORITYNOTES TO FINANCIAL STATEMENTSJUNE 30, <strong>2012</strong> AND 2011Note 8 - Ownership and Usage Allocations: (Continued)Phase V OwnershipIn June 2004, the <strong>Authority</strong> adopted Resolution 04-14 to amend the Revised Basic Agreement (RBA) to addressPhase V cost allocation. Specifically, Exhibit D was added to the RBA and set forth a five-step process to allocatecapital costs during Phase V construction. Completion of Phase V expansion occurred in December 2009.Member agency cost allocations were adjusted using actual figures including: existing facilities; project costsbased on actual amounts paid; and the Engineering News Record Los Angeles (ENRLA) construction cost index atthe defined mid-point of construction. A recommendation has been presented to the <strong>Authority</strong>’s Board ofDirectors revising the RBA to reflect post-Phase V capacity and ownership allocations.Other Cost AllocationsThe expenses for the Buena Vista pump station, the Agua Hedionda pump station, the Raceway Basin pumpstation, the Carlsbad Water Recycling Facility, and the Buena Sanitation District facilities are allocated based onownership. Directors’ meeting expenses are allocated based on direct costs. S ource control and relatedlaboratory expenses are allocated based on direct labor charges, number of industrial waste users and on flowfor Unit J. Flow metering costs are allocated based on the number and types of meters and on Unit J ownership.Note 9 - Commitments and Contingencies:Operating LeasesThe <strong>Authority</strong> has entered into operating leases agreements for five copiers in March of <strong>2012</strong>. T he leaseamount for the five copiers is $1,325 per month for 36 months.Construction CommitmentsThe <strong>Authority</strong> had contractual agreements with outside firms for capital program construction andprofessional services as follows at June 30, <strong>2012</strong>:Solids Processing and Blower Project $ 1,420,833Third Centrifuge Engine Procurement 134,763Energy Strategic Plan 255,271Major Plant Rehabilitation 96,643EWPCF Plant-Wide Design Services 424,811Total Construction Commitments $ 2,332,321ContingenciesLegal claims and lawsuits arise from time to time in the normal course of business which, in the opinion ofmanagement, will have no material effect on the <strong>Authority</strong>’s financial position.See accompanying independent auditors’ report.38
ENCINA WASTEWATER AUTHORITYNOTES TO FINANCIAL STATEMENTSJUNE 30, <strong>2012</strong> AND 2011Note 10 - Subsequent Events:Fiscal Year 2013 BudgetOn July 25, <strong>2012</strong>, the Board of Directors adopted Resolution <strong>2012</strong>-10 to appropriate funds for Fiscal Year2013 Operating $(13,537,021) and Capital Improvement Program $(9,996,047) budgets. Unexpended FiscalYear <strong>2012</strong> Capital Improvement Projects of $4,030,721 were also appropriated in Fiscal Year 2013.Phase V OwnershipSubsequent to June 30, <strong>2012</strong>, the <strong>Authority</strong>’s Board of Directors was presented with the recommendation torevise the RBA to reflect post-Phase V capacity and ownership allocations as follows:UNIT I - Treatment PlantUNIT J - Ocean OutfallLiquids Solids DisposalAgency MGD % MGD % MGD %Vista 10.67 26.34 10.67 24.63 10.67 24.63Carlsbad 10.26 25.33 10.26 23.69 10.26 23.69Buena 3.00 7.41 3.00 6.93 3.00 6.93Vallecitos 7.67 18.93 10.47 24.17 10.47 24.17Leucadia 7.11 17.55 7.11 16.42 7.11 16.42Encinitas 1.80 4.44 1.80 4.16 1.80 4.16Total 40.51 100.00 43.31 100.00 43.31 100.00Allocation of Unit I – <strong>Encina</strong> plant ownership costs are based on the above two percentages weighted by thedesign engineers’ replacement value breakdown, at June 30, 2008, of areas within the facility that pertain toliquids or solids processing. The following are the weighted average percentages used to allocate <strong>Encina</strong>plant ownership costs:Unit IWeighted AveragePercentagesCity of Vista 25.20%City of Carlsbad 24.24%Buena Sanitation District 7.09%Vallecitos Water District 22.42%Leucadia <strong>Wastewater</strong> District 16.80%City of Encinitas 4.25%100.00%See accompanying independent auditors’ report.39
ENCINA WASTEWATER AUTHORITYNOTES TO FINANCIAL STATEMENTSJUNE 30, <strong>2012</strong> AND 2011Note 11 - New Governmental Accounting Standards:GASB No. 60In November 2010, the Governmental Accounting Standards Board issued Statement No. 60, “Accounting andFinancial Reporting for Service Concession Arrangements”. T his pronouncement is effective for periodsbeginning after December 15, 2011 and its provisions are generally required to be applied retroactively. Theobjective of this statement is to address issues related to service concession arrangements (SCA’s) which area type of public-private or public-public partnership. An SCA is an arrangement between the transferor (agovernment) and an operator in which (1) the transferor conveys to the operator the right and relatedobligation to provide services through the use of infrastructure or other public assets in exchange forsignificant consideration and (2) the operator collects and is compensated by fees from third parties. T he<strong>Authority</strong> does not have any SCA’s as of June 30, <strong>2012</strong>.GASB No. 61In November 2010, the Governmental Accounting Standards Board issued Statement No. 61, “The FinancialReporting Entity: Omnibus - an amendment of GASB Statements No. 14 and No. 34”. This pronouncement iseffective for periods beginning after June 15, <strong>2012</strong>. Earlier application is encouraged. The objective of thisstatement is to address reporting entity issues that have arisen since the issuance of Statements No.14 andNo. 34. The <strong>Authority</strong> does not have any component units as of June 30, <strong>2012</strong>.GASB No. 62In December 2010, the Governmental Accounting Standards Board issued Statement No. 62, “Codification ofAccounting and Financial Reporting Guidance contained in Pre-November 30, 1989 FASB and AICPAPronouncements”. This pronouncement is effective for periods beginning after December 15, 2011. Earlierapplication is encouraged. Th e objective of this statement is to incorporate into the GASB’s authoritativeliterature certain accounting and financial reporting guidance that is included in the pronouncements of theFASB and the AICPA that was issued on or before November 30, 1989 which does not conflict with orcontradict GASB pronouncements. This pronouncement is not anticipated to have a material effect on thefinancial statements of the <strong>Authority</strong> in the year of implementation.GASB No. 63In June 2011, the Governmental Accounting Standards Board issued Statement No. 63, “Financial Reportingof Deferred Outflows of Resources, Deferred Inflows of Resources and Net Position”. This pronouncement iseffective for periods beginning after December 15, 2011. Concepts Statement No. 4 “Elements of FinancialStatements” introduced and defined deferred outflows and deferred inflows as an acquisition orconsumption of net assets by the government that is applicable to a future reporting period, which is distinctfrom assets and liabilities. Concepts Statement No. 4 also defines net position as the residual of all otherelements presented in a statement of financial position and renames that measure net position rather thannet assets. This pronouncement is not anticipated to have a material effect on the financial statements ofthe District in the year of implementation.See accompanying independent auditors’ report.40
ENCINA WASTEWATER AUTHORITYNOTES TO FINANCIAL STATEMENTSJUNE 30, <strong>2012</strong> AND 2011Note 11 - New Governmental Accounting Standards: (Continued)GASB No. 64In June 2011, the Governmental Accounting Standards Board issued Statement No. 64, “DerivativeInstruments: Application of Hedge Accounting Termination Provisions - an amendment to GASB 53”. Thispronouncement was effective for periods beginning after June 15, 2011. This statement clarifies whether aneffective hedging relationship continues after the replacement of a s wap counterparty or a s wapcounterparty’s credit support provider. The Statement sets forth criteria that establish when the effectivehedging relationship continues and hedge accounting should continue to be applied. The District does nothave any hedge transactions at June 30, <strong>2012</strong>.GASB No. 65In March <strong>2012</strong>, the Governmental Accounting Standards Board issued Statement No. 65, “Items PreviouslyReported as Assets and Liabilities”. This pronouncement is effective for periods beginning after December15, <strong>2012</strong>. This Statement establishes accounting and financial reporting standards that reclassify, as deferredoutflows of resources or deferred inflows of resources, certain items that were previously reported as assetsand liabilities and recognizes, as outflows of resources or inflows of resources, certain items that werepreviously reported as assets and liabilities. This Statement amends the financial statement classification ofcertain items previously reported as assets and liabilities to be consistent with the definitions in ConceptsStatement No. 4. This Statement also provides other financial reporting guidance related to the impact of thefinancial statement elements deferred outflows of resources and deferred inflows of resources, such aschanges in the determination of the major fund calculations and limiting the use of the term deferred infinancial statement presentations. This pronouncement is not anticipated to have a material effect on thefinancial statements of the District in the year of implementation.GASB No. 66In March <strong>2012</strong>, the Governmental Accounting Standards Board issued Statement No. 66, “TechnicalCorrections - <strong>2012</strong> - an amendment of GASB Statements No. 10 and No. 62”. This pronouncement is effectivefor periods beginning after December 15, <strong>2012</strong>. This statement resolves conflicting guidance that resultedfrom the issuance of two pronouncements, Statements No. 54, “Fund Balance Reporting and GovernmentalFund Type Definitions”, and No. 62, “Codification of Accounting and Financial Reporting Guidance Containedin Pre-November 30, 1989 FASB and AICPA Pronouncements”. T his Statement amends Statement No. 10,“Accounting and Financial Reporting for Risk Financing and Related Insurance Issues”, by removing theprovision that limits fund-based reporting of an entity’s risk financing activities to the general fund and theinternal service fund type. This Statement also amends Statement No. 62 by modifying the specific guidanceon accounting for (1) operating lease payments that vary from a s traight-line basis, (2) the differencebetween the initial investment (purchase price) and the principal amount of a purchased loan or group ofloans, and (3) servicing fees related to mortgage loans that are sold when the stated service fee rate differssignificantly from a current (normal) service fee rate. These changes clarify how to apply Statement No. 13,“Accounting for Operating Leases with Scheduled Rent Increases”, and result in guidance that is consistentwith the requirements in Statement No. 48, “Sales and Pledges of Receivables and Future Revenues andIntra-Entity Transfers of Assets and Future Revenues”, respectively.See accompanying independent auditors’ report.41
ENCINA WASTEWATER AUTHORITYNOTES TO FINANCIAL STATEMENTSJUNE 30, <strong>2012</strong> AND 2011Note 11 - New Governmental Accounting Standards: (Continued)GASB No. 67In June <strong>2012</strong>, the Governmental Accounting Standards Board issued Statement No. 67, “Financial Reportingfor Pension Plans - an Amendment of GASB Statement No. 25”. This pronouncement is effective for periodsbeginning after June 15, 2013. This Statement replaces the requirements of Statements No. 25, “FinancialReporting for Defined Benefit Pension Plans and Note Disclosures for Defined Contribution Plans”, and No.50, “Pension Disclosures”, as they relate to pension plans that are administered through trusts or equivalentarrangements (hereafter jointly referred to as trusts) that meet certain criteria. T he requirements ofStatements No. 25 and 50 remain applicable to pension plans that are not administered through trustscovered by the scope of this Statement and to defined contribution plans that provide postemploymentbenefits other than pensions. The <strong>Authority</strong> has not yet determined the effects of this pronouncement in theyear of implementation.GASB No. 68In June <strong>2012</strong>, the Governmental Accounting Standards Board issued Statement No. 68, “Accounting andFinancial Reporting for Pensions”. This pronouncement is effective for periods beginning after June 15, 2013.This pronouncement establishes accounting and financial reporting requirements related to pensions forgovernments whose employees are provided with pensions through pension plans, as well as fornonemployer governments that have a legal obligation to contribute to those plans. The <strong>Authority</strong> has notyet determined the effects of this pronouncement in the year of implementation.See accompanying independent auditors’ report.42
ENCINA WASTEWATER AUTHORITYSUPPLEMENTARY SCHEDULE OF INVESTMENT IN CAPITAL ASSETSAT JUNE 30, <strong>2012</strong>ASSET PERCENTAGE OF OWNERSHIP TOTALMEMBER AGENCY OWNERSHIP AT COSTVista $ $ Carlsbad Buena Vallecitos Leucadia Encinitas June 30, <strong>2012</strong> Vista Carlsbad Buena Vallecitos Leucadia EncinitasPLANTJoint <strong>Wastewater</strong> Treatment (Unit I - Weighted) 21.61% 24.81% 8.16% 20.24% 20.34% 4.84% $ 145,868,831 $ 31,522,255 $ 36,190,057 $ 11,902,897 $ 29,523,851 29,669,720 7,060,05100 Phase V Expansion (Unit I) "normalized" 43.30% 20.01% 0.00% 35.76% 0.00% 0.93% 56,236,140 24,350,248 11,252,852 - 20,110,044 - 522,996Joint <strong>Wastewater</strong> Disposal (Unit J) 21.18% 24.32% 9.24% 19.84% 20.68% 4.74% 14,102,005 2,986,804 3,429,608 1,303,025 2,797,838 2,916,295 668,435Furnishings and Office Equipment (Unit I) 21.61% 24.81% 8.16% 20.24% 20.34% 4.84% 2,341,392 505,975 580,899 191,058 473,898 476,239 113,323Buena Vista Pump Station (BVPS) 89.60% 10.40% - - - - 4,046,018 3,625,232 420,786 - - - -Agua Hedionda Pump Station (AHPS) 69.10% 30.90% - - - - 2,095,499 1,447,990 647,509 - - - -Carlsbad Water Reclamation Facility (CWRF) - 100.00% - - - - 296,835 - 296,835 - - - -Buena Sanitation District Facilities (BSDF) - - 100.00% - - - 224,710 - - 224,710 - - -Raceway Basin Pump Station (RBPS) 100.00% - - - - - 86,893 86,893 - - - - -Flow Metering System (Based on Type and Location of Required Meters)299,059 99,288 62,503 58,616 21,831 22,011 34,810SUB-TOTAL: PLANT 225,597,382 64,624,685 52,881,049 13,680,306 52,927,462 33,084,265 8,399,615REAL PROPERTYSouth Parcel (Unit I) 21.61% 24.81% 8.16% 20.24% 20.34% 4.84% 3,412,173 737,371 846,560 278,433 690,624 694,036 165,149<strong>Encina</strong> Water Pollution Control Facilities (Unit I) 21.61% 24.81% 8.16% 20.24% 20.34% 4.84% 186,000 40,195 46,147 15,178 37,646 37,832 9,002SUB-TOTAL: REAL PROPERTY 3,598,173 777,566 892,707 293,611 728,270 731,868 174,151CONSTRUCTION IN PROGRESSFinancial Software System (Unit I) 21.61% 24.81% 8.16% 20.24% 20.34% 4.84% 40,950 8,849 10,160 3,342 8,288 8,329 1,982Major Plant Rehab (Unit I) 21.61% 24.81% 8.16% 20.24% 20.34% 4.84% 4,013,378 867,291 995,719 327,492 812,308 816,321 194,247SUB-TOTAL: CONSTRUCTION IN PROGRESS 4,054,328 876,140 1,005,879 330,834 820,596 824,650 196,229TOTAL INVESTMENT IN CAPITAL ASSETS 233,249,883 66,278,391 54,779,635 14,304,751 54,476,328 34,640,783 8,769,995ACCUMULATED DEPRECIATIONJoint <strong>Wastewater</strong> Treatment (Unit I - Weighted) 21.61% 24.81% 8.16% 20.24% 20.34% 4.84% (96,698,529) (20,896,552) (23,990,905) (7,890,600) (19,571,782) (19,668,481) (4,680,209)00 Phase V Expansion (Unit I) "normalized" 43.30% 20.01% 0.00% 35.76% 0.00% 0.93% (5,460,808) (2,364,529) (1,092,708) - (1,952,785) - (50,786)Joint <strong>Wastewater</strong> Disposal (Unit J) 21.18% 24.32% 9.24% 19.84% 20.68% 4.74% (11,365,443) (2,407,200) (2,764,076) (1,050,167) (2,254,904) (2,350,374) (538,722)Furnishings and Office Equipment (Unit I) 21.61% 24.81% 8.16% 20.24% 20.34% 4.84% (1,554,909) (336,015) (385,773) (126,881) (314,714) (316,268) (75,258)Buena Vista Pump Station (BVPS) 89.60% 10.40% - - - - (1,994,917) (1,787,446) (207,471) - - - -Agua Hedionda Vista Pump Station (AHPS) 69.10% 30.90% - - - - (1,759,299) (1,215,676) (543,623) - - - -Carlsbad Water Reclamation Facility (CWRF) - 100.00% - - - - (125,185) - (125,185) - - - -Buena Sanitation District Facilities (BSDF) - - 100.00% - - - (98,871) - - (98,871) - - -Raceway Basin Pump Station (RBPS) 100.00% - - - - - (25,815) (25,815) - - - - -Flow Metering System (Based on Type and Location of Required Meters)(272,782) (90,564) (57,011) (53,465) (19,913) (20,077) (31,752)TOTAL ACCUMULATED DEPRECIATION (119,356,558) (29,123,797) (29,166,752) (9,219,984) (24,114,098) (22,355,200) (5,376,727)INVESTMENT IN CAPITAL ASSETS $ 113,893,325 $ 37,154,594 $ 25,612,883 $ 5,084,767 $ 30,362,230 $ 12,285,583 See accompanying independent auditors’ report and notes to the financial statements.
ENCINA WASTEWATER AUTHORITYSUPPLEMENTARY SCHEDULE OF OPERATING PROGRAM BUDGET PERFORMANCEFOR THE YEAR ENDED JUNE 30, <strong>2012</strong>Adopted Revised % Actual toBudget Budget Actual $ Variance BudgetRevenues:Member Assessments $12,769,413 $12,797,288 $12,383,770 $413,518 96.8%Other 190,799 190,799 265,750 (74,951) 139.3%Total Revenues $12,960,212 $12,988,087 $12,649,520 $338,567 97.4%Expenses:Personnel Expense $7,004,318 $7,004,318 $7,320,808 ($316,490) 104.5%Chemicals 1,290,070 1,291,269 1,216,537 74,732 94.2%Biosolids 326,770 319,535 264,570 54,965 82.8%Utilities 2,085,587 2,063,362 1,760,641 302,721 85.3%Other 2,143,973 2,171,357 2,086,964 84,393 96.1%Contingency 264,000 264,000 - 264,000 0.0%Total Expenses $13,114,718 $13,113,841 $12,649,520 $464,321 96.5%See accompanying independent auditors’ report and notes to the financial statements.44
ENCINA WASTEWATER AUTHORITYSUPPLEMENTARY SCHEDULE OF OPERATING EXPENSES BY MAJOR CATEGORYFOR THE YEARS ENDED JUNE 30, <strong>2012</strong> AND 2011June 30, <strong>2012</strong> June 30, 2011 $ Variance % VariancePersonnel Expense $7,320,808 $7,069,441 $251,367 3.6%Chemicals 1,216,537 1,189,771 26,766 2.2%Biosolids 264,570 303,996 (39,426) -13.0%Utilities 1,760,641 1,984,695 (224,054) -11.3%Other Non-Personnel 2,086,964 2,055,378 31,586 1.5%Total $12,649,520 $12,603,281 $46,239 0.4%See accompanying independent auditors’ report and notes to the financial statements.45
ENCINA WASTEWATER AUTHORITYSUPPLEMENTARY SUMMARY SCHEDULE OFOPERATING PROGRAM AMOUNT DUE FROM/(TO) MEMBER AGENCIESAS OF AND FOR THE YEARS ENDED JUNE 30, <strong>2012</strong> AND 2011OPERATING REVENUES June 30, <strong>2012</strong> June 30, 2011Member Assessments Billed $ 11,946,494 $ 12,172,207CSRMA Dividends (Unit I Ownership) 70,388 58,772Biofuel Sales:Cemex Cement 29,611 39,298Other 13,326 1,150Lab Contract Services Receipts (Unit I Ownership) 125,404 154,245Environmental Enforcement Receipts (Jurisdiction) 14,830 16,970Miscellaneous Receipts (Unit I Ownership) 12,191 83,492TOTAL OPERATING REVENUES - BILLED $ 12,212,244 $ 12,526,134OPERATING EXPENSES INCURRED<strong>Encina</strong> Water Pollution Control FacilitiesUnit I - Treatment Plant Usage 5,904,095 5,809,849Unit I - Treatment Plant Ownership 3,754,456 3,800,212Unit J - Ocean Outfall 307,639 368,458Board of Directors 56,995 70,153Flow Metering 272,903 274,072<strong>Encina</strong> <strong>Wastewater</strong> Pollution Control Facilities Sub-Total $ 10,296,088 $ 10,322,744Source Control 623,461 591,609Agua Hedionda Pump Station 247,392 201,953Buena Vista Pump Station 348,184 343,044Buena Sanitation District Facilities 215,234 314,303Carlsbad Water Recycling Facility 772,107 703,253Raceway Basin Pump Station 147,054 126,375TOTAL OPERATING EXPENSES INCURRED $ 12,649,520 $ 12,603,281OPERATING REVENUES BILLED (OVER) UNDER EXPENSES INCURREDDUE FROM/(TO) MEMBER AGENCIES $ 437,276 $ 77,147AMOUNT DUE FROM/(T0) MEMBER AGENCIES END OF YEAR $ 437,276 $ 77,147See accompanying independent auditors’ report and notes to the financial statements.46
ENCINA WASTEWATER AUTHORITYSUPPLEMENTARY DETAIL SCHEDULE OF OPERATING PROGRAM AMOUNT DUE FROM/(TO) MEMBER AGENCIESAS OF AND FOR THE YEAR ENDED JUNE 30, <strong>2012</strong>TOTAL OPERATING REVENUES - BILLED $12,212,244 $2,894,508 $3,677,363 $1,122,452 $2,211,874 $1,780,750 $525,297Source Control $623,461 $178,681 $177,805 $93,709 $114,835 $39,054 $19,377Agua Hedionda Pump Station 247,392 170,948 76,444 - - - -Buena Vista Pump Station 348,184 311,973 36,211 - - - -Buena Sanitation District Facilities 215,234 - - 215,234 - - -Carlsbad Water Recycling Facility 772,107 - 772,107 - - - -Raceway Basin Pump Station 147,054 147,054 - - - - -TOTAL OPERATING EXPENSES $12,649,520 $2,972,735 $3,854,579 $1,219,645 $2,267,470 $1,787,779 $547,312DUE FROM (TO) MEMBER AGENCIES JUNE 30, <strong>2012</strong> $437,276 $78,227 $177,216 $97,193 $55,596 $7,029 $22,015Totals Vista Carlsbad Buena Vallecitos Leucadia EncinitasOPERATING REVENUES - BILLEDMember Assessments Billed $11,946,494 $2,839,518 $3,611,956 $1,098,222 $2,151,856 $1,732,004 $512,938CSRMA Dividends (Unit I Ownership) 70,388 15,211 17,463 5,744 14,246 14,317 3,407Biofuel Loads 42,937 7,444 12,410 2,868 11,481 6,442 2,292Lab Contract Services Billed (Unit I Ownership) 125,404 27,100 31,112 10,233 25,382 25,507 6,070Environmental Enforcement Actions Billed (Jurisdiction) 14,830 2,600 1,399 4,390 6,441 - -Miscellaneous Receipts (Unit I Ownership) 12,191 2,635 3,023 995 2,468 2,480 590OPERATING EXPENSES<strong>Encina</strong> Water Pollution Control FacilitiesPlant-Unit I Usage $5,904,095 $1,200,864 $1,705,745 $522,350 $1,286,580 $885,056 $303,500Plant-Unit I Ownership 3,754,456 811,338 931,480 306,364 759,902 763,656 181,716Outfall-Unit J 307,639 75,590 84,736 23,030 57,345 51,726 15,212Board of Directors 56,995 6,222 12,961 6,212 11,311 10,647 9,642Flow Metering 272,903 70,065 57,090 52,746 37,497 37,640 17,865<strong>Encina</strong> Water Pollution Control Facilities Sub-Total $10,296,088 $2,164,079 $2,792,012 $910,702 $2,152,635 $1,748,725 $527,935See accompanying independent auditors’ report and notes to the financial statements.
CITY OF VISTA June 30, <strong>2012</strong> % of Total June 30, 2011 Change $ Change %Unit I <strong>Encina</strong> Treatment Plant Usage $1,200,864 40.4% $1,280,479 ($79,615) -6.2%Unit I <strong>Encina</strong> Treatment Plant Ownership 811,338 27.3% 821,226 (9,888) -1.2%Unit J <strong>Encina</strong> Ocean Outfall 75,590 2.5% 95,171 (19,581) -20.6%Board of Directors 6,222 0.2% 6,663 (441) -6.6%Flow Metering 70,065 2.4% 70,364 (299) -0.4%Source Control 178,681 6.0% 163,797 14,884 9.1%Agua Hedionda Pump Station 170,948 5.8% 139,549 31,399 22.5%Buena Vista Pump Station 311,973 10.5% 307,367 4,606 1.5%Raceway Basin Pump Station 147,054 4.9% 126,375 20,679 16.4%TOTALS $2,972,735 100.0% $3,010,991 ($38,256) -1.3%ENCINA WASTEWATER AUTHORITYSUPPLEMENTARY SCHEDULE OF OPERATING PROGRAM EXPENSE - SUMMARY BY MEMBER AGENCYFOR THE YEARS ENDED JUNE 30, <strong>2012</strong> AND 2011CITY OF CARLSBADUnit I <strong>Encina</strong> Treatment Plant Usage $1,705,745 44.3% $1,726,013 ($20,268) -1.2%Unit I <strong>Encina</strong> Treatment Plant Ownership 931,480 24.2% 942,833 (11,353) -1.2%Unit J <strong>Encina</strong> Ocean Outfall 84,736 2.2% 106,066 (21,330) -20.1%Board of Directors 12,961 0.3% 15,080 (2,119) -14.1%Flow Metering 57,090 1.5% 57,336 (246) -0.4%Source Control 177,805 4.6% 171,908 5,897 3.4%Agua Hedionda Pump Station 76,444 2.0% 62,404 14,040 22.5%Buena Vista Pump Station 36,211 0.9% 35,677 534 1.5%Carlsbad Water Recycling Facility 772,107 20.0% 703,253 68,854 9.8%TOTALS $3,854,579 100.0% $3,820,570 $34,009 0.9%ContinuedSee accompanying independent auditors’ report and notes to the financial statements.
ENCINA WASTEWATER AUTHORITYSUPPLEMENTARY SCHEDULE OF OPERATING PROGRAM EXPENSE - SUMMARY BY MEMBER AGENCY (CONTINUED)FOR THE YEARS ENDED JUNE 30, <strong>2012</strong> AND 2011BUENA SANITATION DISTRICT June 30, <strong>2012</strong> % of Total June 30, 2011 Change $ Change %Unit I <strong>Encina</strong> Treatment Plant Usage $522,350 42.8% $495,833 $26,517 5.3%Unit I <strong>Encina</strong> Treatment Plant Ownership 306,364 25.1% 310,097 (3,733) -1.2%Unit J <strong>Encina</strong> Ocean Outfall 23,030 1.9% 26,709 (3,679) -13.8%Board of Directors 6,212 0.5% 6,664 (452) -6.8%Flow Metering 52,746 4.3% 52,972 (226) -0.4%Source Control 93,709 7.7% 97,289 (3,580) -3.7%Buena Sanitation District Facilities 215,234 17.6% 314,303 (99,069) -31.5%TOTALS $1,219,645 100.0% $1,303,867 ($84,222) -6.5%VALLECITOS WATER DISTRICTUnit I <strong>Encina</strong> Treatment Plant Usage $1,286,580 56.7% $1,170,943 $115,637 9.9%Unit I <strong>Encina</strong> Treatment Plant Ownership 759,902 33.5% 769,163 (9,261) -1.2%Unit J <strong>Encina</strong> Ocean Outfall 57,345 2.5% 64,143 (6,798) -10.6%Board of Directors 11,311 0.5% 13,348 (2,037) -15.3%Flow Metering 37,497 1.7% 37,657 (160) -0.4%Source Control 114,835 5.1% 107,342 7,493 7.0%TOTALS $2,267,470 100.0% $2,162,596 $104,874 4.8%ContinuedSee accompanying independent auditors’ report and notes to the financial statements.
ENCINA WASTEWATER AUTHORITYSUPPLEMENTARY SCHEDULE OF OPERATING PROGRAM EXPENSE - SUMMARY BY MEMBER AGENCY (CONTINUED)FOR THE YEARS ENDED JUNE 30, <strong>2012</strong> AND 2011LEUCADIA WASTEWATER DISTRICT June 30, <strong>2012</strong> % of Total June 30, 2011 Change $ Change %Unit I <strong>Encina</strong> Treatment Plant Usage $885,056 49.5% $850,326 $34,730 4.1%Unit I <strong>Encina</strong> Treatment Plant Ownership 763,656 42.7% 772,963 (9,307) -1.2%Unit J <strong>Encina</strong> Ocean Outfall 51,726 2.9% 60,151 (8,425) -14.0%Board of Directors 10,647 0.6% 14,664 (4,017) -27.4%Flow Metering 37,640 2.1% 37,801 (161) -0.4%Source Control 39,054 2.2% 37,318 1,736 4.7%TOTALS $1,787,779 100.0% $1,773,223 $14,556 0.8%Total Operating Expense All Member Agencies $12,649,520 $12,603,281 $46,239 0.4%CITY OF ENCINITASUnit I <strong>Encina</strong> Treatment Plant Usage $303,500 55.5% $286,255 $17,245 6.0%Unit I <strong>Encina</strong> Treatment Plant Ownership 181,716 33.2% 183,930 (2,214) -1.2%Unit J <strong>Encina</strong> Ocean Outfall 15,212 2.8% 16,218 (1,006) -6.2%Board of Directors 9,642 1.8% 13,734 (4,092) -29.8%Flow Metering 17,865 3.3% 17,942 (77) -0.4%Source Control 19,377 3.5% 13,955 5,422 38.9%TOTALS $547,312 100.0% $532,034 $15,278 2.9%See accompanying independent auditors’ report and notes to the financial statements.
UNIT I: ENCINA TREATMENT PLANT USAGE June 30, <strong>2012</strong> % of Total June 30, 2011 Change $ Change %City of Vista $1,200,864 20.3% $1,280,479 ($79,615) -6.2%City of Carlsbad 1,705,745 28.9% 1,726,013 (20,268) -1.2%Buena Sanitation District 522,350 8.8% 495,833 26,517 5.3%Vallecitos Water District 1,286,580 21.8% 1,170,943 115,637 9.9%Leucadia <strong>Wastewater</strong> District 885,056 15.0% 850,326 34,730 4.1%City of Encinitas 303,500 5.1% 286,255 17,245 6.0%TOTALS $5,904,095 100.0% $5,809,849 $94,246 1.6%ENCINA WASTEWATER AUTHORITYSUPPLEMENTARY SCHEDULE OF OPERATING PROGRAM EXPENSE - SUMMARY BY COST CENTERFOR THE YEARS ENDED JUNE 30, <strong>2012</strong> AND 2011UNIT I: ENCINA TREATMENT PLANT OWNERSHIPCity of Vista $811,338 21.6% $821,226 ($9,888) -1.2%City of Carlsbad 931,480 24.8% 942,833 (11,353) -1.2%Buena Sanitation District 306,364 8.2% 310,097 (3,733) -1.2%Vallecitos Water District 759,902 20.2% 769,163 (9,261) -1.2%Leucadia <strong>Wastewater</strong> District 763,656 20.3% 772,963 (9,307) -1.2%City of Encinitas 181,716 4.8% 183,930 (2,214) -1.2%TOTALS $3,754,456 100.0% $3,800,212 ($45,756) -1.2%UNIT J: ENCINA OCEAN OUTFALLCity of Vista $75,590 24.6% $95,171 ($19,581) -20.6%City of Carlsbad 84,736 27.5% 106,066 (21,330) -20.1%Buena Sanitation District 23,030 7.5% 26,709 (3,679) -13.8%Vallecitos Water District 57,345 18.6% 64,143 (6,798) -10.6%Leucadia <strong>Wastewater</strong> District 51,726 16.8% 60,151 (8,425) -14.0%City of Encinitas 15,212 4.9% 16,218 (1,006) -6.2%TOTALS $307,639 100.0% $368,458 ($60,819) -16.5%ContinuedSee accompanying independent auditors’ report and notes to the financial statements.
ENCINA WASTEWATER AUTHORITYSUPPLEMENTARY SCHEDULE OF OPERATING PROGRAM EXPENSE - SUMMARY BY COST CENTER (CONTINUED)FOR THE YEARS ENDED JUNE 30, <strong>2012</strong> AND 2011BOARD OF DIRECTORS June 30, <strong>2012</strong> % of Total June 30, 2011 Change $ Change %City of Vista $6,222 10.9% $6,663 ($441) -6.6%City of Carlsbad 12,961 22.7% 15,080 (2,119) -14.1%Buena Sanitation District 6,212 10.9% 6,664 (452) -6.8%Vallecitos Water District 11,311 19.8% 13,348 (2,037) -15.3%Leucadia <strong>Wastewater</strong> District 10,647 18.7% 14,664 (4,017) -27.4%City of Encinitas 9,642 16.9% 13,734 (4,092) -29.8%TOTALS $56,995 100.0% $70,153 ($13,158) -18.8%FLOW METERING PROGRAMCity of Vista $70,065 25.7% $70,364 ($299) -0.4%City of Carlsbad 57,090 20.9% 57,336 (246) -0.4%Buena Sanitation District 52,746 19.3% 52,972 (226) -0.4%Vallecitos Water District 37,497 13.7% 37,657 (160) -0.4%Leucadia <strong>Wastewater</strong> District 37,640 13.8% 37,801 (161) -0.4%City of Encinitas 17,865 6.5% 17,942 (77) -0.4%TOTALS $272,903 100.0% $274,072 ($1,169) -0.4%TOTAL ENCINA WATER POLLUTION CONTROL FACILITIESCity of Vista $2,164,079 21.0% $2,273,903 ($109,824) -4.8%City of Carlsbad 2,792,012 27.1% 2,847,328 (55,316) -1.9%Buena Sanitation District 910,702 8.8% 892,275 18,427 2.1%Vallecitos Water District 2,152,635 20.9% 2,055,254 97,381 4.7%Leucadia <strong>Wastewater</strong> District 1,748,725 17.0% 1,735,905 12,820 0.7%City of Encinitas 527,935 5.1% 518,079 9,856 1.9%TOTALS $10,296,088 100.0% $10,322,744 ($26,656) -0.3%ContinuedSee accompanying independent auditors’ report and notes to the financial statements.
ENCINA WASTEWATER AUTHORITYSUPPLEMENTARY SCHEDULE OF OPERATING PROGRAM EXPENSE - SUMMARY BY COST CENTER (CONTINUED)FOR THE YEARS ENDED JUNE 30, <strong>2012</strong> AND 2011SOURCE CONTROL PROGRAM June 30, <strong>2012</strong> % of Total June 30, 2011 Change $ Change %City of Vista $178,681 28.7% $163,797 $14,884 9.1%City of Carlsbad 177,805 28.5% 171,908 5,897 3.4%Buena Sanitation District 93,709 15.0% 97,289 (3,580) -3.7%Vallecitos Water District 114,835 18.4% 107,342 7,493 7.0%Leucadia <strong>Wastewater</strong> District 39,054 6.3% 37,318 1,736 4.7%City of Encinitas 19,377 3.1% 13,955 5,422 38.9%TOTALS $623,461 100.0% $591,609 $31,852 5.4%AGUA HEDIONDA PUMP STATIONCity of Vista $170,948 69.1% $139,549 $31,399 22.5%City of Carlsbad 76,444 30.9% 62,404 14,040 22.5%TOTALS $247,392 100.0% $201,953 $185,132 91.7%BUENA VISTA PUMP STATIONCity of Vista $311,973 89.6% $307,367 $4,606 1.5%City of Carlsbad 36,211 10.4% 35,677 534 1.5%TOTALS $348,184 100.0% $343,044 $5,140 1.5%BUENA SANITATION DISTRICT FACILITIESBuena Sanitation District $215,234 100.0% $314,303 ($99,069) -31.5%TOTALS $215,234 100.0% $314,303 ($99,069) -31.5%ContinuedSee accompanying independent auditors’ report and notes to the financial statements.
ENCINA WASTEWATER AUTHORITYSUPPLEMENTARY SCHEDULE OF OPERATING PROGRAM EXPENSE - SUMMARY BY COST CENTER (CONTINUED)FOR THE YEARS ENDED JUNE 30, <strong>2012</strong> AND 2011June 30, <strong>2012</strong> % of Total June 30, 2011 Change $ Change %CARLSBAD WATER RECYCLING FACILITYCity of Carlsbad $772,107 100.0% $703,253 $68,854 9.8%TOTALS $772,107 100.0% $703,253 $68,854 9.8%RACEWAY BASIN PUMP STATIONCity of Vista $147,054 100.0% $126,375 $20,679 16.4%TOTALS $147,054 100.0% $126,375 $20,679 16.4%TOTAL OPERATING EXPENSECity of Vista $2,972,735 23.5% $3,010,991 ($38,256) -1.3%City of Carlsbad 3,854,579 30.5% 3,820,570 34,009 0.9%Buena Sanitation District 1,219,645 9.6% 1,303,867 (84,222) -6.5%Vallecitos Water District 2,267,470 17.9% 2,162,596 104,874 4.8%Leucadia <strong>Wastewater</strong> District 1,787,779 14.1% 1,773,223 14,556 0.8%City of Encinitas 547,312 4.3% 532,034 15,278 2.9%TOTALS $12,649,520 100.0% $12,603,281 $46,239 0.4%See accompanying independent auditors’ report and notes to the financial statements.
ENCINA WASTEWATER AUTHORITYSUPPLEMENTARY SCHEDULE OF CHANGES IN NET ASSETS RESTRICTED -CAPITAL IMPROVEMENT PROGRAMAS OF AND FOR THE YEARS ENDED JUNE 30, <strong>2012</strong> AND 2011June 30, <strong>2012</strong> June 30, 2011CAPITAL CONTRIBUTIONSMember Assessments $ 7,806,170 $ 5,877,873TOTAL CAPITAL CONTRIBUTIONS 7,806,170 5,877,873CAPITAL EXPENSES (CREDITS)<strong>Encina</strong> Water Pollution Control Facility(EWPCF) Capital Acquisitions 399,597 519,427Agua Hedionda Pump Station (AHPS) Capital Acquisitions 46,612 46,001Buena Vista Pump Station (BVPS) Capital Acquisitions 48,085 64,835Buena Sanitation District (BSD) Capital Acquisitions 43,003 65,319Carlsbad Water Reclamation Facility (CWRF) Capital Acquisitions 56,595 13,400Raceway Basin Pump Station (RBPS) Capital Acquisitions 41,281 31,353EWPCF Planned Asset Replacement 1,153,111 893,105EWPCF Major Plant Rehabilitation Program 6,437,714 4,113,111South Parcel Development 107,521 18,335Financial Enterprise Software System 59,109 108,841Professional Services 173,127 473,358TOTAL CAPITAL EXPENSES 8,565,755 6,347,085CAPITAL CONTRIBUTIONS OVER (UNDER) CAPITAL EXPENSES (759,585) (469,212)NON-OPERATING INCOMEInvestment Income & Other 16,791 24,740NET ASSETS RESTRICTED FOR CIP, BEGINNING OF FISCAL YEAR 8,366,771 8,811,243NET ASSETS RESTRICTED FOR CIP, END OF FISCAL YEAR $ 7,623,977 $ 8,366,771See accompanying independent auditors’ report and notes to the financial statements.55
ENCINA WASTEWATER AUTHORITYSUPPLEMENTARY SCHEDULE OF NET ASSETS RESTRICTED BY PROJECT - CAPITAL IMPROVEMENT PROGRAMAS OF AND FOR THE YEAR ENDED JUNE 30, <strong>2012</strong>Balance Member Capital BalancePROJECTS 6/30/2011 Billings Income Expenses 6/30/<strong>2012</strong>PHASE V EXPANSION $ 2,295,184 $ - $ - $ - $ 2,295,184SOUTH PARCEL DEVELOPMENT - 107,521 - (107,521) - *EWPCF MAJOR PLANT REHABILITATION PROGRAM - 5,934,209 - (6,437,714) (503,505) *FINANCIAL ENTERPRISE SOFTWARE SYSTEM - 22,887 - (59,109) (36,222) *PROFESSIONAL SERVICES - 136,601 - (173,127) (36,526) *SUB TOTAL CONTINUING PROJECTS 2,295,184 6,201,218 - (6,777,471) 1,718,931CAPITAL ACQUISITIONS - 578,709 - (635,173) (56,464) *PLANNED ASSET REPLACEMENT - 1,097,830 - (1,153,111) (55,281) *CAPITAL RESERVE 6,000,000 - - - 6,000,000INCOME ON CAPITAL RESERVE FUNDS - - 16,791 - 16,791 *AMOUNTS DUE FROM (TO) MEMBERS FOR COMPLETEDPROJECTS AND INCOME ALLOCATION 71,587 (71,587) - - -SUB TOTAL OTHER 6,071,587 1,604,952 16,791 (1,788,284) 5,905,046TOTAL CAPITAL IMPROVEMENT PROGRAM $ 8,366,771 $ 7,806,170 $ 16,791 $ (8,565,755) $ 7,623,977* Indicates amounts due (from)/to Member Agencies $ (671,207) *CONTINUING PROJECTSOTHERSee accompanying independent auditors’ report and notes to the financial statements.
ENCINA WASTEWATER AUTHORITYSUPPLEMENTARY SCHEDULE OF NET ASSETS RESTRICTED BY MEMBER AGENCY - CAPITAL IMPROVEMENT PROGRAMAS OF JUNE 30, <strong>2012</strong>PROJECTS Vista Carlsbad Buena Vallecitos Leucadia Encinitas 6/30/<strong>2012</strong>PHASE V EXPANSION $ 993,815 $ 459,266 $ - $ 820,758 $ - $ 21,345 $ 2,295,184SOUTH PARCEL MASTER PLAN - - - - - - - *MAJOR PLANT REHABILITATION PROGRAM (108,807) (124,920) (41,086) (101,909) (102,413) (24,370) (503,505) *FINANCIAL ENTERPRISE SOFTWARE SYSTEM (7,828) (8,986) (2,956) (7,331) (7,368) (1,753) (36,222) *PROFESSIONAL SERVICES (7,893) (9,062) (2,981) (7,393) (7,429) (1,768) (36,526) *SUB TOTAL CONTINUING PROJECTS 869,287 316,298 (47,023) 704,125 (117,210) (6,546) 1,718,931CAPITAL ACQUISITIONS (12,202) (14,009) (4,607) (11,428) (11,485) (2,733) (56,464) *PLANNED ASSET REPLACEMENT (11,946) (13,715) (4,511) (11,189) (11,244) (2,676) (55,281) *CAPITAL RESERVE 2,032,447 1,324,606 212,850 1,742,286 530,559 157,252 6,000,000INCOME ON CAPITAL RESERVE FUNDS 3,629 4,166 1,370 3,398 3,415 813 16,791 *SUB TOTAL OTHER 2,011,928 1,301,048 205,102 1,723,067 511,245 152,656 5,905,046TOTAL CAPITAL IMPROVEMENT PROGRAM $ 2,881,215 $ 1,617,346 $ 158,079 $ 2,427,192 $ 394,035 $ 146,110 7,623,977* Indicates amounts due (from)/to Member Agencies ($ 145,048) ($ 166,526 ) ($ 5 4,770) ($ 135,852) ($ 136,524) ($ 32,486) (671,207) *BalanceCONTINUING PROJECTSOTHERSee accompanying independent auditors’ report and notes to the financial statements.
CONTINUINGAPPROPRIATIONSJULY 1, <strong>2012</strong>SALARIES & BENEFITS $ $ - $ 1,744,239 $ - $ - $ (1,580,150) $ - $ 164,089 -EWPCF CAPITAL ACQUISTIONS 63,338 356,132 12,500 - - (399,597) 32,373 32,373AHPS CAPITAL ACQUISTIONS 29,268 39,500 - - - (46,612) 22,156 22,156BVPS CAPITAL ACQUISTIONS 8,847 77,956 - - - (48,085) 38,718 38,718BSD CAPITAL ACQUISTIONS 2,391 75,500 - - - (43,003) 34,888 34,888CWRF CAPITAL ACQUISITIONS 8,729 49,500 - - - (56,595) 1,634 1,634RBPS CAPITAL ACQUISITIONS 11,846 29,300 - - - (41,281) (135) -PLANNED ASSET REPLACEMENT 237,014 610,850 (1) - 528,791 (1,153,111) 223,543 223,543MAJOR PLANT REHAB PROGRAM 4,381,004 4,644,000 (116,874) 152,495 1,024,514 (6,437,714) 3,647,425 3,628,909PHASE V EXPANSION - - - - - - - -SOUTH PARCEL MASTER PLAN 5,000 75,000 36,597 2,578 17,322 (107,521) 28,976 29,000FINANCIAL ENTERPRISE SOFTWARE 67,503 - - 1,417 9,523 (59,109) 19,334 19,500PROFESSIONAL SERVICES 264,343 - 67,778 (156,490) - (173,127) 2,504 -TOTAL $ 5,079,283 $ 7,701,977 $ - $ - $ - $ (8,565,755) $ 4,215,505 $ 4,030,721(Continued)ENCINA WASTEWATER AUTHORITYSUPPLEMENTARY SCHEDULE OF CONTINUING CAPITAL IMPROVEMENT PROGRAM APPROPRIATIONSAS OF AND FOR THE YEAR ENDED JUNE 30, <strong>2012</strong>BY PROJECTCONTINUINGAPPROPRIATIONSBEGINNING OFYEAR REPORTEDFY <strong>2012</strong> NEWAPPROPRIATIONSTRANSFERSIN(OUT)ALLOCATEDPROFESSIONALSERVICEEXPENSESALLOCATEDPERSONNELEXPENSETOTALCAPITALEXPENSESAPPROPRIATIONBALANCES ONJUNE 30, <strong>2012</strong>See accompanying independent auditors’ report and notes to the financial statements.
ENCINA WASTEWATER AUTHORITYSUPPLEMENTARY SCHEDULE OF CONTINUING CAPITAL IMPROVEMENT PROGRAM APPROPRIATIONS (CONTINUED)AS OF AND FOR THE YEAR ENDED JUNE 30, <strong>2012</strong>BY MEMBER AGENCY VISTA CARLSBAD BUENA VALLECITOS LEUCADIA ENCINITAS TOTALEWPCF CAPITAL ACQUISTIONS $ $ 6,996 $ 8,031 $ 2,642 $ 6,552 $ 6,585 $ 1,567 32,373AHPS CAPITAL ACQUISTIONS 15,310 6,846 - - - - 22,156BVPS CAPITAL ACQUISTIONS 34,691 4,027 - - - - 38,718BSD CAPITAL ACQUISITIONS - - 34,888 - - - 34,888CWRF CAPITAL ACQUISITIONS - 1,634 - - - - 1,634RBPS CAPITAL ACQUISITIONS - - - - - - -PLANNED ASSET REPLACEMENT 48,308 55,461 18,241 45,245 45,469 10,819 223,543MAJOR PLANT REHAB PROGRAM 784,207 900,333 296,119 734,491 738,120 175,639 3,628,909SOUTH PARCEL MASTER PLAN 6,267 7,194 2,366 5,870 5,899 1,404 29,000FINANCIAL ENTERPRISE SOFTWARE 4,214 4,838 1,591 3,947 3,966 944 19,500PROFESSIONAL SERVICES - - - - - - -TOTAL $ 899,993 $ 988,364 $ 355,847 $ 796,105 $ 800,039 $ 190,373 $ 4,030,721See accompanying independent auditors’ report and notes to the financial statements.
STATISTICAL SECTIONOverviewNet AssetsChanges in Net AssetsInvestment in Capital AssetsDemographic and Economic InformationFacts and FiguresFull‐time Equivalent Employees by FunctionOperating Revenues & Expenses by Major Source & UseOperating Revenues & Expenses by Member AgenciesOperating Expenses per Million Gallons
THIS PAGE IS INTENTIONALLY LEFT BLANK
ENCINA WASTEWATER AUTHORITYStatistical Section OverviewJune 30, <strong>2012</strong>This part of the <strong>Encina</strong> <strong>Wastewater</strong> <strong>Authority</strong>’s comprehensive annual financial report presents detailedinformation as a context for understanding what the information in the financial statements, notedisclosures, and other supplementary information says about the <strong>Authority</strong>’s overall financial health.Financial TrendsThese schedules contain trend information to help the reader understand how the <strong>Authority</strong>’s financialperformance and well-being have changed over time.• Net Assets• Changes in Net Assets• Investment in Capital AssetsRevenue CapacityThe principal source of revenue to the <strong>Authority</strong> is assessments to Member Agencies for reimbursementof expenses; therefore an analysis of revenue capacity is not applicable. Data on sources of revenue ispresented in this section under Operating Information.Debt CapacityThe <strong>Authority</strong> does not currently maintain any long-term debt and has not maintained any debt in thepast ten years; therefore information on debt capacity is not applicable.Demographic and Economic InformationThis information offers demographic and economic indicators to help the reader understand theenvironment within which the <strong>Authority</strong>’s financial activities take place.• Population and Property Data• Principal Employers• Principal Property TaxpayersOperating InformationThese schedules contain service and infrastructure data to help the reader understand how theinformation in the <strong>Authority</strong>’s financial report relates to the services the government provides and theactivities it performs.• Facts and Figures• Full-time Equivalent Employees by Function• Operating Revenues and Expenses by Major Source and Use• Operating Revenues and Expenses by Member Agency• Operating Expenses per Million Gallons60
ENCINA WASTEWATER AUTHORITYNet AssetsLast Ten Fiscal YearsFiscal YearInvested in CapitalAssetsRestricted forCapital Program Unrestricted Total<strong>2012</strong> $ 113,893,325 $ 7,623,977 $ 2,000,000 $ 123,517,3022011 114,067,928 8,366,771 2,000,000 124,434,6992010 114,030,234 8,811,243 2,000,000 124,841,4772009 116,243,485 8,735,897 2,000,000 126,979,3822008 109,246,020 11,447,317 1,150,000 121,843,3372007 82,063,943 16,843,037 1,150,000 100,056,9802006 61,493,550 9,840,344 950,000 72,283,8942005 53,395,006 8,492,700 950,000 62,837,7062004 45,048,381 6,067,008 950,000 52,065,3892003 42,171,404 2,649,238 950,000 45,770,642$140,000,000$120,000,000$100,000,000$80,000,000$60,000,000$40,000,000$20,000,000$‐2004200620082010<strong>2012</strong>FISCAL YEARInvested in Capital AssetsRestricted for Capital ProgramUnrestrictedSource:Notes:<strong>Encina</strong> <strong>Wastewater</strong> <strong>Authority</strong>(1) FY 2010 & 2011 reflect higher depreciation resulting from siginificant capital assets additions in FY 2008 & 2009(2) FY 2010 reflects Phase V Expansion, Major Plant Rehabilitilation, and Enterprise Software Capital Projects(3) FY 2009 reflects Phase V Expansion Capital Project and $850k addition to unrestricted(4) FY 2006 ‐ FY 2008 reflects Building Program & Phase V Expansion Capital Projects and $200k addition to unrestricted(5) FY 2004 and FY 2005 reflect Flow Equalization & Phase V Expansion Capital Projects61
ENCINA WASTEWATER AUTHORITYChanges in Net AssetsLast Ten Fiscal Year 64<strong>2012</strong> 2011 2010 2009 2008 2007 2006 2005 2004 2003Operating RevenuesMember Agency Assessments $ 12,383,770 $ 12,249,354 $ 12,863,096 $ 14,102,536 $ 12,121,439 $ 10,957,510 $ 10,314,123 $ 9,128,174 $ 8,502,453 $ 8,219,882Other Operating Revenues 265,750 353,927 285,687 265,631 375,861 491,799 259,135 238,159 260,358 214,547Total Operating Revenues 12,649,520 12,603,281 13,148,783 14,368,167 12,497,300 11,449,309 10,573,258 9,366,333 8,762,811 8,434,429Operating ExpensesUnit I ‐ <strong>Encina</strong> Plant Usage Costs 5,904,095 5,809,849 5,868,376 7,156,812 6,365,465 5,779,545 5,344,354 4,880,692 4,220,986 4,012,722Unit I ‐ <strong>Encina</strong> Plant Ownership Costs 3,754,456 3,800,212 4,265,355 4,097,609 3,560,154 3,018,165 3,022,396 2,887,940 2,990,990 2,796,413Unit J ‐ <strong>Encina</strong> Ocean Outfall 307,639 368,458 357,122 413,552 248,726 232,779 237,049 190,614 189,695 46,301Director's Meetings 56,995 70,153 58,666 61,056 55,979 40,121 39,724 36,888 39,160 20,709Flow Metering 272,903 274,072 255,636 245,743 367,521 298,569 141,446 130,592 125,043 107,102Subtotal <strong>Encina</strong> <strong>Wastewater</strong>Pollution Control Facilities (EWPCF) 10,296,088 10,322,744 10,805,155 11,974,772 10,597,845 9,369,179 8,784,969 8,126,726 7,565,874 6,983,247Source Control 623,461 591,609 587,539 517,222 457,500 383,060 449,814 415,156 448,724 404,781Aqua Hedionda Pump Station 247,392 201,954 238,502 244,177 206,733 275,102 244,939 187,485 170,428 149,903Buena Vista Pump Station 348,184 343,044 335,451 370,135 340,290 379,484 293,613 304,069 274,271 261,614Buena Sanitation District Facilities 215,234 314,303 321,524 354,886 320,629 337,799 294,416 279,040 303,514 634,884Carlsbad Water Reclamation Facilities 772,107 703,252 733,358 739,851 693,992 607,207 505,507 53,857 ‐ ‐Raceway Basin Pump Station 147,054 126,375 127,254 167,124 139,377 97,478 ‐ ‐ ‐ ‐Depreciation 7,899,653 6,259,835 5,986,307 3,896,846 3,938,033 3,379,760 2,259,507 2,190,852 2,200,755 2,173,759Total Operating Expenses 20,549,173 18,863,116 19,135,090 18,265,013 16,694,399 14,829,069 12,832,765 11,557,185 10,963,566 10,608,188Operating Income (Loss) (7,899,653) (6,259,835) (5,986,307) (3,896,846) (4,197,099) (3,379,760) (2,259,507) (2,190,852) (2,200,755) (2,173,759)Nonoperating Revenues (Expenses)Net Gain (Loss) on Disposal of Capital Ass (840,705) (49,556) (849,393) (280,556) 75,400 (171,835) (223,340) (191,881) 895,114 120,592Investment & Other Capital Income 16,791 24,740 39,902 145,507 369,200 387,251 172,100 80,884 26,529 27,470Other Nonoperating Revenues ‐ ‐ ‐ 850,000 ‐ 200,000 ‐ 100,000 75,829 18,214Total Nonoperating Revenues (Expenses) (823,914) (24,816) (809,491) 714,951 444,600 415,416 (51,240) (10,997) 997,472 166,276Income (Loss) Before Contributions (8,723,567) (6,284,651) (6,795,798) (3,181,895) (3,752,499) (2,964,344) (2,310,747) (2,201,849) (1,203,283) (2,007,483)Capital ContributionsMember Agency Assessments 7,806,170 5,877,873 4,657,893 8,317,940 29,538,856 30,737,430 11,756,935 12,974,166 7,498,030 2,208,007Distributions to Member Agencies ‐ ‐ ‐ ‐ (4,000,000) ‐ ‐ ‐ ‐ (300,000)Total Capital Contributions 7,806,170 5,877,873 4,657,893 8,317,940 25,538,856 30,737,430 11,756,935 12,974,166 7,498,030 1,908,007Increase (Decrease) in Net Assets $ (917,397) $ (406,778) $ (2,137,905) $ 5,136,045 $ 21,786,357 $ 27,773,086 $ 9,446,188 $ 10,772,317 $ 6,294,747 $ (99,476)Source: <strong>Encina</strong> <strong>Wastewater</strong> <strong>Authority</strong>Notes:(1) FY 2010: Capital Revenues decreased due to Phase V Expansion project completion. Depreciation expense doubled from prior years due to capitalization of Phase V Expansion construction.(2) FY 2009: EWPCF operating expense higher than usual due to Phase V Expansion project start‐up activities.(3) FY 2009: Capital Revenues decreased due to substantial completion of Phase V Expansion (6) FY 2007: Depreciation increase due to completion of Flow Equalization(4) FY 2008: Capital Revenues decreased due to completion of Building Program (7) FY 2007 & 2009: Other Nonoperating Revenues represent Financial Reserve Contributions(5) FY 2007: Capital Revenues increased due to commencement of two large capital facility projects
ENCINA WASTEWATER AUTHORITYChanges in Net Assets (in thousands)Last Ten Fiscal Years<strong>2012</strong> 2011 2010 2009 2008 2007 2006 2005 2004 2003Operating RevenuesMember Agency Assessments $ 12,384 $ 12,249 $ 12,863 $ 14,103 $ 12,121 $ 10,958 $ 10,314 $ 9,128 $ 8,502 $ 8,220Other Operating Revenues 266 354 286 266 376 492 259 238 260 215Total Operating Revenues 12,650 12,603 13,149 14,368 12,497 11,449 10,573 9,366 8,763 8,434Operating ExpensesUnit I ‐ <strong>Encina</strong> Plant Usage Costs 5,904 5,810 5,868 7,157 6,365 5,780 5,344 4,881 4,221 4,013Unit I ‐ <strong>Encina</strong> Plant Ownership Costs 3,754 3,800 4,265 4,098 3,560 3,018 3,022 2,888 2,991 2,796Unit J ‐ <strong>Encina</strong> Ocean Outfall 308 368 357 414 249 233 237 191 190 46Director's Meetings 57 70 59 61 56 40 40 37 39 21Flow Metering 273 274 256 246 368 299 141 131 125 107Subtotal <strong>Encina</strong> <strong>Wastewater</strong>Pollution Control Facilities (EWPCF) 10,296 10,323 10,805 11,975 10,598 9,369 8,785 8,127 7,566 6,983Source Control 623 592 588 517 458 383 450 415 449 405Aqua Hedionda Pump Station 247 202 239 244 207 275 245 187 170 150Buena Vista Pump Station 348 343 335 370 340 379 294 304 274 262Buena Sanitation District Facilities 215 314 322 355 321 338 294 279 304 635Carlsbad Water Reclamation Facilities 772 703 733 740 694 607 506 54 ‐ ‐Raceway Basin Pump Station 147 126 127 167 139 97 ‐ ‐ ‐ ‐Depreciation 7,900 6,260 5,986 3,897 3,938 3,380 2,260 2,191 2,201 2,174Total Operating Expenses 20,549 18,863 19,135 18,265 16,694 14,829 12,833 11,557 10,964 10,608Operating Income (Loss) (7,900) (6,260) (5,986) (3,897) (4,197) (3,380) (2,260) (2,191) (2,201) (2,174)Nonoperating Revenues (Expenses)Net Gain (Loss) on Disposal of Capital Assets (841) (50) (849) (281) 75 (172) (223) (192) 895 121Investment & Other Capital Income 17 25 40 146 369 387 172 81 27 27Other Nonoperating Revenues ‐ ‐ ‐ 850 ‐ 200 ‐ 100 76 18Total Nonoperating Revenues (Expenses) (824) (25) (809) 715 445 415 (51) (11) 997 166Income (Loss) Before Contributions (8,724) (6,285) (6,796) (3,182) (3,752) (2,964) (2,311) (2,202) (1,203) (2,007)Capital ContributionsMember Agency Assessments 7,806 5,878 4,658 8,318 29,539 30,737 11,757 12,974 7,498 2,208Distributions to Member Agencies ‐ ‐ ‐ ‐ (4,000) ‐ ‐ ‐ ‐ (300)Total Capital Contributions 7,806 5,878 4,658 8,318 25,539 30,737 11,757 12,974 7,498 1,908Increase (Decrease) in Net Assets $ (917) $ (407) $ (2,138) $ 5,136 $ 21,786 $ 27,773 $ 9,446 $ 10,772 $ 6,295 $ (99)Source: <strong>Encina</strong> <strong>Wastewater</strong> <strong>Authority</strong>Notes:(1) FY 2010: Capital Revenues decreased from prior year resulting from Phase V Expansion project completion. Depreciation expense doubled from prior years due to capitalization of Phase V Expansion construction.(2) FY 2009: EWPCF operating expense higher than usual due to Phase V Expansion project start‐up activities.(3) FY 2009: Capital Revenues decreased from prior year resulting from substantial completion of Phase V Expansion project(4) FY 2008: Capital Revenues decreased from prior year resulting from completion of the Building Program(5) FY 2007: Capital Revenues increased from prior years due to commencement of two large capital facility projects(6) FY 2007: Depreciation increased from prior years due to completion and capitzliation of the Flow Equalization facility.(7) Other Nonoperating 5 Revenues in FY 2009 and FY 2007 represent Financial Reserve Contributions
ENCINA WASTEWATER AUTHORITYInvestment in Capital AssetsLast Ten Fiscal YearsBy FunctionFiscalYearTreatment Plant(1) Ocean Outfall (2) Remote Facilities (3) Equipment (4) Real Property (5)Construction inProgressAccumulatedDepreciationTotal<strong>2012</strong> $ 202,104,971 $ 14,102,005 $ 6,749,955 $ 2,640,451 $ 3,598,173 $ 4,054,328 $ (119,356,558) $ 113,893,3252011 196,253,370 14,102,005 6,581,287 2,412,009 3,598,173 3,509,708 (112,388,624) 114,067,9282010 192,795,916 14,102,005 6,433,787 2,184,049 3,598,173 1,658,195 (106,741,892) 114,030,2342009 139,467,581 13,766,644 6,384,089 2,004,015 3,598,173 56,596,253 (105,573,270) 116,243,4852008 139,229,814 13,766,644 6,103,717 1,801,898 3,598,173 46,749,390 (102,003,617) 109,246,0202007 122,413,852 13,766,644 5,959,437 1,114,997 3,598,173 38,017,368 (102,806,528) 82,063,9432006 120,811,650 13,766,644 5,716,899 982,223 3,598,173 16,344,456 (99,726,495) 61,493,5502005 106,916,302 13,766,644 5,618,737 996,616 3,598,173 20,306,367 (97,807,833) 53,395,0062004 106,690,633 13,766,644 5,549,864 987,160 3,598,173 10,527,457 (96,071,550) 45,048,3812003 105,892,042 13,766,644 5,462,951 967,129 5,624,008 4,967,067 (94,508,437) 42,171,404By Member AgencyFiscalYear Vista Carlsbad Buena Vallecitos Leucadia Encinitas Total<strong>2012</strong> $ 37,154,594 $ 25,612,883 $ 5,084,767 $ 30,362,230 $ 12,285,583 $ 3,393,268 $ 113,893,3252011 37,687,907 25,537,838 4,915,342 30,714,365 11,893,406 3,319,070 114,067,9282010 38,173,642 25,445,003 4,709,713 31,017,162 11,451,647 3,233,072 114,030,2342009 38,917,534 25,916,556 4,832,144 31,571,047 11,704,705 3,301,500 116,243,4852008 35,362,569 24,557,479 5,011,463 28,745,540 12,229,771 3,339,199 109,246,0202007 23,457,660 19,146,400 5,007,909 18,900,822 12,369,231 3,111,921 81,993,9432006 14,949,461 14,918,740 4,899,249 11,893,673 11,988,501 2,843,926 61,493,5502005 13,036,658 12,995,471 4,324,089 10,213,877 10,383,160 2,441,751 53,395,0062004 10,858,056 11,359,563 3,580,072 8,543,514 8,664,623 2,042,553 45,048,3812003 10,375,865 10,543,361 3,318,865 7,964,010 8,062,438 1,906,865 42,171,404Source: <strong>Encina</strong> <strong>Wastewater</strong> <strong>Authority</strong>Notes: <strong>2012</strong> capital assets include:(1) Heat loop pump, chlorine containment upgrades, compressor for heat dryer building, aeration air piping replacement, financial software(2) Ten primary clarifiers, four aeration basins, six digesters, eight secondary clarifiers, three dissolved airfloatation tanks, one regenerative thermal oxidizer, four cogeneration engines, and ten buildings(3) One effluent pump station and the ocean outfall pipe which extends 1.5 miles offshore(4) Three pump stations, one (1) water reclamation facility and one (1) sanitation facility(5) Furnishings, office equipment, and flow metering system(6) The South Parcel (undeveloped) and the <strong>Encina</strong> Water Pollution Control Facilities. In FY 2004, 39.52 acres of land was sold.64
ENCINA WASTEWATER AUTHORITYDemographic & Economic InformationPopulation & Property DataFiscalYearPopulation% ChangefrompreviousyearPersonalIncome(in millions)Per CapitaPersonalIncomeUnemployment RateAssessed Valueof TaxableProperty(in millions)<strong>2012</strong> n/a n/a n/a n/a n/a n/a2011 350,891 -0.35% $ 18,862 $ 53,753 38.27% 265,8892010 352,130 1.5% $ 19,304 $ 54,821 27.5% 268,4962009 346,789 0.2% $ 18,741 $ 54,041 22.3% 278,0992008 346,188 2.0% $ 18,162 $ 52,463 4.2% 273,0012007 339,370 2.0% $ 17,540 $ 51,683 3.6% 257,6052006 332,658 2.4% $ 16,487 $ 49,561 3.5% 228,8922005 324,959 2.7% $ 15,848 $ 48,769 3.8% 198,9292004 316,459 2.2% $ 15,050 $ 47,558 4.1% 175,0362003 309,784 2.7% $ 14,380 $ 46,419 4.4% 156,635EmployerBusiness CategoryNumber ofEmployeesPercent of TotalEmploymentMember Agencyor CityLife Technologies Biotechnology 4,121 7.56% CarlsbadTaylor Made-Adidas Golf Inc. Sporting Good Equipment 2,498 4.58% CarlsbadCallaway Golf Sporting Good Equipment 1,637 3.00% CarlsbadHunter Industries Construction Material 819 2.93% San MarcosUnited Parcel Service Package Delivery 448 1.61% San MarcosGeneral Atomics Defense/Technology 4,200 1.33% EncinitasNorthrop Grumman Manufacturing 4,190 1.31% EncinitasVista Unified School District Education 1,744 3.57% VistaSan Diego Superior Court Government 602 1.23% VistaTaxpayer2011 TaxableAssessed ValueMember Agencyor CityLa Costa Glen Retirement Community $ 229,289,820 CarlsbadAviara Resort Associates LLC 215,939,676 CarlsbadWorld Premier Investments 125,612,876 San MarcosHunter Industries Inc. 94,366,523 San MarcosHillcrest Montecito LP 69,484,370 VistaAcpre Monarch Vista Venture 69,000,000 VistaCollwood Pines Apartments 54,989,195 EncinitasPK III Encinitas Marketplace LP 39,923,138 EncinitasSources:Principal EmployersPrincipal Property Taxpayers(1) Data presented is a composite of data from FY 2011 <strong>CAFR</strong>s of EWA Member Agencies or their representative cities(2) Data for the City of Vista is representative of the Buena Sanitation District(3) Data for the City of San Marcos is representative of the Vallecitos Water District(4) Data for the City of Encinitas is representative of the cadia <strong>Wastewater</strong> District
ENCINA WASTEWATER AUTHORITYFacts and FiguresEstablishment HistoryCity of Carlsbad and Vista Sanitation District (City of Vista)formed Joint Powers <strong>Authority</strong> July 1961Buena Sanitation District joined JPA January 1964Vallecitos Water District joined JPA March 1965Leucadia <strong>Wastewater</strong> District joined JPA August 1971Encinitas Sanitary District (City of Encinitas) joined JPA August 1971<strong>Encina</strong> Administrative Agency created by Revised Basic Agreement August 1988<strong>Encina</strong> Administrative Agency renamed <strong>Encina</strong> <strong>Wastewater</strong> <strong>Authority</strong> 1991Number of Member AgenciesCities 3Water Districts 1<strong>Wastewater</strong>/Sanitation Districts 2Total Member Agencies 6<strong>Encina</strong> <strong>Wastewater</strong> Pollution Control Facility Area25 acresSystem Service Area123 square milesPopulation of Service Area 352,130<strong>Wastewater</strong> Treatment & Disposal Capacity (Permitted)43.3 MGDAverage Daily <strong>Wastewater</strong> Flow 24Average Daily Biochemical Oxygen Demand (pounds per day) 58,532Average Suspended Solids (pounds per day) 62,965Average Treated <strong>Wastewater</strong> Disposal 23.03Employees by FunctionOffice of the General Manager 11Operations 26.5General Services 17Environmental Compliance 10Total Employees 65.5Average Years of Employee Service 8.83Source: <strong>Encina</strong> <strong>Wastewater</strong> <strong>Authority</strong>; San Diego Association of GovernmentsNotes: MGD = million gallons per day66
ENCINA WASTEWATER AUTHORITYFull-Time Equivalent Employees by FunctionLast Ten Fiscal YearsFiscalYear Operations General ServicesOffice of GeneralManagerEnvironmentalComplianceTotal FTE<strong>2012</strong> 26.50 17.00 11.00 10.00 65.502011 26.00 17.00 11.00 10.00 64.002010 26.00 19.00 9.00 10.00 64.002009 24.00 20.00 11.00 9.00 64.002008 24.00 20.00 11.00 9.00 64.002007 22.00 19.00 11.00 9.00 61.002006 20.00 19.00 10.00 8.00 57.002005 19.00 17.00 8.00 8.00 52.002004 18.00 17.00 8.00 8.00 51.002003 20.00 15.00 8.00 8.00 51.0030.00Employees by Function25.0020.0015.0010.005.000.00200620082010<strong>2012</strong>General Services Operations Office of General Manager Environmental ComplianceSource:<strong>Encina</strong> <strong>Wastewater</strong> <strong>Authority</strong>Notes:(1) FY <strong>2012</strong> : One Receptionist, .5 Operator-in-Training added(2) FY 2011 & FY 2010: reclassifications occured between functions; Administration retitled Office of General Manager(3) FY 2009: Maintenance function retitled General Services(4) FY 2008: Two Shift Supervisor and one Mechanical Technician positions added(5) FY 2007: One Chemist, one Shift Supervisor, one Operator Grade II, one Support Specialist positions added(6) FY 2006: One Engineering Manager, one Financial Services Manager, one Maintenance Planner, andone Electrical Instrumentation Specialist positions added(6) FY 2005: One Operator position added67
ENCINA WASTEWATER AUTHORITYOperating Revenues and Expenses by Member Agencywith Amount Due To (From) Member AgenciesLast Ten Fiscal YearsOperating Revenues: Member Agency Assessments Billed, Net of Other Sources% Changefrom PriorYear$ ‐2.5%FiscalYear Vista Carlsbad Buena Vallecitos Leucadia Encinitas Total<strong>2012</strong> $ 2,894,508 $ 3,677,363 $ 1,122,452 $ 2,211,874 $ 1,780,750 $ 525,297 12,212,2442011 2,944,497 3,713,809 1,257,548 2,236,119 1,836,606 537,555 12,526,134 ‐4.4%2010 3,042,873 3,961,372 1,322,605 2,260,092 1,929,239 582,692 13,098,872 ‐7.9%2009 3,354,891 4,190,425 1,422,809 2,594,083 2,051,872 613,734 14,227,814 13.3%2008 2,895,678 3,819,522 1,280,944 2,305,224 1,753,873 502,210 12,557,451 9.2%2007 2,798,871 3,192,274 1,170,638 2,260,439 1,666,198 414,273 11,502,690 8.1%2006 2,509,016 2,926,479 1,053,386 2,163,780 1,609,737 374,399 10,636,797 13.4%2005 2,185,151 2,499,046 963,906 1,919,153 1,464,508 346,657 9,378,421 7.3%2004 2,068,282 2,354,413 959,912 1,666,551 1,368,168 322,974 8,740,300 3.6%2003 1,992,614 2,098,889 1,188,305 1,587,810 1,261,821 310,812 8,440,251 #REF!Operating Expenses, excluding Depreciation% Changefrom PriorYear$ 0.4%FiscalYear Vista Carlsbad Buena Vallecitos Leucadia Encinitas Total<strong>2012</strong> $ 2,972,735 $ 3,854,579 $ 1,219,645 $ 2,267,470 $ 1,787,779 $ 547,312 12,649,5202011 3,010,991 3,820,570 1,303,867 2,162,596 1,773,223 532,034 12,603,281 ‐4.1%2010 3,091,124 3,999,304 1,360,071 2,193,064 1,915,895 589,325 13,148,783 ‐8.5%2009 3,415,783 4,235,589 1,458,870 2,553,589 2,049,814 654,522 14,368,167 12.6%2008 2,967,030 3,853,390 1,282,977 2,333,837 1,795,076 524,056 12,756,366 11.4%2007 2,825,776 3,230,252 1,184,857 2,104,831 1,689,485 414,105 11,449,306 8.3%2006 2,529,655 2,935,272 1,044,667 2,057,769 1,625,863 380,032 10,573,258 12.9%2005 2,268,599 2,381,609 965,888 1,931,310 1,468,502 350,425 9,366,333 6.9%2004 2,065,144 2,385,628 978,282 1,617,037 1,370,051 346,669 8,762,811 3.9%2003 1,931,558 2,181,213 1,237,234 1,573,165 1,204,871 306,388 8,434,429 7.5%Operating Revenues Over (Under) Operating ExpensesAmount Due To (From) by Member AgencyFiscalYear Vista Carlsbad Buena Vallecitos Leucadia Encinitas Total<strong>2012</strong> $ (78,227) $ (177,216) $ (97,193) $ (55,596) $ (7,029) $ (22,015) (437,276)2011 (66,494) (106,761) (46,319) 73,523 63,383 5,521 (77,147)2010 48,251 37,932 37,467 (67,028) (13,344) 6,633 49,9112009 60,892 45,164 36,061 (40,494) (2,058) 40,788 140,3532008 71,351 33,870 2,033 28,613 41,204 21,845 198,9162007 26,906 32,979 14,221 (155,606) 23,288 (170) (58,382)2006 20,639 8,793 (8,719) (106,011) 16,126 5,633 (63,539)2005 83,448 (117,437) 1,982 12,157 3,994 3,768 (12,088)2004 (3,138) 31,215 18,370 (49,514) 1,883 23,695 22,5112003 (61,056) 82,324 48,929 (14,645) (56,950) (4,424) (5,822)Source: <strong>Encina</strong> <strong>Wastewater</strong> <strong>Authority</strong>Notes:(1) Member billing methodology changed from estimated budget to actuals beginning FY 2003.(2) A variance is expected due to fiscal year end accounting for changes in Compensated Absence and Inventory balances68
ENCINA WASTEWATER AUTHORITYOperating Revenues and Expenses by Major Source and UseLast Ten Fiscal YearsOperating RevenuesFiscal MemberYear Assessments Septage Receipts<strong>2012</strong> $ 12,383,770‐Risk ManagementDividends Biofuel Loads Lab Services$ $ 42,937 125,404EnvironmentalEnforcement Miscellaneous Total$ $ 12,191 $ 12,649,520$ 70,388$ 14,8302011 12,249,354 ‐ 58,772 40,448 154,245 16,970 83,492 12,603,2812010 12,863,097 ‐ 71,669 31,534 166,648 9,490 6,345 13,148,7832009 14,102,535 ‐ 52,366 ‐ 193,478 14,985 4,803 14,368,1672008 12,121,439 ‐ 48,672 ‐ 150,346 21,872 154,971 12,497,3002007 10,957,510 ‐ 60,804 ‐ 138,945 134,110 157,940 11,449,3092006 10,314,124 ‐ 65,839 ‐ 153,102 26,037 14,156 10,573,2582005 9,128,174 30,158 62,400 ‐ 119,673 19,050 6,878 9,366,3332004 8,502,454 34,092 67,916 ‐ 140,191 13,375 4,784 8,762,8122003 8,219,882 33,862 69,532 ‐ 77,333 19,805 14,015 8,434,429Operating ExpensesFiscalYear EWPCF Source ControlAqua HediondaPump StationBuena VistaPump StationBuena SanitationDistrict FacilitiesCarlsbad WaterRecyling FacilityRaceway BasinPump StationTotal<strong>2012</strong> $ 10,296,088 $ 623,461 $ 247,392 $ 348,184 $ 215,234 $ 772,107 $ 147,054 $ 12,649,5202011 10,322,744 591,609 201,953 343,044 314,303 703,253 126,375 12,603,2812010 10,805,155 587,541 238,499 335,451 321,524 733,358 127,254 13,148,7832009 11,974,772 517,222 244,177 370,135 354,886 739,851 167,124 14,368,1672008 10,597,845 457,500 206,733 340,290 320,629 693,992 139,377 12,756,3662007 9,369,179 383,060 275,102 379,484 337,799 607,207 97,478 11,449,3092006 8,784,969 449,814 244,939 293,613 294,416 505,507 ‐ 10,573,2582005 8,126,726 415,156 187,485 304,069 279,040 53,857 ‐ 9,366,3332004 7,565,874 448,725 170,428 274,271 303,514 ‐ ‐ 8,762,8122003 6,983,247 404,781 149,903 261,614 634,884 ‐ ‐ 8,434,429Source: <strong>Encina</strong> <strong>Wastewater</strong> <strong>Authority</strong>Note:(1) Member Agencies are billed the amount of Operating Expenses less Other Operating Revenues(2) FY 2011: Miscellaneous Revenue includes $78k retroactive utility rate adjustment from San Diego Gas & Electric(3) FY 2010: Class A biosolids marketing initiated(4) FY 2009: Phase V Expansion substantially complete and on‐line. Variance in operating costs result of start‐up activities(5) FY 2008: Nonoperating Revenue of $259,066 was applied to offest Operating Expenses(6) FY 2007: EWA assumed operation of City of Vista's Raceway Basin Pump Station Facility(7) FY 2006: Septage Hauler Domestic Waste program discontinued(8) FY 2005: Carlsbad Water Recycling Facility commenced operations69
ENCINA WASTEWATER AUTHORITY<strong>Encina</strong> Water Pollution Control Facilities (EWPCF)Operating Expenses per Million Gallons (MG)Last Ten Fiscal Yearsby Member AgencyEWPCFYear Ended Vista Carlsbad Buena Vallecitos Leucadia Encinitas totalsJune 30, <strong>2012</strong>Operating Expenses $ 2,164,079 $ 2,792,012 $ 910,702 $ 2,152,635 $ 1,748,725 $ 527,935 $ 10,296,088Avg. Daily Flow in MG 5.36 6.92 1.63 3.47 4.11 1.08 22.57Annualized Flow in MG 1,956.40 2,525.80 594.95 1,266.55 1,500.15 394.20 8,238.05Cost Per MG $ 1,106.15 $ 1,105.40 $ 1,530.72 $ 1,699.61 $ 1,165.70 $ 1,339.26 $ 1,249.82% change from prior year 7.95% 7.27% 7.07% 9.87% 2.45% ‐1.87% 7.03%June 30, 2011Operating Expenses $ 2,273,903 $ 2,847,328 $ 892,275 $ 2,055,254 $ 1,735,905 $ 518,079 $ 10,322,744Avg. Daily Flow in MG 6.08 7.57 1.71 3.64 4.18 1.04 24.22Annualized Flow in MG 2,219.20 2,763.05 624.15 1,328.60 1,525.70 379.60 8,840.30Cost Per MG $ 1,024.65 $ 1,030.50 $ 1,429.58 $ 1,546.93 $ 1,137.78 $ 1,364.80 $ 1,167.69% change from prior year ‐7.89% ‐10.49% ‐9.29% ‐1.67% ‐9.29% ‐9.65% ‐8.21%June 30, 2010Operating Expenses $ 2,334,760 $ 2,983,569 $ 966,403 $ 2,084,517 $ 1,867,994 $ 567,912 $ 10,805,155Avg. Daily Flow in MG 5.75 7.10 1.68 3.63 4.08 1.03 23.27Annualized Flow in MG 2,098.75 2,591.50 613.20 1,324.95 1,489.20 375.95 8,493.55Cost Per MG $ 1,112.45 $ 1,151.29 $ 1,576.00 $ 1,573.28 $ 1,254.36 $ 1,510.61 $ 1,272.16% change from prior year ‐5.82% ‐8.48% ‐4.77% 5.17% ‐5.77% ‐3.41% ‐4.84%June 30, 2009Operating Expenses $ 2,578,159 $ 3,264,462 $ 1,051,098 $ 2,440,780 $ 2,006,657 $ 633,616 $ 11,974,772Avg. Daily Flow in MG 5.98 7.11 1.74 4.47 4.13 1.11 24.54Annualized Flow in MG 2,182.70 2,595.15 635.10 1,631.55 1,507.45 405.15 8,957.10Cost Per MG $ 1,181.18 $ 1,257.91 $ 1,655.01 $ 1,495.99 $ 1,331.16 $ 1,563.91 $ 1,336.90% change from prior year 21.70% 24.53% 18.55% 24.33% 16.11% 29.99% 22.25%June 30, 2008Operating Expenses $ 2,253,155 $ 2,934,738 $ 912,076 $ 2,230,966 $ 1,757,509 $ 509,401 $ 10,597,845Avg. Daily Flow in MG 6.36 7.96 1.79 5.08 4.20 1.16 26.55Annualized Flow in MG 2,321.40 2,905.40 653.35 1,854.20 1,533.00 423.40 9,690.75Cost Per MG $ 970.60 $ 1,010.10 $ 1,396.00 $ 1,203.20 $ 1,146.45 $ 1,203.12 $ 1,093.60% change from prior year 10.24% 3.06% 16.00% 5.36% 14.36% 11.17% 8.34%June 30, 2007Operating Expenses $ 2,104,941 $ 2,393,225 $ 808,215 $ 2,017,472 $ 1,650,313 $ 395,013 $ 9,369,179Avg. Daily Flow in MG 6.55 6.69 1.84 4.84 4.51 1.00 25.43Annualized Flow in MG 2,390.75 2,441.85 671.60 1,766.60 1,646.15 365.00 9,281.95Cost Per MG $ 880.45 $ 980.09 $ 1,203.42 $ 1,142.01 $ 1,002.53 $ 1,082.23 $ 1,009.40% change from prior year 10.48% 7.26% 15.09% 9.48% 2.04% 14.14% 8.41%June 30, 2006Operating Expenses $ 1,975,084 $ 2,221,305 $ 713,689 $ 1,926,565 $ 1,581,498 $ 366,828 $ 8,784,969Avg. Daily Flow in MG 6.79 6.66 1.87 5.06 4.41 1.06 25.85Annualized Flow in MG 2,478.35 2,430.90 682.55 1,846.90 1,609.65 386.90 9,435.25Cost Per MG $ 796.94 $ 913.78 $ 1,045.62 $ 1,043.13 $ 982.51 $ 948.12 $ 931.08% change from prior year 19.60% 16.06% 14.80% 23.24% 14.66% 17.29% 18.05%June 30, 2005Operating Expenses $ 1,792,413 $ 2,109,384 $ 658,222 $ 1,798,095 $ 1,429,298 $ 339,314 $ 8,126,726Avg. Daily Flow in MG 7.37 7.34 1.98 5.82 4.57 1.15 28.23Annualized Flow in MG 2,690.05 2,679.10 722.70 2,124.30 1,668.05 419.75 10,303.95Cost Per MG $ 666.31 $ 787.35 $ 910.78 $ 846.44 $ 856.87 $ 808.37 $ 788.70% change from prior year 0.23% 1.62% ‐1.36% ‐4.49% ‐1.50% 2.57% ‐0.58%70(continued)
ENCINA WASTEWATER AUTHORITY<strong>Encina</strong> Water Pollution Control Facilities (EWPCF)Operating Expenses per Million Gallons (MG)Last Ten Fiscal Yearsby Member AgencyEWPCFYear Ended Vista Carlsbad Buena Vallecitos Leucadia Encinitas totalsJune 30, 2004Operating Expenses $ 1,615,147 $ 2,142,316 $ 633,955 $ 1,528,538 $ 1,317,330 $ 328,588 $ 7,565,874Avg. Daily Flow in MG 6.66 7.58 1.88 4.73 4.15 1.14 26.13Annualized Flow in MG 2,429.68 2,765.08 686.61 1,724.83 1,514.34 416.91 9,537.45Cost Per MG $ 664.76 $ 774.78 $ 923.32 $ 886.20 $ 869.90 $ 788.15 $ 793.28% change from prior year 4.08% ‐0.91% ‐6.25% 5.62% 8.22% 3.28% 2.91%June 30, 2003Operating Expenses $ 1,517,606 $ 1,946,369 $ 560,769 $ 1,457,730 $ 1,199,946 $ 300,827 $ 6,983,247Avg. Daily Flow in MG 6.51 6.82 1.56 4.76 4.09 1.08 24.82Annualized Flow in MG 2,376.15 2,489.30 569.40 1,737.40 1,492.85 394.20 9,059.30Cost Per MG $ 638.68 $ 781.89 $ 984.84 $ 839.03 $ 803.80 $ 763.13 $ 770.84EWPCF Operating Expense per Million Gallons$1,500$1,000$500$770.84 $793.28 $788.70$931.08 $1,009.40 $1,093.60 $1,336.90 $1,272.16 $1,167.69 $1,249.82$-2003 2004 2005 2006 2007 2008 2009 2010 2011 <strong>2012</strong>Average Daily Flow Million Gallons30.0029.0028.0028.2327.0026.0026.5525.0026.1325.8524.00 24.8225.4324.5423.0024.2222.0023.2722.5721.00Source: 20.00<strong>Encina</strong> <strong>Wastewater</strong> <strong>Authority</strong>2003 2004 2005 2006 2007 2008 2009 2010 2011 <strong>2012</strong>Note:(1) FY <strong>2012</strong> reflects impact of Meadowlark expansion and water conservation.(2) FY 2005 reflects impact of inflow and infiltration caused by high precipitation levels(3) FY 2009 and FY 2010 reflect impact of water conservation mandates compounded by Phase V startup activities.71(continued)
THIS PAGE IS INTENTIONALLY LEFT BLANK
<strong>Encina</strong> <strong>Wastewater</strong> <strong>Authority</strong>6200 Avenida <strong>Encina</strong>sTel. 760.438.3941 Fax. 760.438.8361www.encinajpa.com