Visitors Dashboard - National Portal of India
Visitors Dashboard - National Portal of India
Visitors Dashboard - National Portal of India

You also want an ePaper? Increase the reach of your titles
YUMPU automatically turns print PDFs into web optimized ePapers that Google loves.
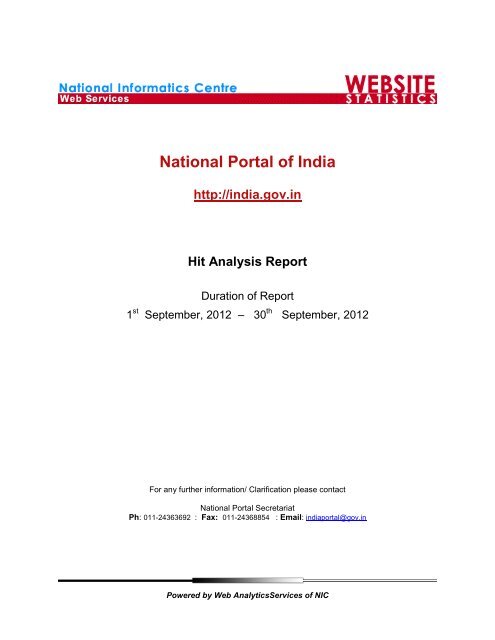
<strong>National</strong> <strong>Portal</strong> <strong>of</strong> <strong>India</strong><br />
http://india.gov.in<br />
Hit Analysis Report<br />
Duration <strong>of</strong> Report<br />
1 st September, 2012 – 30 th September, 2012<br />
For any further information/ Clarification please contact<br />
<strong>National</strong> <strong>Portal</strong> Secretariat<br />
Ph: 011-24363692 : Fax: 011-24368854 : Email: indiaportal@gov.in<br />
Powered by Web AnalyticsServices <strong>of</strong> NIC
Hit analysis for September 2012 http://india.gov.in<br />
<strong>Visitors</strong> <strong>Dashboard</strong><br />
This reports presents an overview <strong>of</strong> the <strong>Visitors</strong> Pattern to the portal.<br />
Visit Summary<br />
Visits<br />
Average per Day<br />
Average Visit Duration<br />
Median Visit Duration<br />
International Visits<br />
Visits <strong>of</strong> Unknown Origin<br />
Visits from Your Country:<br />
<strong>India</strong> (IN)<br />
Visitor Summary<br />
<strong>Visitors</strong><br />
<strong>Visitors</strong> Who Visited Once<br />
<strong>Visitors</strong> Who Visited More<br />
Than Once<br />
Average Visits per Visitor<br />
2,026,600<br />
67,553<br />
00:08:29<br />
00:01:41<br />
33%<br />
Powered by Web Analytics Services <strong>of</strong> NIC<br />
2%<br />
65%<br />
1,487,191<br />
1,308,560<br />
178,631<br />
1.36
Hit analysis for September 2012 http://india.gov.in<br />
Countries<br />
List <strong>of</strong> countries from where we have most <strong>of</strong> visitors to the portal.<br />
Countries<br />
Countries<br />
Countries Visits % Visits<br />
1. <strong>India</strong> (IN) 1,308,316 65%<br />
2. United States (US) 270,725 13%<br />
3. Australia (AU) 87,752 4%<br />
4. Netherlands (NL) 83,540 4%<br />
5. ** 53,307 3%<br />
6. Unknown Country 46,405 2%<br />
7. Norway (NO) 29,488 1%<br />
8. United Kingdom (UK) 20,267 1%<br />
9. Singapore (SG) 17,198 1%<br />
10. Canada (CA) 9,933 0%<br />
11. United Arab Emirates (AE) 9,589 0%<br />
12. China (CN) 8,056 0%<br />
13. Germany (DE) 7,943 0%<br />
14. France (FR) 4,818 0%<br />
15. Saudi Arabia (SA) 4,285 0%<br />
16. Hong Kong (HK) 4,100 0%<br />
17. Pakistan (PK) 3,921 0%<br />
18. Japan (JP) 3,034 0%<br />
19. Ukraine (UA) 2,773 0%<br />
20. Malaysia (MY) 2,656 0%<br />
Powered by Web Analytics Services <strong>of</strong> NIC
Hit analysis for September 2012 http://india.gov.in<br />
Cities<br />
List <strong>of</strong> the cities with most active visitors to the portal.<br />
Cities<br />
City Visits % Visits<br />
1. New Delhi, <strong>India</strong> 656,582 36%<br />
2. Mumbai, <strong>India</strong> 278,089 15%<br />
3. Mountain View, California, United States 97,452 5%<br />
4. Amsterdam, Netherlands 82,380 5%<br />
5. Milton, Australia 80,510 4%<br />
6. Reserved, ** 53,307 3%<br />
7. Chennai, <strong>India</strong> 41,797 2%<br />
8. Gurgaon, <strong>India</strong> 40,056 2%<br />
9. Hyderabad, <strong>India</strong> 30,296 2%<br />
10. Oslo, Norway 29,234 2%<br />
11. Bangalore, <strong>India</strong> 26,172 1%<br />
12. Herndon, Virginia, United States 22,191 1%<br />
13. Redmond, Washington, United States 17,279 1%<br />
14. Singapore, Singapore 15,929 1%<br />
15. Palo Alto, California, United States 12,445 1%<br />
16. Calcutta, <strong>India</strong> 12,052 1%<br />
17. Indore, <strong>India</strong> 11,992 1%<br />
18. Pune, <strong>India</strong> 11,491 1%<br />
19. Dubai, United Arab Emirates 8,480 0%<br />
Powered by Web Analytics Services <strong>of</strong> NIC
Hit analysis for September 2012 http://india.gov.in<br />
Hits by Hour <strong>of</strong> the Day<br />
This report shows the most and the least active hour <strong>of</strong> the day for the report period. If there are<br />
several days in the report period, the value presented is the sum <strong>of</strong> all hits during that period <strong>of</strong><br />
time for all days.<br />
Hits by Hour <strong>of</strong> the Day<br />
Hits by Hour <strong>of</strong> the Day<br />
Hour Hits % Hits<br />
12:00 AM 2,827,504 4%<br />
1:00 AM 2,157,084 3%<br />
2:00 AM 1,885,135 3%<br />
3:00 AM 1,894,446 3%<br />
4:00 AM 1,833,936 3%<br />
5:00 AM 1,635,852 2%<br />
6:00 AM 1,673,559 2%<br />
7:00 AM 1,987,389 3%<br />
8:00 AM 2,428,085 3%<br />
9:00 AM 2,964,632 4%<br />
10:00 AM 3,921,520 5%<br />
11:00 AM 4,295,758 6%<br />
12:00 PM 4,250,507 6%<br />
1:00 PM 3,605,734 5%<br />
2:00 PM 3,709,357 5%<br />
3:00 PM 3,792,078 5%<br />
4:00 PM 3,765,803 5%<br />
5:00 PM 3,470,887 5%<br />
6:00 PM 3,122,123 4%<br />
7:00 PM 3,312,522 5%<br />
8:00 PM 3,538,702 5%<br />
9:00 PM 3,697,478 5%<br />
10:00 PM 3,789,626 5%<br />
11:00 PM 3,476,826 5%<br />
Powered by Web Analytics Services <strong>of</strong> NIC