Flow Visualization Using MS-Excel - Cert
Flow Visualization Using MS-Excel - Cert
Flow Visualization Using MS-Excel - Cert
- No tags were found...

Create successful ePaper yourself
Turn your PDF publications into a flip-book with our unique Google optimized e-Paper software.
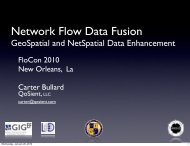
<strong>Flow</strong> <strong>Visualization</strong> <strong>Using</strong> <strong>MS</strong>-<strong>Excel</strong><strong>Visualization</strong> for the Common ManPresented by Lee Rock and Jay BrownUS-CERT AnalystsEinstein Program
Background• US-CERT Mission• Einstein Program> Large volumes of traffic> Architecture limitations• Proactive vs. Reactive analysis• Slow application certificationprocess
Pro’s and Con’s• Pro’s:– <strong>Visualization</strong> allows for rapid analysis– Patterns are easy to identify– Flexibility in analysis– Most enterprises have <strong>MS</strong> Office (<strong>Excel</strong>)• Con’s:– <strong>Excel</strong> plotting engine is limited– Max of 65K records (recommend
Data Preparation Steps•Data Pull• Data Reduction• Importing Data• Data Formatting• Sample analysis slides
Data PullAnalysts have several options when trying to pullinteresting datasets. Several methods we finduseful are:• Collecting data during non-business hours– Reduces traffic from users; helps expose automated sessions• Search for outbound traffic only– Reduces noise from scanning, etc.• Filtering for packets with the PSH/ACK flags set in the initial flags field– Focuses the traffic on sessions where data is actually transferred• Filtering for packets with the SYN flag set in the initial flags field– Focuses on sessions initiated by your organization• Limit traffic to records under 5K bytes– Most cyclical sessions (beaconing) happen in this rangeTraffic should be refined to provide the best possible dataset for analysts towork with.
Data ReductionTo further enhance the concentration of suspicious data,analysts should:• Remove replies from servers (responses to inbound server requests)– Looking for genuine outbound traffic• Remove loud, common talkers (instant messenger, web crawlers, etc)– Reduces the noise, especially in web traffic• “Whitelists” and “blacklists” are helpful for filteringThis is an iterative approach – Analyze, Research, Remove.
Importing DataData is imported from a pipe delimited text file
Data FormattingColumns within the spreadsheet should be aligned to each field of theflows, Einstein data is formatted to encompass:• Source IP• DestinationIP• Source Port• DestinationPort• Protocol• Packets• Bytes• Flags• Start Time• Duration• End Time• Sensor• Type• Initial Flags
Data Formatting Cont.US-CERT analysts use two methods to format the Einstein timefields into a format that is able to be plotted:A: Use the - - legacy-timestamps switch to place the time in aMM/DD/YYYY HH:MM:SS format from the default MM/DD/YYYYTHH:MM:SS.MMMB: Utilize the replace function in excel to remove the milliseconds from the timeand replace the T placeholder with a space:
Analysis WorkflowPlot Zoom Highlight AutoFilter
PlotCreating charts from theselected data, allows forquick pattern identification
ZoomYou can “zoom” in to specific data points, bychanging the scale of the axis• Right click on the axis• Select “Format Axis”• Click on the “Scale” tab• Adjust scale as desired• Works for both axis• Remember to remove
HighlightBy hovering over a data point in the series ananalyst can locate the point in the rest of therecords by filtering for the displayed information
AutoFilterMethod A – Drop down list:Select the desired value from thedrop down listMethod B – Custom Filter:Select data by using <strong>Excel</strong>’s built inboolean logic search functions
Byte Based Patterns
Duration Based Patterns
sPort vs. dPort
IP Integer PatternsARIN ARIN
Comprehensive View
Case Study
Multi-day ViewWorkday Week endWorkday Workday
Case Study ConclusionAfter notifying the agency in question, themachines that were generating this trafficwere found and forensically examined. Themalware turned out to be a keystroke loggerthat posted data to a specific website andretrieved commands embedded on the samesite. Prior to this incident, there was nomalware associated with this site.
Additional AnalysisDetermining application patterns– Identifying specific applicationsWorking with gateway traffic– Structured gateway– Proxy gateway– Gateway mannerisms
Application Patterns
Structured Gateway
Proxy Gateway
Gateway Mannerisms
Future Directions• Split view analysis• Coloring data• Application coloring• sPort colored by app• Gateway coloring to IP
Split View
Coloring ExampleGreen = HTTP, Dark Green = HTTPS, Blue = DNS, Red = Other
Application ColoringGreen = HTTP, Blue = DNS, Red = Other
Color sPort vs Application
Colorization Example – GW2IP
Contact Info• Technical comments or questions– US-CERT Security Operations Center– Email: soc@us-cert.gov– Phone: +1 888-282-0870• Media inquiries– US-CERT Public Affairs– Email: media@us-cert.gov– Phone: +1 202-282-8010• General questions or suggestions– US-CERT Information Request– Email: info@us-cert.gov– Phone: +1 703-235-5111• For more information, visit http://www.us-cert.gov
Questions?