Flow Visualization Using MS-Excel - Cert
Flow Visualization Using MS-Excel - Cert
Flow Visualization Using MS-Excel - Cert
- No tags were found...

Create successful ePaper yourself
Turn your PDF publications into a flip-book with our unique Google optimized e-Paper software.
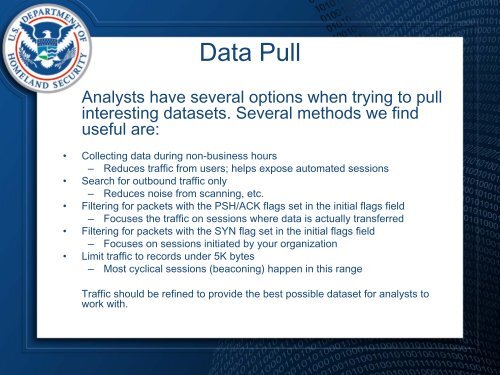
Data PullAnalysts have several options when trying to pullinteresting datasets. Several methods we finduseful are:• Collecting data during non-business hours– Reduces traffic from users; helps expose automated sessions• Search for outbound traffic only– Reduces noise from scanning, etc.• Filtering for packets with the PSH/ACK flags set in the initial flags field– Focuses the traffic on sessions where data is actually transferred• Filtering for packets with the SYN flag set in the initial flags field– Focuses on sessions initiated by your organization• Limit traffic to records under 5K bytes– Most cyclical sessions (beaconing) happen in this rangeTraffic should be refined to provide the best possible dataset for analysts towork with.