War II era. Whether it is water and sewer treatment facilities, roads, bridges, or hospitals, they are nearing theend of their useful life. There is an urgent need for governments to update, repair, rehabilitate or replace aginginfrastructure. Recent media coverage has highlighted the serious consequences of bridge collapses in Quebecand the US, old steam pipes bursting in New York, and an underground pedestrian tunnel closed in Montrealdue to fear of structural failure and Ontario has not been immune to the problem: in January 2003 a bridge overthe Montreal River in Latchford, Ontario partially collapsed, resulting in the closure of Highway 11.Most infrastructure professionals are aware of the challenges related to the state of existing infrastructure, but thefull extent of the problem may be difficult to quantify. It is clear, though, that the financial resources requiredto address the problem are significant, and often not readily available. Spending large sums of money on therehabilitation of existing infrastructure is particularly troublesome to the decision makers who must authorizethe expenditures in the face of competing priorities. For this reason, proper rehabilitation is often postponeduntil a serious problem arises. Suddenly, then, we have to spend large amounts of unbudgeted money to fix theproblem. Worse, we may also have to contend with additional negative consequences of a failure.A recent article in the Canadian Economic Observer, “From Roads to Rinks: Government Spending onInfrastructure in Canada” 2 provides some valuable insight into patterns of government infrastructure investmentin Canada. Spending on government infrastructure in Canada (including Ontario) was significantly higherin the period from 1961 to 1971 than in more recent periods. For example, in Ontario, annual growth ininfrastructure capital (adjusted for inflation) for roads, including bridges, was as follows:Table 1: Annual Growth in Roads and Bridges CapitalInfrastructure - Ontario1961-1971 4.5% per annum1971-1981 2.2% per annum1981-1991 0.4% per annum1991-2001 1.3% per annum2001-2005 3.0% per annumTable 1 shows that although there has been resurgence in spending on roads and bridges since 2001, asignificant proportion of the roads and bridges inventory in Ontario dates back to investment undertaken in that1961-1971 period.This article also highlights the pronounced shift in “ownership” of government assets to the municipal sector.Although not reported separately for Ontario, the average annual growth from 1961 to 2005 for roads andbridges capital infrastructure (adjusted for inflation) by the three levels of government illustrate this trend.Table 2: Annual Growth in Roads and Bridges CapitalInfrastructure by Jurisdiction 1961-2005 - CanadaFederalProvincialMunicipal-1.5% per annum1.3% per annum3.3% per annumBy 2005, roads and bridges represented 39.9% of all government-owned infrastructure assets in Ontario.Additionally, 67% of all capital infrastructure assets are now owned by Ontario municipalities (this has increasedfrom only 38% in 1961). Although the distribution is not reported specifically for Ontario, as Table 3 shows,roads (including bridges) have a very high municipal ownership component:2Canadian Economic Observer, September 2007, Statistics Canada - Catalogue no. 11-0102
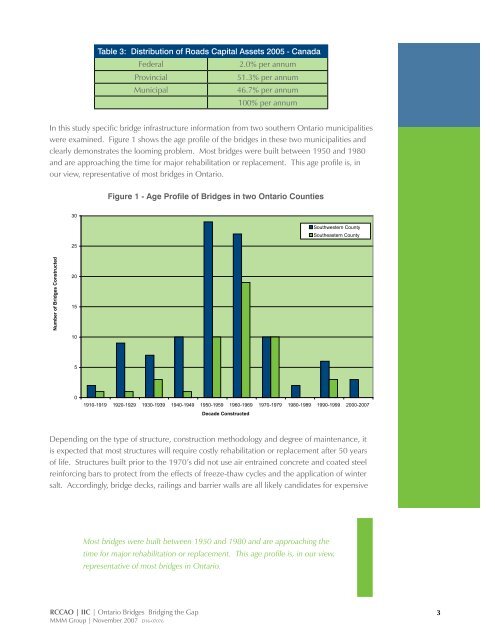
Table 3: Distribution of Roads Capital Assets 2005 - CanadaFederal2.0% per annumProvincial51.3% per annumMunicipal46.7% per annum100% per annumIn this study specific bridge infrastructure information from two southern Ontario municipalitieswere examined. Figure 1 shows the age profile of the bridges in these two municipalities andclearly demonstrates the looming problem. Most bridges were built between 1950 and 1980and are approaching the time for major rehabilitation or replacement. This age profile is, inour view, representative of most bridges in Ontario.3025Figure 1 - Age Profile of Bridges in two Ontario CountiesFigure 1 - Age Profile of Bridges in two Ontario CountiesSouthwestern CountySoutheastern CountyNumber of Bridges Constructed201510501910-1919 1920-1929 1930-1939 1940-1949 1950-1959 1960-1969 1970-1979 1980-1989 1990-1999 2000-2007Decade ConstructedDepending on the type of structure, construction methodology and degree of maintenance, itis expected that most structures will require costly rehabilitation or replacement after 50 yearsof life. Structures built prior to the 1970’s did not use air entrained concrete and coated steelreinforcing bars to protect from the effects of freeze-thaw cycles and the application of wintersalt. Accordingly, bridge decks, railings and barrier walls are all likely candidates for expensiveMost bridges were built between 1950 and 1980 and are approaching thetime for major rehabilitation or replacement. This age profile is, in our view,representative of most bridges in Ontario.RCCAO | IIC | Ontario Bridges Bridging the GapMMM Group | November 2007 D16-070763