Fluorescence
Fluorescence
Fluorescence
- No tags were found...

You also want an ePaper? Increase the reach of your titles
YUMPU automatically turns print PDFs into web optimized ePapers that Google loves.
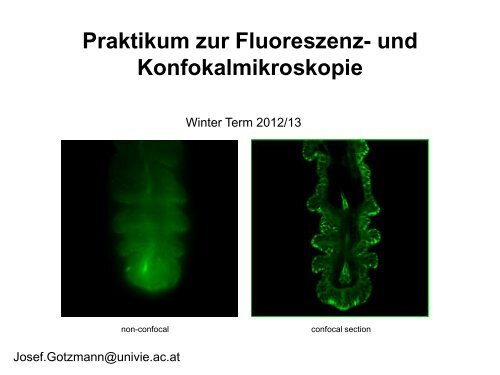
Praktikum zur Fluoreszenz- undKonfokalmikroskopieWinter Term 2012/13non-confocalconfocal sectionJosef.Gotzmann@univie.ac.at
Current Equipment8 Instruments = 3 Confocal Microscopes + 1 Spinning Disc + 1 Live Imaging Unit + 1 DeconvolutionMicroscope + 1 Microdissection + 1 ApotomeLSM Meta2005LSM 5101999LSM7102011Spinning Disc2012Deltavision2010OlympusCell-R2008Axiovert200MApotome2005Leica LMD2009
Types of Light• Monochromatic• Polychromatic• Linearly polarized• NonpolarizedE-vector• Collimated (coaxial paths of propagationthrough space – indep. of l, phase or polarization)• Non-collimated = Divergent• Coherent – same phase• Non-coherent
RefractionRefraction and Refractive Index(measure for optical density):Air: 1,0003Water: 1,3333Silica glas: 1,459Immersion-oil: appr. 1,52Diamond: 2,417more denseless denseRefraction varies by frequency
Lenses, Focus and AberrationsReason: lens failures-glass inconsistencies, partial reflection (sample thickness!),Optical solution: aspheric lenses (cheaper is apertures)Can belongitudinal (asshown) andlateral(perpendicular tofocal point)„plan“-lenses:Most effects fromlens edgeshttp://www.funsci.com/fun3_en/ucomp1/Reason: prism-effect at lens edgesOptical solution: achromatic or apochromatic lenses (2 types of glass) – <strong>Fluorescence</strong> !!Other aberrations include: Curvature offield / Distortion (fish-eye) / astigmatism
The Microscope3Detection1Illuminationhttp://micro.magnet.fsu.edu/primer/anatomy/bh2cutaway.html
Types of microscopes andIlluminationUPRIGHTReflected or Incident Light(Auflicht)Transmitted Light(Durchlicht)INVERSEAlso for thick and intransparent specimenelearningcenter.univie.ac.at/fileadmin/.../Friday_Lecture_Volgger.ppt
Simple Geometry of a MicroscopeMagnifying glas)
ObjectivesDipping objectives-physiologyD.B.Murphy, „Fundamentals of Light Microscopy and Electronic Imaging“; Wiley-Liss, 2001; http://zeiss-campus.magnet.fsu.edu/tutorials/basics/objectivecolorcoding/index.html
Coverslips / Tools• # 0 :• # 1:0.08 – 0.13mm0.13 - 0.16 mm• # 1.5: 0.16 - 0.19 mm• # 2:0.19 – 0.25 mmUsually glass, permanox plastics can also be used. Conventional TCplastics not useful for fluorescence applications (absorption!) For liveimaging use glass-bottom dishes (expensive) or chamber slide (cave:working distance)http://www.ibidi.de/products/p_disposables.html // http://www.glass-bottom-dishes.com/
Resolution• Definition: the smallest distance between two points that canbe displayedd =0.61lNAResolution thus depends on:1. The wavelength of light that reaches the objective2. Numerical Aperture (N A ) ---> Property of the objective3. Immersion medium (part of N A calculation)
Numerical Apertureobjectiven = 1,0µ un = 1,5dryimmersionNumerical Aperture (NA) = n(sin µ)MaterialRefractive IndexAir 1.0003Water 1.333Glycerin 1.4695Paraffin oil 1.480Cedarwood oil 1.515Synthetic oil 1.515Anisole 1.5178Bromonaphthalene 1.6585Methylene iodide 1.740http://micro.magnet.fsu.edu/index.html
Resolution!!!!!Magnification identical !!!!!!High ApertureLow Aperture
Essential Wave Properties• Wavelength (nm):• Amplitude – Intensity:• Phasesl / 2-shiftConstructive Interference Destructive• DiffractionDiffractionPattern withmain andside maximahttp://www.sgha.net/articles/diffraction.jpghttp://www.a-levelphysicstutor.com/wav-light-diffr.php
Counts for transmitted and reflected light microscopyCount as„resolved“
Axial Resolution• Axial Resolution is worse than lateral:minimum distance two diffraction images of “points” can approacheach other along the z-axisz distance =2 l n(N A ) 2• Z shrinks inversely proportional to the 2 nd power of the N A• Ratio of lateral to axial resolution is :3,28 * n / N Ahttp://zeiss-campus.magnet.fsu.edu/
Depth of FieldThe axial range, through which an objective can be focused without any appreciablechange in image sharpness, is referred to as the objective depth of field = thickness alongthe z-axis where an object in the specimen appears focused !! -> almost only dependenton NA !Depth of Focus = the thickness of the image plane itself. Largely dependent onMagnification !MagnificationNumericalApertureDepthofField(mm)ImageDepth(mm)4x 0.10 15.5 0.1310x 0.25 8.5 0.8020x 0.40 5.8 3.840x 0.65 1.0 12.860x 0.85 0.40 29.8100x 0.95 0.19 80.0Large depth of FieldShallowdepth ofFieldhttp://www.olympusmicro.com/primer/anatomy/objectives.html
Light gathering power ofobjectives• F (epi) = 10 4 × (NA 4 /M) 2Means e.g. 40x /1.3 >> 63x /1.4 > 100x /1.4Deterioration of S/N ratio withhigher mags at same NA –must meet with sampling fordetectionIncreasing #of pixels or mag. decreases intensity perpixel !!Decreasing pixel size by 2 also decreases S/N by 2 -> decreasesresolution (binning!) BUT increases intensity- BUT also decreasesexposure time! -> “survival time”40x100x
Detection Systems Overviewhttp://biop.epfl.ch/pdf/PT-BIOP_QuantitativeImaging_2012.pdf
Detection – Digital Cameras• cMOS (complementary metal oxidesemiconductor)• CCD (Charge-coupled-device)http://www.olympusmicro.com/primer/digitalimaging/index.html,http://www.microscopyu.com/
DetectionDigital Cameras: Photons elicit electron hole pairs (photoelectric effect) –charge converted to voltage – this analogue signal is amplified andconverted into a binary image (AD-conversion)Digital Coding:Data Depth = levels of grey1 bit: 0,12 bit 00, 01, 10, 11BINNING: - speed increase by sampling 4, 9, 16 pixels as one- reduction of memory size- shorter illumination times
Nyquist-Sampling Theorem – or how many pixel do Ineed for a resolution representative image ?NYQUISTSAMPLINGCRITERION: the rate of samplingmust be at least 2-fold the samplefrequency to be able toreconstruct the analog signal froma digitalized one.sampling frequency is limited bythe pixel size of the chip!Calculation – the resolution at550nm with an objective 100x,NA=1,4 calculates to 230nm ->magnified by a factor of 100 =23µm ->on the chip the imagemust be large enough to cover 2pixels -> required pixel size is 11,5µm !R x M =2 x pixelsize½ inch chip is usually 6,4mm x 4,8mm: minimum # of pixels horizontally =6400 / 11,5 calculates to 557 pixelsLower mag objectives usually need more pixels for optimal resolution onthe CCD-chip (high resolution microscopes usually equipped with no morethan 1,3 Megapixel cameras)
Imaging - Triangle of Frustration© Josef Gotzmann
Live cell MicroscopyOptimal environmental conditions© Josef Gotzmannwww.zeiss.de
<strong>Fluorescence</strong>Stokes (1852) – Jablonski (1935)1) Molecule absorbs Light = Energy2) Excitation of electrons3) Relaxation of energized electrons4) Emission of fluorescent Light of higherwavelength than exciting light
<strong>Fluorescence</strong>l Em > l Exc
Principle of <strong>Fluorescence</strong>• Molecules capable to fluoresce =Fluorophores• Excitation with light of properwavelength lifts electrons frombasal (S 0 ) to excited levels S 1 ;each of these energy levels isitself divided into severalpossible vibrational states of themolecule• Emission free conversion tolowest state energy level (IC =Interneal Conversion)• Two possible ways:– Intersystem Crossing (ICS):Conversion to T1 triplet statewithout any radiative emissionand return to S 0– Return to energy state S 0 byemission of a photon(Energy difference = l) <strong>Fluorescence</strong>
1 Photon vs. 2 Photon Excitatione x c i t i n g p h o t o ne m i t t e d p h o t o n1 - p h o t o n e x c i t a t i o n2 - p h o t o n e x c i t a t i o n
Quantum Efficiency• Only emitted light is relevant for fluorescence detection in microscopy –intersystem conversion processes equals to loss of fluorescence efficiency• Quantenausbeute (quantum yield or quantum efficiency [QE]) in steady state:Number of emitted photonsQE = --------------------------------------Number of absorbed photons• QE is the essential for a fluorophore to qualifyfor optimal use in microscopyA good fluorophore can be excited up to 10 6 timesbefore it is „dead“Quantum Yield[Q.Y.]StandardsQ.Y. [%]Conditions forQ.Y.MeasurementsExcitation [nm]Cy3 4 PBS 540 2Cy5 27 PBS 620 2CresylVioletFluorescein5395POPOP 97QuininesulfateRhodamine 101Rhodamine 6GRhodamine BTryptophanL-Tyrosine58Methanol0.1 MNaOH,22 o CCyclohexane0.1 MH 2 SO 4 ,22 o C580 3496 3300 3350 3100 Ethanol 450 495 Water 488 431 Water 514 413Water,20 o C280 314 Water 275 3Ref.
Factors affecting QE– Quenching by collision with other molecules– Static Quenching: when a complex is formed between thefluorophore and a quenching molecule– Fluorescent energy Transfer (FRET): radiation-free transferof energy from an excited donor molecule on to anacceptor molecule (can also be used for dynamicassociation studies- see later). Occurs preferentially inmulti-colour applications – cave: keep fluorophoreconcentrations as low as possible.• Works only over a limited narrow spatial neighborhoodin the range of 20 – 70 Angström• Emission spectra of Donor and Excitation spectra ofAcceptor molecules must overlap significantly– Photobleaching: Interaction with light– ROS – can lead tophotochemical changes in molecule structure and in worstcase to loss of fluorescent properties -> is being used fordynamic analyses
Fluorescent Dyes• Commercially available from many companiesEmissionspectra of the Alexa SeriesAlexa Fluor488• Usually planar polycyclic organics with conjugated double bondsFluorescein
Single stainingsCounter-StainsDouble – to multiple -colours
Organelle Lights ORGANELLESMitochondrien(rot)+Lysosomen (grün)(MitoTracker – Lysotracker)Nuclei (Syto, Yopro,Topo, histone-FP)Golgihttp://www.invitrogen.com/site/us/en/home/Products-and-Services/Applications/Cell-and-Tissue-Analysis/Cell-Structure/CS-Misc/Organelle-Lights-reagents.htmlEndosomesER (membrane stains likeDiOC6, ConA)Cytoskeleton (Phalloidin, Taxol)http://celldynamics.org/celldynamics/
FUNCTIONAL ANALYSESApoptosis TdT(terminal deoxy transferase)-mediated dUTP-X nick end labelingAnnexin 5 (detects phosphatidylserin on surface / Live-Dead Kits from Molecular Probes)Cell cycle (BrdU, Fucci Cell Cycle Sensor)Enzyme Activities(alk-Phosphatase)Fluorosensors(cAMP)Ionic and pH Indicators(FURA, Indo, pHrhodo)
Quantum Dots“Whatever hue want”QD = Colloidal SemiconductornanocrystalsUsually a broad excitation peak and asymmetric, very narrow, emission peak (singlelight source can be used to excite more dots)Different Sizes -> differentfluorescence spectra (the larger–the redder• Very high quantum yield• less bleaching• nearly no quenching effects-> preferable for in vivoimagingBUT: may be toxic and arenot „cleared“http://www.evidenttech.com/home-page.htmlhttp://bme240.eng.uci.edu/students/07s/yokabe/main.htm
SAMPLE PREPARATIONconventional Workflow(In)direct Immunofluorescence1) FIXATION2) PERMEABILIZATION3) BLOCKING NON-SPECIFICSITES4) LABELING WITH ANTIBODIES5) MOUNTING
IMMUNOFLUORESCENCE-MICROSCOPYIndirect IFAlt.: Direct IFAdvantage direct IF: Detection more specific, since omission of unspecific Signals of secondary antibody.Advantage indirect IF: Signal amplification, due to binding of multiple secondary AB‘s to primary AB‘s.
Sample preparationTheoretically it‘s a Western blot – in situ on cells.What‘s different:Cells grow or have to be fixed on any kind of „support“ = which should beoptically transparentFixation neededPermeabilisation for antibody accessAntibodies coupled to fluorophorsDetection -> Microscope„Support“ – Material:Suspension cells:CytospinAdhesion Slides (BioRad): special coatingPoly-Lysine coated Coverslips: rarely suitable for suspension cellsAdherent Cells:Glas-CoverslipsPoly-Lysin-coated CoverslipsFilter-Inserts (porous Polycarbonat-Filter)Chamber-Slides / Chambered Coverglass
FIXIERUNG:variable–should be suited for antigen characteristics (Localisation, Structure, Conformation) and primary antibodies;Usually protocol can be interrupted AFTER fixation is completed – cells on ice (in PBS [Phosphate-buffered-saline –50mM Phosphatpuffer, pH 7.2, 150 mM NaCl]).MetOH:not for integral membrane proteins; it‘s mere protein-Precipitation!! Should becool to cold at –20oC;minimizes lipid extraction and improves fixation quality; isa quick procedure and should not last too long – 3 to 5 min to ensure structuralintegrity. Often in combination (2:1 oder 1:1) with Acetone; Usually cells arealready permeabilized.!! Perfect for cytoskeletal structures !!Formaldehyde/Para-Formaldehyde:some antibodies don‘t like it; Concentration-range: 1-4 % (para-f. Sometimes upto 8 %); Room-Temperature! Over-fixation nearly impossible -10-30 minsufficient; After fixation freely reactive groups need to be blocked: 100mMglycine/PBS or 50mM NH4SO4/PBS or 50mM NH4Cl/PBS.!! Perfect solution for soluble proteins, membrane antigens !!-sometimes cytoskeletal integrity can be compromized.Glutaraldehyde: only a few antibodies like it; blocking of excess with reducingagent NaBH4.EGS (ethylene-glycol-succinimide): preferred for a mix staining of membraneand cytoskeletal structures; rarely used – not well known.
Fixation ChemistryFormaldehyde:Note –commercial37% FA containsup to 10 % ofMetOHGlutaraldehydeThe free aldehyde groupsintroduced byglutaraldehyde fixationcause various problems.These include non-specificbinding of proteinaceousreagents, notablyantibodies, and a directpositivereaction withSchiff's reagent).http://publish.uwo.ca/~jkiernan/formglut.htm
PERMEABILISIATION:For antibody diffusion.usually: PBS + 0.1-0.5 % TritonX-100 (3-5 min)BLOCKING:Mostly used: BSA or Gelatine (0.5 – 1%); for many antibodies blocking does not increase stainingefficiency -> „may not help, but doesn‘t hurt either“-> coffee break.PRIMARY-AB:Like in Western-needs higher titer. Rule of Thumb: 10 times the concentration that worked in Western(Western 1:1000 IF 1:100).Incubation: Room-Temperature; 45-60 min; if weak: either o/n 4oC or 2-3 hrs. at 37oC.Double-Stainings: Mind species cross-reaction!WASHING:3-5 x PBS for 5-10 minSECONDARY AB:Species-and Isoform-Specificity as in western; fluorophore-coupled.Termed INDIRECT Immunofluorescence (iIF) . In case the primary antibody is directly coupled: DirectImmunofluorescence (dIF) -> is more specific, though usually weaker since one antigen can only bind 1-2 antibodies, whereas secondary antibodies amplify the signal up to factors of 10.Incubation: Room Temperature; 45-60 min; if weak: either o/n 4oC or 2-3 hrs. at 37oC.Double-Stainings: Mind fluorophore cross-emission!After 2nd washing step : chance for DNA-counterstaining with DAPI, Hoechst (violet) or Propidium-Iodine (Red; broad; also stains RNA-> RNAse treatment recommended) or other DNA-binding dyes(SYPRO, YOPRO, TOTO – some cell-permeable, some not).
EMBEDDING:Your last washing step should always be water – to get rid of salt ->crystals (light and crystals -> rainbow)Dry!Embedding Media: Miscellaneous (see below)Thin layers only – too thick -> focus depth -> resoultion and focussingcapacity decreases with imaging depth!Some contain „Anti-Fading“ reagents – decrease bleaching effects, some,however, can also influence fluorophore efficiencies.
• ProLong is good for Alexa dyes – can affect autofluorescentproteinsEmbedding Media• Note: refractive index of media should be as close to that ofglass and immersion medium• Some media change RI when hardening - Mowiol• Basis: water, glycerine (RI:1,41), polyvinyl alcohol• Keep as this as possible – avoid air bubbles (scattering!)• Fingernail polish as sealant may quench GFP• Don‘t use VectaShield or ProLong with quantum dotsquenching• Antifade agent p-phenylenediamine (Vectashield) quenchescyanine dyes (Cy2, Cy3..)• Crystal Mount quenches some red dyes (phycoerythrin,phycocyanine)
Check-List• Only use #1.5 (0.17mm) GLASS coverslips – best transmissionand refractive index closest to objective and immersion oil(Correction rings objective?)• Check thickness of support – long distance objectives?• Embed your samples – mounting media prefered with RI closeto glass and immersion medium. Antifading agents-interferencewith fluorophores?• Free „floating“ samples should be sealed for immersionmediumobjectives (shear forces) – sealants: nailpolish(acetone!); VALAP; self-hanrdening silicone (tooth cement)• Counter-stain necessary? – check with fluorophores portfolioused!• Check dyes for cross-excitation/emission and noteautofluorescence (plants, media....)!
FLUORESCENCE MICROSCOPY
Light Sources / 1Halogen LampsMercury Arc LampsXenonLampsLEDswww.olympus.de-High power-200-500h-Peak intensities-Needs alignment- < power than mercury-1500-3000 h-Uniform spectrum-Needs no alignment- ultralong lifetime-cheap-Narrow spectra (lack betw.530 and 580nm)-Individual bulbs – userspecs.-Weaker emissionintensitieshttp://www.olympusmicro.com/
Light Sources / 2Laser• Light amplification by stimulated emission of radiation (energy (frompumping) absorption -> photon -> stimulation of absorption -> photon,photon…. -> resonator for long ways)• Medium for amplification can be gas (HeNe, Ar, Kryptone…) or solid state(Al2O3-rubene, corunde, titan-sapphire…)• Can be continuous wave (cw) or pulsed (photonic packages down to fs)PROPERTIES• COHERENT Light: means waves maintain the same phase relationshipwhile traveling• Laser light is also monochromatic (one wavelength) and polarized (Evectorialpropagation in parallel planes)
Types of Filters• Longpass-filter• Shortpass-filter• Bandpass-filterhttp://www.semrock.com/
Longpassfiltere.g. Longpass 420:Number defines cut-off wavelength. This number is selected atthe „cut-on point“ and will always be specified at 50% oftransmissioncut-on point
Shortpassfiltere.g. Shortpass 500:Number defines wavelength up to which transmission occurs. Itdefines the „cut-off point“) at 50& transmissioncut-off point
Bandpassfiltere.g.: Bandpass 465/70 (alternatively: 430-500)70 = Bandwith: defines broadness of the peak at 50% oftransmission465 = median wavelength – arithmetic average of cut-ofwavelengthes (Cave: often not identical with peak maximum)median wavelengthBandwith
Strahlenteiler = Beamsplitter• Splits Excitation andEmission LightRSP 500DD 488/543
Full Cube assembly Bandpass31001 (Chroma)ExcitationfilterDichroic mirrorEmissionfilterhttp://www.chroma.com/400 500 600 700
Problem 1: cross-excitationa fluorophore is not just excited by wavelength at its peak value, but alsoby wavelength at certain range around the peak, which can extendsinto the area used by other fluorophores.FITC TRITC excitation peaks
Problem 2: cross emission (emissionbleeding through)When emission spectra of two fluorophores overlaps, emission from onechannel will extend to another channel.DAPI-FITC emission peaksFITC TRITC emission peaks
Filter set for simultaneous detection of triplefluorescence82000v2 Filtersatzvon ChromaFür DAPI, FITC, TRITCExcitationfilterDichroic mirrorEmissionfilterhttp://www.chroma.com/400 500 600 700
Pseudo-Confocal Microscopy – Structured IlluminationApproach - „Apotome“• “Apotome”: theprinciple is to collect“in focus” and “out-offocus”informationusing a structuredilluminationLinkhttp://zeiss-campus.magnet.fsu.edu/tutorials/opticalsectioning/apotome/index.html
Pseudo-confocal Microscopy-„Apotome“• Based on an interferometric principle of „gridprojection“ – Structured Illumination Microscopy• Getting rid of blurring –> depth of field informationonly• Grid with a defined width inserted into the plane ofthe field stop into the reflected light beam path ->grid lies in focal plane• Apotome scanner permits the grid to be shifted inposition upper and below focal plane• 3 images generated and superimposed – algorithmbased „deblurring“ -> pseudoconfocal image
Different grids – Differentsectioning• 2 grids – Vh and Vl – for high and lowmagnification© ZeissOptical section thickness (μm):20x/0.75 1.540x/0.75 1.640x/1.3 0.863x/1.4 0.7Josef Gotzmann
WIDEFIELDAPOTOME-MODE63x oil, nA=1,40Josef Gotzmann
Drawbacks - Troubleshooting• Photobleaching• Live Samples -> no fast moving objects• Calibration –UV; violet!• Thickness• Noise – spherical aberration -noise from out of focus lightworse than in confocal(use cooled CCDs)• No high transmission filtersJosef Gotzmann
Apotome - Advantages• Simple sytem – easy integration• Cheap in investment / maintenanceRecent improvement:„Vivatome“: grid on a discFocus info through disc, out-of-focus inforeflected -> overlay. („aperture correlation“)+ fasterJosef Gotzmann
DeconvolutionLimitations to the resolution in an optical system stems from „convolution“: glare,distortion and blurriness from stray light from out-of-focus areas, especially in fluorescencemicroscopy cause acquisition „artefacts“. Also in confocal microscopy these artefacts mayoccur from optical inconsistencies in the specimen, glass, or from optical defects (inpropercorrections) in objectives.Highly sophisticated software calculations can be applied to „reverse“ these artefacts andcreate crispy images for better evaluation.Why do we do it:•Enhanced resolution in all 3 dimensions x, y, and z•Reduction of Noise to improve S/N ratio•Reversal or optimization of optics-based aberrations
The Point-Spread FunctionFor this reversal the „point-spread-function“(PSF) is either calculated or experimentallydetermined and the PSF is the basis for thismathematic reversal approach.The point spread function is the image of apoint source of light from the specimenprojected by the microscope objective ontothe intermediate image plane, i.e. the pointspread function is represented by the Airydisk pattern (see resolution). Due todiffraction, the smallest point to which onecan focus a beam of light using a lens is thesize of the Airy disk. PSF of a system is thethree dimensional diffraction patterngenerated by an ideal point source of light.The PSF is a measure for the ability of asystem to create contrast for a givenresolution in the intermediate image plane.PSF of an individual objective or a lenssystem depends on numerical aperture,objective design, illumination wavelength,and the contrast mode.http://www.biomedical-engineering-online.com/content/5/1/36
Literature• J.Pawley, Handbook of BiologicalConfocal Microscopy, Springer, 2006• D.B.Murphy, Fundamentals of LightMicroscopy and Electronic Imaging,Wiley, 2001 / 2009• E.M.Goldys, Flurescence Applications inBiotechnology and the Life Sciences,Wiley, 2009• Kevin F. Sullivan, Fluorescent Proteins(Methods in Cell Biology) , AcademicPress, 2008• Molecular Biology of the Cell, Alberts,Garland Sciences,• Review series on „Imaging in CellBiology“ in Nature Cell Biology Vol 5(2003) Supplement• Review series on „Biological Imaging“in Science Vol 300 (2003), 82-99• http://www.probes.com/• http://micro.magnet.fsu.edu/primer/techniques/confocal/index.html• http://www.zeiss.com/• http://www.leica-microsystems.com/• http://www.microscopy.olympus.eu/microscopes/• http://www.chroma.com/• http://www.microscopyu.com/• http://zeiss-campus.magnet.fsu.edu/index.html• http://www.microscopy-uk.org.uk/• http://www.olympusmicro.com/• http://www.visitron.de/• http://www.sales.hamamatsu.com/en/home• http://www.evidenttech.com/• https://www.omegafilters.com/index.php• http://www.coolled.com/default.htm• http://rsb.info.nih.gov/ij/• http://www.embl.de/almf/ALMF/Welcome.html• http://www.mshri.on.ca/nagy/• http://www.svi.nl/
Thank you for your attention
Confocal Microscopywhat is different ?Johannes Kochjohannes-paul.koch@univie.ac.at
Depth of Focus
Confocal: Functional ElementsDetectorFilterIlluminationPinholeBeam splitterScannerMicroscopeZ drive
Light source:Extended vs Point illumination
The Pinhole I• Light from below-focal-plane is focused ata plane behind the pinhole.• Light from above-focal-plane is focusedbefore the pinhole.• Only the light from the focal plane isfocused at the pinhole and can reachthe image detector.
The Pinhole IIoptical sectioning possible
The Pinhole IIIA pinhole of 1 airy unit (AU) gives the best signal/noise.A pinhole of 0.5 airy units (AU) will often improve resolution IF THE SIGNAL IS STRONG.http://depts.washington.edu/keck/leica/pinhole.htm
Tight junctionsAdherens junctions© Andreas EgerDesmosomesE-cadherin ß-catenin Desmoplakin
Confocal Overview II• A point light source for illumination• A point light focus within the specimen• A pinhole at the image detecting plane• These three points are opticallyconjugated together and alignedaccurately to each other in the light pathof image formation, this is confocal.• Confocal effects result in supression ofout-of-focal-plane light, supression ofstray light in the final image
Laser I• Monochromatic• Linearly polarizedE-vector• Collimated (coaxial paths ofpropagation through space – indep. of l, phaseor polarization)Type Power Wavelengths (nm)Diode 25 mW 405Argon 100 mW 458, 477, 488, 514GreenHeNeGreenDPSS15 mW 54375 mW 561HeNe 25 mW 633• Coherent – same phase
Laser II – How are they used?• Laser Modulation -> AOTFs• No filters, filter wheels, tunable intensities, wavelenghtesand selection of ROIs• Ultrasound waves workas grating and deflectspecific l / intensity ofwaves regulates intensityof lightDemonstration
Laser III – How are they used?
Area Scanning – Point by Point
Photomultiplier Tube (PMT)+ no „false positives“ - efficiency
Optics I: Overview
Optics I: Splitting wavelengthsMBS:AOBS:• Selectivity?• Flexibility?• Transparency?
Optics II: Selecting wavelengthsFilter based system:Spectrometer system:PMTPMTPMTConfocal pinhole• Selectivity?• Flexibility?• Transparency?• Costs?
Optics III: Spectral DetectionGrating spectrometer:Prism spectrometerDemonstration• Large splitting• Linear splitting• Much higher transparency• For all wavelengths andpolarizations
Confocal Overview IIIno interference from lateral stray light: highercontrast.no out-of-focal-plane signal: less blur, sharperimage.images can be derived from opticallysectioned slices (depth discrimination).Improved resolution (theoretically) due tobetter wave-optical performance.
Practical ExamplesCLSM + spectral detection (LSM 510 META)CLSM for live imaging (LSM 5 Live)Spinning diskMultiphotonTechniques + ProblemsSuperresolution
Configurations – Zeiss LSM510-710280000€Up to 50laser linespossibleRecyclingloop toimprove lightcollectingefficiencyQUASAR: moresensitive, down to3nm
Live Confocal – „Pin“slit vs Pinhole
Live „Confocal“ – Many PinholesDemonstration
Spinning Disk IIDemonstration© Science vol 300 David j. Stephens and Victoria J. Allen
Confocal Spinning DiscBeams 1Illumination 1 mWEmission rate 1.26 x 10 8 photons/secFluorophore saturation 63%Beams > 1000Illumination 0.4-0.6 μWEmission rate 1.72 x 10 5 photons/secFluorophore saturation 0.09%Point Scanner-ConfocalAcquisition Point by point -SLOWDetection PMT -Medium sensitivity(but signalamplification)Optical SectioningAdjustablePinholes -FLEXIBLE – lightloss; NOCROSSTALKSpinning DiscMany points -FASTEM-CCD -High SensitivityFixed Pinhole -INFLEXIBLE; lightloss; CrosstalkpossibleWidefieldOne frame at atime -VERY FASTCCD-EMCCD -Medium-to-highsensitivityNo sectioning -All light collectedhttp://biop.epfl.ch/pdf/PT-BIOPII_Live_cell_imaging-Feb2011-L_Gelman.pdf
Spinning Disc• Advantages:‣ Fast acquisition with minimized energy input to thespecimen‣ Cameras instead of PMTs – no scanning unitsnecessary‣ Illumination sources from lasers extended to LEDs,metal halide lamps or even HBO‣ Preferential for live imaging• Disadvantages:‣ No selectable pinholes – semi-confocal !‣ No ROIs – no FRAP, PA; PC‣ Thickness of sample restriction – fixed pinhole
Multiphoton MicroscopyPulsed lasersNo pinhole neededAdvantage: low photo-cytotoxicity, since the long wavelength infra red laserhas less toxicity than short wavelength.Disadvantage: complicated, expensive
1P vs MP Microscopy1 Ph MP Multiphoton:label is excited only at the focus ofthe beamNo out-of-focus-fluorescence:- No need of confocal aperture- Dye bleaching and phototoxicity arelimited to the plane of focus
What can you do?Z- stack including „3D“ applicationsMulticolorSpectral ImagingColocalizationF-techniques…………
Z-stack
Z-stack: Reducing Dimensions
Z-stack: Animation
Z-stack: Reconstruction• X/Y/Z image stacks are the raw data for 3 D reconstruction• The 3D VisArt menu makes it easy to create 3D views in shadow,transparency and surface projection
Objective behaviour – Imaging Thick samplesRefractive Index
Multicolor Labeling
Problem I: cross- excitationThe excitation profile of a fluorophore is not just a single line, it is a spectrum,i.e. the fluorophore can be excited by light at nm other than at its excitationpeak.
Problem II: cross- emissionWhen emission spectra of two fluorophores overlap, emission from onechannel is recorded (and attributed) to the other channel.Example: ECFP and DsRed2 are excited by lasers (432/ 561nm), emissionis recorded by two PMTs after a beam splitter operating at 550nm.Solution: 1) Add extra filters – record DsRed2 starting from 590nm!2) Do not record both fluorophores at the same time!
Problem III: Problem I + Problem IIWhen emission spectra of two fluorophores overlap, emission from onechannel is recorded (and attributed) to the other channel.Example: EGFP and DsRed2 are excited by lasers (488/ 561nm), emissionis recorded by two PMTs after a beam splitter operating at 550nm.!
The Problems: How to they look like?
Spectral Imagingl-scanDefine fluorophores and spectraunmixwww.zeiss.de
Spectral Imaging
The F-techniques• FRAP: <strong>Fluorescence</strong> Recovery afterPhotobleaching• FLIP: <strong>Fluorescence</strong> loss in photobleaching• PA: Photoactivation• …
F-techniques - methodology
FRAPUsing FRAP, one can determinethe mobility of fluorescently taggedproteins in living cells. FRAP allowsquantitation of•diffusion coefficient•immobile fraction•binding or residence time.www.zeiss.dehttp://www.cf.gu.se/digitalAssets/725/725440_FRAP_recovery.gif
iFRAP
FLIPA part of a cell at a distance from where there is an excess of fluorescentprotein is bleached with a laser at low intensity. One then images the samplejust before and at constant intervals after bleaching, allowing the bleachedmolecules to redistribute through the cell – the loss of fluorescence isrecalculated to measure the diffusion dynamics.Applications: e.g.: checking the continuity of membrane systems (ER, Golgi).
“Optical Highlighters”PHOTOACTIVATION405nmPHOTOCONVERSION405nmPHOTOSWITCHING405nm488nm© Josef Gotzmann
OverviewPA PS PC
Photoactivation (and yet another F-technique…)Mito-paGFPmRFP-PEX11b + Px-paGFP<strong>Fluorescence</strong> Decay After Photoactivation
http://www.nature.com/focus/cellbioimaging/content/images/ncb1032-f3.jpgJ Cell Sci. 2007 Dec 15;120(Pt 24):4247-60.Advances in fluorescent protein technology.Shaner NC, Patterson GH, Davidson MWPA-GFP: photoactivation (PA) none->greenKaede: green-> red photoconversion (PC)irreversible; tetrameric and hard to coupleto biological samplesKindling red: none->red PA upon greenlight (less damage)Dronpa: on-off photoswitchable protein –490nm ->off / 400nm ->onDendra2: monomeric; green->red PC; byblue light (also for imaging unconverted!)© Josef Gotzmannhttp://www.olympusconfocal.com/applications/fpcolorpalette.html
Superresolution Ii.e. breaking the __________-limit diffraction of a microscopephysicallymathematicallyREversible Saturable OpticaL<strong>Fluorescence</strong> Transitions(STED, GSD, SSIM, …)PALMSTORM4-PiNear-Field
Superresolution II - RESOLFTREversible Saturable OpticaL <strong>Fluorescence</strong> TransitionsSTED – Stimulated Emission Depletion~20nm resolution in x/y, „only“ 100nm in z
Superresolution using Fitting Algorithms• Blinking fluorophores is the pre-requuisite forthis technique
(Fluorescenct)-PhotoActivationLocalizationMicroscopy (PALM)(Eric Betzig, Berkeley)Linkhttp://www.youtube.com/watch?v=RE70GuMCzww