Download November 2005 Issue - Malaysian Institute of Planners
Download November 2005 Issue - Malaysian Institute of Planners
Download November 2005 Issue - Malaysian Institute of Planners

You also want an ePaper? Increase the reach of your titles
YUMPU automatically turns print PDFs into web optimized ePapers that Google loves.
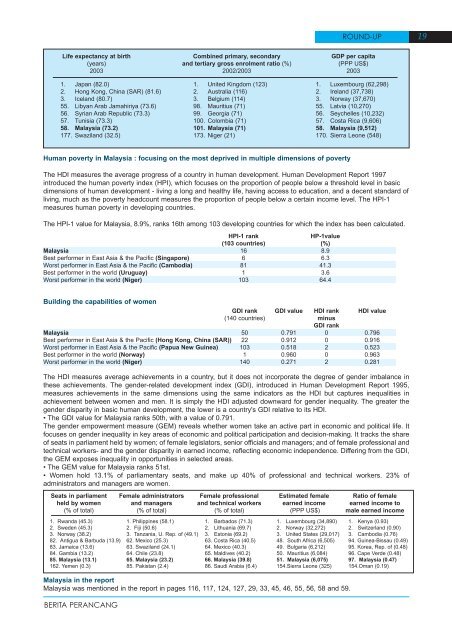
ROUND-UP 19Life expectancy at birth(years)20031. Japan (82.0)2. Hong Kong, China (SAR) (81.6)3. Iceland (80.7)55. Libyan Arab Jamahiriya (73.6)56. Syrian Arab Republic (73.3)57. Tunisia (73.3)58. Malaysia (73.2)177. Swaziland (32.5)Combined primary, secondaryand tertiary gross enrolment ratio (%)2002/20031. United Kingdom (123)2. Australia (116)3. Belgium (114)98. Mauritius (71)99. Georgia (71)100. Colombia (71)101. Malaysia (71)173. Niger (21)GDP per capita(PPP US$)20031. Luxembourg (62,298)2. Ireland (37,738)3. Norway (37,670)55. Latvia (10,270)56. Seychelles (10,232)57. Costa Rica (9,606)58. Malaysia (9,512)170. Sierra Leone (548)Human poverty in Malaysia : focusing on the most deprived in multiple dimensions <strong>of</strong> povertyThe HDI measures the average progress <strong>of</strong> a country in human development. Human Development Report 1997introduced the human poverty index (HPI), which focuses on the proportion <strong>of</strong> people below a threshold level in basicdimensions <strong>of</strong> human development - living a long and healthy life, having access to education, and a decent standard <strong>of</strong>living, much as the poverty headcount measures the proportion <strong>of</strong> people below a certain income level. The HPI-1measures human poverty in developing countries.The HPI-1 value for Malaysia, 8.9%, ranks 16th among 103 developing countries for which the index has been calculated.HPI-1 rankHP-1value(103 countries) (%)Malaysia 16 8.9Best performer in East Asia & the Pacific (Singapore) 6 6.3Worst performer in East Asia & the Pacific (Cambodia) 81 41.3Best performer in the world (Uruguay) 1 3.6Worst performer in the world (Niger) 103 64.4Building the capabilities <strong>of</strong> womenGDI rank GDI value HDI rank HDI value(140 countries) minusGDI rankMalaysia 50 0.791 0 0.796Best performer in East Asia & the Pacific (Hong Kong, China (SAR)) 22 0.912 0 0.916Worst performer in East Asia & the Pacific (Papua New Guinea) 103 0.518 2 0.523Best performer in the world (Norway) 1 0.960 0 0.963Worst performer in the world (Niger) 140 0.271 2 0.281The HDI measures average achievements in a country, but it does not incorporate the degree <strong>of</strong> gender imbalance inthese achievements. The gender-related development index (GDI), introduced in Human Development Report 1995,measures achievements in the same dimensions using the same indicators as the HDI but captures inequalities inachievement between women and men. It is simply the HDI adjusted downward for gender inequality. The greater thegender disparity in basic human development, the lower is a country's GDI relative to its HDI.• The GDI value for Malaysia ranks 50th, with a value <strong>of</strong> 0.791.The gender empowerment measure (GEM) reveals whether women take an active part in economic and political life. Itfocuses on gender inequality in key areas <strong>of</strong> economic and political participation and decision-making. It tracks the share<strong>of</strong> seats in parliament held by women; <strong>of</strong> female legislators, senior <strong>of</strong>ficials and managers; and <strong>of</strong> female pr<strong>of</strong>essional andtechnical workers- and the gender disparity in earned income, reflecting economic independence. Differing from the GDI,the GEM exposes inequality in opportunities in selected areas.• The GEM value for Malaysia ranks 51st.• Women hold 13.1% <strong>of</strong> parliamentary seats, and make up 40% <strong>of</strong> pr<strong>of</strong>essional and technical workers. 23% <strong>of</strong>administrators and managers are women.Seats in parliamentheld by women(% <strong>of</strong> total)1. Rwanda (45.3)2. Sweden (45.3)3. Norway (38.2)82. Antigua & Barbuda (13.9)83. Jamaica (13.6)84. Gambia (13.2)85. Malaysia (13.1)162. Yemen (0.3)Female administratorsand managers(% <strong>of</strong> total)1. Philippines (58.1)2. Fiji (50.6)3. Tanzania, U. Rep. <strong>of</strong> (49.1)62. Mexico (25.3)63. Swaziland (24.1)64. Chile (23.8)65. Malaysia (23.2)85. Pakistan (2.4)Female pr<strong>of</strong>essionaland technical workers(% <strong>of</strong> total)1. Barbados (71.3)2. Lithuania (69.7)3. Estonia (69.2)63. Costa Rica (40.5)64. Mexico (40.3)65. Maldives (40.2)66. Malaysia (39.8)86. Saudi Arabia (6.4)Estimated femaleearned income(PPP US$)1. Luxembourg (34,890)2. Norway (32,272)3. United States (29,017)48. South Africa (6,505)49. Bulgaria (6,212)50. Mauritius (6,084)51. Malaysia (6,075)154.Sierra Leone (325)Ratio <strong>of</strong> femaleearned income tomale earned income1. Kenya (0.93)2. Switzerland (0.90)3. Cambodia (0.76)94. Guinea-Bissau (0.49)95. Korea, Rep. <strong>of</strong> (0.48)96. Cape Verde (0.48)97. Malaysia (0.47)154.Oman (0.19)Malaysia in the reportMalaysia was mentioned in the report in pages 116, 117, 124, 127, 29, 33, 45, 46, 55, 56, 58 and 59.BERITA PERANCANG