presentation, part 1 - Molecular Evolution
presentation, part 1 - Molecular Evolution
presentation, part 1 - Molecular Evolution
- No tags were found...

Create successful ePaper yourself
Turn your PDF publications into a flip-book with our unique Google optimized e-Paper software.
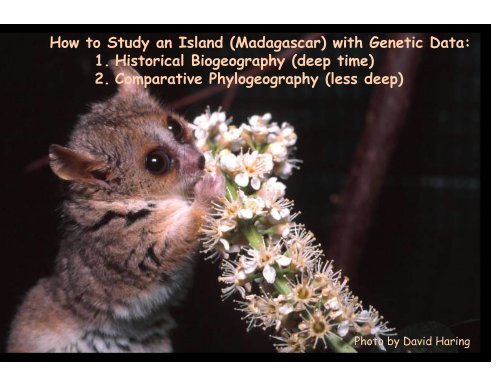
How to Study an Island (Madagascar) with Genetic Data:1. Historical Biogeography (deep time)2. Comparative Phylogeography (less deep)Photo by David Haring
“The biogeographic origins of themodern terrestrial and freshwatervertebrate fauna of Madagascarremain one of the greatest unsolvedmysteries of natural history.”Krause et al., 1997; p. 3
Using Tree Thinking to Reconstructthe <strong>Evolution</strong> of an IslandPart I1. Set the stage: why Madagascar?2. Introduce some of the key players (lemurs!)3. Describe some of the methods that we have usedfor estimating divergence ages.4. What are the biogeographic implications?Part II1. A close look at a few species radiations withinMadagascar (and, why the answer to the question:“What is a species?”, really matters!)2. Connections between abiotic and bioticphenomena; are they causal?3. What about the future?
Madagascar is special (let me count the ways):• world’s 4th largest island• has been isolated from all other landmasses forat least 88 my• is a “microcontinent” comprised of manymicrohabitats and microclimates• levels of species endemism > 90% in mostvertebrate groups• Is one of the world’s hottest biodiversityhotspots (Meyrs et al., 2000)• “Exceptional concentrations of endemic speciesare undergoing exceptional loss of habitat”• we are only beginning to scratch the surface ofbiodiversity discovery (it is not an easy place toget around!)Digital map courtesy of Reed Beaman
Rush hour traffic in Madagascar
Dry!480 km!1600 km!Wet!
Imbalance & Endemism in !Madagascar’s Terrestrial Mammals!PRESENT!Extant:!• Primates (100% endemic)!• Carnivores (100% endemic)!• Rodents (100% endemic)!• Tenrecs (100% endemic)!Extinct:!• Plesiorycteropus (unique)!• pygmy hippo!ABSENT!Catarrhine primates!Caniform carnivores!Lagomorphs!Pholidotans!Scandentians!Tubulidentates!Hyraxes!Perrisodactyls!Proboscidians!
400 km!
Dr. Chris Scotese (Arizona State)The Paleomap Project
How many times, When, and byWhat mechanisms did TerrestrialMammals (Vertebrates) ColonizeMadagascar?
Vicariance?(“paleo-endemics”)Disperal?(“neo-endemics”)
Mammalian Fossil Record of Madagascar!millions of years ago"Miocene"Oligocene"Eocene"Paleocene"Cretaceous"present!10!20!30!40!50!60!70!80!Primates, rodents, hippos,!Carnivores, insectivores,!Plesiorycteropus!ZERO!A few gondwanatheres,metatherians, unrelated eutherians!
(i.e., the end of the“age of dinosaurs”)
DATED PHYLOGENIESGive a minimum estimateof colonization eventsArea 1 Area 2COLONIZATIONStem NodeEstimated Timeof DivergenceCrown Node1. Shape of the tree2. Ages of the nodes
Montane rainforest!(Annual rainfall > 1500mm)!
Dry deciduous and thorn forest!(Annual rainfall ~ 500mm)!
Has central plateau served as a barrier togene flow for forest-dwelling vertebrates?!
Evaluating Biogeographic Barriers!Barrier to Gene Flow!Gene Flow across Barrier!Area 1! Area 2! Area 1! Area 2!East versus West in Madagascar?
1! 2! 3!10 mya (+1.8)1! 2! 3!9.2 mya (+1.2)1! 2! 3! 4!Phylogenies of threehypothetical vertebrategroups are comparedwith respect to barrier.Ancestral divergencefor each is estimated tobe 8-12 mya, implyingthat feature has beenbiogeographic barriersince that time.10.8 mya (+2)A. "
Human Impact:- Humans arrived in Madagascar ~ 2000 years ago- Current population is ~ 16 million- Population growth rate is ~ 3.1% per year- Per capita annual income around $250- subsistence needs (rice, pasture, fuel)
Human Impact:- Humans arrived in Madagascar ~ 2000 years agoNew Threat: MiningOperations are swinginginto full gear!- Current population is ~ 16 million- Population growth rate is ~ 3.1% per year- Per capita annual income around $250- subsistence needs (rice, pasture, fuel)
U.S. DEPARTMENT OF STATE (March 13, 2009)“Madagascar’s political crisis has entered adangerous phase.”While the new Malagasy government isotherwise preoccupied and some park rangershave left their posts, armed groups are cuttingdown valuable rosewood trees. Theseactivities are threatening animals such as thesilky sifaka, which is one of the 25 mostendangered primates in the world.
So what are we going to doabout it?
Carnivorans
Rodents
Tenrecs
LEMURS!!LEMURS!!
4 Orders of Magnitude!All possible activity cycles!Many locomotory styles!Virtually all primate diets!Multiple social structures!
Photo by David Haring
Photo by David Haring
Photo by Franz Lanting
Photo by David Haring
Photo by me
Photo by David Haring
Photo by David Haring
Back Migration!
Ascending Pharyngeal Artery!
Dissertation Question!
Genetic Consensus of Strepsirrhine PhylogenyLORISIFORMS"Cheirogaleids NestedWithin CladeMalagasy Primate CladeYoder (1997)
16 species!Within the past2000 years!
Archaeoindris!Mouse lemur!
Verification of Ancient DNA!- Facility separate from main laboratory!- Elaborate contamination control!- Multiple individuals per taxon!- Multiple extractions per individual!- Multiple PCRs per extraction!- Multiple overlapping primer pairs!- Two genes!- Lots of negative controls (extraction & PCR) !* Replication in an independent Lab (AFDIL)!
Office!Main lab!Thermocycler!Gel electrophoresis!Sequencing!Extraction room!Ancient DNA !lab setup!aDNA lab!Ante!room!PCR !room!Exit!
Karanth et al., 2005; PNAS
Megaladapis cytochrome b sequences from clones!10 20 30 40 50 60 70 80 90!| * | | * * |* | | *| * | |!7.3L14839M39-31 -------------------------------------------------------------ATTTCGGCTCCCTACTAGGAGCTTGCCTAG!7.3L14839M39-32 -------------------------------------------------------------ATTTCGGCTCCCTACTAGGAGCTTGCCTAG!Praveen Karanth7.3L14839M39-33 -------------------------------------------------------------ATTTCGGCTCCCTACTAGGAGCTTGCCTAG!7.3H14954M39-33 -------------------------------------------------------------ATTTCGGCTCCCTACTAGGAGCTTGCCTAG!7.3MegL45M43-16 -------------------------------TTACTCCATCCAATATCTCCTCATGATGAAATTTCGGCTCCCTACTAGGAGCTTGCCTAG!7.3MegL45M43-15 -------------------------------TTACTCCATCCAATATCTCCTCATGATGAAATTTCGGCTCCCTACTAGGAGCTTGCCTAG!7.3MegL45M43-18 -------------------------------TTACTCCATCCAATATCTCCTCATGATGAAATTTCGGCTCCCTACTAGGAGCTTGCCTAG!7.3MegL45M43-20 -------------------------------TTACTCCATCCAATATCTCCTCATGATGAAATTTCGGCTCCCTACTAGGAGCTTGCCTAG!7.3MegL45M33-16 -------------------------------CTACTCTATTCAATATCTCCTCATGATGAAATTTCGGCTCCCTATTAGGAGCTTGCCTAG!7.3MegL45M33-17 -------------------------------CTACTCTATTCAATATCTCCTCATGATGAAATTTCGGCTCCCTATTAGGAGCTTGCCTAG!7.3MegL45M33-18 -------------------------------CTACTCTATTCAATATCTCCTCATGATGAAATTTCGGCTCCCTATTAGGAGCTTGCCTAG!7.3MegL45M33-19 -------------------------------CTACTCTATTCAATATCTCCTCATGATGAAATTTCGGCTCCCTATTAGGAGCTTGCCTAG!7.3MegL45M33-20 -------------------------------CTACTCTATTCAATATCTCCTCATGATGAAATTTCGGCTCCCTATTAGGAGCTTGCCTAG!7.3H14901M33-20 -------------------------------CTACTCTATTCAATATCTCCTCATGATGAAATTTCGGCTCCCTATTAGGAGCTTGCCTAG!7.3H14901M32-23 -------------------------------CTACTCTATTCAATATCTCCTCATGATGAAATTTCGGCTCCNTATTAGGAGCTTGCCTAG!7.3L14761M19-1 AAAATTATAAATAATTCATTTATCGATCTGCCTACTTCATTCAATATCTCCTCATGATGAAATTTCGGTT---------------------!7.3L14761M19-2 AAAATTATAAATAATTCATTTATCGATCTGCCTACTTCATTCAATATCTCCTCATGATGAAATTTCGGTT---------------------!7.3L14761M19-7 AAAATTAGAAATAATTCATTTATCGATCTGCCTACTTCATTCAATATCTCCTCATGATGAAATTTCGGTT---------------------!7.3H14851M19-8 AAAATTATAAACAATTCATTTATCGATCTGCCTACTCCATCCAATATCTCCTC--------------------------------------!7.3L14761M19-8 AAAATTATAAACAATTCATTTATCGATCTGCCTACTCCATCCAATATCTCCTCATGATGAAATTTCGGTT---------------------!7.3L14761M29-11 AAAATTATAAACAATTCATTTATCGATCTGCCTACTCCATCCAATATCTCCTCATGATGAAATTTCGGCTC--------------------!7.3L14761M29-12 AAAATTATAAATAATTCATTTATCGATCTGCCTACTCCATCCAATATCTCCTCATGATGAAATTTCGGCTC--------------------!7.3L14761M27-21 AAAATTATAAACAATTCATTTATCGATCTGCCTACTCCATCCAATATCTCCTCATGATGAAATTTCGGCTC--------------------!7.3L14761M27-23 AAAATTATAAACAATTCATTTATCGATCTGCNTACTCCATCCAATATCTCNTCATGATGAAATTTCGGCTC--------------------!7.3L14761M27-22 AAAATTATAAATAATTCATTTATCGATCTGCCTACTCCATCCAATATCTCCTCATGATGAAATTTCGGCTC--------------------!Meg_UA4823_7.3Meg_UA4822_4&6AAAATTATAAACAATTCATTTATCGATCTGCCTACTCCATCCAATATCTCCTCATGATGAAATTTCGGCTCCCTACTAGGAGCTTGCCTAG!AAAATTATAAACAATTCATTTATCGATCTGCCTACTCCATCCAATATCTCCTCATGATGAAATTTCGGCTCCCTACTAGGAGCTTGCCTAG!
Extinct &Extant lemursform a cladeThe aye-ayeremains as thebasal lineageKaranth et al., 2005; PNAS
Extinct &Extant lemursform a cladeAnd remember, we’re onlytalking about something onthe order of 400 bp ofmtDNA here!The aye-ayeremains as thebasal lineageKaranth et al., 2005; PNAS
Single Origin!Yoder et a. (1996)
Single dispersal:lemurs (Yoder et al., 1996)rodents (Jansa et al. 1999)vangas (Yamagashi et al., 2001)songbirds (Cibois et al., 1999)carnivorans (Yoder and Flynn, 2003)tenrecs (Olson 1998; Douady et al., 2002)cophyline frogs (Andreone et al., 2005)scincine lizards (Schmitz et al., 2005)zoonosaurine lizards (Raselimanana et al., 2009)Multiple dispersals:chameleons (Raxworthy et al., 2002)?
Genetic Consensus of Strepsirrhine PhylogenyVirtually every conceivable resolutionof this node has been found in studiesusing different loci …Cheirogaleids NestedWithin CladeMalagasy Primate CladeYoder (1997)
“Hard” polytomy versus “Soft” polytomy
“Soft” polytomy(aka, we have stumbledinto the“Felsenstein Zone”
Lineage SortingComplete Lineage Sorting:(all alleles within a species are reciprocally monophyletic)
This is ideal, but each and every independentsegment of the genome potentially has adifferent history, especially when species arerecently diverged. I.e., gene trees do notnecessarily equate to species trees.
Developing New Lemur-Specific Loci• BAC sequences for L. catta (ringtailed lemur) andM. murinus (mouse lemur) were downloaded fromGenBank• These were masked for known primate repeats• Masked BACs were then compared to humansequence (hg18) by BLAST• Regions of homology were identified, and primersdesigned accordinglyHorvath et al. (2008) Genome Research
“Phylogenomics Toolkit”Table 2: Primer InformationLocus Forward Primer Sequence Reverse Primer Sequence Gene Hg18 ChrPCR Size(bp)NEWLY DESIGNEDABCA1 Newly Designed CCTCCATCTTTTCAGCTCTACCTAC ~9kb (11 nuclear ACAAGAGCCTGGAGATTGGATAAC loci across 9 chromosomes)ATP-binding cassette sub-family A member 1 Chr9 638AXIN1 CTCTGCCTTCGCTGTACCGTCTAC GACCCACCTTTCCTAATCCTTGTC axin 1 isoform a Chr16 995CFTR-Pair A CTGTGATAGAACAGTTTCCTGGG GCTTCTATCCTGTGTTCACAGAG cystic fibrosis transmembrane conductance Chr7 839CFTR-Pair B CTCTGTGAACACAGGATAGAAGC TTACCTCCAGGAGGCTCAAAAGCC cystic fibrosis transmembrane conductance Chr7 815ERC2 AGCTCATCCTCCTCCTGGTTTAG CTCCTTGAGGATCTCCAGCAAC cytomatrix protein p110 Chr3 790LRPPRC-Pair A CTGGAGACAGCTTTTGTGTTATCC ACCTTAGAGGCTGAAAGTGACTG leucine-rich PPR motif-containing protein Chr2 916LRPPRC-Pair B GACACAGGGAGTCTACACAAACAC GATGCCAGAGCTCTCCTACAG leucine-rich PPR motif-containing protein Chr2 818LUC7L CAGCAGTCCAGAAGGTGACTCTTG GCAGATGGGTACAGTATGTGTTGG LUC7-like isoform a Chr16 728Non-coding CCAGATGACTTAGAAATCTCTCCC GCTTCTTATGATGGTCTGAGTTGG none Chr15 850SRBEF2 AAGACGCTCAGGACAATCACAC CTTCCTGTGCCTCTCCTTTAAC sterol regulatory element-binding transcription Chr22 715ZNF202 AAGTGATATCCTCTGCTGAAGC CCAGACTCCAGATTGGGAAA zinc finger protein 202 Chr11 861PUBLISHEDMITO COII AACCATTTCATAACTTTGTCA CTCTTTAATCTTTAACTTAAAAG Cytochrome oxidase II mitochondrialPreviously MITO CYTB CGAAGCTTGATATGAAAAACCATCGTT Published ~7.5kb (7 AACTGCAGTCATCTCCGGTTTACAAGAC nuclear & mtDNA) Cytochrome b mitochondrialADORA3 TGGACTTCAAGTCTCCCGATGACCCCAGC CCAAGCTCCCCAGTCATCCTGGTCAAA Adenosine receptor A3 - exon 2 Chr1 403FGA AAGCGCAAAGTCATAGAAAAAG CTAAAGCCCTACTGCATGACCCT fibrinogen alpha polypeptide isoform alpha-E - intron 4 Chr4 735RBP3 ATGGCCAAGGTCCTCTTGGATAACTACTGCTT CGCAGGTCCATGATGAGGTGCTCCGTGTCCTGretinol-binding protein 3 precursor - exon 1 Chr10 1346NRAMP ACATGCAGGAAGTCATCGG CGAGGAAGAGGAGAAGAAGG natural resistance-associated macrophage protein Chr2RAG1 AAGACATCTTGGAAGGCATGA AAAGTTGCCATTCATCCTCA recombination activating gene 1 Chr11TTR TGCCTCGCTGGACTGGTATT GACAGCATCTAGAACTTTGACCAT thyroxine-binding prealbumin - intron 1 Chr18VWF Check Check von Willebrand Factor - intron 11 Chr12Dave please fill inHorvath et al. (2008) Genome Research
22 out of 25 nodeshave bootstrapsupport greater than90% and posteriorprobabilities of 1.0when all nuclear lociare combined.Horvath et al. (2008) Genome Research
Single Origin!Yoder et a. (1996)
“Ignoring temporal information obscures theconnection between biogeographic patternsand their underlying causes”Donoghue & Moore, 2003
What does this mean forMadagascar???• if clades are very old (> 88 my), thenthey probably result from vicariance (i.e.,they were already on Madagascar when itseparated from other landmasses).• if they are younger, then they must havedispersed from elsewhere, and acrosslarge marine barriers.
What is the <strong>Molecular</strong> Clock Hypothesis?TimeGenetic distanceStrictly linear relationship between genetic distance and time
Number of substitutions"80!60!40!20!0!shark"carp"platypus"chicken"cow"0! 100! 200! 300! 400! 500!Time to common ancestor"Adapted from Gillespie (1991)
Raw Genetic Differences"Species 1: AACTAGGTCG!Species 2: AGCTAGGCCG!Uncorrected Distance"2/10 = 0.20!
The <strong>Molecular</strong> ClockThe PresentYou can follow any path from root node to any tipand the additive value will equal that from anyother path=!
The <strong>Molecular</strong> ClockThe Present0.10substitutionsper site10 myaDivide branch length by time, and get rate0.1/10 = 0.01 substitutions/site/my
The <strong>Molecular</strong> ClockThe Present0.02?10 mya0.1/10 = 0.01 substitutions/site/my
The <strong>Molecular</strong> ClockThe Present0.022 Ma10 myaDivide branch length by rate, and get time0.02/0.01 = 2 my
AThe PresentBCDA> C > B >DViolation of the clock; we see this more often than not.
T3C2C1T2T1Rate and Time are confounded; we don’t know if this longbranch reflects long period of evolutionary history, or ifit reflects rapid rate of molecular evolution.
Figure from Graur and Li (2000)Totals:Actual Mutations = 13Observed Mutations = 3
General Time Reversible (6-parameter model)A$ !G&!" ! #' !!C% !TEach substitution category can have a different probabilityof change. The model is “time reversible” becauseprobabilities are equal in both directions.
Models are Important!Uncorrected!Corrected!1!3!1!6!• internal branches are differentially lengthened with correction• can have the effect of making internal nodes disproportionatelyolder
Monkey! Human!Whale! Hippo!TimeUsing these fossil agesas calibrations willcause systematicunderestimatesUsing this fossil agewill give betterestimatesThe Tree• fossil ages may or may not be close to the nodesthat we’re using as calibrations
Monkey! Human!Whale! Hippo!TimeThe TreeWould like to be able to integrate informationrelating to our confidence in a <strong>part</strong>icular calibration
We need a method that …!• allows for violation of the molecular clock• corrects for multiple hits via models ofmolecular evolution• allows one to use multiple fossilcalibrations, and ideally, accommodate foruncertainties in the fossil record (via upperand lower bounds)
Photo by David Haring
Major Innovation …• Both methods developed to allow for multiplegenes with gene-specific evolutionary parametersincorporated into combined analysis• The fact that each gene may violate the molecularclock differently is the underlying advantage ofsimultaneous analysis of multiple loci
10.10.1FelisCanis-LorisGalagoLemurFelisE.mongozPropithecuCheirogaleHapalemurE.macacoCanisMirzaMicrocebusPropithecuCheirogale-E.macacoVareciaHapalemurLemurE.mongozGalago-VareciaLorisLepilemurDidelphisCanisMicrocebusDaubentoniMirzaDidelphisLepilemurLorisDaubentoniGorillaPongoHomo--DidelphisCallithrixColobusMacacaPongoGorillaHomoCallithrixLemurHomoGorillaFelisCallithrix-HapalemurVareciaPongoDaubentoniE.macacoE.mongozMacacaMacacaGalagoMirzaCheirogale-LepilemurPropithecuColobusColobusMicrocebusmtDNA 1st positionLemurs & LorisesMonkeys & ApesmtDNA 2nd positionLemurs & LorisesMonkeys & ApesLemurs & LorisesMonkeys & ApesmtDNA 3rd position
Parameter Estimates by Data PartitionGene Position L ! T ! C ! A ! G" #* parameters estimated from “reduced” taxon sample data set for mtDNA.SubstitutionrateTree length1 608 0.22 0.26 0.29 0.23 3.19 0.30 0.21 14.532 608 0.40 0.25 0.22 0.13 3.03 0.17 0.09 14.113 608 0.21 0.35 0.40 0.05 21.02 1.06 4.49 13.121 315 0.10 0.28 0.22 0.40 1.70 0.61 0.07 18.022 315 0.31 0.23 0.26 0.20 1.29 0.44 0.04 16.803 315 0.10 0.42 0.09 0.39 4.33 1.71 0.21 20.04vWF --- 936 0.23 0.27 0.20 0.30 1.56 2.54 0.12 68.74TR --- 901 0.32 0.17 0.33 0.18 1.22 7.13 0.14 8.05Yoder & Yang (2004)
Bayesian age estimates:• <strong>part</strong>ition-specificparameters• F84 + (• Microcebussurprisingly old• Age estimate forloris/galagodivergence twice asold as expectedMicrocebus10.0 MaLoris/Galago40.5 Ma
Figure 1 Middle Eocene lorisiforms from northern Egypt. a, isolated upper teeth of Karanisia clarkigen et sp. nov.: P3 (DPC 21371B), P4 (DPC 21214E, reversed), M1 (DPC 21639C), M2 (DPC 21636E), M3 (DPC 21365C)]. b, right mandible of K.clarki (DPC 21249) illustrating size and orientation of damaged alveoli for lower anterior dentition. P, premolar; C, canine; I, incisor. c–g,Stereomicrographs of c, K. clarki holotype (CGM 40265), left mandible preserving M1to M3; d, isolated left lower canine (DPC 21487B) of K. clarki; e,Saharagalago misrensis gen et sp. nov. probable M1 (DPC 21214B); f, S. misrensis holotype M1(CGM 40266); g, K. clarki left lower canine (DPC 21487B),mesial face.
~40 Ma!
N8N9N10C3N1N3N4N5N6N7N11C2N2C8C1C7C6C5C4M. ravelobensis (2)M. sambiranensis (2)M. “rufus2" (2)M. tavaratra (2)M. “rufus1" (4)M. berthae (2)M. myoxinus (2)M. griseorufus (4)M. murinus (5)MirzaCheirogaleusLepilemurPropithecusE. f. collarisE. f. albifronsE. f. rufusE. mongozE. rubriventerE. m. macacoE. m. flavifronsLemurHapalemurV. v. variegataV. v. rubraDaubentoniaNycticebusLorisG. moholiG. demidoffCallithrixSaguinusColobusMacacaCercopithecusErythrocebusPongoGorillaPanHomoCanisUrsusFelisBosHippopatomusBalaenopteraPhyseterRhinocerosEquusOutgroupC1: Human/Gorilla (8-12 Ma)C2: Monkey/Ape (32-38 Ma)C3: Basal Primate (63-90 Ma)C4: Perrisodactyla (50-58 Ma)C5: Whale/Whale (33-40 Ma)C6: Whale/Hippo (51-60 Ma)C7: Canid/Felid (45-65 Ma)C8: Loris/Galago (38-42 Ma)
Excellent data quality; very good taxon samplingDidelphisDaubentoniaPropithecusLepilemurCheirogaleusMirzaM. ravelobensisM. murinusE. f. collarisE. f. albifronsE. f. rufusE. mongozE. rubriventerE. m. macacoE. m. flavifronsLemurHapalemurV. v. variegataV. v. rubraLorisG. demidoffCallithrixMacacaPongoGorillaPanHomoFelisCanisUrsusBosHippopatomusBalaenopteraPhyseterRhinocerosEquusCOII and cytochrome b (mtDNA protein-coding; 1824 bp; 52% informative)
Excellent data quality; very good taxon samplingDidelphisDaubentoniaPropithecusLepilemurCheirogaleusMirzaM. murinusE. f. collarisE. f. albifronsE. f. rufusE. mongozE. rubriventerE. m. macacoE. m. flavifronsLemurHapalemurV. v. variegataV. v. rubraNycticebusLorisG. moholiG. demidoffCallithrixSaguinusColobusMacacaCercopithecusErythrocebusPongoGorillaHomoFelisCanisBosHippopatomusBalaenopteraPhyseterTapirusEquusIRBP (nuclear exon; 945 bp; 37% informative)
Good data quality; poor taxon samplingScalopusDaubentoniaCheirogaleusE. f. collarisE. f. albifronsE. f. rufusE. m. macacoE. m. flavifronsLemurHapalemurV. v. variegataV. v. rubraCallithrixSaguinusHomoColobusMacacaCercopithecusErythrocebusFelisCanisTransthyretin (nuclear intron; ~900 bp; 31% informative)
Poor data quality; good taxon samplingMusDaubentoniaPropithecusLepilemurCheirogaleusMirzaM. ravelobensisM. murinusV. v. rubraLemurHapalemurE. m. flavifronsE. f. albifronsE. f. rufusE. f. collarisE. mongozE. rubriventerNycticebusLorisG. moholiG. demidoffCebusCallithrixSaguinusColobusMacacaCercopithecusErythrocebusPongoGorillaHomoVon Wilebrand Factor (nuclear intron; ~900 bp; 47% informative)
Table 4 Posterior means and 95% credibility intervals for divergence timesmtDNA(3 <strong>part</strong>itions)Node complete 2 speciesTRvWFIRBP(3 <strong>part</strong>itions)3 nuclear(5 <strong>part</strong>itions)All genes(8 <strong>part</strong>itions)N1) Northern Clade10.0(6.3, 15.2)NA NA NA NA NA NAN2) Southern Clade8.8(5.3, 13.6)NA NA NA NA NA NAN3) Microcebus12.09.08.78.9NANANA(7.8, 17.9) (5.2, 14.0)(3.7, 16.5)(5.5, 13.2)N4) Microcebus/Mirza24.220.519.322.819.119.9NA(16.8, 33.4) (13.5, 29.2)(10.8, 30.5) (11.3, 36.6) (12.3, 27.6) (14.6, 26.1)N5) Cheirogaleidae 1 31.826.731.330.930.629.0NA(23.4, 41.6) (18.8, 36.4)(19.9, 44.2) (19.2, 44.7) (22.4, 39.7) (22.7, 35.9)N6) Eulemur8.46.67.014.614.611.19.7(5.3, 13.4) (3.8, 11.1) (2.1, 15.7) (7.8, 24.2) (7.8, 23.7) (7.0, 16.4) (6.5. 13.7)N7) Lemuridae35.933.132.133.426.431.131.9(27.0, 46.3) (24.2, 43.8) (20.4, 46.5) (22.4, 46.2) (16.3, 39.1) (23.3, 39.8) (25.6, 38.8)N8) Internal Lemuriform46.743.845.745.142.242.3NA(36.9, 57.5) (33.8, 54.9)(33.5, 58.5) (32.4, 60.1) (33.5, 51.3) (35.4, 49.5)N9) Lemuriformes67.165.754.962.860.265.062.0(56.8, 77.2) (54.8, 76.3) (41.7, 70.6) (51.3, 74.4) (46.2, 75.1) (56.3, 73.7) (57.9, 73.0)C8) Lorisiformes (38 – 42 mya)40.039.939.739.639.539.1NA(38.1, Pleasing 41.9) (38.1, congruence 41.9) of date (38.1, 41.8) estimates (38.1, 41.8) across (38.1, 41.8) loci (38.0, 41.5)N10) Strepsirrhini72.972.470.770.174.968.5NA(64.0, 82.0) (63.2, 81.7)(60.3, 81.6) (56.8, 83.8) (66.1, 83.0) (61.3, 75.4)C1) Human/Gorilla (8 –12 mya)10.910.710.19.49.610.2NA(8.9, 12.0) (8.6, 12.0)(8.1, 11.9) (8.0, 11.7) (8.1, 11.8) (8.2, 11.9)C2) Monkey/Ape (32 – 38 mya)34.034.235.234.734.734.234.7(32.1, 37.5) (32.1, 37.6) (32.2, 37.9) (32.1, 37.8) (32.1, 37.8) (32.1, 37.5) (32.1, 37.8)N11) Anthropoidea61.862.243.542.049.842.949.4(51.0, 73.8) (50.5, 75.1) (36.6, 51.5) (35.4, 49.9) (37.6, 64.3) (37.8, 48.7) (43.5, 55.7)C3) Basal primate (63 –90 mya)85.985.970.085.985.482.584.9(78.4, 89.9) (78.1, 89.8) (63.2, 84.0) (78.1, 89.8) (75.4, 89.8) (73.0, 89.6) (76.9, 89.8)C7) Canid/felid (45 – 65 mya)58.157.955.757.260.161.4NA(48.9, 64.6) (48.6, 64.6) (45.8, 64.5)(46.4, 64.6) (50.3, 64.8) (54.0, 64.9)C6) Whale/hippo (51 – 60 mya)56.056.054.6NANA(51.4, 59.8) (51.4, 59.8)(51.1, 59.5)NANAYoder & Yang (2004)
Table 4 Posterior means and 95% credibility intervals for divergence timesmtDNA(3 <strong>part</strong>itions)Node complete 2 speciesTRvWFIRBP(3 <strong>part</strong>itions)3 nuclear(5 <strong>part</strong>itions)All genes(8 <strong>part</strong>itions)N1) Northern Clade10.0(6.3, 15.2)NA NA NA NA NA NAN2) Southern Clade8.8(5.3, 13.6)NA NA NA NA NA NAN3) Microcebus12.09.08.78.9NANANA(7.8, 17.9) (5.2, 14.0)(3.7, 16.5)(5.5, 13.2)24.220.519.322.819.119.9N4) Microcebus/MirzaNA(16.8, 33.4) (13.5, 29.2)(10.8, 30.5) (11.3, 36.6) (12.3, 27.6) (14.6, 26.1)N5) Cheirogaleidae 1 31.826.731.330.930.629.0As is predicted, credibility intervals NA narrow with the addition(23.4, 41.6) (18.8, 36.4)(19.9, 44.2) (19.2, 44.7) (22.4, 39.7) (22.7, 35.9)8.46.67.014.614.611.19.7N6) Eulemurof more data.(5.3, 13.4) (3.8, 11.1) (2.1, 15.7) (7.8, 24.2) (7.8, 23.7) (7.0, 16.4) (6.5. 13.7)N7) Lemuridae35.933.132.133.426.431.131.9(27.0, 46.3) (24.2, 43.8) (20.4, 46.5) (22.4, 46.2) (16.3, 39.1) (23.3, 39.8) (25.6, 38.8)N8) Internal Lemuriform46.743.845.745.142.242.3NA(36.9, 57.5) (33.8, 54.9)(33.5, 58.5) (32.4, 60.1) (33.5, 51.3) (35.4, 49.5)N9) Lemuriformes67.165.754.962.860.265.062.0(56.8, 77.2) (54.8, 76.3) (41.7, 70.6) (51.3, 74.4) (46.2, 75.1) (56.3, 73.7) (57.9, 73.0)40.039.939.739.639.539.1C8) Lorisiformes (38 – 42 mya)NA(38.1, 41.9) (38.1, 41.9)(38.1, 41.8) (38.1, 41.8) (38.1, 41.8) (38.0, 41.5)72.972.4~ 23 70.7my 70.174.9 ~ 1568.5myN10) StrepsirrhiniNA(64.0, 82.0) (63.2, 81.7)(60.3, 81.6) (56.8, 83.8) (66.1, 83.0) (61.3, 75.4)C1) Human/Gorilla (8 –12 mya)10.910.710.19.49.610.2NA(8.9, 12.0) (8.6, 12.0)(8.1, 11.9) (8.0, 11.7) (8.1, 11.8) (8.2, 11.9)C2) Monkey/Ape (32 – 38 mya)34.034.235.234.734.734.234.7(32.1, 37.5) (32.1, 37.6) (32.2, 37.9) (32.1, 37.8) (32.1, 37.8) (32.1, 37.5) (32.1, 37.8)N11) Anthropoidea61.862.243.542.049.842.949.4(51.0, 73.8) (50.5, 75.1) (36.6, 51.5) (35.4, 49.9) (37.6, 64.3) (37.8, 48.7) (43.5, 55.7)C3) Basal primate (63 –90 mya)85.985.970.085.985.482.584.9(78.4, 89.9) (78.1, 89.8) (63.2, 84.0) (78.1, 89.8) (75.4, 89.8) (73.0, 89.6) (76.9, 89.8)C7) Canid/felid (45 – 65 mya)58.157.955.757.260.161.4NA(48.9, 64.6) (48.6, 64.6) (45.8, 64.5)(46.4, 64.6) (50.3, 64.8) (54.0, 64.9)C6) Whale/hippo (51 – 60 mya)56.056.054.6NANA(51.4, 59.8) (51.4, 59.8)(51.1, 59.5)NANAYoder & Yang (2004)
Table 4 Posterior means and 95% credibility intervals for divergence timesmtDNA(3 <strong>part</strong>itions)Node complete 2 speciesN1) Northern Clade10.0(6.3, 15.2)N2) Southern Clade8.8(5.3, 13.6)N3) Microcebus12.0(7.8, 17.9)N4) Microcebus/Mirza24.2(16.8, 33.4)N5) Cheirogaleidae 1 31.8(23.4, 41.6)N6) Eulemur8.4(5.3, 13.4)N7) Lemuridae35.9(27.0, 46.3)N8) Internal Lemuriform46.7(36.9, 57.5)N9) Lemuriformes67.1(56.8, 77.2)C8) Lorisiformes (38 – 42 mya)40.0(38.1, 41.9)N10) Strepsirrhini72.9(64.0, 82.0)C1) Human/Gorilla (8 –12 mya)10.9(8.9, 12.0)C2) Monkey/Ape (32 – 38 mya)34.0(32.1, 37.5)N11) Anthropoidea61.8(51.0, 73.8)C3) Basal primate (63 –90 mya)85.9(78.4, 89.9)C7) Canid/felid (45 – 65 mya)58.1(48.9, 64.6)C6) Whale/hippo (51 – 60 mya)56.0(51.4, 59.8)TRvWFIRBP(3 <strong>part</strong>itions)3 nuclear(5 <strong>part</strong>itions)All genes(8 <strong>part</strong>itions)NA NA NA NA NA NANA NA NA NA NA NA9.0(5.2, 14.0)20.5(13.5, 29.2)26.7(18.8, 36.4)6.6(3.8, 11.1)33.1(24.2, 43.8)43.8(33.8, 54.9)65.7(54.8, 76.3)39.9(38.1, 41.9)72.4(63.2, 81.7)10.7(8.6, 12.0)34.2(32.1, 37.6)62.2(50.5, 75.1)85.9(78.1, 89.8)57.9(48.6, 64.6)56.0(51.4, 59.8)NANANA7.0(2.1, 15.7)32.1(20.4, 46.5)NA54.9(41.7, 70.6)NANANA35.2(32.2, 37.9)43.5(36.6, 51.5)70.0(63.2, 84.0)55.7(45.8, 64.5)NA8.7(3.7, 16.5)19.3(10.8, 30.5)31.3(19.9, 44.2)14.6(7.8, 24.2)33.4(22.4, 46.2)45.7(33.5, 58.5)62.8(51.3, 74.4)39.7(38.1, 41.8)70.7(60.3, 81.6)10.1(8.1, 11.9)34.7(32.1, 37.8)42.0(35.4, 49.9)85.9(78.1, 89.8)NANANA22.8(11.3, 36.6)30.9(19.2, 44.7)14.6(7.8, 23.7)26.4(16.3, 39.1)45.1(32.4, 60.1)60.2(46.2, 75.1)39.6(38.1, 41.8)70.1(56.8, 83.8)9.4(8.0, 11.7)34.7(32.1, 37.8)49.8(37.6, 64.3)85.4(75.4, 89.8)57.2(46.4, 64.6)54.6(51.1, 59.5)NA19.1(12.3, 27.6)30.6(22.4, 39.7)11.1(7.0, 16.4)31.1(23.3, 39.8)42.2(33.5, 51.3)65.0(56.3, 73.7)39.5(38.1, 41.8)74.9(66.1, 83.0)9.6(8.1, 11.8)34.2(32.1, 37.5)42.9(37.8, 48.7)82.5(73.0, 89.6)60.1(50.3, 64.8)NA8.9(5.5, 13.2)19.9(14.6, 26.1)29.0(22.7, 35.9)9.7(6.5. 13.7)31.9(25.6, 38.8)42.3(35.4, 49.5)62.0(57.9, 73.0)39.1(38.0, 41.5)68.5(61.3, 75.4)10.2(8.2, 11.9)34.7(32.1, 37.8)49.4(43.5, 55.7)84.9(76.9, 89.8)61.4(54.0, 64.9)Have added considerable data to lemur origins question; good congruenceacross loci and analyses; all data (best) estimate is ~ 62 myaNAYoder & Yang (2004)
Lessons learned (a few):• Multiple calibrations essential; single calibrationsalways (in our study) systematicallyunderestimated dates across the tree• estimating <strong>part</strong>ition-specific parameters has abig impact on date estimation --- presumablyincreasing accuracy• the model matters (a lot!)• the model and the data have much larger impactthan the method (e.g., ML versus Bayesian)
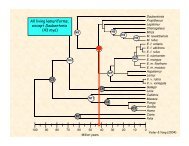
Ancestral lemur(~62 mya)C3N10N9C7N11N8C8C2N7N5N4N6C1N3DaubentoniaPropithecusLepilemurCheirogaleusMirzaM. ravelobensisM. rufusE. f. collarisE. f. albifronsE. f. rufusE. rubriventerE. mongozE. m. flavifronsE. m. macacoHapalemurLemurV. v. rubraV. v. variegataGalagoLorisCallithrixMacacaPongoGorillaHomoCanisFelis10090 80 70 60 50 40 30 20 10 0Million yearsYoder & Yang (2004)
Bayesian analysis of new data set, using twocalibrations points (human/chimp & loris/galago), gives very similar age estimates toprevious analyses, however, credibilityintervals are still uncomfortably broad (e.g.,20 my for ancestral lemur node). Are weseeing a trade off between density ofcalibrations versus amount of sequence data?Horvath et al. (2008) Genome Research
0°30°62 mya
At precisely 65 mya, an asteroid nearly 10 km (6 mi) wideslammed into what is now Mexico's Yucatan Peninsula.From: Smithsonian, Dept. of Paleontology
Dust from the impact blocked sunlight from reaching thesurface around the entire globe, making it too dark forphotosynthesis for 2 months to 1 year.From: Smithsonian, Dept. of Paleontology
David A. Kring and Daniel D. Durda, Journal of Geophysical Research (2004)
David A. Kring and Daniel D. Durda, Journal of Geophysical Research (2004)
David A. Kring and Daniel D. Durda, Journal of Geophysical Research (2004)
David A. Kring and Daniel D. Durda, Journal of Geophysical Research (2004)
David A. Kring and Daniel D. Durda, Journal of Geophysical Research (2004)
So, how the heck did they getthere in the first place?
Hypothetical IslandChain between Africaand Madagascar!(McCall, 1997)!Mid-Eocene to Early Miocene!45 - 26 mya!
Carnivorans
Malagasy!lemuriforms!AMalagasy!carnivorans!DaubentoniaLepilemur*Cheirogaleus*Mirza*Microcebus*PropithecusHapalemurLemurEulemur fulvusEulemur mongozEulemur rubriventerEulemur macacoVareciaOtolemurNycticebusLorisCallithrix*Cercopithecus*Gorilla*Homo*CryptoproctaFossaB GalidiaGalidictisMungotictisCrossarchusMungosSuricataCynictisHerpestes edwardsiHerpestes javanicusCrocutaCivettictisViverraGenettaHemigalusParadoxurusFelisPantheraNandinia*CanisTremarctosErignathus*ProcyonEquusBosBalaenopteraHippopotamusNot a single event ...!Older0.05 substitutions/siteYoungerYoder et al. (Fig. 3)
present10Malagasy !carnivorans!(24 - 18 Ma)!20304050PUTATIVE LANDBRIDGE!26 Ma!45 Ma!K/T6070Malagasy !lemurifoms!(66 - 62 Ma)!80ND2 TR Cyt b IRBP Cyt b & IRBP 4 genesYoder et al. (2003)
The Davie Ridge: Possible Sub-aerial Exposures“Even in the Eocene when <strong>part</strong>s of the Ridge may have beensub-aerial the deep troughs separating the peaks as shown inwould have posed formidableBarriers.”Ali & Huber, Nature (in press)
Mammals & BirdsK/T BoundaryBPI Herps“Southern Route”Noonan & Chippendale (2006)
Cenozoic!Crown-basedSouthern RouteStem-basedSouthern RouteYoder & Nowak (2006)
Preponderance of sistergroupsare found in Africa (blue)(Yoder & Nowak 2006)
SWEEPSTAKES!
Very deep DeepestAli & Huber, Nature (in press)
Reconstructed Indian Ocean currents in early Eocene“…rapid transport directly to Madagascar from Africawas possible at rates exceeding 20 cm/s”(early Eocene to mid-Miocene).Ali & Huber, Nature (in press)
Reconstructed Indian Ocean currents in early Eocene“every century the A > M currents were configured suchthat they could have transported rafts across theMozambique Channel in 25-30 days (from NEMozambique/Tanzania, 600-650 km). Actually this is aminimal maximum velocity value. If we throw in a"correctly configured” cyclone, we might be up at ~1 m/sfor a few days within the transit.”Jason Ali (pers. com.)
Current Data (presence/absence;molecular phylogenetic ANDpaleoclimatological) give remarkablystrong signal that present-day biota ispredominantly made up of “neoendemics”that dispersed from Africa during theearly Eocene to mid-MioceneLemurs and other Malagasy endemicsare unique evolutionary experiments---Precious and Irreplaceable
Coffee Anyone???