<strong>Hate</strong> <strong>Violence</strong> Against <strong>Lesbian</strong>, <strong>Gay</strong>, <strong>Bisexual</strong>, Transgender, Queer and HIV-affected Communities in <strong>the</strong> U.S. in 2011NC<strong>AVP</strong>RACIAL/ETHNIC IDENTITYWhiteLatino/aBlack/African-AmericanAsian/Pacific IslanderSelf-Identified/O<strong>the</strong>rMultiracialIndigenous/First PeopleArab/Middle Eastern3%3%Racial / Ethnic Identity of3%Survivors and Victims,2%20111%16%29%45%n=1558White survivors and victims represented <strong>the</strong> largest proportion of survivors and victims in 2011 (45%). This isconsistent with 2010 (45%). Latinos/as survivors and victims represented 29% of overall survivors and victims, <strong>the</strong>second highest group, which is a slight increase from 2010 (24%). Black and African American survivors andvictims represented <strong>the</strong> third highest group of survivors, making up 16% of total survivors, which is also consistentwith 2010 (16%). Asian and Pacific Islander, multiracial, and o<strong>the</strong>r self-identified survivors and victims each madeup 3% of <strong>the</strong> total survivors and victims. Indigenous and First People made up 2% of overall survivors and victims.Arab and Middle Eastern survivors and victims represented 1% of <strong>the</strong> total. These identities remained fairlyconsistent with <strong>the</strong> 2010, in which Asian/Pacific Islander survivors made up 4%, Indigenous/First People made up2% of survivors, Arab/Middle Eastern survivors made up 1%, self-indentified survivors made up 5% andmultiracial survivors made up 3% of total survivors and victims.Consistent with 2010, white survivors and victims are underrepresented within NC<strong>AVP</strong>’s reports. White peoplemade up 72% of <strong>the</strong> general population within <strong>the</strong> United States in 2011, but <strong>the</strong>y made up only 45% of NC<strong>AVP</strong>’ssurvivors and victims. 9 Latinos/as are also overrepresented within NC<strong>AVP</strong>’s reports, representing 16% of peoplein <strong>the</strong> U.S. and making up 29% of NC<strong>AVP</strong>’s reports. Black and African American people are slightlyoverrepresented within NC<strong>AVP</strong>’s reports, representing approximately 13% of <strong>the</strong> general population but making up16% of reports. To some degree, <strong>the</strong>se figures may reflect a higher percentage of people of color living in regionscovered in this report. This report contains data from states known for high Latino/a populations such as: Arizona,California, Colorado, Illinois, New York, and Texas. This may result in a higher proportion of Latinos/as thanwhites among NC<strong>AVP</strong>’s data set. Many programs also reside in regions with high populations of Black and AfricanAmerican people. These figures also reflect that LGBTQH people of color are at higher risk for violence,something that NC<strong>AVP</strong>’s 2011 and 2010 murder statistics also highlight. Finally, <strong>the</strong>se numbers could alsodemonstrate NC<strong>AVP</strong>’s member program’s dedicated outreach efforts within communities of color.AGE9 U.S. Census Bureau. ―State & county Quickfacts: Data derived from Population Estimates, American Community Survey‖ (2012, January 12).Accessed from: http://quickfacts.census.gov on May 25, 2012.24
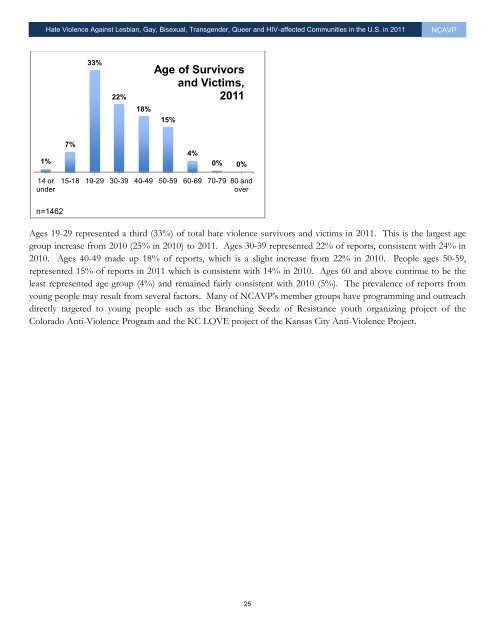
<strong>Hate</strong> <strong>Violence</strong> Against <strong>Lesbian</strong>, <strong>Gay</strong>, <strong>Bisexual</strong>, Transgender, Queer and HIV-affected Communities in <strong>the</strong> U.S. in 2011NC<strong>AVP</strong>33%22%18%Age of Survivorsand Victims,201115%1%7%4%0% 0%14 orunder15-18 19-29 30-39 40-49 50-59 60-69 70-79 80 andovern=1462Ages 19-29 represented a third (33%) of total hate violence survivors and victims in 2011. This is <strong>the</strong> largest agegroup increase from 2010 (25% in 2010) to 2011. Ages 30-39 represented 22% of reports, consistent with 24% in2010. Ages 40-49 made up 18% of reports, which is a slight increase from 22% in 2010. People ages 50-59,represented 15% of reports in 2011 which is consistent with 14% in 2010. Ages 60 and above continue to be <strong>the</strong>least represented age group (4%) and remained fairly consistent with 2010 (5%). The prevalence of reports fromyoung people may result from several factors. Many of NC<strong>AVP</strong>’s member groups have programming and outreachdirectly targeted to young people such as <strong>the</strong> Branching Seedz of Resistance youth organizing project of <strong>the</strong>Colorado Anti-<strong>Violence</strong> Program and <strong>the</strong> KC LOVE project of <strong>the</strong> Kansas City Anti-<strong>Violence</strong> Project.25
- Page 1 and 2: Hate ViolenceAgainst Lesbian, Gay,B
- Page 3: Hate Violence Against Lesbian, Gay,
- Page 6 and 7: Hate Violence Against Lesbian, Gay,
- Page 8 and 9: Hate Violence Against Lesbian, Gay,
- Page 10 and 11: Hate Violence Against Lesbian, Gay,
- Page 12 and 13: Hate Violence Against Lesbian, Gay,
- Page 14 and 15: Hate Violence Against Lesbian, Gay,
- Page 16 and 17: Hate Violence Against Lesbian, Gay,
- Page 18 and 19: Hate Violence Against Lesbian, Gay,
- Page 20 and 21: Hate Violence Against Lesbian, Gay,
- Page 22 and 23: Hate Violence Against Lesbian, Gay,
- Page 26 and 27: Hate Violence Against Lesbian, Gay,
- Page 28 and 29: Hate Violence Against Lesbian, Gay,
- Page 30 and 31: Hate Violence Against Lesbian, Gay,
- Page 32 and 33: Hate Violence Against Lesbian, Gay,
- Page 34 and 35: Hate Violence Against Lesbian, Gay,
- Page 36 and 37: Hate Violence Against Lesbian, Gay,
- Page 39 and 40: Hate Violence Against Lesbian, Gay,
- Page 41 and 42: Hate Violence Against Lesbian, Gay,
- Page 43 and 44: Hate Violence Against Lesbian, Gay,
- Page 45 and 46: Hate Violence Against Lesbian, Gay,
- Page 47 and 48: Hate Violence Against Lesbian, Gay,
- Page 49 and 50: Hate Violence Against Lesbian, Gay,
- Page 51 and 52: Hate Violence Against Lesbian, Gay,
- Page 53 and 54: Hate Violence Against Lesbian, Gay,
- Page 55 and 56: Hate Violence Against Lesbian, Gay,
- Page 57 and 58: Hate Violence Against Lesbian, Gay,
- Page 59 and 60: Hate Violence Against Lesbian, Gay,
- Page 61 and 62: Hate Violence Against Lesbian, Gay,
- Page 63 and 64: Hate Violence Against Lesbian, Gay,
- Page 65 and 66: Hate Violence Against Lesbian, Gay,
- Page 67 and 68: Hate Violence Against Lesbian, Gay,
- Page 69 and 70: Hate Violence Against Lesbian, Gay,
- Page 71 and 72: Hate Violence Against Lesbian, Gay,
- Page 73 and 74: Hate Violence Against Lesbian, Gay,
- Page 75 and 76:
Hate Violence Against Lesbian, Gay,
- Page 77 and 78:
Hate Violence Against Lesbian, Gay,
- Page 79 and 80:
Hate Violence Against Lesbian, Gay,
- Page 81 and 82:
Hate Violence Against Lesbian, Gay,
- Page 83 and 84:
Hate Violence Against Lesbian, Gay,
- Page 85 and 86:
Hate Violence Against Lesbian, Gay,
- Page 87 and 88:
Hate Violence Against Lesbian, Gay,
- Page 89 and 90:
Hate Violence Against Lesbian, Gay,
- Page 91 and 92:
Hate Violence Against Lesbian, Gay,
- Page 93 and 94:
Hate Violence Against Lesbian, Gay,
- Page 95 and 96:
Hate Violence Against Lesbian, Gay,
- Page 97 and 98:
Hate Violence Against Lesbian, Gay,
- Page 99 and 100:
National Coalitionof Anti-Violence
- Page 101 and 102:
Hate Violence against Lesbian, Gay,
- Page 103:
Hate Violence against Lesbian, Gay,