Tanzania Cotton Board Annual Report And Accounts
Tanzania Cotton Board Annual Report And Accounts
Tanzania Cotton Board Annual Report And Accounts

Create successful ePaper yourself
Turn your PDF publications into a flip-book with our unique Google optimized e-Paper software.
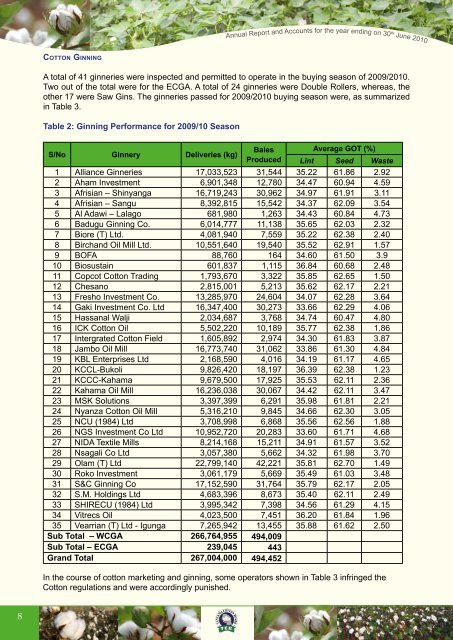
<strong>Annual</strong> <strong>Report</strong> and <strong>Accounts</strong> for the year ending on 30 th June 2010<strong>Cotton</strong> GinningA total of 41 ginneries were inspected and permitted to operate in the buying season of 2009/2010.Two out of the total were for the ECGA. A total of 24 ginneries were Double Rollers, whereas, theother 17 were Saw Gins. The ginneries passed for 2009/2010 buying season were, as summarizedin Table 3.Table 2: Ginning Performance for 2009/10 SeasonS/No Ginnery Deliveries (kg)BalesAverage GOT (%)Produced Lint Seed Waste1 Alliance Ginneries 17,033,523 31,544 35.22 61.86 2.922 Aham Investment 6,901,348 12,780 34.47 60.94 4.593 Afrisian – Shinyanga 16,719,243 30,962 34.97 61.91 3.114 Afrisian – Sangu 8,392,815 15,542 34.37 62.09 3.545 Al Adawi – Lalago 681,980 1,263 34.43 60.84 4.736 Badugu Ginning Co. 6,014,777 11,138 35.65 62.03 2.327 Biore (T) Ltd. 4,081,940 7,559 35.22 62.38 2.408 Birchand Oil Mill Ltd. 10,551,640 19,540 35.52 62.91 1.579 BOFA 88,760 164 34.60 61.50 3.910 Biosustain 601,837 1,115 36.84 60.68 2.4811 Copcot <strong>Cotton</strong> Trading 1,793,670 3,322 35.85 62.65 1.5012 Chesano 2,815,001 5,213 35.62 62.17 2.2113 Fresho Investment Co. 13,285,970 24,604 34.07 62.28 3.6414 Gaki Investment Co. Ltd 16,347,400 30,273 33.66 62.29 4.0615 Hassanal Walji 2,034,687 3,768 34.74 60.47 4.8016 ICK <strong>Cotton</strong> Oil 5,502,220 10,189 35.77 62.38 1.8617 Intergrated <strong>Cotton</strong> Field 1,605,892 2,974 34.30 61.83 3.8718 Jambo Oil Mill 16,773,740 31,062 33.86 61.30 4.8419 KBL Enterprises Ltd 2,168,590 4,016 34.19 61.17 4.6520 KCCL-Bukoli 9,826,420 18,197 36.39 62.38 1.2321 KCCC-Kahama 9,679,500 17,925 35.53 62.11 2.3622 Kahama Oil Mill 16,236,038 30,067 34.42 62.11 3.4723 MSK Solutions 3,397,399 6,291 35.98 61.81 2.2124 Nyanza <strong>Cotton</strong> Oil Mill 5,316,210 9,845 34.66 62.30 3.0525 NCU (1984) Ltd 3,708,998 6,868 35.56 62.56 1.8826 NGS Investment Co Ltd 10,952,720 20,283 33.60 61.71 4.6827 NIDA Textile Mills 8,214,168 15,211 34.91 61.57 3.5228 Nsagali Co Ltd 3,057,380 5,662 34.32 61.98 3.7029 Olam (T) Ltd 22,799,140 42,221 35.81 62.70 1.4930 Roko Investment 3,061,179 5,669 35.49 61.03 3.4831 S&C Ginning Co 17,152,590 31,764 35.79 62.17 2.0532 S.M. Holdings Ltd 4,683,396 8,673 35.40 62.11 2.4933 SHIRECU (1984) Ltd 3,995,342 7,398 34.56 61.29 4.1534 Vitrecs Oil 4,023,500 7,451 36.20 61.84 1.9635 Vearrian (T) Ltd - Igunga 7,265,942 13,455 35.88 61.62 2.50Sub Total – WCGA 266,764,955 494,009Sub Total – ECGA 239,045 443Grand Total 267,004,000 494,452In the course of cotton marketing and ginning, some operators shown in Table 3 infringed the<strong>Cotton</strong> regulations and were accordingly punished.8