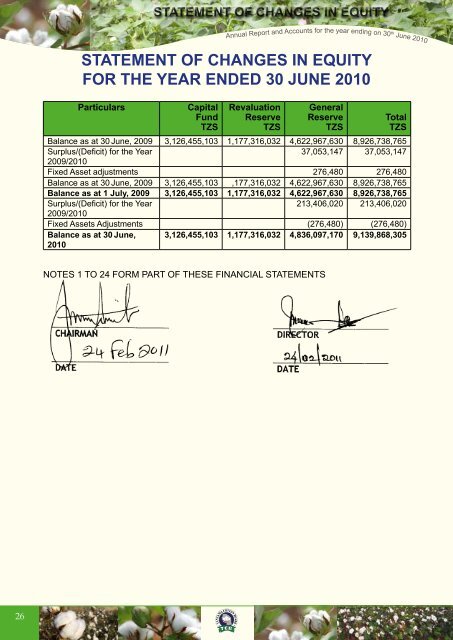
STATEMENT OF CHANGES IN EQUITY<strong>Annual</strong> <strong>Report</strong> and <strong>Accounts</strong> for the year ending on 30 th June 2010STATEMENT OF CHANGES IN EQUITYFOR THE YEAR ENDED 30 JUNE 2010ParticularsCapitalFundTZSRevaluationReserveTZSGeneralReserveTZSTotalTZSBalance as at 30 June, 2009 3,126,455,103 1,177,316,032 4,622,967,630 8,926,738,765Surplus/(Deficit) for the Year37,053,147 37,053,1472009/2010Fixed Asset adjustments 276,480 276,480Balance as at 30 June, 2009 3,126,455,103 ,177,316,032 4,622,967,630 8,926,738,765Balance as at 1 July, 2009 3,126,455,103 1,177,316,032 4,622,967,630 8,926,738,765Surplus/(Deficit) for the Year213,406,020 213,406,0202009/2010Fixed Assets Adjustments (276,480) (276,480)Balance as at 30 June,20103,126,455,103 1,177,316,032 4,836,097,170 9,139,868,305NOTES 1 TO 24 FORM PART OF THESE FINANCIAL STATEMENTS26
CASH FLOW STATEMENT<strong>Annual</strong> <strong>Report</strong> and <strong>Accounts</strong> for the year ending on 30 th June 2010CASH FLOW STATEMENTFOR THE YEAR ENDED 30 JUNE 20102009/2010 2008/2009CASH FLOWS FROM OPERATING ACTIVITIES TZS TZSNet Surplus/(Deficit) for the Year 213,406,020 199,884,280Add: Items Not Involving Movement of Cash:Depreciation 173,971,054 183,200,854Amortization on Intangible Assets 14,657,636 12,071,018Property, Plant and Equipment Adjustments - -Gain on Disposal of Assets - -Recovery on Insurance claims 188,628,690 195,271,872Operating Surplus/(Deficit) Before Working CapitalChanges 402,034,709 395,156,152Changes in Working Capital Items:(Increase)/Decrease in Inventories (1,709,354) 4,728,197(Increase)/Decrease in Trade and other receivables 278,922,946 (256,096,243)Increase/(Decrease) in Payables and Accruals 741,262,680 792,968,385Net Changes in Working Capital Items 1,018,476,272 541,600,339Cash Flows Generated From/(Used in) OperatingActivities [A] 1,420,510,981 936,756,491CASH FLOWS FROM/(USED IN) INVESTINGACTIVITIESAcquisition of Property, Plant and Equipment (104,109,442) (78,995,423)Acquisition of Intangible Assets (2,927,497) (29,874,287)Proceeds on Disposal of Assets - -Net Cash Flows Used in Investing Activities [B] (107,036,939) (108,869,710)Net Increase/(Decrease) in Cash and CashEquivalents A+B] 1,313,474,042 827,886,781Cash and Cash Equivalents as at 01.07.2009 1,983,885,213 1,155,998,432Cash and Cash Equivalents as at 30.06.2010 3,297,359,255 1,983,885,213NOTES 1 TO 24 FORM PART OF THESE FINANCIAL STATEMENTS27