Global Forest Resources Assessment 2005 - FAO
Global Forest Resources Assessment 2005 - FAO
Global Forest Resources Assessment 2005 - FAO
- No tags were found...

Create successful ePaper yourself
Turn your PDF publications into a flip-book with our unique Google optimized e-Paper software.
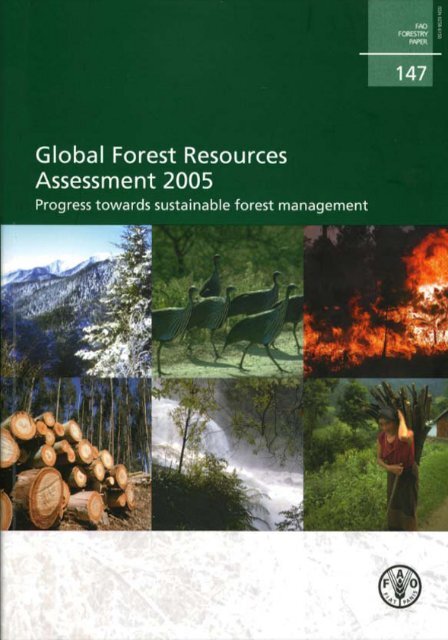
Cover photographs:Six thematic elements of sustainable forest management: extent of forest resources (R. Davis); biological diversity(<strong>FAO</strong>/FO-0964/S. Braatz); forest health and vitality (The Nature Conservancy/R.L. Myers); productive functionsof forest resources (StoraEnso/9809-17); protective functions of forest resources (<strong>FAO</strong>/FO-5278/J. Carle);socio-economic functions (<strong>FAO</strong>/FO-1051/S. Braatz).
<strong>Global</strong> <strong>Forest</strong> <strong>Resources</strong><strong>Assessment</strong> <strong>2005</strong>Progress towards sustainable forest management<strong>FAO</strong>FORESTRYPAPER147FOOD AND AGRICULTURE ORGANIZATION OF THE UNITED NATIONSRome, 2006
The designations employed and the presentation of material in this informationproduct do not imply the expression of any opinion whatsoever on the partof the Food and Agriculture Organization of the United Nations concerning thelegal or development status of any country, territory, city or area or of its authorities,or concerning the delimitation of its frontiers or boundaries.ISBN 92-5-105481-9All rights reserved. Reproduction and dissemination of material in this informationproduct for educational or other non-commercial purposes are authorized withoutany prior written permission from the copyright holders provided the source is fullyacknowledged. Reproduction of material in this information product for resale or othercommercial purposes is prohibited without written permission of the copyright holders.Applications for such permission should be addressed to:ChiefPublishing Management ServiceInformation Division<strong>FAO</strong>Viale delle Terme di Caracalla, 00100 Rome, Italyor by e-mail to:copyright@fao.org© <strong>FAO</strong> 2006
iiiContentsAcknowledgementsForewordAcronyms and abbreviationsExecutive summaryixxxixiiChapter 1. Introduction 1The reporting framework 2The process 6Chapter 2. Extent of forest resources 11Overview 11Key findings 12<strong>Forest</strong> area and forest area change 14<strong>Forest</strong> characteristics 23Growing stock 30Biomass and carbon 31Chapter 3. Biological diversity 37Overview 37Key findings 38Primary forests 40<strong>Forest</strong> area designated for conservation of biodiversity 43Composition of forests 47Number of native tree species 51Threatened forest tree species 53Chapter 4. <strong>Forest</strong> health and vitality 57Overview 57Key findings 59<strong>Forest</strong> fires 60Insects and diseases 65Other disturbances 68Chapter 5. Productive functions of forest resources 75Overview 75Key findings 76<strong>Forest</strong> area designated for productive purposes 77Productive forest plantations 80Growing stock and commercial growing stock 83Removals of wood products 88Removals of non-wood forest products 91Chapter 6. Protective functions of forest resources 95Overview 95Key findings 98
iv<strong>Forest</strong> area designated for protective purposes 99Protective forest plantations 103Chapter 7. Socio-economic functions 107Overview 107Key findings 108Value of wood removals 109Value of NWFP removals 113Employment 116Ownership of forests and other wooded lands 119<strong>Forest</strong> area designated for social services 124Chapter 8. Progress towards sustainable forest management 129Methodology 129Results 132Discussion 143Chapter 9. Conclusions 149Progress towards sustainable forest management 149Scope and coverage of FRA <strong>2005</strong> 150FRA <strong>2005</strong> process 153Concluding remarks 153Next steps 154Bibliography 155AnnexesAnnex 1. Contributors 161Annex 2. Terms and definitions for national reporting tables for FRA <strong>2005</strong> 169Annex 3. <strong>Global</strong> tables 177Annex 4. FRA <strong>2005</strong> working papers 311Annex 5. FRA <strong>2005</strong> meetings and workshops 313Annex 6. Earlier global assessments 315
vTables1.1 FRA <strong>2005</strong> reporting tables 51.2 Indicative linkages between reporting tables and thematic elements ofsustainable forest management 51.3 Key statistics for regions and subregions used in FRA <strong>2005</strong> 62.1 Distribution of forests by subregion <strong>2005</strong> 162.2 High forest cover countries <strong>2005</strong> 172.3 <strong>Forest</strong> cover by subregion <strong>2005</strong> 182.4 Annual changes in forest area by subregion 1990–<strong>2005</strong> 202.5 Ten countries with largest annual net loss in forest area 2000–<strong>2005</strong> 212.6 Ten countries with largest annual net gain in forest area 2000–<strong>2005</strong> 212.7 Comparison of forest area estimates in FRA <strong>2005</strong> and FRA 2000 232.8 Carbon stock per hectare <strong>2005</strong> 342.9 Average factors for estimating biomass and carbon from growing stock 342.10 Trends in carbon stocks in forest biomass 1990–<strong>2005</strong> 363.1 Area of primary forest <strong>2005</strong> 413.2 Ten countries with highest percentage of primary forest <strong>2005</strong> 423.3 Area of forest designated primarily for conservation of biodiversity <strong>2005</strong> 453.4 Total area of forest designated for conservation of biodiversity <strong>2005</strong> 463.5 Trends in area of forest designated primarily for conservation ofbiodiversity 1990–<strong>2005</strong> 463.6 Trends in total area of forest designated for conservation ofbiodiversity 1990–<strong>2005</strong> 473.7 Percentage of growing stock occupied by the most commontree species 2000 483.8 Native forest tree species 523.9 Threatened tree species 543.10 Threatened tree species as percentage of number ofnative tree species in individual countries 554.1 Average area of forest annually affected by fire 1998–2002 644.2 Trends in area of forest annually affected by fire 1988–1992and 1998–2002 644.3 Average area of forest annually affected by insects 1998–2002 694.4 Average area of forest annually affected by diseases 1998–2002 694.5 Trends in area of forest annually affected by diseases 1988–1992and 1998–2002 704.6 Trends in area of forest annually affected by insects 1988–1992and 1998–2002 704.7 Average area of forest annually affected by other disturbances1998–2002 724.8 Trends in area of forest annually affected by other disturbances1988–1992 and 1998–2002 735.1 Area of forest designated primarily for production <strong>2005</strong> 795.2 Trends in area of forest designated primarily for production 1990–<strong>2005</strong> 79
vi5.3 Area of productive forest plantations <strong>2005</strong> 815.4 Trends in area of productive forest plantations 1990–<strong>2005</strong> 825.5 Ten countries with largest area of productive forest plantations 1990–<strong>2005</strong> 835.6 Ten countries with greatest annual increase in productive forestplantation area 1990–<strong>2005</strong> 835.7 <strong>Forest</strong> area and growing stock <strong>2005</strong> 855.8 Commercial growing stock <strong>2005</strong> 865.9 Trends in growing stock and growing stock per hectare 1990–<strong>2005</strong> 875.10 Trends in commercial growing stock 1990–<strong>2005</strong> 885.11 Wood removals <strong>2005</strong> 905.12 Trends in wood removals 1990–<strong>2005</strong> 915.13 Removals of four categories of NWFPs (plant products) <strong>2005</strong> 935.14 Annual changes for four categories of NWFPs (plant products)per region 1990–<strong>2005</strong> 946.1 Protected area categories and management objectives 986.2 Area of forest designated primarily for protection <strong>2005</strong> 1016.3 Total area of forest designated for protection <strong>2005</strong> 1026.4 Trends in area of forest designated primarily for protection 1990–<strong>2005</strong> 1026.5 Area of protective forest plantations <strong>2005</strong> 1046.6 Trends in area of protective forest plantations 1990–<strong>2005</strong> 1056.7 Ten countries with largest area of protective forest plantations 1990–<strong>2005</strong> 1067.1 Proportion of roundwood production in value of wood removals <strong>2005</strong> 1107.2 Value of wood removals <strong>2005</strong> 1127.3 Trends in value of wood removals 1990–<strong>2005</strong> 1127.4 Value of NWFP removals <strong>2005</strong> 1157.5 Reported values of total NWFP removals 1990–<strong>2005</strong> 1167.6 Number of people employed in forestry in 2000 1187.7 Trends in number of people employed in forestry 1990–2000 1197.8 Ownership of forest area 2000 1227.9 Trends in ownership of forest area 1990–2000 1247.10 Area of forest designated primarily for social services <strong>2005</strong> 1267.11 Total area of forest designated for social services <strong>2005</strong> 1277.12 Trends in area of forest designated primarily for social services 1990–<strong>2005</strong> 1278.1 List of variables selected for synthesis assessment by thematic area 1308.2 Trends towards sustainable forest management at the global level 1328.3 Trends towards sustainable forest management in Africa 1348.4 Trends towards sustainable forest management in Asia 1368.5 Trends towards sustainable forest management in Europe 1378.6 Trends towards sustainable forest management in North andCentral America 1398.7 Trends towards sustainable forest management in Oceania 1418.8 Trends towards sustainable forest management in South America 1428.9 Trends towards sustainable forest management by subregion 144
viiFigures1.1 Regional and subregional breakdown used in FRA <strong>2005</strong> 71.2 FRA <strong>2005</strong> Timeline 72.1 Information availability – extent of forest resources 122.2 The world’s forests 152.3 Ten countries with largest forest area <strong>2005</strong> 162.4 <strong>Forest</strong> area in percent of land area by country <strong>2005</strong> 172.5 <strong>Forest</strong> change dynamics 182.6 Annual net change in forest area by region 1990–<strong>2005</strong> 202.7 Countries with large net changes in forest area 2000–<strong>2005</strong> 212.8 Information availability – forest characteristics 252.9 <strong>Forest</strong> characteristics <strong>2005</strong> 272.10 <strong>Global</strong> trends in forest characteristics 1990–<strong>2005</strong> 272.11 Information availability – carbon stock in forest biomass 332.12 Total carbon stock in forests by region <strong>2005</strong> 353.1 Information availability – biological diversity 383.2 Information availability – area of primary forest 413.3 Ten countries with largest area of primary forest <strong>2005</strong> 423.4 Information availability – area of forest designated primarily forconservation of biodiversity 443.5 Information availability – total area of forest designated forconservation of biodiversity 443.6 Information availability – composition of growing stock 483.7 Average growing stock of the ten most common forest tree species asfunction of growing stock occupied by the three most common species 493.8 Percentage of growing stock represented by the three most commonforest tree species as function of number of native species 503.9 Twenty-five most common tree genera reported 503.10 Information availability – number of native forest tree species 513.11 Number of native forest tree species 523.12 Information availability – threatened forest tree species 543.13 Average number of threatened forest tree species by region 554.1 Information availability – forest health and vitality 594.2 Information availability – forest fires 634.3 Information availability – forest insect pests 674.4 Information availability – diseases 674.5 Information availability – other disturbances 715.1 Information availability – productive functions of forest resources 755.2 Information availability – area of forest designated primarilyfor production 785.3 Information availability – total area of forest designated for production 785.4 Information availability – area of productive forest plantations 80
viii5.5 Ten countries with largest area of productive forest plantations <strong>2005</strong> 825.6 Information availability – growing stock 845.7 Information availability – commercial growing stock 845.8 Five countries with greatest total growing stock <strong>2005</strong> 865.9 Information availability – wood removals 895.10 Five countries with largest volume of wood removals <strong>2005</strong> 905.11 Information availability – NWFP removals 925.12 Information availability – NWFP removals by product category 936.1 Information availability – protective functions of forest resources 986.2 Information availability – area of forest designated primarily for protection 1006.3 Information availability – total area of forest designated for protection 1016.4 Area of forest designated primarily for protection 1990–<strong>2005</strong> 1036.5 Information availability – area of protective forest plantations 1046.6 Ten countries with largest area of protective forest plantations <strong>2005</strong> 1057.1 Information availability – socio-economic functions 1087.2 Information availability – value of wood removals 1107.3 Information availability – value of NWFP removals 1147.4 Information availability – value of NWFP removals by product category 1147.5 Information availability – employment 1177.6 Information availability – ownership 1227.7 Ownership of forests by subregion 2000 1237.8 Information availability – area of forest designated primarily for socialservices 1268.1 Designated functions of forests globally <strong>2005</strong> 1298.2 Distribution of subregional trends 1469.1 Information availability – reporting tables in relation to globalforest area 151Boxes1.1 Thematic elements of sustainable forest management 32.1 FRA <strong>2005</strong> thematic study on planted forests 242.2 FRA <strong>2005</strong> thematic study on mangroves 282.3 FRA <strong>2005</strong> thematic study on bamboo 294.1 FRA <strong>2005</strong> thematic study on forest fires 614.2 FRA <strong>2005</strong> thematic study on forest pests 686.1 FRA <strong>2005</strong> thematic study on forests and water 967.1 FRA <strong>2005</strong> thematic study on forest ownership and resource tenure 120
ixAcknowledgementsThe FRA <strong>2005</strong> main report represents a major effort of <strong>FAO</strong>’s <strong>Forest</strong>ry Department,<strong>FAO</strong> member countries, donors, partners and individual experts. More than 800people have been directly involved in the process. National correspondents and theirteams provided detailed country reports for the assessment. More than 80 <strong>FAO</strong> staffmembers, consultants and volunteers contributed to review of the reports, preparationof desk studies for countries and areas with no national correspondent, and analysisand presentation of the results. Several countries and organizations contributedextra-budgetary financial resources or secondments to FRA <strong>2005</strong>: Australia, Finland,Sweden, the United States of America, the International Network for Bamboo andRattan (INBAR), the International Tropical Timber Organization (ITTO), the JapaneseNational Land Afforestation Promotion Organization and the Ramsar Center Japan.The United Nations Economic Commission for Europe coordinated the assessmentprocess for European countries. Participants in the expert consultation held in Kotka,Finland, in 2002 provided the initial guidance for FRA <strong>2005</strong>, while the FRA advisorygroup provided continuous support and advice throughout the process.<strong>FAO</strong> is grateful for the support of all countries, organizations and experts inside andoutside the organization that have made FRA <strong>2005</strong> possible.Institutional and individual contributors to FRA <strong>2005</strong> are listed in Annex 1. Editingand production of the report were managed by Lynn Ball, and formatting and layoutwere done by Flora Dicarlo.
xForewordWe have high expectations of the world’s forest resources. They are to provide renewableraw materials and energy, maintain biological diversity, mitigate climate change, protectland and water resources, provide recreation facilities, improve air quality and helpalleviate poverty. At the same time, forests are affected by fire, air pollution, pests andinvasive species, and are the primary targets in many countries for agricultural and urbanexpansion. Competing interests in the benefits of forest resources and forest land areomnipresent, and the need for a sound basis for analysis and conflict resolution has neverbeen greater.The process of global forest resources assessment (FRA) has responded to this challenge.By adopting the concept of sustainable forest management as a reporting framework,FRA is now well placed to provide a holistic perspective on global forest resources, theirmanagement and uses. Beyond the conventional production and environmental dimensionsof forestry, FRA now includes parameters that are important to forest dwellers and ruralpoor people, such as the value of non-wood forest products and trends in fuelwoodremovals. By addressing the thematic elements of sustainable forest management, FRAhas evolved into an instrument that is indispensible in international negotiations andarrangements related to forests, and for clarifying the relationship of forestry to sustainabledevelopment.It is through the participation of national experts from virtually all countries that theFRA process ensures that the best and most recent knowledge is applied and that a viablefeedback mechanism to national policy processes is in place. The data for FRA <strong>2005</strong> weredelivered by national correspondents – nominated by the countries – and their networksof professionals. <strong>FAO</strong>’s role has been to coordinate the process and synthesize thisinformation.The immediate application of report findings and the associated databases will be ininternational arrangements addressing biological diversity, climate change, desertification,criteria and indicators for sustainable forest management, environmental outlook studiesand the Millennium Development Goals, among others. I trust that these processes willnot only make good use of this new knowledge, but will also generate feedback so thatFRA can evolve, responding to new information requirements and continually improvingglobal knowledge of forest resources.Finally, the question that has frequently been asked: are we progressing towardssustainable forest management? This is the question that constituted the base of FRA<strong>2005</strong>. Surprisingly, the answer cannot be a definitive one: there are many good signsand positive trends, but many negative trends remain. While intensive forest plantationand conservation efforts are on the rise, primary forests continue to become degradedor converted to agriculture at alarming rates in some regions. As the report also shows,there is a worrying correlation between negative forest resource trends and the size ofrural poor populations, which calls for an intensified effort to understand and address theinterrelationships of agriculture, forestry and poverty – which could be the overridingtheme of a future FRA.M. Hosny El-LakanyAssistant Director-General,<strong>Forest</strong>ry Department, <strong>FAO</strong>
xiAcronyms and abbreviationsCBDCOFOCPFDBHECOSOCFORISFRAGBA-2000GDPGFMCIFFINBARIPCCIPFIPPCISDRISPMITTOIUCNLFCCMCPFEMEANWFPSIDSUNCEDUNECEUNEPUNFCCCUNFFWCMCWDPAWRIWWFConvention on Biological DiversityCommittee on <strong>Forest</strong>ry (<strong>FAO</strong>)Collaborative Partnership on <strong>Forest</strong>sdiameter at breast heightEconomic and Social Council (UN)<strong>Forest</strong>ry Information System (<strong>FAO</strong>)<strong>Global</strong> <strong>Forest</strong> <strong>Resources</strong> <strong>Assessment</strong><strong>Global</strong> Burnt Area 2000 Projectgross domestic product<strong>Global</strong> Fire Monitoring CenterIntergovernmental Forum on <strong>Forest</strong>sInternational Network for Bamboo and RattanIntergovernmental Panel on Climate ChangeAd Hoc Intergovernmental Panel on <strong>Forest</strong>sInternational Plant Protection ConventionInternational Strategy for Disaster Reduction (UN)International Standards for Phytosanitary MeasuresInternational Tropical Timber OrganizationWorld Conservation Unionlow forest cover countriesMinisterial Conference on the Protection of <strong>Forest</strong>s in EuropeMillennium Ecosystem <strong>Assessment</strong>non-wood forest productsmall island developing statesUnited Nations Conference on Environment and DevelopmentUnited Nations Economic Commission for EuropeUnited Nations Environment ProgrammeUnited Nations Framework Convention on Climate ChangeUnited Nations Forum on <strong>Forest</strong>sWorld Conservation Monitoring CentreWorld Database on Protected AreasWorld <strong>Resources</strong> InstituteWorld Wide Fund for Nature
xiiExecutive Summary<strong>FAO</strong> has been coordinating global forest resources assessments every five to ten yearssince 1946. The <strong>Global</strong> <strong>Forest</strong> <strong>Resources</strong> <strong>Assessment</strong> <strong>2005</strong> (FRA <strong>2005</strong>) is the mostcomprehensive to date. More than 800 people have been involved, including 172 nationalcorrespondents and their teams, an advisory group, international experts, <strong>FAO</strong> andUNECE staff, consultants and volunteers from around the world.Information was collected and analysed from 229 countries and areas for three pointsin time: 1990, 2000 and <strong>2005</strong>. <strong>FAO</strong> worked closely with countries and specialists in thedesign and implementation of FRA <strong>2005</strong> – through regular contact, expert consultations,training for national correspondents and ten regional and subregional workshops. A trulyglobal partnership, resulting in improved knowledge of the world’s forests and forestry, amore transparent reporting process and enhanced capacity in data analysis and reporting.FRA <strong>2005</strong> examines current status and recent trends for about 40 variables, coveringthe extent, condition, uses and values of forests and other wooded land, with the aim ofassessing all benefits from forest resources. In the main section of this report, results arepresented according to six themes representing important elements of sustainable forestmanagement:• Extent of forest resources• Biological diversity• <strong>Forest</strong> health and vitality• Productive functions of forest resources• Protective functions of forest resources• Socio-economic functionsA summary of key findings is presented below, followed by a section attempting toanswer the following question:What does the information contained in FRA <strong>2005</strong> tell us about progress towardssustainable forest management since 1990 on regional and global scales?KEY FINDINGS<strong>Forest</strong>s cover 30% of the total land areaTotal forest area in <strong>2005</strong> is just under 4 billion hectares (ha), corresponding to an averageof 0.62 ha per capita (Figure 1). However, the area of forest is unevenly distributed. Forexample, 64 countries with a combined population of 2 billion have less than 0.1 haof forest per capita. The ten most forest-rich countries account for two-thirds of totalforest area (Figure 2). Seven countries or areas have no forest at all, and an additional 57have forest on less than 10 percent of their total land area.Total forest area continues to decrease – but the rate of net loss is slowingDeforestation, mainly conversion of forests to agricultural land, continues at analarmingly high rate – about 13 million hectares per year (Box 1). At the same time,forest planting, landscape restoration and natural expansion of forests have significantlyreduced the net loss of forest area. Net change in forest area in the period 2000–<strong>2005</strong>is estimated at -7.3 million hectares per year (an area about the size of Sierra Leone orPanama), down from -8.9 million hectares per year in the period 1990–2000.South America suffered the largest net loss of forests from 2000 to <strong>2005</strong> – about4.3 million hectares per year – followed by Africa, which lost 4.0 million hectaresannually (Figure 4).North and Central America and Oceania each had a net loss of about 350 000 ha,while Asia, which had a net loss of some 800 000 ha per year in the 1990s, reported a netgain of 1 million hectares per year from 2000 to <strong>2005</strong>, primarily as a result of large-scale
xiiiFIGURE 1The world’s forests<strong>Forest</strong>Other wooded landOther landWaterFIGURE 2Ten countries with largest forest area <strong>2005</strong>(million ha)Russian Federation 809Brazil 478Canada 310United States 303China 197Australia 164Democratic Republic of the Congo 134Indonesia 88Peru 69India 68Others 1 333afforestation reported by China. <strong>Forest</strong> areas in Europe continued to expand, althoughat a slower rate than in the 1990s. Countries with large net changes in forest area during2000–<strong>2005</strong> are highlighted in Figure 5.Primary forests account for 36% of forest area – but 6 million hectares are lostor modified each year<strong>Global</strong>ly, more than one-third of all forests are primary forests (i.e. forests of nativespecies, in which there are no clearly visible indications of human activity and ecologicalprocesses are not significantly disturbed) (Figure 6). About 6 million hectares of thesewere lost or modified each year since 1990, and there is no indication that the rate of
xivBOX 1Deforestation and net change in forest areaFigure 3 is a simplified model illustrating forest change dynamics. It has only two classes:forests and all other land. A reduction in forest area can happen through either of twoprocesses. Deforestation, which is by far the most important, implies that forests are clearedby people and the land converted to other uses, such as agriculture or infrastructure.Natural disasters may also destroy forests. When the area is incapable of regeneratingnaturally and no efforts are made to replant it, it, too, reverts to other land.An increase in forest area can also happen in two ways: either through afforestation, i.e.planting of trees on land that was not previously forested, or through natural expansionof forests, e.g. on abandoned agricultural land – which is quite common in some Europeancountries.Where part of a forest is cut down but replanted (reforestation), or where the forestgrows back on its own within a relatively short period (natural regeneration), there is nochange in forest area.For FRA <strong>2005</strong>, countries were asked to provide information on their forest area for threepoints in time. This allows calculation of the net change in forest area over time. This netchange is the sum of all negative changes due to deforestation and natural disasters and allpositive changes due to afforestation and natural expansion of forests.Countries were not requested to provide information on each of the four componentsof net change, as most countries do not have such information. This makes estimation ofthe deforestation rate difficult and no attempt has been made to do so at the countrylevel. Rather, an estimate of the global deforestation rate has been made as follows:The total net loss for countries with a negative change in forest area was 13.1 millionhectares per year for 1990–2000 and 12.9 million hectares per year for 2000–<strong>2005</strong>. Sincethe net change rate takes into account afforestation efforts and natural expansion offorests, the rate of deforestation might be higher still. On the other hand, Brazil, whichaccounts for 21 percent of the total net loss in the period 1990–2000 and 24 percent in2000–<strong>2005</strong>, calculated its forest area in <strong>2005</strong> and 1990 based on information from 2000and the sum of annual figures of the area of forests cleared. It did not take into accountto what extent the land use of these areas had changed and to what extent cleared landshad been abandoned and had reverted to forest through natural regeneration. Suchnaturally regenerated secondary forests are thought to be quite extensive, but insufficientinformation is currently available to estimate the extent. Thus the area of deforestationand the net loss of forests in Brazil are likely overestimated.Taking these considerations into account, the global deforestation rate was estimatedat 13 million hectares per year during the period 1990–<strong>2005</strong>, with few signs of a significantdecrease over time.FIGURE 3<strong>Forest</strong> change dynamicsFORESTReforestationNatural regenerationDeforestationNatural disastersAfforestationNatural expansionOTHERLAND
xvFIGURE 4Annual net change in forest area by region 1990–<strong>2005</strong>(million ha per year)South AmericaAfricaAsiaEuropeNorth and Central AmericaOceania-5 -4 -3 -2 -1 0 1 21990–2000 2000–<strong>2005</strong>FIGURE 5Countries with large net changes in forest area 2000–<strong>2005</strong>>0.50% decrease per year>0.50% increase per yearChange rate between -0.50 and 0.50% per year
xviBOX 2Previous figures slightly underestimated total forest area andoverestimated net annual lossFor FRA <strong>2005</strong>, countries were asked to provide information on their forests for three pointsin time: 1990, 2000 and <strong>2005</strong>. Total forest area figures for 1990 and 2000, revised to takenew information provided to FRA <strong>2005</strong> into account, are about 3 percent higher than thoseestimated in FRA 2000.Similarly, the net area change for 1990–2000 was revised downwards because of newinformation (from -9.4 million hectares per year to -8.9 million).FIGURE 6<strong>Forest</strong> characteristics <strong>2005</strong>(%)Primary forest 36.4Modified natural forest 52.7Semi-natural forest 7.1Productive forest plantation 3.0Protective forest plantation 0.8change is slowing down. This rapid decrease stems not only from deforestation, but alsofrom modification of forests due to selective logging and other human interventionsthrough which primary forests move into the category of modified natural forests.A number of countries registered positive change rates in the area of primary forests,including several European countries and Japan. This is possible because, in the absenceof human intervention, forests can evolve over time to meet the above definition ofprimary forests.<strong>Forest</strong> plantations are increasing – but still account for less than 5% of totalforest area<strong>Forest</strong>s and trees are being planted for many purposes and at increasing rates (Figure 7).<strong>Forest</strong> plantations – a subset of planted forests consisting primarily of introduced species– make up an estimated 3.8 percent of total forest area, or 140 million hectares. Productiveforest plantations, primarily established for wood and fibre production, account for78 percent of forest plantations, and protective forest plantations, primarily established forconservation of soil and water, for 22 percent. The area of forest plantations has increasedby about 2.8 million hectares per year in the period 2000–<strong>2005</strong>, 87 percent of which areproductive forest plantations.<strong>Forest</strong>s – a vital carbon sinkWhile deforestation, degradation and poor forest management reduce carbon storagein forests, sustainable management, planting and rehabilitation of forests can increasecarbon sequestration. It is estimated that the world’s forests store 283 gigatonnes (Gt) of
xviicarbon in their biomass alone, and that the carbon stored in forest biomass, dead wood,litter and soil together is more than the amount of carbon in the atmosphere.Carbon in forest biomass decreased in Africa, Asia and South America in the period1990–<strong>2005</strong>, but increased in all other regions (Figure 8). For the world as a whole, carbonstocks in forest biomass decreased by 1.1 Gt of carbon annually, owing to continueddeforestation and forest degradation, partly offset by forest expansion (includingplanting) and an increase in growing stock per hectare in some regions.FIGURE 7Changes in forest plantation area 1990–<strong>2005</strong>(million ha)AfricaAsiaEuropeNorth and Central AmericaOceaniaSouth America0 10 20 30 40 50 60 701990 2000 <strong>2005</strong>FIGURE 8Changes in carbon stocks in forest biomass 1990–<strong>2005</strong>(Gt)AfricaAsiaEuropeNorth and Central AmericaOceaniaSouth America0 20 40 60 80 100 1201990 2000 <strong>2005</strong>
xviiiWide variation in number of native tree species – from 3 in Iceland and inMalta to 7 780 in BrazilDespite the large number of native tree species in many countries, relatively few speciesaccount for most of the standing wood volume. In most regions and subregions, the tenmost common tree species (by volume) account for more than 50 percent of total woodvolume. Exceptions are Central America, South America, South and Southeast Asia andWestern and Central Africa, where the tree species diversity is particularly high (Figure 9).Rare tree species and those highly valued for wood or non-wood forest products areoften in danger of becoming extinct within parts of their range. On average, 5 percent of thetree species native to a country are either vulnerable, endangered or critically endangered.<strong>Forest</strong> disturbances can be devastating – but they were severely underreportedOn average, 104 million hectares of forest were reported to be significantly affected each yearby forest fire, pests (insects and disease) or climatic events such as drought, wind, snow, iceand floods. However, the area of forest affected by disturbances was severely underreported,with information missing from many countries, especially for forest fires in Africa.84% of the world’s forests are publicly owned – but private ownership isincreasingTrends seen over the past 20 years towards community empowerment, decentralizeddecision-making and increased involvement of the private sector in forest managementare reflected in some regions in changes in forest ownership and tenure. However, mostof the world’s forests remain under public ownership (Figure 10). Differences amongregions are considerable. North and Central America, Europe (apart from the RussianFederation), South America and Oceania have a higher proportion of private ownershipthan other regions.FIGURE 9Number of native forest tree species1 000No data
xixFIGURE 10Ownership of forests by subregion 2000Eastern and Southern AfricaNorthern AfricaWestern and Central AfricaEast AsiaSouth and Southeast AsiaWestern and Central AsiaEuropeCaribbeanCentral AmericaNorth AmericaOceaniaSouth AmericaWorld0 10 20 30 40 50 60 70 80 90 100Percentage of total forest areapublic private other<strong>Forest</strong> management<strong>Forest</strong>s are increasingly being managed for a variety of uses and values, often incombination (Figure 11).11% of the world’s forests are designated for the conservation of biologicaldiversityFor FRA <strong>2005</strong>, countries reported on the area of forest in which conservation of biologicaldiversity was designated as the primary function (Figure 12). This area has increased byan estimated 96 million hectares since 1990 and now accounts for 11 percent of totalforest area. These forests are mainly, but not exclusively, located within protected areas.Conservation of biological diversity was reported as one of the management objectives(primary or secondary) for more than 25 percent of the forest area.One-third of the world’s forests are used primarily for production of wood andnon-wood forest productsWood production continues to be an important function of many forests, and reportedremovals of non-wood forest products (NWFPs) are on the rise. Production of wood andnon-wood forest products is the primary function for 34 percent of the world’s forests,while more than half of all forests are used for such production in combination with otherfunctions, such as soil and water protection, biodiversity conservation and recreation.<strong>Global</strong> wood removals were forecast to amount to 3 billion m 3 in <strong>2005</strong>, similar tothe total removals recorded for 1990 and averaging 0.69 percent of total growing stock.While Asia reported a decrease in wood removals in recent years, Africa reported a steadyincrease (Figure 13). It is estimated that nearly half of the removed wood was fuelwood.Informally or illegally removed wood, especially fuelwood, is not usually recorded, sothe actual amount of wood removals is undoubtedly higher.More than 300 million hectares of forests are designated for soil and waterconservationProtective functions of forests range from soil and water conservation and avalanche controlto sand-dune stabilization, desertification control and coastal protection. As reported for
xxFIGURE 11Designated functions of forests globally <strong>2005</strong>(%)Production 34.1Protection of soil and water 9.3Conservation of biodiversity 11.2Social services 3.7Multiple purpose 33.8No or unknown function 7.8FIGURE 12<strong>Forest</strong>s designated for conservation 1990–<strong>2005</strong>(million ha)AfricaAsiaEuropeNorth and Central AmericaOceaniaSouth America0 10 20 30 40 50 60 70 80 90 1001990 2000 <strong>2005</strong>FRA <strong>2005</strong>, an estimated 348 million hectares of forests have a protective function as theirprimary objective. Eighteen countries reported that all their forests are designated for protectivepurposes, as either a primary or secondary function. The overall proportion of forests designatedfor protective functions increased from 8 percent in 1990 to 9 percent in <strong>2005</strong>.Use of forests for recreation and education is increasing – but is difficult toquantifyThe only region with fairly good data on the use of forests for recreation, tourism,education and conservation of cultural and spiritual sites is Europe, where provision ofsuch social services was reported as the primary management objective for 2.4 percentof total forest area. In all, 72 percent of the forest area of Europe (not including theRussian Federation) provides social services – most frequently in combination with othermanagement objectives.
xxiFIGURE 13Trends in wood removals 1990–<strong>2005</strong>(million m³)AfricaAsiaEurope2000<strong>2005</strong>199019902000<strong>2005</strong>19902000<strong>2005</strong>North and Central America19902000<strong>2005</strong>Oceania19902000<strong>2005</strong>South America19902000<strong>2005</strong>0 100 200 300 400 500 600 700 800 900 1 000Industrial roundwoodFuelwoodThe value of wood removals is decreasing, while the value of NWFPs isincreasing – and is underestimatedRoundwood removals in <strong>2005</strong> were estimated at US$64 billion, mainly accounted for byindustrial roundwood. The reported trend shows an increase of about 11 percent overthe previous 15 years, which is less than the rate of inflation over this period. Thus thereported value of removals in real terms has declined at the global level.The estimated value of NWFP removals in <strong>2005</strong> is US$4.7 billion. However,information was missing from many countries, and the reported statistics probably coveronly a small fraction of the true total value. Edible plant products and bushmeat are themost significant products in terms of value. Trends at global and regional levels generallyshow a slight increase since 1990.Some 10 million people are employed in forest conservation and managementactivitiesReported employment in forestry (excluding the wood processing industry) declined byabout 10 percent from 1990 to 2000. Most of the decline occurred in the primary productionof goods and can probably be attributed to increases in labour productivity. At the regionallevel, Asia and Europe showed a downward trend, while in the other regions employmentincreased somewhat – probably because roundwood production was increasing faster thanincreases in labour productivity. In Europe, the decline in employment can also be attributedto the restructuring of formerly centrally planned economies.FRA <strong>2005</strong> collected data on formal employment only. However, some countryreports did not separate informal and formal employment, so formal employment couldbe somewhat less than 10 million people. Taking into account the informal sector, theoverall importance of forest employment for rural livelihoods and national economieswas clearly higher than this number suggests.PROGRESS TOWARDS SUSTAINABLE FOREST MANAGEMENTAn analysis based on a subset of 21 variables was undertaken at subregional and regionallevels to review progress towards sustainable forest management in the period 1990–<strong>2005</strong>
xxii(1990–2000 in some cases). The key results globally are summarized below under six mainthemes and illustrated in Table 1. Table 2 summarizes results at the subregional level. For moreinformation, refer to Chapter 8.Progress towards sustainable forest management at the global levelExtent of forest resources. Area of forest decreased by an average of 8.4 million hectaresper year from 1990 to <strong>2005</strong>; the annual change rate is 0.21 percent per year. None of theother variables included under this theme show an annual change rate above 0.50 percent,although they also show a decrease over time.Biological diversity. Area of primary forest decreased by an average of 5.8 millionhectares per year (excluding the Russian Federation, where large changes were due tothe introduction of a new classification system). On a positive note, the area of forestdesignated for conservation of biological diversity increased by about 6.4 million hectaresper year – or a total of 96 million hectares during the same period.<strong>Forest</strong> health and vitality. The area of forest adversely affected by insects, disease andother disturbances shows an increase equivalent to 1.1 million hectares per year, while the areaadversely affected by forest fires shows a small decrease. However, information was missingfrom many countries, particularly from Africa.TABLE 1Trends towards sustainable forest management at the global levelThematic element Trends in FRA <strong>2005</strong> variables Data 1990–<strong>2005</strong> 1990–<strong>2005</strong> Unitor derivatives availability Annual Annualchange rate change(%)Extent of forest resources Area of forest H -0.21 -8 351 1 000 haArea of other wooded land M -0.35 -3 299 1 000 haGrowing stock of forests H -0.15 -570 million m³Carbon stock per hectare in forest -0.02 -0.15 tonnes/habiomassHBiological diversity Area of primary forest H -0.52 -5 848 1 000 haArea of forest designated primarily H 1.87 6 391 1 000 hafor conservation of biological diversityTotal forest area excluding area of H -0.26 -9 397 1 000 haproductive forest plantations<strong>Forest</strong> health and vitality Area of forest affected by fire M -0.49 -125 1 000 haArea of forest affected by insects, M 1.84 1 101 1 000 hadisease and other disturbancesProductive functions of forest Area of forest designated primarily H -0.35 -4 552 1 000 haresourcesfor productionArea of productive forest plantations H 2.38 2 165 1 000 haCommercial growing stock H -0.19 -321 million m³Total wood removals H -0.11 -3 199 1 000 m³Total NWFP removals M 2.47 143 460 tonnesProtective functions of forest Area of forest designated primarily H 1.06 3 375 1 000 haresourcesfor protectionArea of protective forest plantations H 1.41 380 1 000 haSocio-economic functions Value of total wood removals L 0.67 377 million US$H = High (reporting countries represent 75–100% of total forest area)M = Medium (reporting countries represent 50–75% of total forest area)L = Low (reporting countries represent 25–50% of total forest area)= Positive change (greater than 0.50%)= No major change (between -0.50 and 0.50%)= Negative change (less than -0.50%)– = Insufficient data to determine trendValue of total NWFP removals M 0.80 33 million US$Total employment M -0.97 -102 1 000 pers. yrsArea of forest under private ownership M 0.76 2 737 1 000 haArea of forest designated primarily H 8.63 6 646 1 000 hafor social services
xxiiiProductive functions of forest resources. The most prominent changes over the last 15years were a decrease in the area of forest designated primarily for productive purposesby an average of 4.6 million hectares per year, and an increase in the area of productiveforest plantations of almost 2.2 million hectares per year. This indicates that substantialareas of natural forests previously allocated for productive purposes were designatedfor other uses, while the proportion of wood removals coming from forest plantationsincreased significantly.Protective functions of forest resources. Both variables included under this theme showan increase since 1990. The area of forest primarily designated for protective purposesincreased by close to 3.4 million hectares per year or more than 50 million hectares duringthe last 15 years, indicating an increased awareness of the important role forests play insoil and water conservation, avalanche control, combating desertification and coastalprotection.Socio-economic functions. The total values of removals of wood and non-woodforest products increased, but by less than the average rate of inflation. Employment inforest conservation and management decreased by about 1 percent per year. The areaof privately owned forests increased by an average of 2.7 million hectares per year inthe period 1990–2000 (<strong>2005</strong> data not requested from countries), while the area of forestdesignated for provision of recreation, education and other social services increased bymore than 6.6 million hectares per year – or a total of 100 million hectares since 1990– primarily due to a large increase in Brazil and partly offset by a much smaller decreasein the Russian Federation due to reclassification.Conclusions. Overall, the situation at the global level remained relatively stable. Negativetrends included decreases in primary forests and in employment, and an increase in the areaof forest adversely affected by insects, disease and other disturbances. Positive trends werereported for the area of forest designated for biological diversity and social services, as wellas for areas of productive and protective forest plantations, value of wood removals andamount and value of NWFP removals, and area of forest under private ownership.Progress at regional and subregional levelsAfrica. Overall, progress towards sustainable forest management in Africa appears to havebeen limited during the last fifteen years. There are some indications that net loss of forestarea has slowed down and that area of forest designated for conservation of biologicaldiversity has increased slightly. However, the continued, rapid loss of forest area – thelargest of any region during this 15-year period – is particularly disconcerting.Asia. <strong>Forest</strong> area in Asia is almost the same in <strong>2005</strong> as it was in 1990 (572 million hectaresversus 574 – or a decrease of 0.03 percent per year), owing to large-scale afforestationefforts during the last 7-8 years – particularly in China. <strong>Forest</strong> health deteriorated, butforest fires, pests and disease were still affecting a relatively small proportion of totalforest area in Asia. The rapid decrease in the area of primary forest is cause for concern,while the increase in areas designated for conservation of biodiversity and for protectivepurposes is commendable. In short, there was mixed progress over the last 15 years.Europe. Data availability was high for most of the variables. The status of forestresources was essentially stable, although forests in Europe suffered from occasionalstorms. The severe storms of 1999 were the main reason for the apparently negative trendin forest health and vitality. The focus of forest management in Europe clearly shiftedaway from productive functions towards conservation of biological diversity, protectionand multiple use, and the area of forest under private ownership increased.North and Central America. Progress towards sustainable forest management wasgenerally positive in North and Central America as a whole during the period 1990–<strong>2005</strong>,with none of the annual rates of decreasing trends being more than 0.20 percent – withthe exception of the area adversely affected by insects, disease and other disturbances.There was, however, considerable variation among subregions as can be seen in Table 2.
xxivTABLE 2Trends towards sustainable forest management by subregionThemes and variables Africa AsiaExtent of forest resourcesEastern Northern Western East South Westernand Southern and Central and Southeast and CentralArea of forest H H H H H HArea of other wooded land M L H H M HGrowing stock of forests H H H H H HCarbon stock per hectare in forestbiomass H H H H H HBiological diversityArea of primary forest H H L H H HArea of forest designated primarilyfor conservation of biological diversity H H L H H HTotal forest area excluding areaof productive forest plantations H H L H H H<strong>Forest</strong> health and vitalityArea of forest affected by fire – – – H H HArea of forest affected by insects,disease and other disturbances – – – H L MProductive functions of forest resourcesArea of forest designated primarilyfor production H H L H H HArea of productive forest plantations H H L H H HCommercial growing stock H L L H M HTotal wood removals H H H H H HTotal NWFP removals – – – H L MProtective functions of forest resourcesArea of forest designated primarilyfor protection H H L H H HArea of protective forest plantations H H L H H HSocio-economic functionsValue of total wood removals – L – H H HValue of total NWFP removals – M – – L MTotal employment L M L H M HArea of forest under private ownership H H H H H HArea of forest designated primarily forsocial services H H L H H HH = High (reporting countries represent 75–100% of total forest area)M = Medium (reporting countries represent 50–75% of total forest area)L = Low (reporting countries represent 25–50% of total forest area)= Positive change (greater than 0.50%)= No major change (between -0.50 and 0.50%)= Negative change (less than -0.50%)– = Insufficient data to determine trendOceania. The status of information for Oceania was generally very weak, and lowdata availability was a serious issue in the region. For two-thirds of the variables, therewas insufficient data to determine regional trends. Thus it is difficult to assess progresstowards sustainable forest management.South America. Overall, progress towards sustainable forest management was fairlymixed. The increasing trend of net forest loss in the area is disturbing, as is the current rate ofloss of primary forests. Yet there were also some positive signs in the significant increases inarea of forest designated for conservation of biodiversity and for social services. The decreasein removals of fuelwood reflects a reduced demand for this product in the region, but waspartly offset by an increase in removals of industrial wood. The area of productive forestplantations increased and may meet more of the demand for wood in the future.
xxvEurope North and Central America Oceania South America Themes and variablesCaribbean Central NorthExtent of forest resourcesH H H H H H Area of forestH H H M – L Area of other wooded landH H H H – M Growing stock of forestsCarbon stock per hectare in forestH L – – – M biomassBiological diversityH M H H H H Area of primary forestArea of forest designated primarilyH M H H – H for conservation of biological diversityTotal forest area excluding areaH M H H H H of productive forest plantations<strong>Forest</strong> health and vitalityH M – H – H Area of forest affected by fireArea of forest affected by insects,H – – H – M disease and other disturbancesProductive functions of forest resourcesArea of forest designated primarilyH M H H – H for productionH M H H H H Area of productive forest plantationsH M M H – M Commercial growing stockH H H H H H Total wood removalsH L – – – M Total NWFP removalsProtective functions of forest resourcesArea of forest designated primarilyH M H H – H for protectionH M H H H H Area of protective forest plantationsSocio-economic functions– L H M – H Value of total wood removalsH L – M – M Value of total NWFP removalsH H M H H – Total employmentH M M H – – Area of forest under private ownershipArea of forest designated primarilyH M H H – H for social services<strong>Forest</strong> or poverty perspective?In considering progress towards sustainable forest management, the very large differencesin size and population structure must be taken into consideration. Two parameters– forest area and the number of rural poor people – were selected and applied as arbitraryweights to indicate the relative significance of the observed trends (Figure 14).When weighting by forest area, Europe, North America and South America dominatethe picture. It is also clear that Europe and North America contribute considerably tothe positive trends and less to the negative ones, whereas the opposite is true for SouthAmerica. Overall, there seems to be a balance between positive and negative trends,assuming that the selected variables are valid, that they are all weighted equally and thata weighting by forest area of each subregion is relevant.
xxviFIGURE 14Distribution of subregional trends¹Eastern and Southern AfricaNorthern AfricaWestern and Central AfricaEast AsiaSouth and Southeast AsiaWestern and Central AsiaEuropeCaribbeanCentral AmericaNorth AmericaOceaniaSouth America0 10 20 30 40 50 60Percentage of total forest areaEastern and Southern AfricaNorthern AfricaWestern and Central AfricaEast AsiaSouth and Southeast AsiaWestern and Central AsiaEuropeCaribbeanCentral AmericaNorth AmericaOceaniaSouth America0 10 20 30 40 50 60Percentage of rural poor populationPositive trends Small changes Negative trends Missing data¹ The number of observed trends for each subregion in Table 8.9 has been multiplied by forest area (top), and number of ruralpoor (bottom). The results have been scaled to show the proportion in percentages of observed changes in each case.When weighting by rural poor population, the picture becomes dramatically different.Some of the African subregions are more prominent, and the subregion of South andSoutheast Asia dominates. Obviously, the developed regions become less significant asthere are relatively few rural poor in these areas. Compared with the weighting by forestarea, there is a higher proportion of negative trends from this poverty perspective.Is there progress towards sustainable forest management?Given the complexity of this question, the answer cannot be a definitive one. There aremany good signs and positive trends, but many negative trends remain. While intensiveforest plantation and conservation efforts are on the rise, primary forests continue tobecome degraded or converted to agriculture at alarming rates in some regions. As theanalyses above illustrate, the answer also depends on the scale and perspective applied.
xxviiCONCLUSIONSFRA <strong>2005</strong> is the most comprehensive assessment to date, in terms of both the contentand the number of contributors. It tells us that forests cover 30 percent of the land areaof planet Earth. They range from boreal and temperate forests to arid woodlands andtropical moist forests. And from undisturbed primary forests to forests managed andused for a variety of purposes.FRA <strong>2005</strong> also tells us that deforestation continues at an alarmingly high rate, but thatthe net loss of forest area is slowing down thanks to forest planting, landscape restorationand natural expansion of forests on abandoned land.<strong>Forest</strong>s are increasingly being conserved and managed for multiple uses and values,and they play a crucial role in climate change mitigation and in the conservation ofbiodiversity and of soil and water resources. If managed sustainably, forests alsocontribute significantly to local and national economies and to the well-being of currentand future generations.By providing new information on forest area change – one of the 48 indicators of theMillennium Development Goals – FRA <strong>2005</strong> allows assessment of the important roleof world forest resources in meeting the targets for reducing poverty and ensuring asustainable global environment.By also providing data on carbon, biological diversity, forests’ contribution to nationaleconomies and many more variables, FRA <strong>2005</strong> aims to support decision-making forpolicies and programmes in forestry and sustainable development at all levels.NEXT STEPSAn in-depth evaluation of FRA <strong>2005</strong> will be carried out in early 2006, and readers areencouraged to provide inputs. <strong>FAO</strong> will also continue to work actively with countriesto identify and address information gaps for continuous improvement of knowledge offorests and forestry. Joint planning for the next global assessment (FRA 2010) will beginin 2006, and an expert consultation (Kotka V) is planned for June 2006 to provide inputsto this next assessment.
xxviii
1Chapter 1Introduction<strong>Global</strong> forest resources assessments, coordinated by <strong>FAO</strong>, have been carried out atfive to ten year intervals since <strong>FAO</strong> was established in 1945. 1 The mandate for theseassessments is found in the <strong>FAO</strong> Constitution, which states that “The Organizationshall collect, analyse, interpret and disseminate information relating to nutrition,food and agriculture. In this Constitution, the term ‘agriculture’ and its derivativesinclude fisheries, marine products, forestry and primary forestry products.” (Article I,Functions of the Organization, paragraph 1) (<strong>FAO</strong>, 2000).The <strong>Global</strong> <strong>Forest</strong> <strong>Resources</strong> <strong>Assessment</strong> <strong>2005</strong> (FRA <strong>2005</strong>) was requested by <strong>FAO</strong>member countries during the sixteenth session of the <strong>FAO</strong> Committee on <strong>Forest</strong>ry(COFO) in March 2003 (<strong>FAO</strong>, 2003a). It is the most comprehensive assessment to date,both in terms of contributors and content. More than 800 people have been involved,including 172 national correspondents and their teams, an advisory group, internationalexperts, <strong>FAO</strong> staff, consultants and volunteers from around the world.The scope and content of the global assessments have evolved over time to respondto changing information needs. The main concern driving the first <strong>FAO</strong>-led assessmentwas well expressed in the first sentence of its report: “The whole world is suffering fromshortages of forest products” (<strong>FAO</strong>, 1948). Studies of timber supply trends dominatedFRAs through the 1960s. From the 1970s through FRA 1990, environmental dimensionsof forest resources were in focus, in particular the rate of deforestation. FRA 2000 wasdesigned to cover a wider range of forest benefits and functions, but severe informationshortages made reporting on key trends difficult. In addition, users and the mediastill appeared to be primarily interested in forest area and area change (Holmgren andPersson, 2002).FRA <strong>2005</strong> reflects a more ambitious approach. In line with recommendations madeby the <strong>FAO</strong> expert consultation on <strong>Global</strong> <strong>Forest</strong> <strong>Resources</strong> <strong>Assessment</strong>s – LinkingNational and International Efforts, held in Kotka, Finland in 2002 (Kotka IV), andCOFO in 2003, the reporting framework for FRA <strong>2005</strong> is based on the sustainable forestmanagement concept, encompassing social, economic and environmental dimensions offorest resources. Further, the FRA <strong>2005</strong> process has involved countries to a much higherdegree than previous assessments, leading to a higher response rate and quality controlof information at the national level.This broader approach has also led to closer collaboration with other reportingprocesses, to avoid duplication of effort for variables that are reported to several agencies.For example, the variables related to forest biomass and carbon were harmonized withthe specifications of the Intergovernmental Panel on Climate Change (IPCC), variableson endangered species with the IUCN 2000 red list of threatened species (WorldConservation Union – IUCN, 2000), and quantity of removals with the <strong>FAO</strong> Yearbookof <strong>Forest</strong> Products (<strong>FAO</strong>, 2003b). The proportion of land area under forests, reported to<strong>FAO</strong> as part of FRA <strong>2005</strong>, is also used as one of the indicators of progress in reachingthe Millennium Development Goals (United Nations, <strong>2005</strong>a). Efforts have continuedto establish and maintain globally consistent definitions in the FRA process, in order toensure consistency over time and reduce the overall reporting burden on countries.1The reporting years have been as follows: 1946-1948, 1953, 1958, 1963, mid-1970s (regional assessments),1980, 1988, 1990, 1995 and 2000.
2<strong>Global</strong> <strong>Forest</strong> <strong>Resources</strong> <strong>Assessment</strong> <strong>2005</strong>The present report provides a comprehensive overview of the results of FRA <strong>2005</strong>grouped according to six themes, covering key aspects of sustainable forestmanagement:• Extent of forest resources• Biological diversity• <strong>Forest</strong> health and vitality• Productive functions of forest resources• Protective functions of forest resources• Socio-economic functionsEach of these chapters begins with a short overview describing the theme and howit relates to sustainable forest management. Next, the relevant variables included inFRA <strong>2005</strong> are listed, together with the availability of information on these. Key findingsare presented, followed by separate sections for each of the variables, highlightingcurrent status and trends.In Chapter 8, an attempt is made to synthesize the results and key trends that illustrateprogress towards sustainable forest management at subregional, regional and global levels.Chapter 9 states the main conclusions of the FRA <strong>2005</strong> process and its results,including some considerations regarding future assessments. This chapter is followedby the bibliography and by annexes providing country statistics and other backgroundmaterial.More information on the content and structure of the report and on the FRA <strong>2005</strong>process is provided below.THE REPORTING FRAMEWORKSustainable forest management and FRA <strong>2005</strong>The term ‘sustainable forest management’ can be traced to the non-binding ‘<strong>Forest</strong>Principles’ and Chapter 11 of Agenda 21, which were prominent outputs of the UnitedNations Conference on Environment and Development (UNCED) in June 1992.The guiding objective of the <strong>Forest</strong> Principles is to contribute to the management,conservation and sustainable development of all types of forests and to provide for theirmultiple and complementary functions and uses. Principle 2b specifically states, “<strong>Forest</strong>resources and forest lands should be sustainably managed to meet the social, economic,ecological, cultural and spiritual needs of present and future generations.”The concept of sustainable forest management has continued to evolve since 1992through international forest policy dialogue within the Intergovernmental Panelon <strong>Forest</strong>s (IPF), the Intergovernmental Forum on <strong>Forest</strong>s (IFF) and the UnitedNations Forum on <strong>Forest</strong>s (UNFF) – and through a large number of country-led andecoregional initiatives aimed at translating the concept into practice. These include thedevelopment of criteria for and indicators of sustainable forest management supportedby international organizations including <strong>FAO</strong>, the International Tropical TimberOrganization (ITTO), the United Nations Environment Programme (UNEP) andother members of the Collaborative Partnership on <strong>Forest</strong>s (CPF).Sustainable forest management is also the main theme of the <strong>FAO</strong> Strategic Planfor <strong>Forest</strong>ry (<strong>FAO</strong>, 1999a), whose mission is “to enhance human well-being throughsupport to member countries in the sustainable management of the world’s trees andforests”.Despite, or perhaps because of, the long maturing process of the sustainableforest management concept, it is difficult to define explicitly what sustainable forestmanagement is. However, several recent international meetings have suggested that theseven thematic elements in Box 1.1 are key components.Following the Kotka IV recommendation to use the sustainable forest managementconcept as a reporting framework, some basic attributes of FRA <strong>2005</strong> were developedin collaboration with the FRA advisory group and national correspondents:
Introduction 3BOX 1.1Thematic elements of sustainable forest managementThe seven thematic elements of sustainable forest management described below arebased on the nine ongoing regional/international processes on criteria and indicators forsustainable forest management 1 and have been acknowledged by <strong>FAO</strong> member countriesand the UNFF.1. Extent of forest resourcesThe theme expresses an overall desire to have adequate forest cover and stocking,including trees outside forests, to support the social, economic and environmentaldimensions of forestry. For example, the existence and extent of specific forest typesare important as a basis for conservation efforts. The theme encompasses ambitions toreduce deforestation and to restore and rehabilitate degraded forest landscapes. It alsoincludes the important function of forests and trees outside forests to store carbon andthereby contribute to moderating the global climate.2. Biological diversityThe theme concerns the conservation and management of biological diversity atecosystem (landscape), species and genetic levels. Such conservation, including theprotection of areas with fragile ecosystems, ensures that diversity of life is maintained,and provides opportunities to develop new products in the future, including medicines.Genetic improvement is also a means of increasing forest productivity, for example toensure high wood production levels in intensively managed forests.3. <strong>Forest</strong> health and vitality<strong>Forest</strong>s need to be managed so that the risks and impacts of unwanted disturbancesare minimized, including wildfires, airborne pollution, storm felling, invasive species,pests, diseases and insects. Such disturbances may impact social and economic as well asenvironmental dimensions of forestry.4. Productive functions of forest resources<strong>Forest</strong>s and trees outside forests provide a wide range of wood and non-wood forestproducts. This theme expresses the ambition to maintain an ample and valuable supplyof primary forest products, while at the same time ensuring that production andharvesting are sustainable and do not compromise the management options of futuregenerations.5. Protective functions of forest resourcesThe theme addresses the role of forests and trees outside forests in moderatingsoil, hydrological and aquatic systems, maintaining clean water (including healthyfish populations) and reducing the risks and impacts of floods, avalanches, erosionand drought. Protective functions of forest resources also contribute to ecosystemconservation efforts and have strong cross-sectoral aspects, because the benefits toagriculture and rural livelihoods are high.6. Socio-economic functionsThe theme covers the contributions of forest resources to the overall economy, forexample through employment, values generated through processing and marketing offorest products, and energy, trade and investment in the forest sector. It also addressesthe important forest function of hosting and protecting sites and landscapes of high
4<strong>Global</strong> <strong>Forest</strong> <strong>Resources</strong> <strong>Assessment</strong> <strong>2005</strong>cultural, spiritual or recreational value, and thus includes aspects of land tenure,indigenous and community management systems, and traditional knowledge.7. Legal, policy and institutional frameworkThe theme includes the legal, policy and institutional arrangements necessary tosupport the above six themes, including participatory decision-making, governanceand law enforcement, and monitoring and assessment of progress. It also involvesbroader societal aspects, including fair and equitable use of forest resources,scientific research and education, infrastructure arrangements to support theforest sector, transfer of technology, capacity-building, and public information andcommunication.1African Timber Organization (<strong>FAO</strong>, 2001a); Dry-Zone Africa Process on Criteria and Indicators forSustainable <strong>Forest</strong> Management; International Tropical Timber Organization; Lepaterique Process ofCentral America on Criteria and Indicators for Sustainable <strong>Forest</strong> Management; Montreal Process onCriteria and Indicators for the Conservation and Sustainable Management of Temperate and Boreal<strong>Forest</strong>s; Near East Process on Criteria and Indicators for Sustainable <strong>Forest</strong> Management; Pan-European <strong>Forest</strong> Process on Criteria and Indicators for Sustainable <strong>Forest</strong> Management; RegionalInitiative for the Development and Implementation of National-Level Criteria and Indicators forthe Sustainable Management of Dry <strong>Forest</strong>s in Asia; and the Tarapoto Proposal of Criteria andIndicators for Sustainability of the Amazon <strong>Forest</strong>.Source: www.fao.org/forestry/site/24447/en.• FRA <strong>2005</strong> should only address the first six thematic elements, i.e. it should notaddress the element related to the legal, policy and institutional framework forsustainable forest management.• FRA <strong>2005</strong> should focus on forest resources, their management and uses, i.e. itshould include primary production of forest products such as removals of woodand non-wood products, but it should not include further processing, marketingor benefits beyond the forest gate. One implication is that, conceptually, not allaspects of thematic elements 4–6 are addressed by FRA <strong>2005</strong>.• FRA <strong>2005</strong> should focus on trends for all included variables, acknowledgingthat it is the change and change rate, as opposed to a static assessment that willform the basis for determining the level of progress towards sustainable forestmanagement.In the design phase of FRA <strong>2005</strong>, tests were made to incorporate country-specificassessments of progress towards sustainable forest management. The results includea case study for India (<strong>FAO</strong>, 2003c) using the Delphi methods to assign weights toselected national parameters. However, this approach was not applied in FRA <strong>2005</strong>.FRA <strong>2005</strong> reporting tablesFifteen reporting tables were developed to address the thematic elements of sustainableforest management (Table 1.1). The tables, including variables and definitions, weresubject to intensive review by the FRA advisory group and national correspondentsbefore finalization (<strong>FAO</strong>, 2004a). Detailed specifications for the tables, variables anddefinitions, as well as the guidelines for reporting, were translated into five languages(<strong>FAO</strong>, 2004b, 2004c, 2004d, <strong>2005</strong>b) and are available online. Countries were asked toprovide information for the 15 tables for three points in time: 1990, 2000 and <strong>2005</strong>(with the exception of a few variables for which forecasting to <strong>2005</strong> was not indicated).Linkages among the tables and the six thematic elements addressed in FRA <strong>2005</strong> areillustrated in Table 1.2.
Introduction 5TABLE 1.1FRA <strong>2005</strong> reporting tables1 <strong>Forest</strong> extent 6 Biomass stock 11 Wood removals2 Ownership 7 Carbon stock 12 Value of wood removals3 Designated functions 8 Disturbances 13 Non-wood forest product (NWFP) removals4 <strong>Forest</strong> characteristics 9 Tree species occurrence 14 Value of NWFP removals5 Growing stock 10 Composition of growing stock 15 EmploymentTABLE 1.2Indicative linkages between reporting tables and thematic elements of sustainable forestmanagementReporting tableThematic elementsExtent Biological Health and Productive Protective Socioofforest diversity vitality functions functions economicresourcesfunctions1. <strong>Forest</strong> extent ✓ ✓ ✓2. Ownership ✓ ✓3. Designated functions ✓ ✓ ✓ ✓4. <strong>Forest</strong> characteristics ✓ ✓ ✓ ✓ ✓ ✓5. Growing stock ✓ ✓ ✓ ✓6. Biomass stock ✓ ✓ ✓ ✓7. Carbon stock ✓ ✓ ✓8. Disturbances ✓ ✓ ✓ ✓ ✓9. Tree species occurrence ✓ ✓ ✓ ✓10. Composition of growing stock ✓ ✓ ✓ ✓11. Wood removals ✓ ✓ ✓12. Value of wood removals ✓ ✓13. NWFP removals ✓ ✓ ✓ ✓14. Value of NWFP removals ✓ ✓15. Employment ✓Countries and areas included in FRA <strong>2005</strong>A total of 229 countries and areas are included in FRA <strong>2005</strong>, based on the list usedby the United Nations Statistics Division (234 countries and areas) (United Nations,<strong>2005</strong>b) with the following changes:The following seven reporting units are excluded:• Aaland Islands (included under Finland)• Guernsey (included under Channel Islands)• Hong Kong (included under China)• Jersey (included under Channel Islands)• Macao (included under China)• Norfolk Island• Svalbard and Jan Mayen IslandsThe following two reporting units are added:• British Indian Ocean Territory• South Georgia and the South Sandwich IslandsFor each of the 229, a country report has been prepared and issued as an FRA <strong>2005</strong>working paper. A separate working paper (FRA <strong>2005</strong> Country Report 230 – <strong>FAO</strong>, <strong>2005</strong>c)has been prepared for Antarctica and 28 dependent or disputed territories (includingNorfolk, Svalbard and Jan Mayen Islands) that have no, or no significant, areas of forest.Regions and subregionsThe FRA <strong>2005</strong> breakdown into six regions is the same as that used in other <strong>FAO</strong>publications, including FRA 2000, and follows well-established delineations. However,
6<strong>Global</strong> <strong>Forest</strong> <strong>Resources</strong> <strong>Assessment</strong> <strong>2005</strong>owing to the difference in size of individual countries, this breakdown means that, in someregions, one or a few countries dominate the regional results. The Russian Federation isincluded in Europe and dominates those statistics; the Caribbean and Central Americaare combined with North America and tend to be overshadowed by Canada and theUnited States; and Australia dominates the regional results for Oceania.A breakdown was created to provide more detail for three of the regions: Africa,Asia and North and Central America. Each of these was divided into three subregions,bringing the total number of reporting areas to 12. The subregional divisions are somewhatarbitrary, but are intended to represent areas with similar environmental and socioeconomicconditions. Table 1.3 summarizes key statistics for the regions and subregionsand Figure 1.1 provides a graphic illustration of the countries included in each.THE PROCESSFRA <strong>2005</strong> started with the Kotka IV expert consultation in July 2002 (<strong>FAO</strong>, 2002a)and has taken three and a half years to implement (Figure 1.2). The delivery of outputsincludes the release of global statistics, key findings and the 229 country reports(November <strong>2005</strong>); launch of the present report in February 2006; and subsequentreleases of the thematic studies during 2006. It will be officially closed at the Kotka Vexpert consultation, scheduled for June 2006, with an evaluation of the project.FRA <strong>2005</strong> involved more than 800 people (Annex 1) and was coordinated by the<strong>Forest</strong> <strong>Resources</strong> Development Service at <strong>FAO</strong> headquarters in Rome. Eight staffmembers and consultants were engaged full time throughout the project, includingfocal points for each region who facilitated communications between the nationalcorrespondents and <strong>FAO</strong>.Besides the core staff, a large number of <strong>FAO</strong> staff, consultants and volunteers wereengaged in various phases of FRA <strong>2005</strong> as specialists within specific subjects, as assistantsin the preparation of reports for countries and areas without a national correspondent,as regional staff in decentralized offices and as developers of thematic studies.The United Nations Economic Commission for Europe (UNECE) in Geneva was akey institutional partner, handling communications and support to European countries.TABLE 1.3Key statistics for regions and subregions used in FRA <strong>2005</strong>¹Region/subregion No. of Total area Population Rural Rural poor Populationcountries (million (million) population population increaseand areas hectares) (% of population) (% of rural (%/year)population)Eastern and Southern Africa 20 834 235 63 43 1.8Northern Africa 16 1 550 315 62 34 2.3Western and Central Africa 22 647 318 57 27 2.5Total Africa 58 3 031 868 61 34 2.2East Asia 5 1 176 1 528 56 4 0.7South and Southeast Asia 18 898 1 963 68 32 1.6Western and Central Asia 25 1 103 347 41 13 4.3Total Asia 48 3 177 3 838 61 21 1.5Total Europe 47 2 298 723 27 14 -0.1Caribbean 25 23 39 35 38 0.9Central America 7 52 39 47 60 2.3North America 5 2 197 429 21 0 1.1Total North and Central America 37 2 273 508 24 14 1.2Total Oceania 24 856 33 27 23 1.2Total South America 15 1 784 365 18 52 1.4World 229 13 419 6 335 51 23 1.4¹ Population figures from World Bank, <strong>2005</strong>
Introduction 7FIGURE 1.1Regional and subregional breakdown used in FRA <strong>2005</strong>AfricaEastern and Southern AfricaNorthern AfricaWestern and Central AfricaAsiaEast AsiaSouth and Southeast AsiaWestern and Central AsiaEuropeNorth and Central AmericaCaribbeanCentral AmericaNorth AmericaOceaniaSouth AmericaFIGURE 1.2FRA <strong>2005</strong> TimelineJuly 2002Kotka IVexpertconsultationMarch 200316 th sessionof COFONovember 2003<strong>Global</strong> meetingof nationalcorrespondentsApril 2004Launchof FRA <strong>2005</strong>reportingMay 2004– August <strong>2005</strong>Work at regionaland nationallevelsNovember<strong>2005</strong>Release ofkey findingsFebruary 2006Launch ofmain reportJune 2006Kotka VRecommendationsonscope andprocessRequest toimplementFRA <strong>2005</strong>Agreedtables andvariablesGuidelinesand specificationsin5 languages229 countryreportsFlyer andglobalstatisticspublishedMain reportreleasedFRA <strong>2005</strong>evaluationAn FRA advisory group was established and has had four meetings since early 2003(see Annex 5 for details). Members of the group represent partner institutions, includingITTO, the Ministerial Conference for the Protection of <strong>Forest</strong>s in Europe (MCPFE),UNEP, the UNEP-World Conservation Monitoring Centre (WCMC) and the World<strong>Resources</strong> Institute (WRI), as well as a range of countries from all regions. The advisorygroup has been instrumental in the development of FRA <strong>2005</strong>, as well as fulfilling avaluable oversight and review function.
8<strong>Global</strong> <strong>Forest</strong> <strong>Resources</strong> <strong>Assessment</strong> <strong>2005</strong>In line with recommendations from Kotka IV and COFO 2003, <strong>FAO</strong> requestedcountries to officially nominate a national correspondent to the FRA process. Theresponse to this request has been very strong from practically all countries. Atpresent, 172 national correspondents are confirmed. These correspondents, and theirrespective professional networks in the countries, represent a tremendous strength ofthe FRA <strong>2005</strong> process, and were responsible for coordinating inputs and preparingcountry reports according to a standard format in English, French or Spanish. Atraining session attended by more than 100 national correspondents was held inNovember 2003 in Rome, and detailed guidelines, specifications and reporting formatswere provided.The reporting format required countries to provide the full reference for originaldata sources and an indication of the reliability of the data for each of these, as wellas definitions of terminology. Separate sections in these reports deal with analysis ofdata (including any assumptions made and the methodologies used for estimates andprojections of data to the three reference years, 1990, 2000 and <strong>2005</strong>); calibration ofdata to the official land area as held by <strong>FAO</strong>; and reclassification of data to the classesused in FRA <strong>2005</strong>. Comments to the tables yield additional information, particularlywhere countries have experienced difficulty in matching national classes to those usedin FRA <strong>2005</strong>.Regional focal points at <strong>FAO</strong> headquarters and its regional and subregional officeswere in regular contact with national correspondents throughout the process. Anelectronic discussion forum and a list of frequently asked questions were provided onthe FRA <strong>2005</strong> Web site to further facilitate the reporting process.Once received, the draft country reports underwent detailed reviews to ensurecompleteness and correct application of definitions and methodologies – includingthe reclassification of national data into the FRA <strong>2005</strong> classification system. Internalconsistency was checked and a comparison made with information provided forFRA 2000, the <strong>FAO</strong>/EUROSTAT/ITTO/UNECE Joint <strong>Forest</strong> Sector Questionnaireand other published sources of information.A total of ten regional and subregional workshops were held to review the draftreports (see Annex 5 for details). These workshops provided an opportunity to shareexperiences and to address specific questions and issues related to data availabilityand interpretation. The final reports are thus the result of an iterative process and acollaborative effort.The data were then entered into <strong>FAO</strong>’s <strong>Forest</strong>ry Information System (FORIS)and global tables were generated. Subject specialists at <strong>FAO</strong> analysed these tables andprepared subregional, regional and global overviews for each topic of the main report.Before publishing the key findings and the global tables, all country reports were sentto the head of forestry in the respective country for final validation.Main outputs from FRA <strong>2005</strong>In addition to the present report, other major outputs of FRA <strong>2005</strong> include:• Country reports. A total of 229 detailed country reports have been prepared,listing the data sources and original data and describing the methodologies usedfor estimation, forecasting and reclassification, as well as any assumptions made.These reports are available on the FRA <strong>2005</strong> Web site (www.fao.org/forestry/site/fra<strong>2005</strong>/) in English, French or Spanish. Hard copies are available upon request.• <strong>Global</strong> tables. A set of 20 global tables have been compiled based on the countryinformation provided. These can be found in Annex 3 and are also available on theabove Web site.• Key findings. Fifteen key findings of FRA <strong>2005</strong> were released in November <strong>2005</strong>.A flyer describing these is available in English, French, Spanish, Arabic, Chineseand Russian on the FRA <strong>2005</strong> Web site or in hard copy upon request.
Introduction 9• Thematic studies. Seven thematic studies provide complementary information onspecific topics: planted forests, mangroves, bamboo, wildland fires, forest pests,forests and water, and forest ownership and resource tenure. Each of these studiesis being published separately.• Working papers. A number of FRA working papers have been prepared as part ofthe FRA <strong>2005</strong> process. They are listed in Annex 4.
10<strong>Global</strong> <strong>Forest</strong> <strong>Resources</strong> <strong>Assessment</strong> <strong>2005</strong>
11Chapter 2Extent of forest resourcesOVERVIEWExtent of forest resources is the first of the thematic elements characterizing sustainableforest management. Generally speaking, it refers to the overall goal of maintainingadequate forest cover and stocking – of various forest types and characteristicsincluding on ‘other wooded land’ and as ‘trees outside forests’ – to support the social,economic and environmental objectives related to forestry within a country or region.The ultimate aim of monitoring the extent and characteristics of forest resources is toreduce unplanned deforestation, restore and rehabilitate degraded forest landscapes,manage forests sustainably and evaluate the important function of carbon sequestrationby forests, other wooded land and trees outside forests – thereby contributing tomoderating the global climate (<strong>FAO</strong>, <strong>2005</strong>d).Information on the extent of forest resources has formed the backbone of all globalforest resources assessments and continued to be a major topic in FRA <strong>2005</strong>. <strong>Forest</strong> areais an easily understood baseline variable, which provides a first indication of the relativeimportance of forests in a country or region. Estimates of change in forest area overtime provide an indication of the demand for land for forestry and other land uses, aswell as of the impact of significant environmental disasters and disturbances on forestecosystems. As mentioned previously, the proportion of land area under forests is alsoused in the Millennium Development Goals indicator process (United Nations, <strong>2005</strong>a).However, as was observed in FRA 2000 (<strong>FAO</strong>, 2001b), the significance of forest areaas a single indicator of forest development has often been overemphasized, particularlyin the public debate, where other aspects of forest resources feature less prominently.The most commonly quoted result from global forest resources assessments continuesto be the global net loss of forest area. However, it is important to note that manyother parameters and scales must be considered in determining the relevant trends inthe extent of forest resources. Growing stock and carbon storage may be consideredequally important parameters, as they indicate whether forests are degraded and towhat extent they mitigate climate change. Further, the net loss of forest area is not initself sufficient to describe land-use dynamics that include both loss of forests due todeforestation and natural disasters and gains in forest area from planting or naturalexpansion.For FRA <strong>2005</strong>, information was sought on the current status and changes over timeof the following four variables:• area of ‘forest’ and ‘other wooded land’. Countries were also encouraged toprovide information on ‘other land with tree cover’; 1• characteristics of forests and other wooded land according to five classes: primary,modified natural, semi-natural, protective forest plantations and productive forestplantations;• standing volume of wood, i.e. the total growing stock in forests and other woodedland;• carbon stock contained in woody biomass, dead wood, litter and forest soils.Figure 2.1 illustrates the availability of information for these variables at the globallevel.1See Annex 2 for exact definitions.
12<strong>Global</strong> <strong>Forest</strong> <strong>Resources</strong> <strong>Assessment</strong> <strong>2005</strong>FIGURE 2.1Information availability – extent of forest resourcesArea of forest228 1Area of other wooded land171 949<strong>Forest</strong> characteristics168 6 55Growing stock147 3 79Carbon stock143 4 820 10 20 30 40 50 60 70 80 90 100Percentage of total forest areaInformation available for all years Information available for latest year Information not available for latest yearNote: Figures present number of countries in each category.In regional and ecoregional criteria and indicator processes, as well as in nationalreports, more-detailed classifications of the forest area are often used, e.g. accordingto forest or vegetation type, age structure or diameter distribution classes. Because ofthe varying conditions and classification systems among countries and regions, it wasnot feasible to report on such classifications at the global level. However, countryreports for FRA <strong>2005</strong> contain considerably more detail than is shown in the globaltables. Moreover, thematic studies have been prepared on planted forests, mangrovesand bamboo that provide in-depth knowledge on these forest types and groups ofspecies.In FRA 2000, an independent remote sensing survey was carried out to supplementcountry reporting for the pan-tropical region. The results constituted an importantingredient in the analysis of global and regional trends, leading, for example, to acalibration of reported changes in forest area for Africa. The survey also providedconsiderable insight into change processes in land use, including the documentationof different patterns of land-use change in tropical regions. The results have beenwidely acknowledged and used (e.g. Mayaux et al., <strong>2005</strong>). While no similar project wascarried out for FRA <strong>2005</strong> owing to lack of resources, preparations have been made fora more ambitious approach (<strong>FAO</strong>, 2003d) that takes a broader range of informationrequirements into account. This approach is being considered for the next global forestresources assessment (FRA 2010).KEY FINDINGSBased on the information provided, total forest area in <strong>2005</strong> is estimated to be justunder 4 billion hectares (ha) or 30 percent of total land area. This corresponds to anaverage of 0.62 ha of forest per capita.However, area of forest is unevenly distributed. For example, 64 countries with acombined population of 2.0 billion have less than 0.1 ha of forest per capita. Oftendescribed as low forest cover countries (LFCCs), they include a number of fairlylarge countries in arid zones, as well as many small island developing states (SIDS)
Extent of forest resources 13and dependent territories. The ten most forest-rich countries account for two-thirdsof total forest area, while seven countries or territories have no forest at all, and anadditional 57 have forest on less than 10 percent of their total land area.Deforestation, mainly due to conversion of forests to agricultural land, continues atan alarmingly high rate – some 13 million hectares per year. At the same time, forestplanting, landscape restoration and natural expansion of forests have significantlyreduced the net loss of forest area.Net global change in forest area in the period 2000–<strong>2005</strong> is estimated at -7.3 millionhectares per year (an area about the size of Panama or Sierra Leone), down from -8.9 millionhectares per year in the period 1990–2000.South America suffered the largest net loss of forests from 2000 to <strong>2005</strong> – about4.3 million hectares per year – followed by Africa, which lost 4.0 million hectaresannually.North and Central America and Oceania each had a net loss of about 350 000 ha,while Asia, which had a net loss of some 800 000 ha per year in the 1990s, reported anet gain of 1 million hectares per year from 2000 to <strong>2005</strong>, primarily as a result of largescaleafforestation reported by China. <strong>Forest</strong> areas in Europe continued to expand,although at a slower rate than in the 1990s.Total area of other wooded land is estimated to be at least 1 376 million hectares– about one-third the size of total forest area. Total area of other land with tree coverwas reported to be 76 million hectares, but is undoubtedly much higher as informationavailability was limited.An estimated 36 percent of total forest area is classified as primary forests, i.e. forestsof native species, in which there are no clearly visible indications of human activity andecological processes are not significantly disturbed. About 6 million hectares of theseforests were lost or modified each year since 1990, and there is no indication that the rateof change is slowing down. This rapid decrease stems not only from deforestation, butalso from modification of forests due to selective logging and other human interventionsthrough which primary forests move into the category of modified natural forests.The global area of modified natural forests (forests of naturally regenerated nativespecies in which there are clearly visible indications of human activity) is about2 billion hectares (53 percent of all forests). An estimated 7 percent of the world’sforests are semi-natural forests – i.e. forests comprising native species, establishedthrough planting, seeding or assisted natural regeneration.<strong>Forest</strong>s and trees are being planted for many purposes and at increasing rates, yetthey still account for a fairly small proportion of total forest area. <strong>Forest</strong> plantations– a subset of planted forests consisting primarily of introduced species – make upan estimated 4 percent of total forest area. Productive forest plantations, primarilyestablished for wood and fibre production, account for 78 percent of these, andprotective forest plantations, primarily established for conservation of soil and water,account for 22 percent. The area of forest plantations increased by about 14 millionhectares during 2000–<strong>2005</strong>, or 2.8 million hectares per year, 87 percent of which areproductive forest plantations.Total area of mangroves is estimated at 15.2 million hectares as of <strong>2005</strong>, down from18.8 million hectares in 1980. Close to half the total mangrove area (47 percent) isfound in five countries: Indonesia, Australia, Brazil, Nigeria and Mexico.The area of bamboo is difficult to assess, as these species often occur as patcheswithin forests or as clusters outside them. Nevertheless, preliminary findings based onreports from 30 of the main bamboo-rich countries indicate that the total area is about40 million hectares – or 1 percent of the global forest area – and is increasing.In <strong>2005</strong> the total global growing stock of forests was estimated at 434 billion m 3 ,which corresponds to an average of 110 m 3 per hectare. The countries with the mostgrowing stock per hectare were found in central Europe and some tropical areas.
14<strong>Global</strong> <strong>Forest</strong> <strong>Resources</strong> <strong>Assessment</strong> <strong>2005</strong>Total growing stock shows a slight overall downward tendency – mainly owingto a decrease in forest area. However, some regions also show significant trends ingrowing stock per hectare, for example Europe shows an increase and Southeast Asia adecrease.It is estimated that the world’s forests store 283 gigatonnes (Gt) of carbon in theirbiomass alone and 638 Gt of carbon in the ecosystem as a whole (to a soil depth of30 cm). Thus forests contain more carbon than the entire atmosphere. Roughly half oftotal carbon is found in forest biomass and dead wood combined and half in soils andlitter combined.Carbon in forest biomass decreased in Africa, Asia and South America in the period1990–<strong>2005</strong>, but increased in all other regions. For the world as a whole, carbon stocks inforest biomass decreased by 1.1 Gt of carbon annually, owing to continued deforestationand forest degradation, partly offset by forest expansion (including planting) and anincrease in growing stock per hectare in some regions.In conclusion, considerable progress has been made towards reversing the overalltrend of forest area loss, and several variables related to extent of forest resources showno significant negative trends or even a positive trend over time in some countries andregions. Yet deforestation, including conversion of forests to agricultural land, continuesat an alarmingly high rate. Considerable efforts are needed before the overall trend inextent is positive or stable in all regions.FOREST AREA AND FOREST AREA CHANGE<strong>Forest</strong> area provides the first indication of the relative importance of forests in a country orregion, while estimates of forest area change over time provide an indication of the demandfor land for forestry and other land uses, and may also illustrate the impact of significantenvironmental disasters and disturbances on forest ecosystems. <strong>Forest</strong> area is relativelyeasy to measure, and this variable has therefore been selected as one of the 48 indicatorsfor monitoring progress towards the Millennium Development Goals agreed by theUnited Nations (particularly Goal 7 – Ensuring environmental sustainability).Data on the status of and trends in area of forest are crucial to decisions related toforest and land-use policies and resource allocations, but they need to be combinedwith information on the health and vitality of forests and their socio-economic andenvironmental functions and values. Other sections of this report deal with theseaspects.Information availabilityInformation on the extent of forests was provided by 228 of the 229 countries andareas reporting for FRA <strong>2005</strong> – the exception being the Marshall Islands, for which noquantitative information was available. Antarctica and some of the smaller dependentterritories, which do not have, or have no significant, forest area were not included inthe list of reporting units for FRA <strong>2005</strong>.Four countries or areas (Guam, Guyana, Lebanon and the Occupied PalestinianTerritory) did not provide an estimate of forest area for 1990. All other countries and areasprovided estimates for all three reporting years (1990, 2000 and <strong>2005</strong>). For the purpose ofanalysis, the 1990 forest area for each of these four countries and areas was estimated by<strong>FAO</strong> based on a linear extrapolation of the figures provided for 2000 and <strong>2005</strong>.Since extent of forest resources is a key variable for decisions regarding forestpolicy and investments in the forestry sector, almost all countries and areas providedinformation on this variable. However, some countries had comprehensive informationfrom only one point in time (see Table 2 in Annex 3), while others had estimates thatwere incompatible, making trend analyses difficult.Information on the extent of other wooded land as of <strong>2005</strong> was available from180 countries and areas, which together account for 64.9 percent of total forest area.
Extent of forest resources 15Only 61 countries and areas reported on current extent of other land with tree cover,which is a new variable in global forest resources assessments. It aims to capture thoseareas in which forest cover criteria are met, but the predominant land use is agricultural(e.g. orchards and oil-palm plantations) or urban (e.g. urban parks).StatusTotal forest area as of <strong>2005</strong> is estimated at 3 952 million hectares or 30 percent of totalland area. This corresponds to an average of 0.62 ha per capita. As can be seen fromFigure 2.2, the area of forest is unevenly distributed. For example, 64 countries with acombined population of 2.0 billion have less than 0.1 ha of forest per capita.Based on available information, total area of other wooded land is estimated to be atleast 1 376 million hectares – about one-third of total forest area. This category sufferedfrom reclassification problems, particularly in dry zones such as those in Australia,Kenya and the Sudan, in which the distinction between forest and other wooded landis not very clear. Total area of other land with tree cover is at least 76 million hectares.These two estimates, particularly the latter, were limited by lack of information, and thetrue extent of other land with tree cover is undoubtedly much higher.Distribution of forests. A subregional summary of the distribution of forests isshown in Table 2.1. Europe accounts for one-quarter of total forest area, followed bySouth America and North and Central America with 21 and 18 percent respectively.Information on the area of forest and other wooded land by country can be found inTable 3 in Annex 3.<strong>Forest</strong>-rich and forest-poor countries. The five most forest-rich countries (the RussianFederation, Brazil, Canada, the United States and China) account for more than half oftotal forest area (2 097 million hectares or 53 percent). The Russian Federation aloneFIGURE 2.2The world’s forests<strong>Forest</strong>Other wooded landOther landWater
16<strong>Global</strong> <strong>Forest</strong> <strong>Resources</strong> <strong>Assessment</strong> <strong>2005</strong>accounts for 20 percent of the world total. Seven countries have more than 100 millionhectares of forest each. The ten most forest-rich countries account for 66 percent of totalforest area (Figure 2.3). The remaining 34 percent is spread among 212 countries andareas. Seven countries and areas (the Falkland Islands, Gibraltar, the Holy See, Monaco,Nauru, South Georgia and South Sandwich Islands and Tokelau) reported having noareas that qualify as forests using the FRA <strong>2005</strong> definition.High and low forest cover countries. Forty-five countries and areas have more thanhalf their total land area covered by forests (Figure 2.4), and 11 of these have morethan 75 percent of their total land area covered. Most of these are small island states orterritories, but the list also includes three low-lying coastal states in South America andone country in the Congo Basin (Table 2.2).Sixty-four countries and areas have less than 10 percent of their total land area coveredby forests. These include many SIDS and dependent territories, as well as 17 largerTABLE 2.1Distribution of forests by subregion <strong>2005</strong>Region/subregion <strong>Forest</strong> area % of global(1 000 ha) forest areaEastern and Southern Africa 226 534 5.7Northern Africa 131 048 3.3Western and Central Africa 277 829 7.0Total Africa 635 412 16.1East Asia 244 862 6.2South and Southeast Asia 283 127 7.2Western and Central Asia 43 588 1.1Total Asia 571 577 14.5Total Europe 1 001 394 25.3Caribbean 5 974 0.2Central America 22 411 0.6North America 677 464 17.1Total North and Central America 705 849 17.9Total Oceania 206 254 5.2Total South America 831 540 21.0World 3 952 025 100.0FIGURE 2.3Ten countries with largest forest area <strong>2005</strong>(million ha)Russian Federation 809Brazil 478Canada 310United States 303China 197Australia 164Democratic Republic of the Congo 134Indonesia 88Peru 69India 68Others 1 333
Extent of forest resources 17FIGURE 2.4<strong>Forest</strong> area in percent of land area by country <strong>2005</strong>0–1010–3030–5050–7070–100TABLE 2.2High forest cover countries <strong>2005</strong>Country <strong>Forest</strong> area % of total(1 000 ha) forest areaSuriname 14 776 94.7French Guiana 8 063 91.8Micronesia (Federated States of) 63 90.6American Samoa 18 89.4Seychelles 40 88.9Palau 40 87.6Gabon 21 775 84.5Pitcairn 4 83.3Turks and Caicos Islands 34 80.0Solomon Islands 2 172 77.6Guyana 15 104 76.7countries with relatively substantial forest areas (more than 1 million hectares each). Threeof these (Chad, the Islamic Republic of Iran and Mongolia) have more than 10 millionhectares of forest, but still qualify as LFCCs.At the regional level, South America is the region with the highest percentage offorest cover, followed by Europe and North and Central America. Asia is the regionwith the lowest percentage of forest cover (Table 2.3).
18<strong>Global</strong> <strong>Forest</strong> <strong>Resources</strong> <strong>Assessment</strong> <strong>2005</strong>TABLE 2.3<strong>Forest</strong> cover by subregion <strong>2005</strong>Region/subregion <strong>Forest</strong> area % of land(1 000 ha) areaEastern and Southern Africa 226 534 27.8Northern Africa 131 048 8.6Western and Central Africa 277 829 44.1Total Africa 635 412 21.4East Asia 244 862 21.3South and Southeast Asia 283 127 33.4Western and Central Asia 43 588 4.0Total Asia 571 577 18.5Total Europe 1 001 394 44.3Caribbean 5 974 26.1Central America 22 411 43.9North America 677 464 32.7Total North and Central America 705 849 32.9Total Oceania 206 254 24.3Total South America 831 540 47.7World 3 952 025 30.3FIGURE 2.5<strong>Forest</strong> change dynamicsFORESTReforestationNatural regenerationDeforestationNatural disastersAfforestationNatural expansionOTHERLANDTrendsFigure 2.5 is a simplified model illustrating forest change dynamics. It has only two classes:forests and all other land. A reduction in forest area can happen through either of twoprocesses. Deforestation, which is by far the most important, implies that forests are clearedby people and the land converted to another use, such as agriculture or infrastructure.Natural disasters may also destroy forests, and when the area is incapable of regeneratingnaturally and no efforts are made to replant it, it, too, reverts to other land.An increase in forest area can also happen in two ways: Either through afforestation,i.e. planting of trees on land that was not previously forested, or through naturalexpansion of forests, e.g. on abandoned agricultural land – which is quite common insome European countries.Where part of a forest is cut down but replanted (reforestation), or where the forestgrows back on its own within a relatively short period (natural regeneration), there isno change in forest area.For FRA <strong>2005</strong>, countries were asked to provide information on their forest area forthree points in time. This allows calculation of the net change in forest area over time.This net change is the sum of all negative changes due to deforestation and naturaldisasters and all positive changes due to afforestation and natural expansion of forests.The total net change in forest area in the period 1990–2000 is estimated at -8.9 millionhectares per year – equivalent to a loss of 0.22 percent of the remaining forest area eachyear during this period.
Extent of forest resources 19The total net change in forest area in the period 2000–<strong>2005</strong> is estimated at -7.3 millionhectares per year – an area the size of Panama or Sierra Leone – or equivalent to a lossof 200 km 2 of forest per day. Compared to the 1990s, the current annual net loss is18 percent lower and equals a loss of 0.18 percent of the remaining forest area each yearduring this period.Countries were not requested to provide information on each of the four componentsof net change, as most countries do not have such information. This, however, makesestimation of the deforestation rate difficult and no attempt has been made to do so at thecountry level. Rather, an estimate of the global deforestation rate has been made as follows:The total net loss for countries with a negative change in forest area was 13.1 millionhectares per year for 1990–2000 and 12.9 million hectares per year for 2000–<strong>2005</strong>. Thiswould indicate that annual deforestation rates were at least at this level. Since the netchange rate takes into account afforestation efforts and natural expansion of forests, therate of deforestation might be higher still. On the other hand, Brazil, which accountsfor 21 percent of the total net loss in the period 1990–2000 and 24 percent in 2000–<strong>2005</strong>,calculated its forest area in <strong>2005</strong> and 1990 based on information from 2000 and the sumof annual figures of the area of forests cleared. It did not take into account to whatextent the land use of these areas had changed and to what extent cleared lands hadbeen abandoned and had reverted to forest through natural regeneration. Such naturallyregenerated secondary forests are thought to be quite extensive, but insufficientinformation is available to estimate the extent. Thus the area of deforestation and the netloss of forests in Brazil are likely overestimated.Taking these considerations into account, the global deforestation rate was estimatedat 13 million hectares per year during the period 1990–<strong>2005</strong>, with few signs of asignificant decrease over time.In summary, deforestation continues at an alarming rate – but the rate of net loss isdecreasing due to afforestation and natural expansion of forests in some countries andregions.Trends in area of other wooded land were analysed, based on the 171 countries andareas providing information for all three reporting years. The analysis indicates that otherwooded land is more or less constant in North and Central America and Oceania. InEurope and South America, it decreased in the period 1990–2000, but remained almostconstant in the period 2000–<strong>2005</strong>. It decreased in both periods in Africa and Asia. At theglobal level, area of other wooded land decreased by about 3.3 million hectares per yearover the past 15 years. This finding should be treated with caution, however, since manycountries do not have compatible information over time for other wooded land, and thusone estimate was frequently used as the best available figure for all three reporting years.Data for other land with tree cover were too limited to allow trend analysis.Regional and subregional comparisons. Table 2.4 and Figure 2.6 show the changesin area of forest by region and subregion. South America suffered the largest netloss of forests from 2000 to <strong>2005</strong> – about 4.3 million hectares per year – followed byAfrica, which lost 4.0 million hectares annually. While there are signs that the net lossin Africa is decreasing, it seems to be increasing in South America – primarily due to areported increase in the net loss of forests in Brazil. However, as indicated above, thenet loss reported by Brazil for both periods may be overestimated. Efforts are currentlyunderway to design and implement a national forest assessment on a pilot basis in Brazil,which should yield better information for the next global forest resources assessment.North and Central America and Oceania each had a net loss of about 350 000 ha,with a decreasing trend in Oceania, and a slightly increasing trend in North and CentralAmerica – the latter primarily owing to a decrease in the plantation establishment ratein the United States (down from an average of 596 900 ha per year in 1990–2000 toan average of 157 400 ha per year in the period 2000–<strong>2005</strong>) and the continued, albeitdecreasing, net loss of forests in Mexico.
20<strong>Global</strong> <strong>Forest</strong> <strong>Resources</strong> <strong>Assessment</strong> <strong>2005</strong>TABLE 2.4Annual changes in forest area by subregion 1990–<strong>2005</strong>Region/subregion 1990–2000 2000–<strong>2005</strong>1 000 ha % 1 000 ha %Eastern and Southern Africa -1 731 -0.71 -1 702 -0.74Northern Africa -1 013 -0.72 -982 -0.73Western and Central Africa -1 631 -0.56 -1 356 -0.48Total Africa -4 375 -0.64 -4 040 -0.62East Asia 1 751 0.81 3 840 1.65South and Southeast Asia -2 578 -0.83 -2 851 -0.98Western and Central Asia 34 0.08 14 0.03Total Asia -792 -0.14 1 003 0.18Total Europe 877 0.09 661 0.07Caribbean 36 0.65 54 0.92Central America -380 -1.47 -285 -1.23North America 17 n.s. -101 -0.01Total North and Central America -328 -0.05 -333 -0.05Total Oceania -448 -0.21 -356 -0.17Total South America -3 802 -0.44 -4 251 -0.50World -8 868 -0.22 -7 317 -0.18Note: percentages represent the proportion of remaining forest area lost or gained each year during the respectiveperiod.n.s. = not significantFIGURE 2.6Annual net change in forest area by region 1990–<strong>2005</strong>(million ha per year)South AmericaAfricaAsiaEuropeNorth and Central AmericaOceania-5 -4 -3 -2 -1 0 1 21990–2000 2000–<strong>2005</strong>Asia, which had a net loss of some 800 000 ha per year in the 1990s, reported a netgain of 1 million hectares per year from 2000 to <strong>2005</strong>, primarily as a result of the largescaleafforestation reported by China. <strong>Forest</strong> areas in Europe continued to expand,although at a slower rate than in the 1990s. For information on changes in forest areaby country, see Table 4 in Annex 3.
Extent of forest resources 21Countries with large positive or negative changes. In the Caribbean, Europe, NorthAmerica, Oceania and Western and Central Asia, a majority of countries have no majorchanges over the last five years, while in Africa a majority of countries have a negativechange rate (Figure 2.7).A large number of countries in Oceania and the Caribbean have reported no majorchange, primarily because of lack of data and particularly for more than one point in time.The ten countries with the largest net loss per year in the period 2000–<strong>2005</strong> had acombined net loss of forest area of 8.2 million hectares per year (Table 2.5).The ten countries with the largest net gain per year in the period 2000–<strong>2005</strong> had acombined net gain of forest area of 5.1 million hectares per year due to afforestationefforts and natural expansion of forests (Table 2.6). The large increase in forest area forChina is due to recent, large-scale afforestation programmes.FIGURE 2.7Countries with large net changes in forest area 2000–<strong>2005</strong>>0.50% decrease per year>0.50% increase per yearChange rate between -0.50 and 0.50% per yearTABLE 2.5Ten countries with largest annual net loss in forestarea 2000–<strong>2005</strong>CountryAnnual change(1 000 ha/yr)Brazil -3 103Indonesia -1 871Sudan -589Myanmar -466Zambia -445United Republic of Tanzania -412Nigeria -410Democratic Republic of the Congo -319Zimbabwe -313Venezuela (Bolivarian Republic of) -288Total -8 216TABLE 2.6Ten countries with largest annual net gain in forestarea 2000–<strong>2005</strong>CountryAnnual change(1 000 ha/yr)China 4 058Spain 296Viet Nam 241United States 159Italy 106Chile 57Cuba 56Bulgaria 50France 41Portugal 40Total 5 104
22<strong>Global</strong> <strong>Forest</strong> <strong>Resources</strong> <strong>Assessment</strong> <strong>2005</strong>Thirty-seven countries and areas have an estimated net negative change rate of1 percent or more per year. The ten countries with the largest annual net negativechange rates for 2000–<strong>2005</strong> are: Comoros (-7.4 percent); Burundi (-5.2 percent);Togo (-4.5 percent); Mauritania (-3.4 percent); Nigeria (-3.3 percent); Afghanistan(-3.1 percent); Honduras (-3.1 percent); Benin (-2.5 percent); Uganda (-2.2 percent) andthe Philippines (-2.1 percent).Eighteen countries have an estimated annual positive change rate of 1 percent ormore due to natural expansion of forests and afforestation. The ten countries with thelargest estimated annual positive change rates for 2000–<strong>2005</strong> are: Rwanda (6.9 percent);Iceland (3.9 percent); Bahrain (3.8 percent); Lesotho (2.7 percent); Kuwait (2.7 percent);Egypt (2.6 percent); China (2.2 percent); Cuba (2.2 percent); Viet Nam (2.0 percent)and Tunisia (1.9 percent).Most but not all of the countries with large change rates measured in percentagesare LFCCs or countries with a limited forest area, where a relatively small change inabsolute values results in a large change in relative or percentage terms.Comparison with previous estimatesCountries were asked to provide estimates for three points in time for FRA <strong>2005</strong>: 1990,2000 and <strong>2005</strong>. The figures provided for 1990 and 2000 are likely to differ slightly fromthose reported for the previous assessment (FRA 2000) for the following reasons:First, the estimates presented in both assessments are derived primarily throughlinear interpolation and extrapolation of the results from two or more recentassessments. National forest resources assessments are fairly expensive, thus they areoften carried out at infrequent intervals and a new data set can significantly changeprevious forecasts based, for example, on estimates from the 1970s or 1980s.Second, many more countries were actively involved in the FRA <strong>2005</strong> process thanin previous assessments, and the national correspondents helped provide access tobetter and more recent information, while their detailed knowledge of forest typeshelped improve the reclassification of data into FRA <strong>2005</strong> categories.Table 2.7 shows a comparison of the results provided in FRA 2000 and thosereported in FRA <strong>2005</strong> for reporting years 1990 and 2000.<strong>Global</strong>ly, total forest area estimated in FRA <strong>2005</strong> for 1990 and 2000 was about3 percent higher than that in FRA 2000. This was primarily owing to reclassificationof unproductive forests in Canada and the United States (previously classified as otherwooded land), but also to new and better information from other countries.Most countries provided estimates of forest area that differed from those providedfor FRA 2000. Many differences were minor and due to calibration of areas to matchthe official land areas as found in the <strong>FAO</strong> database <strong>FAO</strong>STAT (<strong>FAO</strong>, <strong>2005</strong>a). Otherswere due to reclassifications or to new and better information and, in some cases,resulted in significantly different figures.A total of 79 countries provided estimates for 1990 for FRA <strong>2005</strong> that differed by morethan 10 percent from those presented for FRA 2000. Similarly, a total of 85 countriesprovided new figures for 2000 that differed by more than 10 percent from thosepresented for FRA 2000. A separate working paper has been prepared explaining thesedifferences (<strong>FAO</strong>, 2006a).Annual net loss of forests in the 1990s appears to have been overestimated inprevious studies. FRA 2000 estimated the annual net change in global forest area to be-9.4 million hectares per year for the period 1990–2000. FRA <strong>2005</strong> estimates the ratefor the same period to be -8.9 million hectares per year, i.e. half a million hectares lessper year.The main differences are found in Africa, where the net loss is 1 million hectareslower than previously estimated, and in Asia, where FRA <strong>2005</strong> estimates a higher
Extent of forest resources 23TABLE 2.7Comparison of forest area estimates in FRA <strong>2005</strong> and FRA 2000Region FRA <strong>2005</strong> estimates FRA 2000 estimates<strong>Forest</strong> area Annual <strong>Forest</strong> area Annual(1 000 ha) change (1 000 ha) change(1 000 ha/yr) (1 000 ha/yr)1990 2000 1990–2000 1990 2000 1990–2000Africa 699 361 655 613 -4 375 702 502 649 866 -5 262Asia 574 487 566 562 -792 551 448 547 793 -364Europe 989 320 998 091 877 1 030 475 1 039 251 881North and Central America 710 790 707 514 -328 555 002 549 304 -570Oceania 212 514 208 034 -448 201 271 197 623 -365South America 890 818 852 796 -3 802 922 731 885 618 -3 711World 4 077 291 3 988 610 -8 868 3 963 429 3 869 455 -9 391loss for the 1990s than previously reported, primarily due to a revised change rate forIndonesia, based on more recent information.For Africa, the results for FRA <strong>2005</strong> are closer to the results of the independentremote sensing analysis done for FRA 2000, which indicated that the net annual losswas -2.2 million hectares, while the reports indicated a net loss of -5.5 million hectares.However, the net loss of 4.3 million hectares reported for FRA <strong>2005</strong>, which is based onnational reports, may still be overestimated.FOREST CHARACTERISTICSThe request for information on forest characteristics aimed to provide more detailedinformation on the kinds of forest that exist, in terms of their ‘naturalness’ or the intensityof silviculture and management practices. A continuum exists from primary forests withno – or no visible – indications of past or present human activity to intensively managedforest plantations of introduced species, primarily managed for a single product, often ona relatively short rotation. Between these two extremes lies a range of scenarios, and thereare no clear cut-off points between possible classes along the continuum.Countries were asked to characterize their forests and other wooded land accordingto five classes: primary, modified natural, semi-natural, protective forest plantation andproductive forest plantation.The first three classes comprise native forest tree species only, with the possibleexception of small areas of natural regeneration of introduced or naturalized speciesin the semi-natural class. While the origin of primary and modified natural forestsis natural regeneration, semi-natural forests are established through assisted naturalregeneration, planting or seeding, while all forest plantations are established throughplanting or seeding.Planted forests thus comprise all forest plantations and parts of semi-naturalforests. All planted forests of introduced species were classified as forest plantationsin FRA <strong>2005</strong>. Planted forests of native species were classified as forest plantations ifcharacterized by few species, straight, regularly spaced rows and/or even-aged stands.If they resembled natural forests of the same species mix, such as many planted forestsin Europe, they were classified as semi-natural forests.A thematic study on planted forests, including the planted-forest component of bothsemi-natural forests and forest plantations, is being completed for release during 2006to complement the data available in FRA <strong>2005</strong> (Box 2.1 ).The use of the five different classes helps clarify the extent to which forests arehuman-made or -modified, while at the same time providing an indication of the
24<strong>Global</strong> <strong>Forest</strong> <strong>Resources</strong> <strong>Assessment</strong> <strong>2005</strong>BOX 2.1FRA <strong>2005</strong> thematic study on planted forestsThis study complements FRA <strong>2005</strong> with more detailed data, information and analysison planted forests around the globe. Its aims are to: provide inputs into a globaloutlook on the future supply of forest products and services from planted forests;better understand the role of planted forests in the mosaic of land uses in the broaderlandscape; and offer factual inputs into the ongoing process of deriving a plantedforest code.A survey is being undertaken of countries reporting high proportions of seminaturalforests and large areas of forest plantations. As a first step, the survey requestedcountries to differentiate the planted forest component of semi-natural forests and forestplantations, collectively known as the planted forest subset.Management and ownership of planted forests have changed over the period1990–<strong>2005</strong>. Consequently, countries were asked to report their management designationfor primarily productive or primarily protective purposes, as well as ownership, for thereporting periods 1990, 2000 and <strong>2005</strong>. Planted forests managed primarily for productivepurposes supply wood, fibre, fuelwood and NWFPs for industrial purposes, but can alsoprovide social, cultural and environmental services. Planted forests managed primarilyfor protective purposes protect soil and water, rehabilitate degraded lands and conservebiological diversity and carbon sinks, but can also include minor harvesting of forestproducts. Management parameters reported include the top ten species,growth rates, rotation lengths and age and class distributions for both productiveand protective designations, as well as harvest yields for planted forests managed forproductive purposes. Ownership is reported as state, private-sector corporate, smallholderor ‘other’.Countries were also asked to report on the main forest products, including sawlogs,pulpwood and fibre, industrial bioenergy, NWFPs and ‘unspecified’. In addition, data weresolicited on the services offered by planted forests, including the environment, recreation,non-industrial fuelwood and ‘unspecified’.Data collection was carried out by FRA <strong>2005</strong> national correspondents, with theparticipation of in-country specialists in planted forests. At the time of writing, analysiswas being completed for release of the study during 2006. A Web-based knowledgereference centre will be established, offering data, information and reference materialson planted forests and related topics (reproductive materials, forest health, invasivespecies, etc.) for wide access by stakeholders. The materials will also be provided in hardcopy and compact disc for those without access to the Internet.When available, the information will be posted on the <strong>FAO</strong> planted forest Web portal:www.fao.org/forestry/site/planted-forest/.intensity of management and the potential for wood production, e.g. for use in globalfibre supply models.The typical modified forest is a tropical forest in which selective logging has takenplace, but no silvicultural measures have influenced the natural regeneration of species.The typical semi-natural forest might be a temperate forest in Europe or a teak forestin Asia, in which the harvesting is much more intense, removing a larger volume andnumber of trees per hectare, and with specific interventions aimed at securing a desirablefuture species mix through assisted natural regeneration, seeding or planting of nativespecies.<strong>Forest</strong> plantations may be established for different purposes and have been dividedinto two classes, with protective forest plantations typically being unavailable for wood
Extent of forest resources 25supply (or at least having wood production as a secondary objective only) and oftenconsisting of a mix of species managed on long rotations or under continuous cover.This section provides an overview of status and trends as related to forestcharacteristics. More detailed information on primary forests can be found in thechapter on biological diversity, while analyses of productive and protective forestplantations can be found in the respective chapters on these themes.Information availabilityAlthough a large number of countries reported on the characteristics of their forests,information on all five classes was not always readily available, because countrieseither did not collect information or used a different national classification system.Proxy values have often been used, which makes a detailed analysis of status and trendsdifficult.Information was unavailable for many of the countries in the Congo Basin, the secondlargest expanse of tropical forest, and this should be kept in mind when analysing thefindings.Few countries had information on the area of primary forests. Some used the currentarea of forests in national parks and other protected areas as a proxy value or providedan expert estimate of the percentage of natural forests that could be considered primaryaccording to the definition used for FRA <strong>2005</strong>. There were also some inconsistencies inreporting planted forests of native species: some countries reported these as semi-naturalforests, while others preferred to include them as forest plantations. Thus it may notbe possible to directly compare figures for different countries, owing to differences ininterpretation of the classification systems.Of 229 countries and areas reporting, 174 reported on the characteristics of theirforests. Their combined forest area was estimated at 3 678 million hectares – equivalentto 93 percent of the total forest area of the world (Figure 2.8).Of the 180 countries providing information on the area of other wooded land,114 provided information on characteristics.FIGURE 2.8Information availability – forest characteristicsEastern and Southern AfricaNorthern AfricaWestern and Central AfricaEast AsiaSouth and Southeast AsiaWestern and Central AsiaEuropeCaribbeanCentral AmericaNorth AmericaOceaniaSouth AmericaWorld0 10 20 30 40 50 60 70 80 90 100Percentage of total forest areaInformation available for all years Information available for latest year Information not available for latest year
26<strong>Global</strong> <strong>Forest</strong> <strong>Resources</strong> <strong>Assessment</strong> <strong>2005</strong>StatusMore than one-third (36 percent) of total forest area is classified as primary forest,i.e. forest of native species, in which there are no clearly visible indications of humanactivity and ecological processes are not significantly disturbed (Figure 2.9).Great variation exists in terms of the distribution of primary forests, with limitedareas reported from the Caribbean, Europe (excluding the Russian Federation) and thearid zones of Eastern and Southern Africa, Northern Africa and Western and CentralAsia. The largest expanse of primary forest is found in South America (the Amazon).Countries in North and Central America and the Russian Federation have also classifieda relatively high proportion of their forests as primary.Slightly more than half of all forests (53 percent) are considered modified naturalforests (forests of naturally regenerated native species in which there are clearly visibleindications of human activity) and 7 percent are classified as semi-natural forests (forestscomprising native species, established through planting, seeding or assisted naturalregeneration).<strong>Forest</strong> plantations constitute an estimated 4 percent of forest area (forests ofintroduced species, and in some cases native species, established through planting orseeding), classified either as productive (3 percent of total forest area) or protective(0.8 percent of total forest area).The vast majority of other wooded land (69 percent) was classified as modifiednatural, 28 percent as primary and the remaining 3 percent as semi-natural.TrendsA trend analysis was generated based on the 167 countries providing estimates for allthree reporting years, 2 including those reporting no primary forest.As can be seen in Figure 2.10, the areas of primary forest and modified naturalforest are decreasing, while the areas of semi-natural forest and forest plantation areincreasing.About 6 million hectares of primary forest have been lost or modified each year since1990, 3 and there is no indication that the rate of change is slowing down. This rapiddecrease stems not only from deforestation, but also from modification of forests dueto selective logging and other human interventions – whereby primary forests moveinto the class of modified natural forests. The rate of loss of primary forests is stableor slightly decreasing in most subregions, but is increasing in South America and, to alesser extent, in North America.Brazil and Indonesia alone account for an annual loss of primary forest of 4.9 millionhectares. The data collected do not permit an analysis of how much of this net loss isdue to deforestation and how much is owing to areas of forest moving into the modifiednatural forest class.A number of countries registered positive change rates in the area of primary forests,including several European countries and Japan (see Table 9 in Annex 3). In most of thesecases, countries have been setting aside natural forest areas in which no intervention is totake place. With time, these areas evolve into forests in which there are no clearly visibleindications of human activity and ecological processes are not significantly disturbed,which is the definition of primary forests used in FRA <strong>2005</strong>. Japan and some of the2This list of countries excludes the Russian Federation (see comment related to primary forests infootnote 3). Australia did not provide information for all categories for 1990; its primary forest hasbeen assumed to be constant and the remaining forest area not classified as forest plantation has beenassumed to be modified natural forest based on information from 2000 and <strong>2005</strong>.3This estimated net loss excluded the Russian Federation, in which a large difference in the change rate(from -1.6 million hectares per year in the 1990s to +0.5 million hectares per year in the last five years)is likely due to a change in the methodology used, rather than being a reflection of actual change.
Extent of forest resources 27FIGURE 2.9<strong>Forest</strong> characteristics <strong>2005</strong>(%)Primary forest 36.4Modified natural forest 52.7Semi-natural forest 7.1Productive forest plantation 3.0Protective forest plantation 0.8FIGURE 2.10<strong>Global</strong> trends in forest characteristics 1990–<strong>2005</strong>(million ha)Primary forestModified natural forestSemi-natural forestProductive forest plantationProtective forest plantation0 200 400 600 800 1 000 1 200 1 400 1 6001990 2000 <strong>2005</strong>European countries, for example, classified all natural forests over a certain age or sizeas primary forests if no interventions had been conducted in the last 25 years.There has been an increase in the area of forest plantations of about 14 million hectaresin the last five years, or about 2.8 million hectares per year, 87 percent of which are in theproductive class.Information availability on the characteristics of other wooded land was insufficientfor analysing trends over time.<strong>Forest</strong> types and species groups. In addition to the thematic study on plantedforests mentioned above, two studies on specific forest types and species groups wereundertaken to complement the FRA <strong>2005</strong> main report – one on mangroves (Box 2.2)and another on bamboo (Box 2.3).
28<strong>Global</strong> <strong>Forest</strong> <strong>Resources</strong> <strong>Assessment</strong> <strong>2005</strong>The total area of mangroves was estimated at 15.2 million hectares, down from18.8 million hectares in 1980. An estimated 47 percent of this area was found in fivecountries: Indonesia, Australia, Brazil, Nigeria and Mexico.As mentioned earlier, the area of bamboo is difficult to assess, as these species oftenoccur as patches within or outside forests. Nevertheless, preliminary findings based onreports from 30 of the main bamboo-rich countries indicate that total area of bambooamounts to some 40 million hectares – or 1 percent of the global forest area – and it isincreasing.BOX 2.2FRA <strong>2005</strong> thematic study on mangrovesMangroves are salt-tolerant forest ecosystems commonly found along sheltered coastlines,in deltas and along river banks in the tropics and subtropics. These trees and shrubs havedeveloped morphological adaptations to tidal environments, such as aerial roots, saltexcretion glands and, in some species, vivipary of seeds.A large proportion of coastal populations in tropical regions depend on mangrovesfor their subsistence, either directly through the extraction of wood and non-wood forestproducts, such as fuelwood, charcoal, timber, food and medicines, or indirectly throughthe many aquatic and terrestrial species for which these ecosystems provide nutrients anda habitat. Mangroves serve as spawning grounds and nurseries for a variety of fish andshellfish, playing a significant role in the marine food system. When mangrove forests aredestroyed, declines in local fish catches often result. These ecosystems also play an importantrole in preventing and reducing coastal erosion, providing nearby communities withprotection against the effects of wind, waves and water current. This was demonstratedduring the 2004 tsunami in Asia – in locations in which extensive areas of mangroves existed,coastal villages suffered less damage. Moreover, these unique coastal forests provide otherimportant services: conservation of biological diversity and – by trapping sediment fromupland erosion – protection of coral reefs, sea-grass beds and shipping lanes against siltation.Despite their many important uses and benefits, high population pressure in coastalareas has frequently led to the conversion of mangrove areas to other uses, including fishand shrimp farming, agriculture, salt or rice production and urban development. Mangroveshave also been fragmented and degraded due to overexploitation and pollution. Numerouscase studies describe mangrove losses over time, but comprehensive information at theglobal level is scarce. Despite past attempts to estimate total mangrove area, recent reliableinformation on status and trends at the global level is limited. The past attempts include:<strong>FAO</strong> and UNEP, 1981a, b and c; Saenger, Hegerl and Davie, 1983; Groombridge, 1992;Clough, 1993; Diop, 1993; Fisher and Spalding, 1993; Lacerda, 1993; Spalding, Blasco andField, 1997; and Aizpuru, Achard and Blasco, 2000.The FRA <strong>2005</strong> thematic study on mangroves was coordinated by <strong>FAO</strong> and cofunded byITTO. It provides an overview of the current extent of mangroves, their species composition,uses and threats, and changes in the extent of mangroves over time for the 124 countries orareas in which they exist. The study aims to facilitate access to comprehensive, comparableinformation that may serve as a tool for policy- and decision-makers and mangrovemanagers worldwide. The initiative builds on FRA 1980 and on information provided forFRA 2000 and <strong>2005</strong>, for which countries were asked to provide information on currentforest area according to forest types, using their own classification systems. Since mangrovesform a distinct and relatively easily defined forest type, most countries with mangrovesprovided specific information on their extent. An extensive literature search and inputsfrom national mangrove experts yielded additional information. Where recent nationalinformation was lacking, it was updated through interpretation of remote sensing data (an
Extent of forest resources 29in-kind contribution from the UNEP World Conservation Monitoring Centre – WCMC). Localauthorities and national experts played a key role in the process of gathering and reviewingthe extensive country-level information collected. Regression analyses yielded estimates for1980, 1990, 2000 and <strong>2005</strong> for each country.About 15.2 million hectares of mangroves currently exist worldwide, down from18.8 million hectares in 1980, with the largest extent found in Asia, followed by Africa andSouth America. The area of mangroves present in each country varies from a few hectaresto more than 3 million, with close to half the global area found in just five countries:Indonesia, Australia, Brazil, Nigeria and Mexico. Over the last 25 years, 3.6 million hectaresof mangroves (or about 20 percent of the total extent found in 1980) have disappearedworldwide. Although alarming, the rate of net loss of mangroves is showing signs of slowingdown. From about 185 000 ha lost annually in the 1980s (-1.03 percent per annum), itdropped to some 105 000 ha/year (-0.67 percent) during the 2000–<strong>2005</strong> period. This reflectsan increased awareness of the value of mangrove ecosystems, which has led, in turn, to thepreparation of new legislation, better protection and management and, in some countries,to an expansion of mangrove areas through active planting or natural regeneration.The detailed findings of the thematic study will consitute an important contributionto the revised World atlas of mangroves (www.fao.org/forestry/site/mangrove-atlas). Thestudy report was being completed for release during 2006. Further information on thestudy and the profiles for the 124 countries or areas in which mangroves occur can befound at www.fao.org/forestry/site/mangrove. The country profiles will also be compiledinto five regional reports.BOX 2.3FRA <strong>2005</strong> thematic study on bambooBamboo is an integral part of tropical and subtropical forests, and bamboo resources haveincreasing importance in poverty alleviation and sustainable development of the ruralpoor. These species continue to play a crucial role in Asia, while their use is rapidly growingin Africa and Latin America. Bamboo is moving out of the craft-industry phase and nowprovides raw material for preindustrial processing and for industry products (bambooshoots, construction poles, panelling and flooring products, pulp, etc.), thus gainingsignificance as both an internationally traded commodity and a tool for livelihood andindustrial development.A first attempt at assessing the extent of bamboo resources at the global level wasmade by <strong>FAO</strong> and UNEP as part of FRA 1980, for which 13 countries provided estimates.The FRA <strong>2005</strong> thematic study on bamboo is a joint effort of <strong>FAO</strong> and the InternationalNetwork for Bamboo and Rattan (INBAR). The inclusion of bamboo among the seventhematic studies under FRA <strong>2005</strong> seeks to raise awareness of the value, dynamicsand importance of the bamboo sector – attracting investment and formulating andredesigning forest policies.Following the general methodology of the FRA <strong>2005</strong> country reports, the specificallydesigned bamboo reports included information on the extent and characteristics of bambooresources, ownership, growing stock, and amount and value of removals. The informationprovided by 22 country reports was analysed, reviewed and, where needed, complementedby additional information from a literature search and expert consultations. Two workshopswere organized to discuss the design of the study and then the preliminary results.Additional information was obtained from the Production to consumption studies alreadycarried out by INBAR in various countries. With the integration of existing information
30<strong>Global</strong> <strong>Forest</strong> <strong>Resources</strong> <strong>Assessment</strong> <strong>2005</strong>through a systematic data-collection procedure, the thematic study constitutes a focusedinvestigation into the extent of bamboo resources on a global scale.The quality and quantity of the information varied significantly among regions, witha richer contribution from Asian countries as compared with Africa and Latin America.This was hardly a surprise: it is in the Asian region that bamboo has had the longesttradition of use and where it has a fundamental role today for a significant portion of thepopulation. However, Africa and Latin America are quickly developing greater interest inbamboo resources and their potential, and several country representatives of these regionshighlighted the need for more systematic investigation and assessment.Due to the scattered nature of the data provided and the ongoing analysis, onlypreliminary results can be offered here. Sixteen countries in Asia reported a total ofroughly 25 million hectares of bamboo forest. Major contributors were India (9 millionhectares) and China (5 million hectares), followed by Indonesia, Myanmar and Thailand. Inthis region, bamboo forests constitute approximately 4 percent of the total forest cover,with peaks of over 10 percent for India, Laos and Sri Lanka. Although the informationgathered from Africa is still partial, six countries reported a total of approximately 3 millionhectares of bamboo forest, with Ethiopia, Kenya and Nigeria showing the largest areas. InLatin America, at least ten countries have significant bamboo resources, although preciseassessments have not yet been done. A total of 11 million hectares is considered a realisticestimate for the region, with Brazil, Chile, Colombia, Ecuador and Mexico among the richestin these resources. Information on other characteristics of bamboo forests and the amountand value of removals will be presented in the thematic study, to be released during 2006.Bamboo is often intermixed with other species or is cultivated outside forests, alongvillage and farm boundaries, which presents a challenge to the study. For this reason, the‘bamboo forest’ can have different definitions. In addition, most harvesting and tradeoccur locally among villages, with no official records. These combined factors explain whycurrent bamboo resource statistics are inconsistent, fragmented and in need of upgrading.Nevertheless, steps to improve the availability of quantitative data have been made byseveral countries, in recognition of the importance of bamboo to poverty alleviation, forestconservation and economic and environmental development. The main value of this studyis thus the development of a systematic methodology for the recording of bamboo forestcharacteristics and sector data.GROWING STOCKGrowing stock has formed part of global forest resources assessments since the firstreport. In addition to providing information on existing wood resources, growingstock estimates constitute the basis for estimation of biomass and carbon stocks formost countries.Country information on total growing stock and forest area was used to estimategrowing stock per hectare as an indicator of how well or poorly stocked the forestsare. FRA <strong>2005</strong> has also collected country information on commercial growing stock.Chapter 5 (Productive functions of forest resources) presents results for this indicator,as well as a more detailed discussion of total growing stock.Information availabilityOf the 229 countries and territories covered by FRA <strong>2005</strong>, 150 countries, representing88 percent of the world’s forest area, reported on growing stock for <strong>2005</strong>. Oceania wasthe only region for which information was available for only a small portion of forestarea (15 percent), given that Australia did not provide information on this variable. Witha few exceptions, reporting countries gave information for all three reporting years (seeFigure 5.6 in Chapter 5).
Extent of forest resources 31Although many countries provided information on growing stock, the quality ofthe information is variable. A few countries with repeated national forest assessmentshave very reliable information, but many countries do not have good inventory data tosupport growing stock estimates and changes in growing stock over time.StatusIn order to obtain consistent global, regional and subregional estimates of total growingstock, growing stock per hectare was estimated for each region/subregion for thosecountries providing information. These estimates were then multiplied by the totalforest area of each region and subregion. Table 5.7 in Chapter 5 shows the status ofgrowing stock in <strong>2005</strong> and its distribution by region and subregion.Total growing stock is estimated at 434 billion m 3 , of which some 30 percent is foundin South America.The five countries with the greatest total growing stock account for almost 261 billionm 3 , which corresponds to 60 percent of the global total. Of these, Brazil has the largestgrowing stock, with 81 billion m 3 or 19 percent of the total.The global average for growing stock per hectare is 110 m 3 /ha. The countries with the highestgrowing stock per hectare are found in central Europe and in some tropical countries.TrendsBased on data from the 147 countries that reported growing stock figures for all threereporting years, total growing stock shows a slight decreasing tendency at the globallevel (see Table 5.9 in Chapter 5). There are some regional tendencies: Africa, Asia andSouth America show a slight decrease, while Europe and North and Central Americashow a slight increase.As regards growing stock per hectare, changes at the global level are not significant.At regional and subregional levels, however, there are more significant changes. Forexample, Europe, excluding the Russian Federation, shows a net increase of 0.3 percent(or 1.2 m 3 per hectare) annually for the last 15-year period, while South and SoutheastAsia show a net decrease of 1.0 percent (or 1.0 m 3 per hectare) annually, mainly due to adecrease in growing stock per hectare in Indonesia.Changes in total growing stock reflect the combined effects of changes in forest areaand in growing stock per hectare. However, for many countries, changes in growingstock reflect only the changes in forest area, because their estimates of growing stockare based on a single figure per hectare determined at one point in time (see Chapter 5).Thus the actual trends may be more pronounced than those in this analysis.BIOMASS AND CARBONAt a casual glance, the amounts of biomass and carbon seem simply to reflect the extentof forests and their growing stock. A more meaningful understanding emerges in thecontext of the global carbon cycle, climate change and related international agreementssuch as the United Nations Framework Convention on Climate Change (UNFCCC).Since half the dry weight of biomass is carbon (IPCC, 2003), the following analysisaddresses biomass implicitly. For data related to biomass stock in forest and otherwooded land, refer to Table 13 in Annex 3.<strong>Forest</strong>s, like other ecosystems, are affected by climate change, be it a sea-level rise thatthreatens coastal forests or changes in temperature and rainfall patterns. In some places,impacts may be negative, while in others they may be positive. However, forests alsoinfluence climate and the climate change process. They absorb carbon in wood, leavesand soil and release it into the atmosphere when burned, for example during forest firesor the clearing of forest land.The Kyoto Protocol entered into force in the same year that this assessment wascarried out. The protocol and the UNFCCC oblige all member countries to regularly
32<strong>Global</strong> <strong>Forest</strong> <strong>Resources</strong> <strong>Assessment</strong> <strong>2005</strong>assess and report national greenhouse gas emissions, including emissions and removalsof carbon reflected as stock changes in forests. To that end, IPCC has created guidelines,methods and default values for all parameters needed to assess carbon stocks and theirchanges in forests (IPCC, 2003). It has thus furnished all countries with the meansof estimating and reporting carbon stocks, greenhouse gas emissions and removals,irrespective of the availability of country-specific data. Striving for synergies andfor streamlined country reporting to international organizations, <strong>FAO</strong> incorporatedthe IPCC guidelines on assessment of carbon stocks in forests into its guidelines forcountry reporting for FRA <strong>2005</strong>.Reporting on carbon stocks in forests under the UNFCCC, the Kyoto Protocoland to <strong>FAO</strong> may overlap, but are not necessarily identical. For FRA <strong>2005</strong>, countriesreported carbon stocks for the years 1990, 2000 and <strong>2005</strong>. The UNFCCC mandatesreporting carbon stock changes. However, in one of its methods, IPCC estimates netemissions of carbon as the difference between periodic carbon stocks.In a further difference, UNFCCC members report on ‘managed forests’ only. Theconvention does not define ‘forest’ or managed forest. However, IPCC considers managedforests as “all forests under direct human influence” or “forests subject to the process ofplanning and implementing practices for stewardship and use aimed at fulfilling relevantecological, economic and social functions” (IPCC, 2003). Given this broad definition,many countries may classify all their forests as managed forests. However, only byassuming both a steady state of biomass in ‘unmanaged forests’ and identical definitionsof ‘forest’ will carbon stock changes be the same under the two reporting systems. Evenin this case, estimates of the total carbon stock may still differ, depending on whether allforests are included or not in reporting under the UNFCCC.Quantifying the substantial roles of forests as carbon stores, as sources of carbonemissions and as carbon sinks has become one of the keys to understanding andmodifying the global carbon cycle. <strong>Global</strong> forest resources assessments have thepotential to contribute to or substantiate estimates of the magnitude of stocks and flowsby scientific bodies such as IPCC. Simultaneously, they complement and facilitateinternational reporting by countries on greenhouse gas emissions and removals underthe UNFCCC.Information availabilityBy integrating IPCC guidance into the guidelines for country reporting for FRA <strong>2005</strong>,<strong>FAO</strong> sought to facilitate complete reporting on biomass and carbon pools by allcountries. Yet many of the 229 countries and territories had difficulty in providingcomplete information for all pools of carbon, i.e. above- and below-ground biomass,dead wood, litter and soil carbon to a depth of 30 cm.With few exceptions, countries that reported growing stock also successfullytransformed this data into above- and below-ground biomass and then to carbon stockin forest biomass (Figure 2.11). Many countries based the conversion from growingstock to biomass on the IPCC good practice guidance factors (IPCC, 2003), reflectinga lack of country-specific biomass expansion factors.Of the 151 countries that reported on forest biomass:• 87 have used the IPCC good practice guidance biomass expansion factors exclusively;• 41 have used the IPCC factors in combination with factors from other sources;• 13 have used national data – either direct estimates or national expansion factors;• 5 have used factors/models from <strong>FAO</strong> and <strong>FAO</strong>/UNECE publications;• 5 are based on expert estimates.Response rates for carbon pools other than forest biomass decreased steeply, to merely20 percent of the countries, representing 51 percent of the total forest area for soil carbon.It is clear that many countries do not possess country-specific information on theparameters necessary for calculating all carbon pools. However, perhaps blanks in
Extent of forest resources 33FIGURE 2.11Information availability – carbon stock in forest biomassEastern and Southern AfricaNorthern AfricaWestern and Central AfricaEast AsiaSouth and Southeast AsiaWestern and Central AsiaEuropeCaribbeanCentral AmericaNorth AmericaOceaniaSouth AmericaWorld0 10 20 30 40 50 60 70 80 90 100Percentage of total forest areaInformation available for all years Information available for latest year Information not available for latest yearthe reporting tables also reflect political concerns, institutional and human capacityfor reporting, or difficulties with the IPCC guidelines. Response rates for carbon inbiomass were high from developing countries in all subregions except the Caribbean,while some large industrialized countries in North America and Oceania did not reportbiomass and carbon data at all or only incompletely, because they are currently in theprocess of finalizing their overall carbon inventories.Overall, this report assesses carbon in all pools based on a fairly representativefraction of over half the global forest area for all components and more than 80 percentof total forest area for carbon in forest biomass.Although countries were asked to provide information on carbon in forest soils inthe top 30 cm, some countries used other threshold values. In these cases, the figureswere adjusted to the common threshold of 30 cm.StatusCarbon stock per hectare. Table 2.8 provides forest-area-weighted average carbon stocks perhectare for biomass, dead wood, litter and soils by region for the year <strong>2005</strong>. Biomass anddead wood account for 44 and 6 percent of total forest ecosystem carbon respectively, whilesoils to a depth of 30 cm and litter contribute approximately 46 and 4 percent respectively.Carbon stocks in forest biomass reach the highest values per hectare in Central andSouth America and Western and Central Africa, while East Asia, Northern Africa andWestern and Central Asia report the lowest values.IPCC (2000) estimated an average carbon stock of 86 tonnes per hectare in thevegetation of the world’s forests for the mid-1990s. The corresponding carbon inbiomass and dead wood in forests reported here amounts to 82 tonnes per hectare forthe year 1990 and to 81 tonnes per hectare for the year <strong>2005</strong>.Each cubic metre of growing stock equals different amounts of biomass and carbonin biomass in the regions. Table 2.9 provides average conversion factors compiled fromcountry submissions. <strong>Global</strong>ly, each cubic metre of growing stock equals, on average,1 tonne of above-ground biomass, 1.3 tonnes of total biomass and 0.7 tonnes of carbonin biomass.
34<strong>Global</strong> <strong>Forest</strong> <strong>Resources</strong> <strong>Assessment</strong> <strong>2005</strong>TABLE 2.8Carbon stock per hectare <strong>2005</strong> (tonnes/ha)Region/subregion Carbon Carbon Carbon Carbon Totalin living in dead in litter in soil carbonbiomass woodEastern and Southern Africa 63.5 7.5 2.1 73.0Northern Africa 26.0 3.3 2.1 33.5 64.9Western and Central Africa 155.0 9.8 2.1 56.0 222.9Total Africa 95.8 7.6 2.1 55.3 160.8East Asia 37.0 5.0 41.9South and Southeast Asia 77.0 9.0 2.7 68.4 157.1Western and Central Asia 39.7 3.6 11.4 41.0 95.8Total Asia 57.0 6.9 2.9 66.1 132.9Total Europe 43.9 14.0 6.1 112.9 176.9Caribbean 99.7 8.8 2.2 70.5 181.2Central America 119.4 14.4 2.1 43.3 179.2North America 57.8 8.8 15.4 35.8 117.8Total North and Central America 60.1 9.0 14.8 36.6 120.6Total Oceania 55.0 7.4 9.5 101.2 173.1Total South America 110.0 9.2 4.2 71.1 194.6World 71.5 9.7 6.3 73.5 161.1TABLE 2.9Average factors for estimating biomass and carbon from growing stockRegion/subregion1 m³ of growing stock represents:Tonnes of above-ground Tonnes of total Tonnes of carbonbiomass biomass in biomassEastern and Southern Africa 2.3 2.9 1.4Northern Africa 2.1 2.7 1.4Western and Central Africa 1.3 1.7 0.8Total Africa 1.5 1.9 0.9East Asia 0.7 0.9 0.5South and Southeast Asia 1.4 1.8 0.9Western and Central Asia 0.9 1.1 0.5Total Asia 1.1 1.4 0.7Total Europe 0.7 0.8 0.4Caribbean 2.0 2.6 1.2Central America 1.4 1.8 0.9North America 1.0 1.1 0.5Total North and Central America 1.0 1.2 0.5Total Oceania 1.4 2.0 1.0Total South America 1.1 1.5 0.7World 1.0 1.3 0.7Note: soil carbon to 30 cm depth.Total carbon stock. As a consequence of missing data, it is not possible to sumcountry data to obtain complete regional or global totals for carbon in any pool. Yet, inthe context of climate change, these totals and their changes over the years are beyondmere academic interest. Figure 2.12 shows estimated total carbon stock for all poolsby region. The figures were obtained by expanding reported data through the use ofsubregional estimates of carbon per hectare of forest, multiplied by the total forest areafor each subregion.The country reports indicate that global forest vegetation stores 283 Gt of carbon inits biomass, and an additional 38 Gt in dead wood, for a total of 321 Gt. A prior estimate
Extent of forest resources 35FIGURE 2.12Total carbon stock (C) in forests by region <strong>2005</strong>(Gt)AfricaAsiaEuropeNorth and Central AmericaOceaniaSouth America0 20 40 60 80 100 120 140 160 180 200C in biomass C in dead wood C in litter C in soilby IPCC (2000) assumed 359 Gt of carbon in these pools. An assumed amount inFRA <strong>2005</strong> of only 10 tonnes per hectare of carbon in dead wood, on average, probablyrepresents an underestimate and might be one reason for the discrepancy between theIPCC and country reports. Another may be exclusion of the biomass of undergrowthby some countries.Soils (down to 30 cm) and litter contain 317 Gt of carbon according to countryestimates in this assessment. There are large data gaps for major boreal forests withtypically large amounts of soil carbon; thus the figures are likely underestimates.The total carbon content of forest ecosystems for the year <strong>2005</strong> is, therefore, 638 Gtof carbon, which is more than the amount of carbon in the entire atmosphere. Roughlyhalf of total carbon is found in forest biomass and dead wood combined, and half insoils and litter combined.TrendsFrom 1990 to <strong>2005</strong>, carbon in biomass decreased in Africa, Asia and South America,remained approximately constant in Oceania and increased in Europe and in North andCentral America. Not all subregions followed this trend. Thus total biomass carbonstocks increased in East Asia and in Western and Central Asia, and decreased in CentralAmerica (Table 2.10). The decrease in overall biomass carbon stocks since 1990 wasdriven by South and Southeast Asia (33 percent decrease), Western and Central Africa(7 percent) and South America (6 percent).If an average change of total biomass carbon stocks of at least 0.5 percent per yearis defined as significant, then of a total of 146 countries and territories, 42 reporteddecreases, 55 increases and 49 reported no significant change in total carbon stockswithin forest biomass.In interpreting the reliability and meaning of these results, it is helpful to examinecarbon stocks per hectare concurrently. Based on the same significance level, 99 countriesreported no substantial change of carbon stock per hectare for the 1990–<strong>2005</strong> period,11 countries reported a decrease and 36 countries an increase.
36<strong>Global</strong> <strong>Forest</strong> <strong>Resources</strong> <strong>Assessment</strong> <strong>2005</strong>TABLE 2.10Trends in carbon stocks in forest biomass 1990–<strong>2005</strong>Region/subregionCarbon in living biomass(Gt)1990 2000 <strong>2005</strong>Eastern and Southern Africa 15.9 14.8 14.4Northern Africa 3.8 3.5 3.4Western and Central Africa 46.0 43.9 43.1Total Africa 65.8 62.2 60.8East Asia 7.2 8.4 9.1South and Southeast Asia 32.3 25.5 21.8Western and Central Asia 1.6 1.7 1.7Total Asia 41.1 35.6 32.6Total Europe 42.0 43.1 43.9Caribbean 0.4 0.5 0.6Central America 3.4 2.9 2.7North America 37.2 38.5 39.2Total North and Central America 41.0 41.9 42.4Total Oceania 11.6 11.4 11.4Total South America 97.7 94.2 91.5World 299.2 288.6 282.7Of the 42 countries communicating significant declines in total carbon stocks inforest biomass, only 17 percent also described lower levels of carbon stocks per hectare.In contrast, 78 percent – overwhelmingly developing countries – presumed virtuallyidentical carbon stocks per hectare at the beginning and end of the 15-year period. Inthese countries, therefore, a reduction in total carbon stock in forest biomass reflects anet loss of forest area. Of the 20 countries reporting the highest absolute reduction incarbon stock, 15 did not report decreases in carbon stock per hectare. Essentially all thecarbon stock reduction, therefore, is due to a net loss of forest area. Of the two countrieswith the highest decrease in carbon stocks, Brazil and Indonesia, only Indonesiarecorded a significantly lower level of carbon per hectare in <strong>2005</strong>, indicating that notonly the forest area but also the biomass and carbon stock per hectare had decreased.In contrast, of all countries reporting significant total carbon stock increases (mainlyChile, China, many European countries, India, Japan and the United States), 67 percentalso documented substantially higher levels of carbon stock per hectare, indicating ahigher likelihood that stocks were actually assessed more than once. For 25 percent ofthese countries, carbon stocks per hectare remained essentially the same, pointing to anincrease in forest area as the main reason for increased total stocks.
37Chapter 3Biological diversityOVERVIEW‘Biological diversity’ encompasses the variety of existing life forms, the ecological rolesthey perform and the genetic diversity they contain (<strong>FAO</strong>, 1989). In forests, biologicaldiversity allows species to adapt continuously to dynamically evolving environmentalconditions, to maintain the potential for tree breeding and improvement (to meet humanneeds for goods and services and changing end-use requirements), and to support theirecosystem functions.While timber production often dominated the way in which forests were managed inthe twentieth century, new pressures in the twenty-first century drive a more balancedapproach, calling for delivery of multiple goods and services. The process towardssustainable forest management is now considered consistent with the conservation ofbiological diversity.Assessing, monitoring and reporting on biological diversity are important activitiesaimed at guiding sustainable forest management. Monitoring of biological diversity andof the changes caused by forestry practices is important in assessing the effectiveness ofmanagement and the cumulative changes brought about by forest use. However, thereare conceptual and practical difficulties in doing so. These are not unique to biologicaldiversity per se, but are general inventory problems related to target parameters that arecomplex and highly variable.The values derived from biological diversity are associated with different scales thatrequire different assessment methodologies. These include ecosystems, landscapes,species, populations, individuals and genes. Varying and complex interactions existamong all these levels.Because biological diversity encompasses the complexity of all life forms, assessmentand monitoring are only possible for specific aspects or particular, defined goals. Thereis no single, objective measure of biological diversity, only proxy measures appropriatefor specified and, by necessity, restricted purposes. Species richness, for example, has avery wide natural variation from boreal to tropical forests. For policy and monitoringpurposes, it is the change in biodiversity that is important, which implies identifyinga few relevant indicators and then monitoring them over time. So far this has notbeen achieved for forest ecosystems on a wide scale (i.e. national or continental), butFRA <strong>2005</strong> has attempted to establish a baseline for forest ecosystems worldwide, and toprovide input into wider biodiversity monitoring work.Most local forest inventories are conducted to estimate harvestable volumes of woodand sometimes non-wood forest products, rather than to monitor biological diversity.An immediate need exists to categorize and substantially improve the understanding ofbiological diversity with a view to measuring trends, particularly on regional scales. Inthis respect, the work carried out in the framework of criteria and indicators processes,which all address biological diversity, is an important contribution.The variables measured in FRA <strong>2005</strong> with relevance to forest biological diversityinclude:• area of primary forests;• forest area designated for conservation of biodiversity;• composition of forests;• number of native tree species;• threatened forest tree species.
38<strong>Global</strong> <strong>Forest</strong> <strong>Resources</strong> <strong>Assessment</strong> <strong>2005</strong>These variables include measures both of policy response (e.g. areas designated forconservation of biodiversity) and of outcome (e.g. number of threatened species). Bothare needed, but the fundamental difference between these two concepts should be bornein mind.In recent years, the <strong>Global</strong> <strong>Forest</strong> <strong>Resources</strong> <strong>Assessment</strong>s have increased their focus onforest biodiversity. FRA <strong>2005</strong> gathered and compiled relevant information at landscape andspecies levels, while addressing some structural and compositional aspects. At the ecosystemlevel, FRA <strong>2005</strong> provides information on the area of forests and – more specifically – onthe area of primary and other forests managed for the conservation of biological diversity(including protected areas), thus complementing FRA 2000 data on the proportion offorests in protected areas. At the species level, FRA 2000 highlighted the global lack ofestimates of the number of tree species by country, with the exception of endangeredtree species. FRA <strong>2005</strong> thus focused on assessment of the number of both native andendangered forest tree species at the country level. In addition, country reports includedlists of the ten most common tree species (measured by their share of total growing stock),thus providing important information on the tree species composition of forests.Many countries lack the capacity to report on biological diversity. In particular,there is generally less knowledge with respect to biological diversity in tropical forestscompared with the other biomes. In FRA <strong>2005</strong>, countries were better able to report onthe area of primary forest, on forest area designated for the conservation of biodiversityand on threatened tree species than on the other variables reported in this chapter(Figure 3.1). However, these data alone are insufficient to provide a reliable picture ofbroader trends in forest biological diversity.KEY FINDINGSAlthough a large number of countries have reported on the characteristics of their forests,information on the area of primary forest is not readily available. Proxy values have oftenbeen used, including the area of natural forest over a certain age or the area of forest withprotected area status. This makes a detailed analysis of status and trends difficult. TheFIGURE 3.1Information availability – biological diversityArea of primary forest168 6 55Area designated primarily forconservation of biodiversity163 9 57Total area designated forconservation of biodiversity79 5145Composition of growing stock70 12147Number of native foresttree species133 97Threatened forest tree species192 370 10 20 30 40 50 60 70 80 90 100Percentage of total forest areaInformation available for all years Information available for latest year Information not available for latest yearNote: Figures present number of countries in each category.
Biological diversity 39results suggest, however, that the total area of primary forests exceeds 1.3 billion hectaresor 36 percent of all forests, and that the ten countries with the largest area of primaryforest account for 88.2 percent of the total area of primary forest in the world.Information was unavailable for many of the countries in the Congo Basin, thesecond largest expanse of tropical forest, which should be kept in mind when analysingthe findings.Great variation exists in terms of the distribution of primary forest, with limitedareas reported from the Caribbean, Eastern and Southern Africa, Europe (not includingthe Russian Federation), North Africa and the arid zones of Western and Central Asia.The largest expanse of primary forest is found in South America (the Amazon Basin).Countries in North and Central America and the Russian Federation have also classifieda relatively high proportion of their forests as primary.The estimated annual net decrease in primary forests of 6 million hectares isalarmingly high. This decrease reflects not only a complete loss of these forests, but alsochanges within the forest, for instance when primary forests move into the category ofmodified natural forests due to selective logging. Some countries, notably in Europe andJapan, are reporting an increase in their areas of primary forests, because natural forestshave been set aside as ‘no intervention’ areas.In <strong>2005</strong>, globally, more than 400 million hectares of forests, or 11 percent of totalforest area, were designated for the conservation of biological diversity as the primaryfunction. The area of forest devoted to conservation of biodiversity has increased by atleast 96 million hectares, or 32 percent, since 1990. This increasing trend is evident in allregions and subregions except Northern, Eastern and Southern Africa.Information on the total area of forest that has conservation of biological diversitydesignated as one of the functions and management objectives is of considerableinterest to the forest conservation community, but information was lacking from manycountries. To improve the potential value of this variable, it would be worth refiningand simplifying its estimation. This might improve the level of reporting, which wasespecially low in Africa and Oceania.<strong>Forest</strong> composition is a valuable indicator of biological diversity. Although a significantnumber of countries reported on the composition of their forests in terms of growing stock,information was unavailable for many countries, which makes a detailed analysis of thevalue of the indicator difficult.There is also great variation in terms of forest tree species diversity, from limitednumbers of individual species in boreal ecosystems to high species richness per areaunit in Central and South America, South and Southeast Asia, and Western and CentralAfrica. Boreal forests tend to harbour the lowest species diversity. On average, the tenmost common tree species in a country account for 76 percent of total growing stock.The exceptions by region are found in Central America, South and Southeast Asia andWestern and Central Africa, where percentages range from 22 to 47 percent. In Europeand Western and Central Asia, the ten most common tree species account for more than90 percent of total growing stock.Information was missing from many countries in South America (including Brazil)and from most of the countries in the Congo Basin, both areas of known high speciesdiversity.The combined list of the ten most common tree species from all countries contained445 different species. Five genera (Pinus, Quercus, Picea, Abies and Fagus) make upalmost one-third of the number of species reported as being most common. This maybe influenced by the fact that Asia and Europe are over-represented, in terms of thenumber of countries that reported on this topic, relative to their total forest area. Nochange in the relative importance of different species was found between 1990 and 2000;nor were major changes noticed in the share of growing stock occupied by the threemost common species.
40<strong>Global</strong> <strong>Forest</strong> <strong>Resources</strong> <strong>Assessment</strong> <strong>2005</strong>In terms of the status of native tree species, South America displays a higher numberof threatened tree species than other regions, with the lowest number being found inEurope. Countries in South and Southeast Asia also report a significantly higher numberof endangered and critically endangered species. Forty-five countries report that theyhave no threatened tree species.The overall high response rate on threatened species reflects the availability of theglobal IUCN 2000 red list of threatened species (IUCN, 2000) – although 53 countriesand areas reported discrepancies with this list. It also demonstrates a clear perceptionthat significant numbers of forest tree species are threatened.On average, 5 percent of the tree species native to a country are either vulnerable,endangered or critically endangered.In conclusion, FRA <strong>2005</strong> data confirm that forest biodiversity conservation concerns haveencouraged significant policy responses and, in particular, the setting aside of increasing areasof forest for conservation purposes. FRA <strong>2005</strong> has established a tentative baseline for furthermonitoring work at landscape and species levels. The monitoring of a few selected outcomeindicators, to be determined, should in the future help in reviewing the effectiveness, at thecountry level, of the implementation of policy decisions on biodiversity conservation.PRIMARY FORESTSInformation on total forest area, forest characteristics and overall changes in both overtime was presented in Chapter 2, Extent of forest resources. The present chapter focuseson primary forests, which are defined in FRA <strong>2005</strong> as forests of native species, in whichthere are no clearly visible indications of human activity and ecological processes arenot significantly disturbed.Primary forests are often equated with high levels of biodiversity, but this is notalways the case. In the temperate and boreal zones, for example, they can be poor interms of number of plant and animal species, while some modified natural or seminaturalforests and forests bordering agricultural areas may provide additional habitatsand thus harbour more species. Nevertheless, the size of the area of primary forest is oneof several important indicators of the state of forest ecosystems.It should also be kept in mind that primary forests fulfil many essential functionsother than the conservation of biological diversity: soil and water conservation, carbonsequestration and the preservation of aesthetic, cultural and religious values.Information availabilityThe 174 countries reporting on area of primary forest account for 93.1 percent of totalforest area. Information is missing, unfortunately, from many of the smaller islandsand territories and from many of the countries in the Congo Basin, the second largestexpanse of tropical forest (Figure 3.2).Of the reporting countries, only 96 reported that they had any primary forest leftin <strong>2005</strong>. Several others reported that they had insufficient information on the area ofprimary forests. Few of those who did include an estimate had exact information. Manyused the current area of forests in national parks and other protected areas as a proxyvalue or provided an expert estimate of the percentage of natural forests that could beconsidered primary according to the FRA <strong>2005</strong> definition.These shortcomings should be kept in mind when referring to the findings below.StatusInformation on the current and past extent of primary forest in each of the countriesreporting on this variable can be found in Table 9 in Annex 3. A regional summaryfollows.An estimated 1.3 billion hectares of forest – or 36.4 percent of the combined forestarea of the reporting countries – are considered primary forest (Table 3.1).
Biological diversity 41FIGURE 3.2Information availability – area of primary forestEastern and Southern AfricaNorthern AfricaWestern and Central AfricaEast AsiaSouth and Southeast AsiaWestern and Central AsiaEuropeCaribbeanCentral AmericaNorth AmericaOceaniaSouth AmericaWorld0 10 20 30 40 50 60 70 80 90 100Percentage of total forest areaInformation available for all years Information available for latest year Information not available for latest yearTABLE 3.1Area of primary forest <strong>2005</strong>Region/subregion Information availability Area of primary Primary forest as %forest of total forest areaCountries <strong>Forest</strong> area % of total (1 000 ha)reporting (1 000 ha)forest area Average RangeEastern and Southern Africa 18 214 589 94.7 12 241 5.7 0-81Northern Africa 12 117 193 89.4 13 919 11.9 0-20Western and Central Africa 17 99 566 35.8 11 510 11.6 0-45Total Africa 47 431 347 67.9 37 669 8.7 0-81East Asia 5 244 862 100.0 21 808 8.9 6-46South and Southeast Asia 17 283 126 100.0 62 908 22.2 1-100Western and Central Asia 23 43 579 100.0 2 810 6.4 0-72Total Asia 45 571 567 100.0 87 526 15.3 0-72Total Europe 36 983 907 98.3 263 948 26.8 0-32Caribbean 12 4 090 68.5 60 1.5 6-59Central America 7 22 411 100.0 9 139 40.8 2-70North America 4 677 464 100.0 302 456 44.6 34-53Total North and Central America 23 703 965 99.7 311 656 44.3 2-70Total Oceania 11 203 455 98.6 35 275 n.s. n.s.-89Total South America 12 783 827 94.3 601 689 76.8 10-96World 174 3 678 069 93.1 1 337 763 36.4 0-100Forty-five percent of the total area of primary forest reported is found inSouth America, followed by North and Central America (23.3 percent) and Europe(19.7 percent – almost all of it in the Russian Federation).The ten countries with the largest area of primary forest account for 89.1 percent ofthe total area of primary forest in the world (Figure 3.3).Twenty countries report that their primary forest is at least 50 percent of their totalforest area, and ten countries have classified more than 80 percent of their forests asprimary (Table 3.2).
42<strong>Global</strong> <strong>Forest</strong> <strong>Resources</strong> <strong>Assessment</strong> <strong>2005</strong>FIGURE 3.3Ten countries with largest area of primary forest <strong>2005</strong>(%)Brazil 31Russian Federation 19Canada 12United States 8Peru 5Colombia 4Indonesia 4Mexico 3Bolivia 2Papua New Guinea 2Remaining countries 11TABLE 3.2Ten countries with highest percentage of primary forest <strong>2005</strong>CountryPrimary forest as % oftotal forestBrunei Darussalam 100Singapore 100French Guiana 96Suriname 96Fiji 89Peru 89Colombia 87Brazil 87Papua New Guinea 86Madagascar 81Of the reporting countries and areas, 28 countries, mostly in Europe and in the aridzones of Africa and Western Asia, reported that they have no primary forests left, and50 provided no information on the area of primary forest. In some cases, this may bedue to lack of data rather than complete lack of primary forest.TrendsA trend analysis was generated based on those countries reporting for <strong>2005</strong>, includingthose reporting that they had no primary forest. For eight countries for whichinformation was missing for 1990 (Australia, Bosnia and Herzegovina, Burundi, Estonia,Guyana, Latvia, Lebanon and Samoa), <strong>FAO</strong> employed a linear extrapolation based onthe estimates for <strong>2005</strong> and 2000. While the proportion of total forest classified as primaryhas remained fairly constant since 1990, indications are that primary forests were lost atan average rate of 6 million hectares per year over the last 15 years and that the rate ofloss is slowing down in some regions, but is increasing in South America.This estimated net loss excluded the Russian Federation, where a large difference inthe change rate (from -1.6 million hectares per year in the 1990s to +0.5 million hectaresper year in the last five years) is likely due to a modification in the methodology usedrather than to actual changes.Brazil and Indonesia alone accounted for an annual loss of primary forest of 4.9 millionhectares during the period 2000–<strong>2005</strong>. The data received do not allow for an analysis ofhow large a proportion of this net loss is due to deforestation and conversion to other
Biological diversity 43uses and how much is due to the opening up of primary forests to selective logging andother human activities or to severe natural disasters, which could lead to some forestsbeing classified as ‘modified natural forests’.A number of countries registered positive change rates in the area of primary forests(see Table 9 in Annex 3), including several western European countries and Japan. Inmost of these cases, the countries have been setting aside natural forest areas in which nointervention should take place. With time, these areas evolve into forests in which there areno clearly visible indications of human activity and ecological processes are not significantlydisturbed, meeting the definition of primary forests used in FRA <strong>2005</strong>. For example, Japanand some of the European countries classified all natural forests over a certain age or size asprimary forests if no interventions had been conducted over the last 25 years.FOREST AREA DESIGNATED FOR CONSERVATION OF BIODIVERSITYThe setting aside and management of land as protected areas is a key part of ongoingglobal efforts to conserve biological diversity. The amount of land set aside forconservation is an important indicator of progress, and the monitoring of this variableprovides valuable information to conservation practitioners. The data on protected areasthat were gathered, analysed and presented in FRA 1990 and 2000 are complemented bythe data on area of forest designated for conservation in FRA <strong>2005</strong>.The primary global source of data is the World Database on Protected Areas(WDPA), which is managed by the World Conservation Monitoring Centre (WCMC)of the United Nations Environment Programme (UNEP) and funded by the WDPAConsortium. The WDPA and the analysis of the data it contains are useful inunderstanding global trends in protected areas.FRA 1990 (<strong>FAO</strong>, 1993) presented data in a table entitled Distribution of protectedareas. It documented the number of protected areas and the total area under protectionin developing countries in Africa, Asia and Latin America and in developed countries inAsia, Europe, the former Union of Soviet Socialist Republics (USSR), North Americaand Oceania.FRA 2000 (<strong>FAO</strong>, 2001b) presented regional and global data on forests in protectedareas and on the proportion of forest in protected areas in tropical, subtropical, temperateand boreal zones. The estimate in FRA 2000 that 12.4 percent of total forest area was inprotected areas was of obvious interest. The relatively low proportion of boreal forestin protected areas was also significant. These findings should be compared with thecontemporary World Wide Fund for Nature (WWF)/IUCN goal of establishing anecologically representative network of protected areas covering at least 10 percent of theworld’s forest area by the year 2000 (WWF and IUCN, 1998).For FRA <strong>2005</strong>, information was requested from countries and areas on two measuresof the area designated for conservation of biodiversity:• forest area designated primarily for conservation of biodiversity;• total forest area designated for conservation of biodiversity.Areas designated for conservation of biodiversity, whether as the primary or asubsidiary function, include areas outside protected areas. At the same time, some forestsin protected areas may be designated for the conservation of soil and water resourcesor a cultural heritage. So the estimated area of forest designated for conservation ofbiodiversity is not necessarily equivalent to the area of forest in protected areas.Information availabilityFor FRA <strong>2005</strong>, Figures 3.4 and 3.5 show that there was a striking difference in all regionsin the percentage of countries or areas that provided information on the two measuresof the area of forest designated for conservation of biological diversity.A plausible explanation for the large difference in response rates is that the calculationof the total area designated for conservation is rather complex and different methodologies
44<strong>Global</strong> <strong>Forest</strong> <strong>Resources</strong> <strong>Assessment</strong> <strong>2005</strong>FIGURE 3.4Information availability – area of forest designated primarily for conservation of biodiversityEastern and Southern AfricaNorthern AfricaWestern and Central AfricaEast AsiaSouth and Southeast AsiaWestern and Central AsiaEuropeCaribbeanCentral AmericaNorth AmericaOceaniaSouth AmericaWorld0 10 20 30 40 50 60 70 80 90 100Percentage of total forest areaInformation available for all years Information available for latest year Information not available for latest yearFIGURE 3.5Information availability – total area of forest designated for conservation of biodiversityEastern and Southern AfricaNorthern AfricaWestern and Central AfricaEast AsiaSouth and Southeast AsiaWestern and Central AsiaEuropeCaribbeanCentral AmericaNorth AmericaOceaniaSouth AmericaWorld0 10 20 30 40 50 60 70 80 90 100Percentage of total forest areaInformation available for all years Information available for latest year Information not available for latest yearare used at the national level. In Africa, eight forest-rich countries, accounting for62 percent of the continent’s total forest cover, did not report on this measure. As a result,the estimate of the total area designated for conservation was less than half that of the areawith conservation as the primary function, which is an anomalous result.In South America, on the other hand, although only three out of 15 countries andareas reported on this measure, they account for 69 percent of the continent’s total forest
Biological diversity 45area. The estimate of the total area designated for conservation was nearly three timesthe area having conservation as the primary function, which is consistent with whatwould logically be expected.StatusThe data provided by countries on forest area designated primarily for biodiversityconservation show that, globally, more than 400 million hectares of forest – or11.2 percent of total forest area of the reporting countries – are designated as havingconservation of biodiversity as their primary function (Table 3.3).The biggest area of forest designated for conservation of biodiversity is found inSouth America, followed by North America, while Central America and Western andCentral Africa have the highest percentage of their forests designated primarily forconservation. Europe and Western and Central Asia have the lowest percentage offorests designated primarily for conservation.Although the percentage of forest designated primarily for conservation is not exactlyequal to the percentage of forest in protected areas, many countries used the area offorests in protected areas as a proxy value. It is thus not surprising to find that the globalfigure for this measure, 11.2 percent, is not significantly different from the estimate inFRA 2000 of the percentage of forest in protected areas, which was 12.4 percent.The total area of forest designated for conservation is an interesting measure (Table 3.4)because it gives an indication of the area in which conservation is a consideration in landmanagement, without necessarily being the priority, as might often be the case outsideprotected areas. It is logical to expect that this area will be larger than the area in whichconservation is the primary function.A comparison of Tables 3.3 and 3.4 confirms the expectation that the area designatedfor conservation would be larger than the area with conservation designated as theprimary function. This comparison must be treated with caution, however, owing to thelow response rates in Africa, Europe and Oceania for this variable.TrendsFor FRA <strong>2005</strong>, countries were asked to make retrospective estimates for 1990 and 2000for the two measures of forest area designated for conservation.TABLE 3.3Area of forest designated primarily for conservation of biodiversity <strong>2005</strong>Region/subregion Information availability Area designatedprimarily for conservationCountries <strong>Forest</strong> area % of totalreporting (1 000 ha)forest area 1 000 ha % of forest areaEastern and Southern Africa 16 211 181 93.2 20 158 9.5Northern Africa 13 125 667 95.9 13 036 10.4Western and Central Africa 15 118 280 42.6 41 390 35.0Total Africa 44 455 129 71.6 74 585 16.4East Asia 5 244 862 100.0 11 479 4.7South and Southeast Asia 17 283 126 100.0 57 290 20.2Western and Central Asia 23 43 579 100.0 2 772 6.4Total Asia 45 571 567 100.0 71 541 12.5Total Europe 36 991 192 99.0 37 776 3.8Caribbean 9 3 489 58.4 704 20.2Central America 7 22 411 100.0 8 482 37.8North America 4 677 464 100.0 79 741 11.8Total North and Central America 20 703 364 99.6 88 927 12.6Total Oceania 14 203 467 98.6 29 366 14.4Total South America 13 831 540 100.0 119 742 14.4World 172 3 756 260 95.0 421 936 11.2
46<strong>Global</strong> <strong>Forest</strong> <strong>Resources</strong> <strong>Assessment</strong> <strong>2005</strong>TABLE 3.4Total area of forest designated for conservation of biodiversity <strong>2005</strong>Region/subregion Information availability Total area designatedfor conservationCountries <strong>Forest</strong> area % of totalreporting (1 000 ha)forest area 1 000 ha % of forest areaEastern and Southern Africa 3 42 529 18.8 10 272 24.2Northern Africa 3 3 876 3.0 1 380 35.6Western and Central Africa 6 71 350 25.7 27 150 38.1Total Africa 12 117 754 18.5 38 802 33.0East Asia 5 244 862 100.0 119 078 48.6South and Southeast Asia 17 283 126 100.0 147 298 52.0Western and Central Asia 12 17 507 40.2 8 580 49.0Total Asia 34 545 495 95.4 274 955 50.4Total Europe 22 133 854 13.4 88 219 65.9Caribbean 3 524 8.8 130 24.9Central America 1 4 294 19.2 2 827 65.8North America 2 310 137 45.8 310 135 100.0Total North and Central America 6 314 955 44.6 313 092 99.4Total Oceania 7 10 235 5.0 8 719 85.2Total South America 3 544 501 65.5 318 335 58.5World 84 1 666 795 42.2 1 042 122 62.5TABLE 3.5Trends in area of forest designated primarily for conservation of biodiversity 1990–<strong>2005</strong>Region/subregion Information availability (all 3 years) Area of forest designated Annual change rate(1 000 ha) (%)Countries <strong>Forest</strong> area % of totalreporting (1 000 ha)forest area 1990 2000 <strong>2005</strong> 1990–2000 2000–<strong>2005</strong>Eastern and Southern Africa 15 198 343 87.6 15 294 15 165 15 101 -0.08 -0.08Northern Africa 13 125 667 95.9 14 441 13 515 13 036 -0.66 -0.72Western and Central Africa 15 118 280 42.6 37 068 37 232 41 390 0.04 2.14Total Africa 43 442 291 69.6 66 803 65 912 69 528 -0.13 1.07East Asia 5 244 862 100.0 10 338 10 847 11 479 0.48 1.14South and Southeast Asia 17 283 126 100.0 46 725 52 540 57 290 1.18 1.75Western and Central Asia 21 43 272 99.3 1 744 2 126 2 761 2.00 5.37Total Asia 43 571 259 99.9 58 807 65 513 71 531 1.09 1.77Total Europe 34 984 468 98.3 18 402 33 877 36 760 6.29 1.65Caribbean 9 3 489 58.4 622 675 704 0.83 0.83Central America 7 22 411 100.0 7 873 8 660 8 482 0.96 -0.42North America 4 677 464 100.0 69 745 70 384 79 741 0.09 2.53Total North and Central America 20 703 364 99.6 78 240 79 720 88 927 0.19 2.21Total Oceania 11 39 593 19.2 6 709 7 968 7 948 1.73 -0.05Total South America 12 816 436 98.2 69 463 108 103 119 591 4.52 2.04World 163 3 557 412 90.0 298 424 361 092 394 283 1.92 1.77Note: As some countries did not report a complete series, figures for <strong>2005</strong> are slightly different from those presented in Table 3.3.The estimates provided for the percentage of forest area designated primarily forconservation are summarized in Table 3.5. The figures in this table suggest that the area offorest devoted to biodiversity conservation has increased by at least 96 million hectares, or32 percent, since 1990. This increasing trend is evident in all regions and subregions exceptNorthern, Eastern and Southern Africa.According to the 2003 United Nations list of protected areas (Chape et al., 2003),which deals with all ecosystems, the area of land within protected areas grew by53 percent from 1992 to 2003. The difference between this figure and the finding ofFRA <strong>2005</strong> may be due to larger rates of increase in ecosystems other than forests.
Biological diversity 47TABLE 3.6Trends in total area of forest designated for conservation of biodiversity 1990–<strong>2005</strong>Region/subregion Information availability (all 3 years) Area of forest designated Annual change rate(1 000 ha) (%)Countries <strong>Forest</strong> area % of totalreporting (1 000 ha)forest area 1990 2000 <strong>2005</strong> 1990–2000 2000–<strong>2005</strong>Eastern and Southern Africa 3 42 529 18.8 10 273 10 273 10 272 0 n.s.Northern Africa 2 2 322 1.8 863 1 179 1 276 3.17 1.59Western and Central Africa 6 71 350 25.7 23 628 24 005 27 150 0.16 2.49Total Africa 11 116 200 18.3 34 764 35 457 38 698 0.20 1.76East Asia 5 244 862 100.0 81 185 105 727 119 078 2.68 2.41South and Southeast Asia 17 283 126 100.0 130 606 148 547 147 298 1.30 -0.17Western and Central Asia 11 17 371 39.9 8 186 8 138 8 576 -0.06 1.06Total Asia 33 545 358 95.4 219 978 262 411 274 952 1.78 0.94Total Europe 21 133 187 13.3 78 529 89 304 88 010 1.29 -0.29Caribbean 3 524 8.8 138 130 130 -0.60 0Central America 1 4 294 19.2 2 754 2 857 2 827 0.37 -0.21North America 2 310 137 45.8 310 137 310 137 310 135 0 n.s.Total North and Central America 6 314 955 44.6 313 029 313 124 313 092 n.s. n.s.Total Oceania 6 10 064 4.9 8 024 8 561 8 644 0.65 0.19Total South America 2 485 761 58.4 137 695 180 623 259 595 2.75 7.52World 79 1 605 526 40.6 792 018 889 481 982 990 1.17 2.02Note: As some countries did not report a complete series, figures for <strong>2005</strong> are slightly different from those presented in Table 3.4.The trends in the total area designated for conservation are summarized in Table 3.6.There was an estimated 24 percent increase in the world figure for total forest areadesignated for conservation between 1990 and <strong>2005</strong>. However, the reliability of theestimate is reduced by the small areas reported for Africa, Europe and Oceania.COMPOSITION OF FORESTSInformation on growing stock composition offers a proxy indicator that aids betterunderstanding and monitoring of the dynamics of the relative abundance of forest treespecies. The ten most common species in terms of growing stock have been listed andtheir contribution to total growing stock documented for 1990 and 2000. FRA <strong>2005</strong>attempts to estimate the rate of change of forest tree composition among the ten mostabundant species, and to assess whether such information may be useful in documentingthe factors implicated in these changes at the global level.Information availabilityInformation on the species represented in growing stock is poor: only 82 countries andareas, accounting for 60 percent of total forest area, provided quantitative informationon the ten most common species. Regions or subregions with the highest response rateswere Asia, Europe and North America (Figure 3.6).StatusTable 3.7 shows the percentage of growing stock of the three and the ten most commontree species.The relative importance of growing stock of a species depends on many environmentaland silvicultural factors. In natural and semi-natural forests, the percentage of growingstock represented by a given number of tree species is expected to be inversely correlatedto tree species richness (and the number of tree species present in the area). Figure 3.7shows that the percentage of growing stock occupied by the three most common treespecies (native or introduced) is a reasonable predictor of the growing stock occupiedby the ten most common (native or introduced) species at the country level.
48<strong>Global</strong> <strong>Forest</strong> <strong>Resources</strong> <strong>Assessment</strong> <strong>2005</strong>FIGURE 3.6Information availability – composition of growing stockEastern and Southern AfricaNorthern AfricaWestern and Central AfricaEast AsiaSouth and Southeast AsiaWestern and Central AsiaEuropeCaribbeanCentral AmericaNorth AmericaOceaniaSouth AmericaWorld0 10 20 30 40 50 60 70 80 90 100Percentage of total forest areaInformation available for all years Information available for latest year Information not available for latest yearTABLE 3.7Percentage of growing stock occupied by the most common tree species 2000Region/subregion Information Three most common Ten most commonavailability tree species tree speciesCountries <strong>Forest</strong> % total Aver. % Min. % Max. % Aver. % Min. % Max. %reporting area forest growing growing growing growing growing growing(1 000 ha)area stock stock stock stock stockstockEastern and Southern Africa 6 40 294 17.1 54 12 100 69 23 100Northern Africa 5 77 981 57.4 64 23 88 76 31 100Western and Central Africa 5 40 129 14.1 24 10 44 43 18 71Total Africa 16 158 404 24.2 48 10 100 63 18 100East Asia 4 218 842 97.0 57 29 93 79 64 100South and Southeast Asia 10 266 914 89.8 31 7 67 47 19 87Western and Central Asia 11 39 062 89.7 77 60 94 94 80 99Total Asia 25 524 818 92.6 55 7 93 73 19 100Total Europe 30 979210 98.1 70 34 93 92 65 100Caribbean 2 238 4.2 36 33 39 69 63 76Central America 1 4 307 18.1 10 10 10 22 22 22North America 2 612 428 90.3 29 25 33 59 48 70Total North and Central America 5 616 973 87.2 28 10 39 56 22 76Total Oceania 2 44 0.0 41 38 44 77 72 81Total South America 4 117 758 13.8 37 28 50 60 48 79World 82 2 397 208 60.1 56 7 100 76 18 100Great variation exists in terms of species diversity, with limited numbers ofindividual species and high species richness per area unit in Central and South America,South and Southeast Asia and Western and Central Africa. Boreal forests of theNorthern Hemisphere tend to harbour the lowest species diversity. At the countrylevel, Congo, Viet Nam, Myanmar, Panama, Ghana, Madagascar, Indonesia and India(listed in ascending order) report that the ten most common tree species represent less
Biological diversity 49FIGURE 3.7Average growing stock of the ten most common forest tree species as function of growingstock occupied by the three most common species¹100908010 species – % of total growing stock7060504030201000 10 20 30 40 50 60 70 80 90 1003 species – % of total growing stock¹ One square = one country/area.than 30 percent of total growing stock, indicating high species diversity. Informationwas missing from many countries in South America (including Brazil) and from mostcountries in the Congo Basin, both areas of known high species diversity.Figure 3.8 displays a loose relationship between two tree species diversity surrogates:total number of native tree species and growing stock composition. Introduced speciesare included in the data set for the growing stock composition.Among the ten most common species, 445 different taxa have been reported by88 countries. Asia and Europe are over-represented in the data set, which includesincomplete reports. A significant number of taxa were reported at the genus levelwithout indication of species. Most countries provided Latin names. Five genera(Pinus, Quercus, Picea, Abies and Fagus) make up almost a third of the species reported.Figure 3.9 shows the distribution of the 25 most common genera, which represent64 percent of all taxa reported.TrendsEighty-two countries provided time series (sometimes incomplete) on changes in therelative share of growing stock occupied by the ten main species from 1990 to 2000. Nochange in the relative ranking of tree species was observed in the data set. No significantchange in the share of growing stock occupied by the three main species was seen in thedata series from the 56 countries and areas providing complete series. In 1990 and 2000,this share accounted for 53 percent of growing stock, on average, although individualcountries and areas varied by +/-5 percent.
50<strong>Global</strong> <strong>Forest</strong> <strong>Resources</strong> <strong>Assessment</strong> <strong>2005</strong>FIGURE 3.8Percentage of growing stock represented by the three most common forest tree speciesas function of number of native tree species10090803 species – % of total growing stock7060504030201000 10 100 1 000 10 000No. of native tree speciesFIGURE 3.9Twenty-five most common tree genera reported¹CedrusPseudotsugaPterocarpusCombretumEucalyptusDipterocarpusTiliaNothofagusSalixJuniperusTerminaliaAcaciaAcerLarixAlnusFraxinusCarpinusShoreaPopulusFagusBetulaAbiesPiceaQuercusPinus0 2 4 6 8 10 12¹ Among the ten most common species reported by 88 countries.% of all taxa reported
Biological diversity 51NUMBER OF NATIVE TREE SPECIESEstimates of number of species by taxonomic group, by country, are available inthe literature, with the notable exception of trees. FRA <strong>2005</strong> is a first attempt tosystematically record the number of native forest tree species by country and area atthe global level. The definition of a tree is complex; for example there is no universallyadopted relative classification of shrubs and trees. The definition of forests used forFRA <strong>2005</strong> includes bamboo, palm and other woody species. In addition, in some caseswhere a species has been present in a country for many centuries, it is impossible toascertain whether it is native or was introduced.Information availability<strong>Global</strong>ly, 132 countries and areas accounting for 88 percent of total forest area provideddata on the number of native tree species. High response rates were noted in Europe,East Asia, North America, Northern Africa and South America. The lowest responserates were in island states and territories of the Caribbean and Oceania (Figure 3.10).National data were based on forest inventory lists, flora, national biodiversity reportsand discussions with botanists and taxonomists. National forest inventories tend togroup species according to their commercial value or to list genera rather than species,making species recording difficult and undervaluing species richness. Some countriesreported that a number of native species were under identification or not identified. Bydefault, some areas have reported the total number of plants in the country. A numberof countries have undertaken desk studies of available literature and many synonymswere found, making cross-checking difficult.None of these problems necessarily invalidate the results: identification of treespecies present in a country, independently of unsolved taxonomic problems, isnotoriously difficult, particularly in mega-diversity areas. The data set was incompleteand its significance in terms of biological diversity will be determined at a later stage.Once these methodological problems are resolved, there is considerable potential foruseful information, for instance on the geographical range of species.FIGURE 3.10Information availability – number of native forest tree speciesEastern and Southern AfricaNorthern AfricaWestern and Central AfricaEast AsiaSouth and Southeast AsiaWestern and Central AsiaEuropeCaribbeanCentral AmericaNorth AmericaOceaniaSouth AmericaWorld0 10 20 30 40 50 60 70 80 90 100Percentage of total forest areaInformation availableInformation not available
52<strong>Global</strong> <strong>Forest</strong> <strong>Resources</strong> <strong>Assessment</strong> <strong>2005</strong>StatusTable 3.8 shows the average number of native tree species for the reporting countriesand the range within each region. Individual countries reporting on this topic rangedfrom a minimum of three native species to a maximum of 7 780. Figure 3.11 illustratesthe number of native forest tree species per country.TABLE 3.8Native forest tree speciesRegion/subregion Information availability No. of native tree species by countryCountries <strong>Forest</strong> area % of total Aver. Min. Max.reporting (1 000 ha)forest areaEastern and Southern Africa 10 94 220 40.1 1 076 60 5 000Northern Africa 12 125 851 92.6 327 12 1 739Western and Central Africa 11 211 730 74.4 703 140 2 243Total Africa 33 431 801 65.9 679 12 5 000East Asia 3 208 177 92.3 1 625 1 049 2 500South and Southeast Asia 14 117 159 39.4 1 320 105 3 000Western and Central Asia 16 37 563 86.2 146 20 534Total Asia 33 362 899 64.0 778 20 3 000Total Europe 36 993 477 99.5 63 3 280Caribbean 5 3 194 56.0 409 76 722Central America 6 23 513 98.6 1 236 117 4 000North America 4 677 971 100.0 596 21 1 130Total North and Central America 15 704 678 99.6 790 21 4 000Total Oceania 3 172 876 83.1 838 121 2 100Total South America 12 833 428 97.7 1 994 123 7 880World 132 3 499 159 87.7 671 3 7 880FIGURE 3.11Number of native forest tree species1 000No data
Biological diversity 53South America has the highest average number of native forest tree species percountry. Brazil reported the highest number of forest trees in the world (7 880), withhigh species diversity in the Amazon basin and in the Atlantic coastal forest (MataAtlantica). High species richness is also reported by countries in Central Africa, CentralAmerica, East Asia, Madagascar and South and Southeast Asia. The lowest averagenumber of trees per country is found in Europe, where Iceland and Malta record thelowest number of native tree species – three – of any country with forests. Speciesdiversity in boreal forests is usually relatively low, and vast expanses of such forests inthe northern hemisphere are dominated by a small number of tree species. Countrieswith dry tropical forests tend to have lower species diversity than countries with moisttropical forests. More generally, it is often mentioned that tree species richness increaseswith decreasing latitude. Unfortunately, knowledge and documentation of speciesfollow the opposite trend, and many native tropical tree species remain unidentified orunrecorded, especially in Central Africa.FRA 2000 compiled information for temperate and boreal countries on all foresttrees, not only native species. The broad regional trends it identified remain valid(Dudley and Solton, 2003). FRA 2000 found the highest levels of temperate and borealtree diversity in the western part of the Pacific rim, while the lowest levels occured inthe boreal regions. In Europe and Central Asia, tree diversity increased towards thesouth and east.The absence of an authoritative world list of trees and shrubs is a serious impedimentto assessing and monitoring one of the most basic components of forest biodiversity– tree species richness at the national level. Several ongoing global taxonomic initiativesare expected to ease this limitation in the years to come. At the country level, inaddition to taxonomic issues, the development of flora and tree recognition guides willhelp species identification by foresters and conservationists. Lists of native tree speciesprovide a useful background to lists of endangered tree species, as absolute numbers forthe latter are of limited value without some indication of the total number of species.THREATENED FOREST TREE SPECIESFor FRA <strong>2005</strong>, countries were asked to report information on the number of forest treespecies considered threatened. Precise status categories were suggested for the terms‘vulnerable’, ‘endangered’ and ‘critically endangered’, using the ranking system of theIUCN red list categories and criteria. For countries and areas with an existing IUCNred data book of threatened plants, such information is accessible. The IUCN red listcan be sorted by kingdom, genus and species. ‘Tree’ is not an easily definable group,and at the country level, data had to be gathered on a species by species (or genus bygenus) basis. Although IUCN 2000 data are used in FRA <strong>2005</strong>, some national reportscontain complementary remarks or updates. This is particularly important in the caseof discrepancies between IUCN data and national data sources, or when nationalclassification systems are used.Information availabilityInformation on vulnerable, endangered and critically endangered forest trees wasprovided by all regions, representing 192 countries and accounting for 99 percent oftotal forest area. Information was missing primarily from some of the smaller Pacificand Caribbean islands and some countries in Western and Central Africa (Figure 3.12).Fifty-three countries and areas reported discrepancies with the 2000 red list, while afew countries indicated that a national list of threatened trees was under revision. Theavailability of data is in line with findings from the UNEP-WCMC desk study forFRA 2000, which indicated that contrary to trees per se, for which no global data wereavailable, the availability of global statistics on endangered trees was good.
54<strong>Global</strong> <strong>Forest</strong> <strong>Resources</strong> <strong>Assessment</strong> <strong>2005</strong>FIGURE 3.12Information availability – threatened forest tree speciesEastern and Southern AfricaNorthern AfricaWestern and Central AfricaEast AsiaSouth and Southeast AsiaWestern and Central AsiaEuropeCaribbeanCentral AmericaNorth AmericaOceaniaSouth AmericaWorld0 10 20 30 40 50 60 70 80 90 100Percentage of total forest areaInformation availableInformation not availableTABLE 3.9Threatened tree speciesRegion/subregion Information No. of critically No. of endangered No. of vulnerableavailability endangered tree species tree species tree speciesby country by country by countryCountries <strong>Forest</strong> area % of totalreporting (1 000 ha)forest area Aver. Min. Max. Aver. Min. Max. Aver. Min. Max.Eastern and Southern Africa 18 235 039 100.0 6 0 41 10 0 65 21 0 63Northern Africa 15 134 947 99.3 0 0 1 1 0 3 5 0 23Western and Central Africa 20 262 050 92.1 4 0 50 5 0 27 34 0 138Total Africa 53 632 036 96.4 4 0 50 5 0 65 21 0 138East Asia 5 225 663 100.0 20 0 67 18 0 45 37 0 96South and Southeast Asia 16 296 525 99.7 30 0 122 31 0 99 67 2 403Western and Central Asia 20 42 995 98.7 0 0 1 0 0 2 1 0 5Total Asia 41 565 183 99.7 14 0 122 14 0 99 31 0 403Total Europe 39 998 071 100.0 0 0 4 0 0 8 1 0 7Caribbean 20 5 683 99.6 4 0 23 7 0 50 10 0 62Central America 7 23 837 100.0 10 0 43 29 6 71 45 18 106North America 4 677 971 100.0 14 0 55 19 0 69 21 0 60Total North and Central America 31 707 491 100.0 7 0 55 14 0 71 20 0 106Total Oceania 15 176 724 84.9 3 0 26 2 0 18 8 0 37Total South America 13 852 796 100.0 9 0 34 17 0 100 48 0 187World 192 3 932 299 98.6 6 0 122 8 0 100 20 0 403StatusOf the 192 reporting countries (Table 3.9), 146 countries and areas reported that oneor more tree species are threatened in their jurisdiction. South America and South andSoutheast Asia have the highest number of threatened trees, while the lower rates arefound in Europe (Figure 3.13).The overall high response rate is due to the availability of IUCN red lists. It alsoshows that there is a clear perception that significant numbers of forest trees are underthreat and are found in all regions of the world.
Biological diversity 55FRA <strong>2005</strong> data on forest cover change, number of native forest trees and numberof threatened trees were used to assess the links between loss of forest and numberof threatened tree species. No simple relationship was found. Some countries, despiterelatively high proportions of remaining natural forests and protected areas, alsorecorded high levels of risk to individual tree species.Table 3.10 provides an additional perspective. The number of threatened tree species(the categories ‘critically endangered’, ‘endangered’ and ‘vulnerable’ added together bycountry) is expressed as a percentage of the total number of native species in individualcountries and is then averaged by region and subregion. Representing 87 percent of theglobal forest area, 126 countries provided data on both native tree species and threatenedFIGURE 3.13Average number of threatened forest tree species by regionAfricaAsiaEuropeNorth and Central AmericaOceaniaSouth America0 10 20 30 40 50 60 70 80No. of speciesVulnerable tree spp. Endangered tree spp. Critically endangered tree spp.TABLE 3.10Threatened tree species as percentage of number of native tree species in individual countriesRegion/subregion% of native tree speciesEastern and Southern Africa 11Northern Africa 3Western and Central Africa 9Total Africa 7East Asia 7South and Southeast Asia 8Western and Central Asia 1Total Asia 4Total Europe 2Caribbean 18Central America 12North America 5Total North and Central America 12Total Oceania 3Total South America 6World 5
56<strong>Global</strong> <strong>Forest</strong> <strong>Resources</strong> <strong>Assessment</strong> <strong>2005</strong>forest species. <strong>Global</strong>ly, approximately 5 percent of the world’s native tree species, onaverage, are reported threatened in their country or territory of origin.The often-quoted primary direct causes of loss of biodiversity include habitatloss due to land conversion and fragmentation of habitats, alien species invasionsand overharvesting of forest resources. The relationship between these factors andbiodiversity estimates and surrogates will require further analysis. It is recognized thatthe value of information on endangered species has some limitations in this regard,owing to the lack of basic data on the distribution and occurrence of most tree species.
57Chapter 4<strong>Forest</strong> health and vitalityOVERVIEWHealthy forests are essential for sustainable forest management, yet forests, like otherecosystems, are subject to a number of threats that can cause tree mortality or reducetheir ability to provide a full range of goods and services. The causes of the negativeimpacts on forest health and vitality vary from place to place, and the magnitude andduration of the impacts are not easy to assess. Causes include, but are not limited to,fire, insects and diseases, overexploitation of wood and non-wood forest products,poor harvesting practices, poor management, uncontrolled grazing, invasive species,air pollution and extreme climatic events (e.g. drought, frost, storms and floods). Thecomplexity and interrelationship of these factors and their impact on the health andvitality of forests are difficult to unravel. Indirect impacts may be far reaching andinclude social, economic and environmental dimensions.The definition of what constitute disturbance events varies among countries. Anumber of indicators of forest health and vitality have been developed, e.g. under theauspices of regional and international processes on criteria and indicators for sustainableforest management. Defoliation is one indicator monitored in many boreal andtemperate regions. It is influenced by many stress factors and therefore a useful measureof overall forest condition. Monitoring of defoliation is carried out mainly in Europe,Canada and the United States, and to some extent in East Asia. An indicator of foresthealth that is often suitable in tropical regions is the amount of post-logging woodydebris after timber extraction, because excessive amounts of woody debris leave forestsin a highly fire-prone state and provide insect breeding sites. However, information onthese indicators is not currently available in most countries.Generally, it may be possible to control or mitigate the extent and impact of damagefrom pests. However, when the damage is caused by abiotic agents (other than fire), there islittle possibility to control the immediate impact, even if there are often opportunities afterthe fact to limit secondary damage or minimize risk. For example, some countries havemade efforts to modify silvicultural practices to reduce the risk of damage by storms.Continuous monitoring of forest ecosystems is an expensive process, which makesit problematic for developing countries and those with economies in transition.However the results of monitoring can have a considerable impact on public opinion.The monitoring of forest pollution in some European countries, for example, led toimplementation of abatement policies and a decrease in the emissions of airbornepollutants (Economic and Social Council (UN) – ECOSOC, 2003). And, conversely,the resulting public support can have a positive effect on the amount of resources andeffort put into data collection and monitoring activities.Factors reported in FRA <strong>2005</strong>Research for FRA <strong>2005</strong> focused on the following factors, which to some extent arequantifiable and for which many countries record incidence and extent:• forest fires;• insects and diseases;• other disturbances (including wind, snow, ice, floods, tropical storms, drought anddamage by animals).Countries were asked to provide data averaged over five years, so that a largefluctuation in a single year did not significantly skew the figures. Data on disturbance
58<strong>Global</strong> <strong>Forest</strong> <strong>Resources</strong> <strong>Assessment</strong> <strong>2005</strong>factors are presented for 1990 (an average of the period 1988–1992) and 2000 (average of1998–2002). No attempt was made to forecast figures for the <strong>2005</strong> reporting period orto obtain data on frequency, intensity and time of disturbance events.Several disturbance factors were not included in FRA <strong>2005</strong> owing to lack of quantitativeinformation in most countries: illegal logging, encroachment, overharvesting and otherunsustainable management practices, pollution and the impact of invasive plant species.Wildland fires (all vegetation fires), pests and abiotic disturbances interact. Oftenone disturbance factor predisposes forests and woodlands to exposure to or invasionby other factors. Hence fire, other abiotic factors and biotic factors need to beconsidered as a whole.<strong>Forest</strong> fires. Fire is a major disturbance factor that has both beneficial and detrimentaleffects. Some forest ecosystems are adapted to fire and depend on it to retain theirvigour and reproductive capacity. However fire often gets out of control and destroysforest vegetation and biomass, which in turn results in considerable soil erosion by windand water. The damage extends to other landscapes and livelihoods as well, and resultsin haze pollution and deposited pollutants. <strong>Forest</strong> fires pose a serious threat to peoples’lives and to the sustainable use of natural resources. Both uncontrolled expansion ofagricultural land and the increased use of forests for recreational purposes and tourismincrease the risk of forest fires.National and global monitoring must be improved if countries are to manage fires inan ecologically sound way. Data on the extent of forest affected contribute to increasingthe understanding of fires, and thus to the development of appropriate risk managementstrategies. Additional information is needed on the ecological dynamics of fire, directand underlying causes, impacts and the desired long-term ecosystem condition (e.g.structure, health, species).Insects and diseases. Pests are defined as any species, strain or biotype of plant,animal or pathogenic agent that injures plants or plant products. Pest outbreaks cancontribute directly or indirectly to economic and environmental losses. While insects anddiseases are integral components of forests and often fulfil important functions, sporadicoutbreaks can have adverse effects on tree growth and survival, yield and quality of woodand non-wood forest products, wildlife habitat and the recreational, scenic and culturalvalue of forests. The lack of effective quarantine measures, increased international tradein agricultural and forest products, exchange of plant materials and long-range air travelhave introduced pathogens and insects into new environments, leading, in some places,to significant forest damage. The International Plant Protection Convention (IPPC),a major international treaty, aims to bring about action to prevent the transboundaryspread and introduction of plant and plant-product pests (<strong>FAO</strong>, 1999b).Risk analysis, forecasting of future pest outbreaks, and the design and implementationof cost-effective protection strategies all depend on the availability of comprehensivedata at various levels. The development of phytosanitary measures to minimizetransboundary movement of pests must be based on knowledge of the geographicaldistribution and biology of a given pest – hence the requirement for national, regionaland global-level data.Other disturbances. Climatic events such as drought, wind, snow, ice and floodshave always influenced forest ecosystems. However, global climate change, primarilythe result of human activities, is reportedly making forest ecosystems more prone todamage by altering the frequency, intensity and timing of fire events, hurricanes, icestorms, and insect and disease outbreaks. The number of catastrophic climatic eventsover the past decade seems to go well beyond what could be considered normalmeteorological oscillation (ECOSOC, 2003). Climate-related shifts in the range of pestspecies, many of which are forest-dependent, can further exacerbate abiotic impacts onforest health.
<strong>Forest</strong> health and vitality 59KEY FINDINGS<strong>Global</strong>ly, information on forest and other wooded land disturbances is relativelysparse, as can be seen in Figure 4.1, and the data-collection basis for disturbances ishighly variable. Although information on forest fires is available for 80 percent of thetotal forest area for the period 1998-2002, it is missing from many African countries.Information on the area of forest significantly affected by insects is available formore than 60 percent of the total forest area, while information on diseases and otherdisturbances is sporadic. Many of the small island countries and dependent territorieshave not provided information for this theme.The overall conclusion drawn from the data supplied for FRA <strong>2005</strong> is that the areaaffected annually for each type of disturbance is usually less than 1 percent of the forestarea of the reporting countries, although the affected area in individual countries can bemuch higher.Total reported area for all disturbance types for 2000 was 104 million hectares or3.2 percent of the forest area of the reporting countries. However, it should be noted thatinformation was missing from a large number of countries – particularly on area affectedby disturbances other than fire – so the actual area is likely to be significantly larger.The submitted data indicate that, on average, 27.7 million hectares of forests and5.1 million hectares of other wooded land burned each year of the 2000 reportingperiod. There was a slight decrease in area for this period when compared with the 1990period in Africa and North and Central America, but an increase in all other regions.However, it should be noted that FRA <strong>2005</strong> presents a compilation of data reported bythe countries and that information was missing from a large number of these. Thus thefindings should be treated with caution.There are other methodologies for identifying burned areas (for example satellitemonitoring) that do not necessarily differentiate between forests and other vegetationtypes (<strong>Global</strong> Burnt Area 2000 Project (GBA-2000), 2000), and which indicate that amuch larger area is burned annually than that indicated in FRA <strong>2005</strong>.FIGURE 4.1Information availability – forest health and vitalityArea of forest affectedby fire91 21117Area of forest affectedby insects48 18163Area of forest affectedby diseases42 15172Area of forest affectedby other disturbances39 161740 10 20 30 40 50 60 70 80 90 100Percentage of total forest areaInformation available for all years Information available for latest year Information not available for latest yearNote: Figures present number of countries in each category.
60<strong>Global</strong> <strong>Forest</strong> <strong>Resources</strong> <strong>Assessment</strong> <strong>2005</strong>Reports received by <strong>FAO</strong> indicate that the extent of forest adversely affected byinsects and diseases in the 2000 reporting period was 68 million hectares per year – morethan twice the extent reported for fire – despite the fact that fewer countries reportedon these disturbances than on fire. However, owing to recurring events and the longerduration of disturbance events caused by insects and diseases compared with thosecaused by fire or storms, it is difficult to assess the annually affected area accurately.The area of forest adversely affected by insects was reported as being lower for 2000than for 1990 – primarily owing to a substantial decrease in affected areas reported byCanada and the United States. Most other subregions and regions reported an increasein insect-affected forest area.The total area of forest affected by disease was slightly higher in the 2000 periodthan in 1990 for those countries providing information on both periods. However,information was only available for one-third of the total forest area and was missingfrom most countries in Africa, Central and North America and Oceania.Reporting of other abiotic and biotic disturbances was sporadic at best, with East Asiaand Europe being the only ones with reports covering more than half their forest areas.The area of other disturbances almost doubled between the two reporting periods inEurope, primarily owing to the effects of severe storms such as those of December 1999.Some single, large, sudden impact climatic events – such as extreme wind (particularlyon islands), floods, snow or ice – were reported to have greater impact than fire.It should be kept in mind that impacts from abiotic disturbances are recorded more easilythan those caused by diseases and insects. The latter have a much longer duration and thusrequire greater resources for monitoring and recording. FRA <strong>2005</strong> shows that the impacts offire, insects, diseases and other disturbances on forests can be severe in some countries, butthat, in general, less than 5 percent of the world’s forests are affected by such disturbances ina given year. However, the assessment also clearly highlights the lack of data.Efforts to gather, analyse and widely disseminate reliable country-based informationon forest health factors must be further strengthened in order to provide a solid basisfor decision-making and enhanced field-level action. This information can providethe foundation for reliable risk analyses and the implementation of effective forestprotection measures. To be successful, these must in turn ensure wide stakeholderinvolvement and continue to pursue both preventive and remedial action.FOREST FIRESFire has been a major factor in the development and management of many of theworld’s forests. Some forest ecosystems have evolved in response to frequent fires fromnatural as well as human causes, but others are negatively affected. Every year, millionsof hectares of the world’s forests are consumed by fire, with loss of human and animallife and very substantial economic damage in destroyed wood and non-wood forestresources, loss of biodiversity, release of carbon to the atmosphere, burned housing,degraded real estate, high costs of fire suppression, and damage to other environmental,recreational and amenity values (Davidenko and Eritsov, 2003; <strong>FAO</strong>, <strong>2005</strong>e; Kudoh,<strong>2005</strong>; United Nations Economic Commission for Europe (UNECE) and <strong>FAO</strong>, 2001;UNECE et al., 2000).Most fires in forests and woodlands today are caused by humans. They are theresult of a misuse of fire for conversion of forests to agricultural lands, maintenance ofgrazing lands, extraction of non-wood forest products, hunting, and clearing of landfor mining, industrial development and resettlement. <strong>Forest</strong> fires may also be the resultof personal or ownership conflicts.Identification of the extent, causes and impacts of forest fires is a specialized technicalarea. The fire data in FRA <strong>2005</strong> indicate the overall extent, but in most cases provide minimaldetails of the underlying causes and impacts. Further information on fire disturbances iscontained in a separate thematic report to be released during 2006 (Box 4.1).
<strong>Forest</strong> health and vitality 61BOX 4.1FRA <strong>2005</strong> thematic study on forest firesThe study complements FRA <strong>2005</strong> through greater depth of data and information on theincidence, impact and management of forest fires and related issues in different regionsaround the globe. Data and information are being prepared by wildland fire specialistsfrom each of the 12 regional wildland fire networks, which are supported by <strong>FAO</strong>,the United Nations International Strategy for Disaster Reduction (ISDR) and the <strong>Global</strong>Fire Monitoring Center (GFMC). <strong>FAO</strong> is publishing the regional reports early in 2006 asseparate working papers under the <strong>Forest</strong> Fire Management Working Paper series. Anin-depth analysis of these regional reports is being compiled as the global thematicstudy, to be published during 2006.The study assesses the fire situation in each region, including the extent of forestarea affected, number and types of fires and the causes. In recognition that not allfires are destructive, given that some ecosystems need fire-induced regeneration, bothpositive and negative social, economic and environmental impacts are outlined. Anintegrated approach to wildland fire management addresses: prediction, preparednessand prevention as key elements in the reduction of the negative impacts of fire; rapidresponse in extinguishing fires; and restoration after the fact. These elements constitutethe rationale for voluntary guidelines for wildland fire management, which are currentlybeing drafted.The thematic study also addresses key issues in the institutional aspects of wildlandfire management, including the roles and responsibilities of diverse stakeholders andtheir capacities and capabilities for prevention and suppression – particularly the roleof community-based fire management. Based on these issues, a global strategy is beingprepared for enhancing collaboration at international, regional, national and subnationallevels in order to implement the voluntary guidelines.Selected findings of the thematic report include:• Some 80 to 90 percent of wildland fires are caused by human activities, primarilythrough the uncontrolled use of fire for: clearing forest and woodland foragriculture, maintaining grasslands for livestock management, extraction of NWFPs,industrial development, resettlement, hunting and arson. Thus proactive firemanagement must involve all these stakeholders.• Legislation and expensive equipment alone are insufficient to prevent and suppresswildland fires. Given that their livelihoods are at stake, local communities andpopulations need to be actively involved in fire prevention and suppression.• It is not only the biological and physiological effects of fire that must be understoodin fire management strategies, but also the underlying socio-economic and culturalreasons for the use of fire, including poverty, food security and livelihood issues.• Data on both destructive and beneficial fires are needed, including their overalleconomic and ecological impacts.• To prevent and respond to fire emergencies, greater collaboration and agreementare increasingly required at international, regional, national and subnationallevels.Further information is available at: www.fao.org/forestry/site/fire-alerts/.Although fire is one of the primary agents of forest degradation, as a natural processit serves an important function in maintaining the health of certain ecosystems. Theconventional view of fire as a destructive agent requiring immediate suppression hasgiven way to the view that fire can and should be used to meet land management goalsand certain ecological conditions.
62<strong>Global</strong> <strong>Forest</strong> <strong>Resources</strong> <strong>Assessment</strong> <strong>2005</strong>The impact of fires will vary significantly depending not only on the intensity andextent of the fire, but also on whether the ecosystem is fire sensitive, fire dependent/influenced or fire independent. Fire-dependent ecosystems are those that have evolvedin the presence of fire; fire-sensitive ecosystems are those that have not evolved in itspresence and thus its occurrence in these ecosystems has a negative impact; and fireindependentecosystems are those that lack sufficient fuel to ignite fires, such as desertsand Antarctic tundra. According to The Nature Conservancy (2004), of the globalarea of major habitat types in important conservation ecoregions, 46 percent is firedependent/influenced, 36 percent is fire sensitive and 18 percent fire independent.To grasp the full impact and the roles of fire in forest ecosystems, an understandingis needed not only of the biological and physiological impacts, but also of the socialsciences and the underlying socio-economic and cultural reasons for the use of fire.Thus the fields of sociology, community relations, public administration and foodsecurity should be involved when preparing fire management strategies.However, technical and social fire management solutions are not enough. Legal andregulatory solutions in fire-dependent ecosystems and fire-prone forests need to beincluded as well.<strong>Global</strong>ly, the majority of forest fires stem from agricultural burning for landmanagement – mostly adjacent to or outside the forest itself – that gets out ofcontrol (GBA-2000, 2000). Consequently, proactive fire management would includecollaboration with the agricultural sector.It is important that countries collect data on beneficial as well as detrimental fires.For an assessment of the overall economic impact of detrimental fires, both the directeconomic damage and the ecological damage must be calculated.A common understanding is needed regarding the basis for data collection on forestfires and the value that can be gained from data collection for management strategies.Other issues include the criteria for collecting and assessing national, regional and globalwildland fire data and for streamlining the definitions used in forest fire management.Additional research is needed on the ecological dynamics of forest fires and theirunderlying causes. Categorization of fire types should be undertaken, as well, so thatthe data collected can be used more effectively in fire management. Farmers, ecologistsand forest staff need to be trained in the differences between beneficial and detrimentalfires. This includes knowledge of how to use the right kind of fire in fire-adaptedecosystems and how to extinguish harmful fires in fire-sensitive ones.Information availabilityClassification of fires that occur in forests and other wooded land is complex. There ispresently no global classification that distinguishes between beneficial and detrimentalfires, and consequently no detailed global information on fire types in forests and otherwooded land.Of the 229 countries and areas included in FRA <strong>2005</strong>, 91 provided data on theaverage annual area of forest adversely affected by fires for both the 1990 and 2000reporting periods, while an additional 21 countries provided data for the 2000 reportingperiod only – for a total of 112 countries accounting for 80 percent of the total forestarea. For the 2000 reporting period, eight regions or subregions provided data on morethan 50 percent of their forested area, Oceania provided data on less than 5 percent ofits forested area and information from Africa was largely missing (Figure 4.2).Data were reported on 73, 65 and 35 percent of other wooded land in South America,Northern Africa and Western and Central Asia respectively, but on 25 percent or less ofother wooded land in all other regions.As a result of the different methodologies of data collection, data are not usually directlycomparable among regions and countries except on a broad scale. Some countries do notseparate forests and other wooded land when recording data, while others do so.
<strong>Forest</strong> health and vitality 63FIGURE 4.2Information availability – forest firesEastern and Southern AfricaNorthern AfricaWestern and Central AfricaEast AsiaSouth and Southeast AsiaWestern and Central AsiaEuropeCaribbeanCentral AmericaNorth AmericaOceaniaSouth AmericaWorld0 10 20 30 40 50 60 70 80 90 100Percentage of total forest areaInformation available for all years Information available for latest year Information not available for latest yearResearch data are sparse on altered fire regimes and on historical and natural firefrequency and burning intensity. There is a relatively greater amount of data availableon intensively managed semi-natural forests and forest plantations because of the higherinvestment in monitoring and control of fire. These intensively managed systems tend tobe fire sensitive. As a result, the data provided for FRA <strong>2005</strong> primarily reflect fire impactin fire-sensitive ecosystems. In natural, fire-dependent forests, such as savannah forests,woodlands and boreal forests, it is more difficult to assess the true impact of fire.Information is lacking for a number of countries in which forest fires are known tohave occurred, including countries in Africa, Central Asia and Oceania. This is partly theresult of a lack of capacity to collect and analyse data at the national level.To improve the monitoring and assessment of fire damage to forests and otherwooded land, it would be useful to have data-collection systems that are directlycomparable. Thus there is a need to harmonize definitions and share information onmethods of data collection and analysis.StatusIn the 2000 reporting period, the average area burned annually was at least 27.7 millionhectares of forests, equivalent to 0.9 percent of the forest area of the reporting countries.An additional 5.1 million hectares of other wooded land were also reported as significantlyaffected by fire. The highest percentages were reported from Africa and Asia, while Europereported the lowest. Two countries (Myanmar and Chad) reported that more than 6 millionhectares of forests were affected by fires annually. Information on fire types, intensity andimpact was not provided. Table 4.1 presents a regional/subregional summary.The percentage of forest area affected by fires in Northern Africa is primarily dueto high figures from Chad, where an estimated 50 percent of the Sudanian zone and20 percent of the Sahelian zone are affected each year – down from 70 and 30 percentrespectively in the 1990 reporting period.The low figure for the total area of forest affected by fires in Oceania is the result ofonly two countries reporting (American Samoa and New Zealand). In South America,Brazil reported incomplete data.
64<strong>Global</strong> <strong>Forest</strong> <strong>Resources</strong> <strong>Assessment</strong> <strong>2005</strong>TABLE 4.1Average area of forest annually affected by fire 1998–2002Region/subregion Information Area of forestavailabilityaffected by fireCountries <strong>Forest</strong> area % of total 1 000 ha % of forestreporting (1 000 ha) forest area areaEastern and Southern Africa 8 62 129 26.4 483 0.8Northern Africa 5 21 076 15.5 6 176 29.3Western and Central Africa 7 47 558 16.7 519 1.1Total Africa 20 130 763 19.9 7 177 5.5East Asia 5 225 663 100.0 523 0.2South and Southeast Asia 12 272 087 91.5 11 029 4.1Western and Central Asia 16 36 994 85.0 218 0.6Total Asia 33 534 744 94.4 11 770 2.2Total Europe 37 997 658 100.0 1 597 0.2Caribbean 3 3 004 52.6 13 0.4Central America 4 12 338 51.8 130 1.1North America 3 677 968 100.0 4 333 0.6Total North and Central America 10 693 310 98.0 4 476 0.6Total Oceania 2 8 244 4.0 n.s. n.s.Total South America 10 806 483 94.6 2 719 0.3World 112 3 171 203 79.5 27 740 0.9TABLE 4.2Trends in area of forest annually affected by fire 1988–1992 and 1998–2002Region/subregion Information Average area of forest Annualavailability affected by fire change rate(both periods) (1 000 ha) (%)Countries <strong>Forest</strong> area % of total 1990 2000reporting (1 000 ha) forest areaEastern and Southern Africa 7 54 096 23.0 76 45 -5.2Northern Africa 5 21 076 15.5 9 191 6 176 -3.9Western and Central Africa 6 47 214 16.6 477 514 0.8Total Africa 18 122 386 18.7 9 745 6 735 -3.6East Asia 5 225 663 100.0 319 523 5.1South and Southeast Asia 11 268 946 90.4 10 095 11 020 0.9Western and Central Asia 13 35 700 82.0 57 198 13.2Total Asia 29 530 309 93.6 10 471 11 742 1.2Total Europe 31 941 240 94.3 1 043 1 584 4.3Caribbean 3 3 004 52.6 6 13 8.0Central America 0North America 3 677 968 100.0 4 402 4 333 -0.2Total North and Central America 6 680 972 96.2 4 408 4 346 -0.1Total Oceania 1 8 226 4.0 n.s. n.s. 3.1Total South America 6 662 062 77.6 139 154 1.0World 91 2 945 145 73.8 25 806 24 561 -0.5Note: As some countries did not report a complete series, figures for 2000 are slightly different from those presentedin the preceding table.TrendsData on forest fires are available for the 1990 and 2000 reporting periods. Table 4.2presents a summary of this information.The annual average area of forest fires was reported to have increased in 35 countries,decreased in 31 countries and remained almost constant in 25. From the data provided,it is difficult to discern any global trends. Africa reported a decrease in the 2000 periodcompared with the 1990 period, but this was due to the decrease in Chad referred toabove and was based on data for less than 20 percent of the total forest area in the
<strong>Forest</strong> health and vitality 65subregion, with information missing from most of the sub-Saharan countries. All otherregions reported a slight increase.INSECTS AND DISEASESOutbreaks of insects and diseases in forests have resulted in substantial economic lossesand environmental damage, even though they may be less visible and less dramatic thanfires and ice storms. For the purposes of this report insects and diseases are analysedtogether, as they are often co-dependent.Insects and diseases are integral components of forest ecosystems and normally arepresent at a relatively low density, causing little damage and having negligible impact ontree growth and vigour. From time to time, however, some species may quickly reachdamaging numbers, spatial distribution may increase and the outbreak may persist fora variable time before subsiding. Such large populations may have adverse effects onmany aspects of forests, such as tree growth, survival, yield and quality of wood andnon-wood forest products, and soil and water conservation. Such outbreaks are costlyto control and may cause considerable damage, compromise national economies, locallivelihoods and food security, and result in trade restrictions on forest products.The types of problems caused by introduced insects and diseases have changedrapidly in recent years. Movement of insects and diseases has been facilitated byintensified long-range air travel and reduced travel time, increased international tradeof agricultural and forest products and the exchange of plant material. Local climaticfluctuations may facilitate the establishment of introduced insects in previously hostileenvironments. Introduced forest pests can be extremely destructive, as seen in recentyears in the impact of the cypress aphid (Cinara cupressivora) in Eastern and SouthernAfrica and more recently in South America.As mentioned, the International Plant Protection Convention (IPPC) is a majorinternational treaty that aims to secure action to prevent the transboundary spreadand introduction of plant and plant-product pests (<strong>FAO</strong>, 1999b). The InternationalStandards for Phytosanitary Measures (ISPM) (<strong>FAO</strong>, 1995–<strong>2005</strong>), developed withinthe framework of the IPPC, include a basic framework for risk analysis anddevelopment of phytosanitary measures to minimize such transboundary movement.Particularly relevant to forestry are ISPM No. 15, Guidelines for regulating woodpackaging material in international trade (<strong>FAO</strong>, 2002b), and the ISPMs relating to riskanalysis and pest reporting and status. Data on the movement of and disturbances byintroduced insects are essential in the development of risk management strategies fortransboundary pests.Despite the significant adverse impacts of forest insects and diseases, and indicationsthat outbreaks are on the increase in some regions, insects and diseases are often notconsidered in the planning of forest and forest-conservation programmes. There hasbeen no attempt to systematically gather and analyse comprehensive information onthe type, scale and impact of such outbreaks at the global level.Identification of insects and diseases as causal agents of damage to forests is a highlyspecialized technical area. The insect and disease data in FRA <strong>2005</strong> indicate the overallextent of forest affected, but offer minimal details in most cases on the underlyingcauses.A system that enables data to be reported on a continuous as well as an ad hoc basiscould encompass the complexity of information required – so as to have data useful tothe development of risk management strategies for forests and other wooded land.Insect and disease problems are often either cyclical or chronic. Thus they requirelong-term investment in data collection and technical resources in order to fully assessthe complexity and extent of the issues. A chronic disturbance by insects and diseasesmay be caused by a complex of species rather than by a single entity. The complexcan vary not only in the species involved but also in the impact of each individual
66<strong>Global</strong> <strong>Forest</strong> <strong>Resources</strong> <strong>Assessment</strong> <strong>2005</strong>species within that particular disturbance. Thus defining the beginning and end of adisturbance event can be a challenge.There are further complications in recording data: (i) some insect life cycles overlapor are significantly longer than one year (e.g. the Siberian caterpillar – Dendrolimussibiricus); and (ii) other cyclical disturbance events caused by insects last more thana year. For example, gypsy moth (Lymantria dispar) outbreaks of several generationscan be every 7–10 years. More recently, however, the period between outbreaks hasapparently been becoming shorter. Capturing data for such long-term cyclical events isdifficult, particularly when there is variability in the length of cycles. The informationsupplied by countries for insect disturbances has been reported for annual averages overfive years. With long cyclical outbreaks, five-year reporting periods do not adequatelyreflect the status of these events.Moreover, due to the longer duration of some disturbance events, it is difficult toaccurately assess the area affected annually. Some countries appear to have reported thecumulative area affected in a given year, rather than the additional area of forest affectedwithin that year. Thus the figures for the different types of disturbances are not directlycomparable.Information availabilityThe status of the data on insect and disease disturbances is poor, mainly owing to a lackof clarity in interpreting what constitutes a ‘disturbance’. <strong>Global</strong>ly, the quantifiable dataon insect incidences and their effects on forests and forest products are limited. Insectand disease outbreaks in developing countries are primarily surveyed and reported forforest plantations and planted trees only, and corresponding surveys of forest declineand dieback are rare in these countries. Serious outbreak situations may be recorded, butdetails of causative agents and the quantifiable impact on forest resources often are not.In some instances, there may be a reluctance to record such severe outbreaks becausemanagement jobs or even forest products trade can be put at risk.Data on insects and diseases are collected and reported in a variety of ways. In someinstances, data provided on the area of forest affected by diseases and insects (and otherbiotic disturbances) are not separated.For insect infestations, of the 229 countries included in FRA <strong>2005</strong>, 48 countriesprovided data for both the 1990 and 2000 reporting periods; a further 18 countriesprovided data for the 2000 reporting period only. These 66 countries represent65 percent of the world’s forest area. Reports from East Asia, Europe and NorthAmerica covered more than 90 percent of their forest areas, while those from Africaand Oceania covered less than 1 percent of the forest area in their respective regions(Figure 4.3).For diseases, 42 countries provided data for both the 1990 and 2000 reportingperiods. A further 15 countries provided data for the 2000 reporting period only.For the 2000 reporting period, East Asia and Europe provided data for over80 percent of the forest areas within the region, while North America, South Americaand South and Southeast Asia each provided information for more than 50 percent ofthe forest area in their respective region or subregion. Data from Africa, the Caribbeanand Oceania were largely missing (Figure 4.4).For some regions, more data exist but were not readily accessible for this reportowing to a lack of information exchange among sectors, individuals and governmentagencies or a lack of awareness of the existence of data.To complement existing information and facilitate documentation on forest health atthe country level, <strong>FAO</strong> is compiling data, with the cooperation of experts from membercountries, for a global information system on the impact of insect and disease outbreakson natural and planted forests, other wooded land and trees outside forests. The systemis intended for national forest services, research and academic institutions and technical
<strong>Forest</strong> health and vitality 67FIGURE 4.3Information availability – forest insect pestsEastern and Southern AfricaNorthern AfricaWestern and Central AfricaEast AsiaSouth and Southeast AsiaWestern and Central AsiaEuropeCaribbeanCentral AmericaNorth AmericaOceaniaSouth AmericaWorld0 10 20 30 40 50 60 70 80 90 100Percentage of total forest areaInformation available for all years Information available for latest year Information not available for latest yearFIGURE 4.4Information availability – diseasesEastern and Southern AfricaNorthern AfricaWestern and Central AfricaEast AsiaSouth and Southeast AsiaWestern and Central AsiaEuropeCaribbeanCentral AmericaNorth AmericaOceaniaSouth AmericaWorld0 10 20 30 40 50 60 70 80 90 100Percentage of total forest areaInformation available for all years Information available for latest year Information not available for latest yearofficers dealing with forestry and pest management. It should help improve planningand decision-making, increase awareness of the severe problems related to forest insectsand diseases worldwide, and provide up-to-date baseline information to support riskassessment and the design and implementation of effective forest protection strategies(www.fao.org/forestry/site/18748/en). A two-tiered questionnaire has been sent toin-country technical specialists in an attempt to obtain more detailed information. Theresults of this study are available in a separate thematic report (Box 4.2).
68<strong>Global</strong> <strong>Forest</strong> <strong>Resources</strong> <strong>Assessment</strong> <strong>2005</strong>BOX 4.2FRA <strong>2005</strong> thematic study on forest pestsFigures are rarely available on losses attributed directly to infestations of forests,trees and forest products by insects and diseases, particularly in developing countriesand countries in transition. Thus, in addition to seeking quantitative information forFRA <strong>2005</strong>, <strong>FAO</strong> compiles qualitative profiles of individual pest problems by country.Information is collated from many sources, through expert contacts in the countries, viathe Internet and in literature searches. The study is ongoing and constantly updated.Data are indexed, making it possible to highlight information on pest distributionthat could indicate potential invasiveness between neighbouring countries. Informationon the host preference of individual causative agents can be extracted, as well asbreakdowns of pests at the country level.The impact of pests on the forest sector is often underestimated, as illustrated in thefollowing examples:• Since an infestation of Dendroctonus ponderosae (mountain pine beetle) wasfirst detected in interior British Columbia in 1994, an estimated 240 million m³of timber on 11.3 million hectares have been lost, at an estimated cost of US$1.7million per year. The beetle is spreading fast across Canada and threatens to movesouth into United States forests. Huge investments in control are now necessary,with more than US$82 million recently committed by the Canadian Government(Wilent, <strong>2005</strong>).• In eastern and southern Africa, three accidentally introduced aphids were the firstspecific conifer pests to invade the region, and they became the most damagingpests of these species. Since their initial introduction, the pine wooly aphid, Pineusboerneri, the pine needle aphid, Eulachnus rileyi, and the cypress aphid, Cinaracupressivora, have proliferated throughout southern and eastern Africa andcontinue to spread. It was conservatively estimated that, by 1990, C. cupressivorahad killed trees worth approximately US$44 million and was causing a loss inannual growth increment of a further US$14.6 million per year. In addition, thetwo pine aphids were causing a further loss of approximately US$2.4 million peryear to annual growth increment in pine forest plantations in the region. Thiseconomic data was instrumental in securing resources to mount a biologicalcontrol programme, which led to substantial reductions of incidence of at leastthe cypress aphid (Murphy, 1996).• In New Zealand it is estimated that the forest industry spends US$0.60/ha on themonitoring of diseases and pests, in comparison with US$3.50/ha on fire defence.Yet average annual losses to disease amount to some US$137 million, whereaslosses to fire are just US$682 000 (Hocking, 2003).At this time, 19 profiles have been completed from four regions. As more countriesare included, there will be more opportunities for comparison. This information shouldnot only increase awareness of the importance of forest health, but also encouragecountries to collect data that will enhance the accuracy of future global forest resourcesassessments.Status<strong>Global</strong>ly, the combined forest area adversely affected by insects and diseases for the2000 reporting period was approximately 68 million hectares. In most cases, there are nodetails indicating the causative agent(s), so the data provided may reflect combined insectand disease disturbances. The highest area of insect disturbance reported for a singlecountry was 14.2 million hectares (Canada), and of disease disturbance, 17.4 million
<strong>Forest</strong> health and vitality 69TABLE 4.3Average area of forest annually affected by insects 1998–2002Region/subregion Information availability Area of forest affected by insectsCountries <strong>Forest</strong> area % of total 1 000 ha % of forestreporting (1 000 ha) forest area areaEastern and Southern Africa 2 48 n.s. 0 0Northern Africa 3 5 346 3.9 83 1.5Western and Central Africa 0Total Africa 5 5 394 0.8 83 1.5East Asia 4 218 842 97.0 9 329 4.3South and Southeast Asia 7 179 498 60.4 1 010 0.6Western and Central Asia 11 22 841 52.5 464 2.0Total Asia 22 421 181 74.3 10 803 2.6Total Europe 28 930 556 93.2 6 354 0.7Caribbean 1 341 6.0 0 0Central America 2 9 638 40.4 2 n.s.North America 3 677 968 100.0 19 332 2.9Total North and Central America 6 687 947 97.2 19 334 2.8Total Oceania 1 18 n.s. n.s. 0.1Total South America 4 531 886 62.4 561 0.1World 66 2 576 982 64.6 37 134 1.4TABLE 4.4Average area of forest annually affected by diseases 1998–2002Region/subregion Information availability Area of forest affected by diseasesCountries <strong>Forest</strong> area % of total 1 000 ha % of forestreporting (1 000 ha) forest area areaEastern and Southern Africa 2 48 n.s. 0 0Northern Africa 2 2 203 1.6 130 5.9Western and Central Africa 1 461 0.2 100 21.6Total Africa 5 2 712 0.4 229 8.5East Asia 2 201 877 89.5 883 0.4South and Southeast Asia 8 183 398 61.7 8 471 4.6Western and Central Asia 8 8 701 20.0 31 0.4Total Asia 18 393 976 69.5 9 386 2.4Total Europe 24 936 300 93.8 3 135 0.3Caribbean 1 341 6.0 0 0Central America 2 9 747 40.9 33 0.3North America 2 367 834 54.3 17 382 4.7Total North and Central America 5 377 922 53.4 17 415 4.6Total Oceania 1 18 n.s. 0 0Total South America 4 531 886 62.4 830 0.2World 57 2 242 814 56.2 30 995 1.4hectares (United States) – both countries within the top five in terms of forest area andwith good data-collection systems. Tables 4.3 and 4.4 present a summary of results forthe 2000 reporting period.TrendsThe data reflect differences in the two periods, but as only two reporting periods arecompared, they should not be construed as trends. The raw data indicate a very largeincrease in the level of disease reported and a decrease in the level of insect damagereported between the 1990 and 2000 reporting periods. However, this is primarilybecause more countries reported for the 2000 period than for 1990.
70<strong>Global</strong> <strong>Forest</strong> <strong>Resources</strong> <strong>Assessment</strong> <strong>2005</strong>Analysing data only for those countries that have provided information for twopoints in time, the area affected by diseases shows a slight increase globally (from 4.4to 4.7 million hectares per year), despite a significant decrease reported by Africa andEast Asia (Table 4.5). The increase in South America is particularly noticeable and isprimarily due to the fact that Chile has reported a very large increase in the area offorest affected by diseases.TABLE 4.5Trends in area of forest annually affected by diseases 1988–1992 and 1998–2002Region/subregion Information Average area of forest Annualavailability affected by diseases change rate(both periods) (1 000 ha) (%)Countries <strong>Forest</strong> area % of total 1990 2000reporting (1 000 ha) forest areaEastern and Southern Africa 2 48 n.s. 0 0 0Northern Africa 1 2 144 1.6 241 130 -6.0Western and Central Africa 1 461 0.2 179 100 -5.7Total Africa 4 2 653 0.4 420 229 -5.9East Asia 2 201 877 89.5 1 821 883 -7.0South and Southeast Asia 4 103 870 34.9 51 70 3.2Western and Central Asia 8 8 701 20.0 47 31 -3.8Total Asia 14 314 449 55.5 1 919 985 -6.5Total Europe 18 919 309 92.1 2 059 2 631 2.5Caribbean 1 341 6.0 0 0 0Central America 1 5 539 23.2 3 33 26.2North America 1 65 540 9.7 11 2 -15.7Total North and Central America 3 71 420 10.1 14 35 9.4Total Oceania 0Total South America 3 38 673 4.5 13 810 51.6World 42 1 346 503 33.8 4 426 4 690 0.6Note: As some countries did not report a complete series, figures for 2000 are slightly different from those presentedin Table 4.4.TABLE 4.6Trends in area of forest annually affected by insects 1988–1992 and 1998–2002Region/subregion Information Average area of forest Annualavailability affected by insects change rate(both periods) (1 000 ha) (%)Countries <strong>Forest</strong> area % of total 1990 2000reporting (1 000 ha) forest areaEastern and Southern Africa 2 48 n.s. 0 0 0Northern Africa 2 5 287 3.9 61 82 3.0Western and Central Africa 0Total Africa 4 5 335 0.8 61 82 3.0East Asia 4 218 842 97.0 8 306 9 329 1.2South and Southeast Asia 3 99 970 33.6 8 10 2.6Western and Central Asia 9 22 372 51.4 235 413 5.8Total Asia 16 341 185 60.2 8 549 9 752 1.3Total Europe 20 901 989 90.4 2 536 5 945 8.9Caribbean 1 341 6.0 0 0 0Central America 0North America 3 677 968 100.0 33 658 19 332 -5.4Total North and Central America 4 678 309 95.9 33 658 19 332 -5.4Total Oceania 0Total South America 4 531 886 62.4 916 561 -4.8World 48 2 458 703 61.6 45 721 35 672 -2.5Note: As some countries did not report a complete series, figures for 2000 are slightly different from those presentedin Table 4.3.
<strong>Forest</strong> health and vitality 71The area affected by insects, on the other hand, shows a decrease (from 45.7 to35.7 million hectares per year), owing to a substantial decrease in affected areas reportedby Canada and the United States. Most other subregions and regions reported anincrease in the area of forest affected by insects (Table 4.6). In Europe, the large increasein the area of forest affected by insects in the 1998–2002 period compared with the1988–1992 period may be due to increased attacks following the storms of December1999. This may also be the reason behind the increase in the area affected by diseases inthis region.It should be noted that this information is indicative as, again, there are only the twodata points in time and data are missing for a large number of countries. Conclusionscannot be drawn from the data as to the causative agents or trees species involved andthe effects on trees and the forest ecosystem as a whole.OTHER DISTURBANCESIn the context of the FRA <strong>2005</strong> report, other disturbances include abiotic factors (e.g.wind, snow, ice, floods, tropical storms and drought) and damaging biotic agents otherthan insects and diseases (e.g. camels, beavers, deer and rodents). In general, informationon disturbances attributed to these other biotic and abiotic factors is highly erratic, witha broad range of causative agents. Thus few of the data are comparable.In Europe, a comprehensive overview of forest damage events is provided by theEuropean <strong>Forest</strong> Institute’s Database on <strong>Forest</strong> Disturbances in Europe. The effects onEuropean forests of the severe storms of December 1999 and the floods of 2002 are welldocumented.Information availabilityOf the 229 countries involved in FRA <strong>2005</strong>, 39 countries provided data on otherdisturbances for both the 1990 and 2000 reporting periods (33 percent of the total forestarea). A further 16 countries provided data for the 2000 reporting period only. Thereports were mainly from Europe and East Asia (Figure 4.5).FIGURE 4.5Information availability – other disturbancesEastern and Southern AfricaNorthern AfricaWestern and Central AfricaEast AsiaSouth and Southeast AsiaWestern and Central AsiaEuropeCaribbeanCentral AmericaNorth AmericaOceaniaSouth AmericaWorld0 10 20 30 40 50 60 70 80 90 100Percentage of total forest areaInformation available for all years Information available for latest year Information not available for latest year
72<strong>Global</strong> <strong>Forest</strong> <strong>Resources</strong> <strong>Assessment</strong> <strong>2005</strong>Data for other wooded land were too limited to permit further analysis (less than15 percent of the area of other wooded land in all regions).StatusTotal reported annual average area affected for the 2000 reporting period was 8.4 millionhectares (Table 4.7). The highest area of other disturbances reported for a single countrywas 3.9 million hectares (Finland). However, this figure is the cumulative area affectedrather than the average area newly affected in a given year. Overall, the data reflect arange of types of disturbances. First, there were single, major catastrophic events such ashurricanes, which cause widespread destruction and loss of trees, and which may weakentrees and make them susceptible to secondary infestations. Second, there were longerterm, chronic pressures, such as consistent feeding by animals, that either cause significant,direct damage to trees or have indirect effects such as increased soil compaction beneaththe trees, which may contribute to dieback and decline. Thus, collectively, without beingbroken down, the data are not particularly useful in the development of managementstrategies. However, detailed breakdowns into specific types of disturbances are given inmost of the country reports for use at the national level.TrendsComparative data for the 1990 and 2000 reporting periods were provided by approximately50 percent of the countries in the European region, together accounting for 94 percentof the total forest area in the region. The East Asia subregion provided comparativedata on other disturbances for 89 percent of the forest area, and South and SoutheastAsia for 34 percent. All other regions or subregions provided information for less than10 percent of their combined forest area. Table 4.8 presents a regional summary.The area of other disturbances almost doubled between the two reporting periods inEurope, primarily due to the effects of severe storms such as those in December 1999.Wind, snow, drought and ice damage events have been reported, with wind being asignificant factor in Europe and the tropical areas and islands for the 2000 reporting period.However, it should be noted that very little detail has been provided on other disturbances.TABLE 4.7Average area of forest annually affected by other disturbances 1998–2002Region/subregion Information Area of forest affectedavailabilityby other disturbancesCountries <strong>Forest</strong> area % of total 1 000 ha % ofreporting (1 000 ha) forest area forest areaEastern and Southern Africa 3 8 079 3.4 4 n.s.Northern Africa 2 5 287 3.9 3 n.s.Western and Central Africa 0Total Africa 5 13 366 2.0 6 n.s.East Asia 2 201 877 89.5 847 0.4South and Southeast Asia 4 107 885 36.3 3 n.s.Western and Central Asia 3 3 121 7.2 4 0.1Total Asia 9 312 883 55.2 853 0.3Total Europe 33 981 715 98.4 7 544 0.8Caribbean 1 341 6.0 0 0Central America 0North America 2 65 543 9.7 3 n.s.Total North and Central America 3 65 884 9.3 3 n.s.Total Oceania 3 8 270 4.0 11 0.1Total South America 2 22 839 2.7 0 0World 55 1 404 957 35.2 8 418 0.6
<strong>Forest</strong> health and vitality 73TABLE 4.8Trends in area of forest annually affected by other disturbances 1988–1992 and 1998–2002Region/subregion Information Average area of forest Annualavailability affected by other change rate(both periods) disturbances (%)(1 000 ha)Countries <strong>Forest</strong> area % of totalreporting (1 000 ha) forest area 1990 2000Eastern and Southern Africa 1 8 n.s. 0 0 0Northern Africa 1 959 0.7 n.s. n.s. -9.9Western and Central Africa 0Total Africa 2 967 0.1 n.s. n.s. -9.9East Asia 2 201 877 89.5 790 847 0.7South and Southeast Asia 3 99 936 33.6 n.s. n.s. -2.5Western and Central Asia 3 3 121 7.2 3 4 1.2Total Asia 8 304 934 53.8 793 851 0.7Total Europe 24 937 939 94.0 4 124 7 330 5.9Caribbean 1 341 6.0 1 0 -100.0Central America 0North America 1 65 540 9.7 1 1 0Total North and Central America 2 65 881 9.3 2 1 -7.7Total Oceania 1 8 226 4.0 5 7 3.4Total South America 2 22 839 2.7 0 0 0World 39 1 340 786 33.6 4 924 8 188 5.2Information on the impacts of these types of disturbances is important. At this pointin time, there is insufficient quantitative information for a proper trend analysis. Somedata have relevance to relatively isolated areas (specific animal species), whereas othertypes have much broader relevance (storms, wind). Countries have varying perceptionsabout what constitute ‘other disturbances’.Subdivision of the data would help provide more meaningful comparisons andconclusions at regional and global levels. Where feasible, consideration should be givento both direct and indirect effects (e.g. compaction of soils). A framework needs to bedeveloped within which to capture information, prioritize types of disturbances anddefine data-collection methodologies from a global perspective.
74<strong>Global</strong> <strong>Forest</strong> <strong>Resources</strong> <strong>Assessment</strong> <strong>2005</strong>
75Chapter 5Productive functions of forestresourcesOVERVIEW<strong>Forest</strong>s and trees outside forests provide a wide range of wood and non-wood forestproducts. The productive function of forest resources is a common thematic element ofall the ecoregional criteria and indicator processes. This reflects an ambition to maintainan ample, valuable supply of primary forest products, while at the same time ensuringthat production and harvesting are sustainable and do not compromise the managementoptions of future generations.Describing the forest resource as a provider of goods has traditionally been one ofthe main objectives of global forest resources assessments. Earlier assessments focusedon timber supply, but the concept of forest production has since widened to encompassall types of wood and non-wood forest products.As part of the FRA <strong>2005</strong> reporting process, information was collected on thefollowing variables related to the productive function of forest resources:• area of forest designated for production;• area of productive forest plantations;• growing stock and commercial growing stock;• removals of wood products;• removals of non-wood forest products (NWFPs).Data availability and reliability are problems with some of these variables, forexample removals of non-wood forest products, as can be seen in Figure 5.1.FIGURE 5.1Information availability – productive functions of forest resourcesArea of forest designatedprimarily for productionTotal area designatedfor productionArea of productive forestplantations163 9 5776 6147168 6 55Growing stock147 3 79Commercial growing stock107 6116Wood removals153 14 62Non-wood forest productsremovals60 111580 10 20 30 40 50 60 70 80 90 100Percentage of total forest areaInformation available for all years Information available for latest year Information not available for latest yearNote: Figures present number of countries in each category.
76<strong>Global</strong> <strong>Forest</strong> <strong>Resources</strong> <strong>Assessment</strong> <strong>2005</strong>KEY FINDINGSMany products are extracted from forests, ranging from wood for timber and fuelwoodto food (berries, mushrooms, edible plants, bushmeat), fodder and other NWFPs.By quantity, wood destined for industrial use is the most important product; amongNWFPs, food and fodder are the most significant.About half the world’s forests are designated for production (as either primaryor secondary function) and thus are available to supply wood and non-wood forestproducts. The total area of forest designated for production does not show anysignificant trend for the period 1990–<strong>2005</strong>.Productive forest plantations represented 1.9 percent of global forest area in 1990,2.4 percent in 2000 and 2.8 percent in <strong>2005</strong>. Currently, there are about 109 millionhectares of productive forest plantations in the world. The Asia region accounts for41 percent; Europe 20 ; North and Central America 16; South America and Africa10 percent each and Oceania 3 percent. The top ten countries account for 73 percentof the total area, with China, the Russian Federation and the United States togetheraccounting for more than half the total area of productive forest plantations.The area of productive forest plantations increased by 2.0 million hectares per yearduring 1990–2000 and by 2.5 million hectares per year during 2000–<strong>2005</strong>. All regionsshow an increase in plantation area, and the highest plantation rates are found in Asia,particularly in China.It should be noted that these figures refer only to productive forest plantations 1 anddo not include the planted component of semi-natural forests designated for productivepurposes. Nor do they include plantations established for the protection of soil andwater or other environmental purposes.In <strong>2005</strong> the total global growing stock of forests is estimated at 434 billion m 3 , whichcorresponds to an average of 110 m 3 per hectare. The countries with the most growingstock per hectare are found in central Europe and some tropical areas.Total growing stock shows a slight downward tendency – mainly owing to the decreasein forest area. However, some regions also show significant trends in growing stock perhectare, for example Europe shows an increase and Southeast Asia a decrease.About 202 billion m 3 or 47 percent of the total growing stock is consideredcommercial. Higher percentages in relation to total volume are found in countries withtemperate forests and lower ones in those with tropical forests.<strong>Global</strong> wood removals in <strong>2005</strong> amount to 2.8 billion m 3 . About 40 percent isfuelwood (1.2 billion m 3 ), but the proportions vary among regions, with Africa reporting88 percent of removals as fuelwood, while North and Central America reported only13 percent.There are no significant global trends in wood removal. Africa reported increasedremovals while Asia showed a significant decrease. Europe, North and Central Americaand South America reported only a slight decrease.Countries usually do not report illegal removals and informal fuelwood gathering, sofigures for removals might be much higher. The reported figures on fuelwood removalsare particularly weak, as a large part of fuelwood gathering is informal.Annual wood removals account for about 0.7 percent of total global growing stockand 1.5 percent of commercial growing stock. These figures are indicative, and thefigures on removals should not be directly compared with figures on growing stock,particularly at the country level. Removals take place partially outside forests, e.g. in1 In FRA <strong>2005</strong>, ‘productive forest plantation’ is defined as a “forest of introduced species and in somecases native species, established through planting or seeding mainly for production of wood ornon-wood goods”. Man-made forests of native species are classified as plantations when they arecharacterized by few species, straight tree lines and even-aged stands, otherwise they are classified assemi-natural forests.
Productive functions of forest resources 77other wooded land and from trees outside forests – particularly fuelwood removals indeveloping countries – while growing stock estimates refer only to forest area.There is insufficient information available on NWFPs in most countries, bothdeveloping and developed, and they are usually not included in national accounts andtrade statistics. Consequently, the figures reported to FRA <strong>2005</strong> are in many casesincomplete, resulting in underestimates of NWFP removals, making it difficult to drawany far-reaching conclusions. However, the figures reported for the period 1990–<strong>2005</strong>show a generally increasing trend.In conclusion, the productive functions of forest resources are of great importanceand have not undergone drastic changes during the 15-year period covered byFRA <strong>2005</strong>, with the exception of the area of productive plantation forests, whichshows a steady increase in all regions and a particularly rapid increase in Asia. Of theremaining variables, some show increasing and others decreasing trends. There areregional variations, but in most cases no clear regional patterns. A few notable regionaltrends can be seen, however, such as the increase of growing stock per hectare in Europeand its decrease in Southeast Asia. Further, taking under-reporting into account, it canbe concluded that substantial amounts of NWFPs are removed annually and that theseproducts play an important role at both local and national levels.FOREST AREA DESIGNATED FOR PRODUCTIVE PURPOSESThis indicates to what extent forest areas have been set aside for production, either bylegal prescription or by decision of the landowner or manager.<strong>Forest</strong> designation is reported in two ways: ‘primary function’ and ‘total areawith function’. <strong>Forest</strong> areas with a specific, designated function considered to besignificantly more important than other functions are reported as ‘primary function’.All areas with a designated function (not necesssarily primary) are reported as ‘totalarea with function’.Information availabilityOf the 229 countries and areas covered by FRA <strong>2005</strong>, 172 provided information onforests designated primarily for productive purposes. For <strong>2005</strong>, 141 of these reportedhaving areas where production is designated as the primary function, and only 82 countriesreported on total area with function. The countries reporting data on areas designatedprimarily for production account for 94 percent of the global forest area. In a fewsubregions, however, reporting countries account for a lower proportion of total forestarea, i.e. the Caribbean, Central America and Western and Central Africa (Figure 5.2).The countries that reported data on total area with function account for only41 percent of the global forest area (Figure 5.3). Asia, North America and SouthAmerica show higher then average reporting coverage, while Africa, the Caribbean,Europe (due to the absence of reporting by the Russian Federation) and Oceania showcoverage below 15 percent.The remaining countries/areas either did not report or reported that no informationwas available. These countries may still have areas designated for production, but theyare either included in other categories, such as ‘multiple use’, or cannot be quantified.StatusTable 5.1 shows a summary by region/subregion of the <strong>2005</strong> status of areas designatedprimarily for productive purposes.At the global level, 34 percent of total forest area has production designated as itsmain purpose. In Europe, some 73 percent of forest area has production as the primaryfunction, while North America reported only 6 percent designated for production– instead reporting most of its forests as designated for multiple use. This indicates aclear regional difference in the perception of forest designation.
78<strong>Global</strong> <strong>Forest</strong> <strong>Resources</strong> <strong>Assessment</strong> <strong>2005</strong>FIGURE 5.2Information availability – area of forest designated primarily for productionEastern and Southern AfricaNorthern AfricaWestern and Central AfricaEast AsiaSouth and Southeast AsiaWestern and Central AsiaEuropeCaribbeanCentral AmericaNorth AmericaOceaniaSouth AmericaWorld0 10 20 30 40 50 60 70 80 90 100Percentage of total forest areaInformation available for all years Information available for latest year Information not available for latest yearFIGURE 5.3Information availability – total area of forest designated for productionEastern and Southern AfricaNorthern AfricaWestern and Central AfricaEast AsiaSouth and Southeast AsiaWestern and Central AsiaEuropeCaribbeanCentral AmericaNorth AmericaOceaniaSouth AmericaWorld0 10 20 30 40 50 60 70 80 90 100Percentage of total forest areaInformation available for all years Information available for latest year Information not available for latest yearData on total area with function are too weak to allow a breakdown by region andsubregion. <strong>Global</strong>ly, 54 percent of forest area was reported as designated for productivepurposes, whether as the primary or secondary function. This figure can be seen as aglobal estimate of the area of forest available for the supply of wood and non-woodforest products.
Productive functions of forest resources 79TABLE 5.1Area of forest designated primarily for production <strong>2005</strong>Region/subregion Information availability Area of forest designatedprimarily for productionCountries <strong>Forest</strong> area % of totalreporting (1 000 ha)forest area 1 000 ha % of forest areaEastern and Southern Africa 16 211 181 93.2 41 051 19Northern Africa 13 125 667 95.9 44 185 35Western and Central Africa 15 118 280 42.6 52 796 45Total Africa 44 455 129 71.6 138 032 30East Asia 5 244 862 100.0 125 488 51South and Southeast Asia 17 283 126 100.0 120 098 42Western and Central Asia 23 43 579 100.0 9 674 22Total Asia 45 571 567 100.0 255 260 45Total Europe 36 991 192 99.0 724 308 73Caribbean 9 3 489 58.4 980 28Central America 7 22 411 100.0 3 312 15North America 4 677 464 100.0 40 499 6Total North and Central America 20 703 364 99.6 44 790 6Total Oceania 14 203 467 98.6 22 449 11Total South America 13 831 540 100.0 96 346 12World 172 3 756 260 95.0 1 281 185 34TABLE 5.2Trends in area of forest designated primarily for production 1990–<strong>2005</strong>Region/subregion Information availability (all 3 years) Area of forest designated Annual change rateprimarily for production (%)Countries <strong>Forest</strong> area % of total (1 000 ha)reporting (1 000 ha)forest area 1990–2000 2000–<strong>2005</strong>1990 2000 <strong>2005</strong>Eastern and Southern Africa 15 198 343 87.6 39 712 38 156 37 677 -0.40 -0.25Northern Africa 13 125 667 95.9 48 670 46 016 44 185 -0.56 -0.81Western and Central Africa 15 118 280 42.6 59 947 55 741 52 796 -0.72 -1.08Total Africa 43 442 291 69.6 148 329 139 913 134 658 -0.58 -0.76East Asia 5 244 862 100.0 126 821 119 688 125 488 -0.58 0.95South and Southeast Asia 17 283 126 100.0 130 350 132 285 120 098 0.15 -1.91Western and Central Asia 21 43 272 99.3 9 566 9 591 9 541 0.03 -0.10Total Asia 43 571 259 99.9 266 737 261 564 255 127 -0.20 -0.50Total Europe 34 984 468 98.3 770 508 722 051 721 355 -0.65 0.02Caribbean 9 3 489 58.4 849 828 980 -0.25 3.41Central America 7 22 411 100.0 6 325 4 202 3 312 -4.01 -4.65North America 4 677 464 100.0 37 934 40 458 40 499 0.65 0.02Total North and Central America 20 703 364 99.6 45 108 45 488 44 790 0.08 -0.31Total Oceania 11 39 593 19.2 5 651 9 371 9 261 5.19 -0.24Total South America 12 816 436 98.2 88 216 103 224 91 073 1.58 -2.47World 163 3 557 412 90.0 1 324 549 1 281 612 1 256 266 -0.33 -0.40Note: As some countries did not report a complete series, figures for <strong>2005</strong> are slightly different from those presented in thepreceding table.TrendsThe analysis of trends in area of forest designated primarily for production is based onthe countries that reported a complete time series (163 countries representing 90 percentof the global forest area). The results are shown in Table 5.2.<strong>Global</strong>ly, there is a slight decreasing tendency for area of forest with production as theprimary function. Many regions/subregions follow the global trend, while others (e.g.Asia and South America) show an irregular pattern. In the case of Asia, Myanmar adopteda new classification in 2000, adding some 20 million hectares as primarily designated for
80<strong>Global</strong> <strong>Forest</strong> <strong>Resources</strong> <strong>Assessment</strong> <strong>2005</strong>production. For South America, most countries are either stable or reporting a steadyincrease. Peru, however, reported a decrease of about 15 million hectares since 2000.PRODUCTIVE FOREST PLANTATIONS<strong>Forest</strong> plantations – a subset of all planted forests – are defined as forests of introducedspecies and in some cases native species, established through planting or seeding, withfew species, even spacing and/or even-aged stands. Productive forest plantations aredefined as forest plantations predominantly intended for the provision of wood, fibreand non-wood forest products.Productive plantations can also provide protective, recreational, amenity and otherfunctions, which are not precluded by the harvesting of products.Some forests classified as semi-natural include planted trees of native species, mostof which are used for productive purposes. As these forests do not fall under the forestplantation definition, they are not included in this analysis. The FRA <strong>2005</strong> thematicstudy on planted forests provides a more detailed analysis of both forest plantations andthe planted forest component of semi-natural forests (see Chapter 2, Box 2.1).Information availabilityInformation on the area of productive forest plantations forms part of country reportingon forest characteristics. Out of 229 countries, 174 provided information for <strong>2005</strong>and 168 information for all three reporting years: 1990, 2000 and <strong>2005</strong>. The countriesproviding information account for 93 percent of the global forest area (Figure 5.4).Unfortunately, information is missing from many of the smaller islands and areas andfrom many of the countries in the Congo Basin.Some countries experienced difficulty in differentiating between predominantly productiveor protective functions, because their forest plantations are managed for multiple purposes.StatusThe total area of productive forest plantations reported in <strong>2005</strong> was about 109 millionhectares, which corresponds to 2.8 percent of the global forest area. The area by regionand subregion is presented in Table 5.3.FIGURE 5.4Information availability – area of productive forest plantationsEastern and Southern AfricaNorthern AfricaWestern and Central AfricaEast AsiaSouth and Southeast AsiaWestern and Central AsiaEuropeCaribbeanCentral AmericaNorth AmericaOceaniaSouth AmericaWorld0 10 20 30 40 50 60 70 80 90 100Percentage of total forest areaInformation available for all years Information available for latest year Information not available for latest year
Productive functions of forest resources 81TABLE 5.3Area of productive forest plantations <strong>2005</strong>Region/subregion Information availability Area of productiveforest plantationsCountries <strong>Forest</strong> area % of totalreporting (1 000 ha)forest area 1 000 ha % of forest areaEastern and Southern Africa 18 214 589 94.7 2 792 1.3Northern Africa 12 117 193 89.4 6 033 5.1Western and Central Africa 17 99 566 35.8 1 939 1.9Total Africa 47 431 347 67.9 10 764 2.5East Asia 5 244 862 100.0 30 006 12.3South and Southeast Asia 17 283 126 100.0 11 825 4.2Western and Central Asia 23 43 579 100.0 2 591 5.9Total Asia 45 571 567 100.0 44 422 7.8Total Europe 36 983 907 98.3 21 469 2.2Caribbean 12 4 090 68.5 280 6.9Central America 7 22 411 100.0 240 1.1North America 4 677 464 100.0 17 133 2.5Total North and Central America 23 703 965 99.7 17 653 2.5Total Oceania 11 203 455 98.6 3 833 1.9Total South America 12 783 827 94.3 11 326 1.4World 174 3 678 069 93.1 109 469 3.0Subregions reporting the greatest area of productive forest plantations are EastAsia, Europe and North America, together accounting for about 63 percent of globalproductive forest plantations. In East Asia most of the plantations are found in China,and in North America in the United States.Subregions reporting the least area of productive forest plantations are the Africansubregions, the Caribbean, Central America and Western and Central Asia.In many subregions, the majority of the productive forest plantations are found injust a few countries. In the East Asia subregion, 95 percent of the productive forestplantations are found in China. In South and Southeast Asia, 68 percent are in India,Indonesia, Malaysia and Thailand. In Western and Central Asia, 98 percent are foundin the Islamic Republic of Iran and in Turkey. Canada, which acknowledges that it hasforest plantations, had insufficient data for area reporting. Thus in North America,99.6 percent of the reported forest plantations are in the United States. In Easternand Southern Africa, 51 percent are in South Africa; in Western and Central Africa,71 percent are in Côte d’Ivoire, Nigeria, Rwanda and Senegal; and in Northern Africa,96 percent are in Ethiopia, Morocco and the Sudan. The Russian Federation has55 percent of the productive forest plantations in Europe; Australia and New Zealand93 percent of those in Oceania; and Argentina, Brazil and Chile 82 percent of those inSouth America.The ten countries with the greatest area of productive forest plantations accountfor 79.5 million hectares or 73 percent of the total global area of productive forestplantations (Figure 5.5). China, the United States and the Russian Federation togetheraccount for more than half the world’s productive plantations.TrendsTrends were reported for the 168 countries providing information for all three reportingyears. The main results of this analysis are presented in Table 5.4.At the global level, the area of productive forest plantations increased by2.0 million hectares per year during 1990–2000, and by 2.5 million hectares per yearduring 2000–<strong>2005</strong>, an increase of 23 percent compared with the 1990–2000 period. Inrelative terms, productive forest plantations accounted for 1.9 percent of total globalforest area in 1990, 2.4 percent in 2000 and 2.8 percent in <strong>2005</strong>.
82<strong>Global</strong> <strong>Forest</strong> <strong>Resources</strong> <strong>Assessment</strong> <strong>2005</strong>FIGURE 5.5Ten countries with largest area of productive forest plantations <strong>2005</strong>(%)China 26United States 16Russian Federation 11Brazil 5Sudan 4Indonesia 3Chile 2Thailand 2France 2Turkey 2Remaining countries 27TABLE 5.4Trends in area of productive forest plantations 1990–<strong>2005</strong>Region/subregion Information availability (all 3 years) Area of productive Annual changeforest plantations(1 000 ha)Countries <strong>Forest</strong> area % of total (1 000 ha)reporting (1 000 ha)forest area 1990–2000 2000–<strong>2005</strong>1990 2000 <strong>2005</strong>Eastern and Southern Africa 18 214 589 94.7 2 544 2 712 2 792 17 16Northern Africa 12 117 193 89.4 6 404 6 158 6 033 -25 -25Western and Central Africa 16 99 414 35.8 1 099 1 453 1 853 35 80Total Africa 46 431 195 67.9 10 046 10 323 10 679 28 71East Asia 5 244 862 100.0 17 909 23 028 30 006 512 1 396South and Southeast Asia 17 283 126 100.0 8 896 10 750 11 825 185 215Western and Central Asia 22 43 443 99.7 2 120 2 428 2 583 31 31Total Asia 44 571 430 100.0 28 925 36 206 44 414 728 1 642Total Europe 34 978 682 97.7 16 643 19 818 21 467 318 330Caribbean 12 4 090 68.5 239 243 280 0 7Central America 7 22 411 100.0 51 183 240 13 12North America 4 677 464 100.0 10 305 16 285 17 133 598 170Total North and Central America 23 703 965 99.7 10 595 16 711 17 653 612 189Total Oceania 10 203 284 98.6 2 447 3 456 3 812 101 71Total South America 11 768 723 92.4 8 221 10 547 11 326 233 156World 168 3 657 281 92.5 76 826 97 061 109 352 2 018 2 458Note: As some countries did not report a complete series, figures for <strong>2005</strong> are slightly different from those presented in thepreceding table.All subregions except Northern Africa show an increase in productive forestplantations. However, the annual change varies considerably among subregions.The greatest increase by far is in East Asia, mainly due to the reported large-scaleestablishment of forest plantations in China.Table 5.5 presents trends for the ten countries with the largest area of productiveforest plantations. Table 5.6 shows trends for the ten countries with the greatest annualincrease in productive plantations.China reported the greatest annual increase for the last five-year period, followed bythe Russian Federation and the United States. These three countries together accountfor 71 percent of the global annual increase in productive forest plantations.
Productive functions of forest resources 83TABLE 5.5Ten countries with largest area of productive forest plantations 1990–<strong>2005</strong>Country/area Area of productive Annual Annualforest plantations change change rate(1 000 ha)(1 000 ha)(%)1990 2000 <strong>2005</strong> 2000–<strong>2005</strong> 2000–<strong>2005</strong>China 17 131 21 765 28 530 1 353 5.6United States 10 305 16 274 17 061 157 0.9Russian Federation 9 244 10 712 11 888 235 2.1Brazil 5 070 5 279 5 384 21 0.4Sudan 5 347 4 934 4 728 -41 -0.8Indonesia 2 209 3 002 3 399 79 2.5Chile 1 741 2 354 2 661 61 2.5Thailand 1 979 1 996 1 997 n.s. n.s.France 1 842 1 936 1 968 6 0.3Turkey 1 459 1 763 1 916 31 1.7TABLE 5.6Ten countries with greatest annual increase in productive forest plantation area 1990–<strong>2005</strong>Country/area Area of productive Annual Annualforest plantations change change rate(1 000 ha)(1 000 ha)(%)1990 2000 <strong>2005</strong> 2000–<strong>2005</strong> 2000–<strong>2005</strong>China 17 131 21 765 28 530 1 353 5.6Russian Federation 9 244 10 712 11 888 235 2.1United States 10 305 16 274 17 061 157 0.9Viet Nam 664 1 384 1 792 82 5.3Indonesia 2 209 3 002 3 399 79 2.5Chile 1 741 2 354 2 661 61 2.5Australia 1 023 1 485 1 766 56 3.5Portugal 383 867 1 067 40 4.2Republic of Korea 748 1 188 1 364 35 2.8Turkey 1 459 1 763 1 916 31 1.7GROWING STOCK AND COMMERCIAL GROWING STOCK<strong>Forest</strong> growing stock has traditionally been a key indicator of forest capacity for woodproduction and has formed part of global forest resources assessments since the verybeginning. Although FRA <strong>2005</strong> broadened its scope to cover a range of forest benefits,growing stock was still a fundamental piece of information in this assessment, as wellas being the basis for estimating biomass and carbon stocks for most countries.Information from each country on total growing stock and forest area was used toestimate the growing stock per hectare. This is a good indicator of how well-stockedforests are, and the trends in this parameter indicate whether forests are becoming lessor better stocked.FRA <strong>2005</strong> also collected country information on commercial growing stock, i.e. theamount of wood that is considered commercial or potentially commercial. Usually,the commercial growing stock of a country refers to the volume of commercial treesgrowing in forests where the harvesting of wood is permitted.Information availabilityOf the 229 countries and areas covered by FRA <strong>2005</strong>, 147 countries reported on growingstock for all three years, constituting 88 percent of global forest area (Figure 5.6). Inmost regions, countries have reported well. Only one region – Oceania – shows lowreporting on growing stock (15 percent), because Australia did not provide information
84<strong>Global</strong> <strong>Forest</strong> <strong>Resources</strong> <strong>Assessment</strong> <strong>2005</strong>on this indicator. With a few exceptions, reporting countries furnished information forall three reporting years. As regards commercial growing stock, 107 countries providedinformation for all three years (Figure 5.7).Although many countries provide information on growing stock, the quality ofthe information is variable. A few countries with repeated national forest assessmentshave very reliable information, but many countries do not have good inventory data tosupport growing stock estimates and changes in growing stock over time. In many cases,FIGURE 5.6Information availability – growing stockEastern and Southern AfricaNorthern AfricaWestern and Central AfricaEast AsiaSouth and Southeast AsiaWestern and Central AsiaEuropeCaribbeanCentral AmericaNorth AmericaOceaniaSouth AmericaWorld0 10 20 30 40 50 60 70 80 90 100Percentage of total forest areaInformation available for all years Information available for latest year Information not available for latest yearFIGURE 5.7Information availability – commercial growing stockEastern and Southern AfricaNorthern AfricaWestern and Central AfricaEast AsiaSouth and Southeast AsiaWestern and Central AsiaEuropeCaribbeanCentral AmericaNorth AmericaOceaniaSouth AmericaWorld0 10 20 30 40 50 60 70 80 90 100Percentage of total forest areaInformation available for all years Information available for latest year Information not available for latest year
Productive functions of forest resources 85a single estimate of growing stock per hectare has been used for all reporting years.Furthermore, the original data on which the estimates are based are often old and notrepresentative of all forests in the country.FRA <strong>2005</strong> defines growing stock as the standing volume of trees with a diameter atbreast height (DBH) of at least 10 cm. However, countries may use national diameterthresholds if the limits are thoroughly documented. This helps countries report dataconsistently over time and allows for better trend estimates. The trade-off is thatcomparisons between individual countries become more difficult and that large,forest-rich countries with non-standard diameter thresholds may affect regional andsubregional averages.The analysis of growing stock as presented in Table 5.7 is based directly on thedata provided in country reports. No further calculations were done to harmonize thefigures to a common diameter threshold.StatusIn order to obtain global, regional and subregional estimates of total growing stock,the stock per hectare was estimated for each subregion for those countries providinginformation. These estimates were then applied to the total forest area of the subregion.Regional and global estimates were obtained by combining the subregional estimates.Table 5.7 shows growing stock and growing stock per hectare for <strong>2005</strong>. Total globalgrowing stock is estimated at 434 billion m 3 , of which about 30 percent is found in SouthAmerica.The global average for growing stock per hectare is 110 m 3 per hectare. South America,with 155 m 3 per hectare, and Western and Central Africa, with 189 m 3 per hectare, aresignificantly higher than average owing to some forest-rich countries reporting highvolume (Brazil and the Democratic Republic of the Congo). Oceania, with 36 m 3 perhectare, is significantly lower than average, but few countries are reporting in this regionand its estimates are heavily influenced by Papua New Guinea. This country reportedlow volume per hectare because it only included trees with a DBH above 50 cm in itsgrowing stock estimates. Most countries with well-stocked forests are found in Europe.Of the 11 countries reporting an average growing stock of more than 250 m 3 per hectare,eight are in central Europe.TABLE 5.7<strong>Forest</strong> area and growing stock <strong>2005</strong>Region/subregion <strong>Forest</strong> area Growing stock(1 000 ha)million m³m³/haEastern and Southern Africa 226 534 10 015 44Northern Africa 131 048 2 523 19Western and Central Africa 277 829 52 420 189Total Africa 635 412 64 957 102East Asia 244 862 19 743 81South and Southeast Asia 283 127 24 202 85Western and Central Asia 43 588 3 166 73Total Asia 571 577 47 111 82Total Europe 1 001 394 107 264 107Caribbean 5 974 441 74Central America 22 411 2 906 130North America 677 464 75 235 111Total North and Central America 705 849 78 582 111Total Oceania 206 254 7 361 36Total South America 831 540 128 944 155World 3 952 025 434 219 110
86<strong>Global</strong> <strong>Forest</strong> <strong>Resources</strong> <strong>Assessment</strong> <strong>2005</strong>The five countries with the greatest total growing stock (Figure 5.8) account foralmost 261 billion m 3 , which corresponds to 60 percent of the global total. Of these,Brazil has the largest growing stock, with 81 billion m 3 or 19 percent of the total.Information on commercial growing stock was provided by 113 countries. For eachsubregion, commercial growing stock was estimated as a percentage of the total growingstock of reporting countries, and these percentages were applied to the total growingstock estimates for each subregion. The results are presented in Table 5.8.<strong>Global</strong> commercial growing stock amounts to some 202 billion m 3 , which representsabout 47 percent of total growing stock. In absolute terms, Europe and North andCentral America account for about 130 billion m 3 or 64 percent of global commercialgrowing stock. In relative terms, there are some important regional differences.Commercial growing stock constitutes a lower percentage of total growing stock intropical regions (e.g. Africa, Central America and South America) than in temperateregions (East Asia, Europe and North America). This is mainly because of differencesin the characteristics of the forests in terms of species diversity and different harvestingregimes. Tropical forests are very rich in species of which only a few are consideredFIGURE 5.8Five countries with greatest total growing stock <strong>2005</strong>(%)Brazil 19Russian Federation 19United States 8Canada 8Democratic Republic of the Congo 7Remaining countries 40TABLE 5.8Commercial growing stock <strong>2005</strong>Region/subregion % of total growing stock million m³Eastern and Southern Africa 22 2 234Northern Africa 30 767Western and Central Africa 26 13 407Total Africa 25 16 408East Asia 86 17 065South and Southeast Asia 34 8 160Western and Central Asia 60 1 890Total Asia 58 27 115Total Europe 57 61 245Caribbean 64 283Central America 19 563North America 89 66 968Total North and Central America 86 67 815Total Oceania 51 3 751Total South America 20 25 992World 47 202 325
Productive functions of forest resources 87commercial, and harvesting is usually carried out through selective logging in whichonly trees above a certain minimum diameter are cut. Temperate forests are dominatedby a smaller number of species of which many are commercial. Moreover, the harvestingregime in temperate forests is generally not based on minimum diameters, which meansthat most of the growing stock in areas available for wood supply can be consideredcommercial.TrendsTables 5.9 and 5.10 show trends by region and subregion for growing stock perhectare, total growing stock and commercial growing stock. At the global level, there isa slight decrease in total growing stock for the reporting period. There are some regionaltendencies: Africa, Asia, Oceania and South America show a slight decrease, while Europeand North and Central America show a slight increase.As regards growing stock per hectare, changes at the global level are not significant.At regional and subregional levels, however, there are more significant changes. Forexample, Europe, excluding the Russian Federation, shows a net increase of 1.2 m 3 perhectare annually for the last 15-year period, while South and Southeast Asia show a netdecrease of 1.0 m 3 per hectare annually, mainly due to a decrease in growing stock perhectare in Indonesia.Changes in total growing stock reflect the combined effects of changes in forest areaand in growing stock per hectare. However, for many countries, changes in growingstock only reflect the changes in forest area, because their estimates of growing stockare based on a single figure per hectare determined at one point in time. Thus the actualtrends may be more pronounced than what is seen in this analysis.The trends for commercial growing stock are shown in Table 5.10. At the globallevel, there is a small decrease in commercial growing stock, mainly due to the decreasein Europe during 1990–2000. The other regions show only small changes. Whencommercial growing stock is expressed as a percentage of total growing stock, theglobal pattern is the same, although some subregions (e.g. the Caribbean and South andSoutheast Asia) show more pronounced trends.TABLE 5.9Trends in growing stock and growing stock per hectare 1990–<strong>2005</strong>Region/subregionGrowing stockAnnualchange ratemillion m³ m³/ha (m³/ha/ha)1990 2000 <strong>2005</strong> 1990 2000 <strong>2005</strong> 1990–<strong>2005</strong>Eastern and Southern Africa 11 035 10 346 10 015 44 44 44 n.s.Northern Africa 2 771 2 607 2 523 19 19 19 n.s.Western and Central Africa 55 566 53 218 52 420 185 187 189 0.3Total Africa 69 373 66 171 64 957 99 101 102 0.2East Asia 15 850 18 433 19 743 76 82 81 0.3South and Southeast Asia 32 615 27 296 24 202 101 92 85 -1.0Western and Central Asia 2 959 3 105 3 166 69 71 73 0.3Total Asia 51 423 48 834 47 111 90 86 82 -0.5Total Europe (incl. Russian Federation) 102 063 105 374 107 264 103 106 107 0.3Total Europe (excl. Russian Federation) 22 024 25 103 26 785 124 135 141 1.2Caribbean 328 403 441 61 71 74 0.8Central America 3 585 3 097 2 906 130 130 130 n.s.North America 72 542 74 227 75 235 107 109 111 0.3Total North and Central America 76 455 77 727 78 582 108 110 111 0.3Total Oceania 7 593 7 428 7 361 36 36 36 n.s.Total South America 138 344 133 467 128 944 155 157 155 n.s.World 445 252 439 000 434 219 109 110 110 n.s.
88<strong>Global</strong> <strong>Forest</strong> <strong>Resources</strong> <strong>Assessment</strong> <strong>2005</strong>TABLE 5.10Trends in commercial growing stock 1990–<strong>2005</strong>Region/subregionCommercial growing stockmillion m³ % of total growing stock1990 2000 <strong>2005</strong> 1990 2000 <strong>2005</strong>Eastern and Southern Africa 2 519 2 321 2 234 23 22 22Northern Africa 754 762 767 27 29 30Western and Central Africa 13 336 13 162 13 407 24 25 26Total Africa 16 609 16 245 16 408 24 25 25East Asia 14 013 15 976 17 065 88 87 86South and Southeast Asia 12 705 9 717 8 160 39 36 34Western and Central Asia 1 813 1 867 1 890 61 60 60Total Asia 28 531 27 561 27 115 55 56 58Total Europe 66 063 60 648 61 245 65 58 57Caribbean 175 245 283 53 61 64Central America 717 599 563 20 19 19North America 64 816 66 376 66 968 89 89 89Total North and Central America 65 709 67 220 67 815 86 86 86Total Oceania 3 849 3 777 3 751 51 51 51Total South America 28 059 26 666 25 992 20 20 20World 208 820 202 116 202 325 47 46 47REMOVALS OF WOOD PRODUCTSWood products removed from forests and other wooded land constitute an importantcomponent of the productive function. The volume of wood removed indicatesthe economic and social utility of forest resources to national economies and localcommunities. This information contributes to monitoring the use of forest resources bycomparing actual removal with the sustainable potential.Wood removals are influenced by a number of factors. The following ones should beconsidered in order to better understand the removal figures from various countries:• organizational issues, such as legal forms of harvesting, ownership of forest landand logging companies, and availability of forest management plans;• harvesting systems (clear-cut, polycyclic, diameter limit and species grouping),practices and intensity; illegal logging; and the environmental impact ofharvesting;• institutional framework conditions, which may differ among countries in terms oftimber extraction fees, forest law compliance, subsidies and incentives for forestmanagement or non-transparent concession agreements;• governance issues and the ability to detect and prevent illegal logging.In FRA <strong>2005</strong>, reported wood removals from forests and other wooded land coverboth industrial roundwood and fuelwood. The data on fuelwood are included becausewood is the main source of fuel for cooking and heating in many parts of the world.For 1990 and 2000, the data reported are five-year averages for 1988–1992 and1998–2002 respectively. The data for <strong>2005</strong> are forecasts, taking into account the mostrecent country information available.Information availabilityA total of 167 countries reported on wood removals (Figure 5.9). In terms of forestarea, they account for about 99 percent at the global level; non-reporting countries aremostly those with little or no forest area. One reason for the high reporting rate maybe that available <strong>FAO</strong>STAT data on wood removals were provided to countries for useif no new and better data were available.
Productive functions of forest resources 89FIGURE 5.9Information availability – wood removalsEastern and Southern AfricaNorthern AfricaWestern and Central AfricaEast AsiaSouth and Southeast AsiaWestern and Central AsiaEuropeCaribbeanCentral AmericaNorth AmericaOceaniaSouth AmericaWorld0 10 20 30 40 50 60 70 80 90 100Percentage of total forest areaInformation available for all years Information available for latest year Information not available for latest year<strong>Global</strong>ly, quantitative data on wood removals are often based on population figuresand consumption estimates, and are weak for this reason. In particular, reportedfuelwood removals from several tropical forest countries with significant forest coverand large populations show remarkable deviations from the figures reported by othersources, e.g. <strong>FAO</strong>STAT. Such deviations between sources indicate that there areuncertainties that should be considered in using these figures.Countries usually do not report illegal removals and informal fuelwood gathering,and thus the figures for removals might be much higher than those reported.StatusWood removals for <strong>2005</strong> by region and subregion are presented in Table 5.11. <strong>Global</strong>wood removals in <strong>2005</strong> amount to just over 3 billion m 3 , of which about 60 percent isindustrial roundwood and 40 percent fuelwood. These figures refer to forest only. Anadditional 7 million m 3 of fuelwood globally was reported from other wooded land.However, the data behind this figure come from a small number of countries and thusdo not allow for a breakdown by region and subregion.In Africa, the Caribbean, Central America and South and Southeast Asia, removalsare mainly fuelwood, while in Central and North America, East Asia, Europe andOceania, removals are mainly industrial roundwood.Some 40 countries account for up to 90 percent of the removals in tropical forests.The five countries reporting the highest figures on wood removals account for45 percent of total global removals (Figure 5.10).TrendsThe trend figures in Table 5.12 are based on those countries that reported a completetime series on wood removals. <strong>Global</strong> removals show a relatively stable development,without significant changes over the last 15 years. Nor did the proportion betweenindustrial roundwood and fuelwood (60 to 40 percent) change significantly betweenreporting periods.
90<strong>Global</strong> <strong>Forest</strong> <strong>Resources</strong> <strong>Assessment</strong> <strong>2005</strong>TABLE 5.11Wood removals <strong>2005</strong>Region/subregion Industrial roundwood Fuelwood Total removalsmillion m³ million m³ % of total million m³Eastern and Southern Africa 34 151 82 185Northern Africa 8 173 96 181Western and Central Africa 36 267 88 303Total Africa 79 591 88 670East Asia 115 56 33 171South and Southeast Asia 44 113 72 157Western and Central Asia 15 20 57 34Total Asia 174 189 52 362Total Europe 543 139 20 681Caribbean 4 16 82 19Central America 4 40 90 45North America 717 56 7 773Total North and Central America 725 112 13 837Total Oceania 54 10 15 64Total South America 225 173 44 398World 1 799 1 214 40 3 013FIGURE 5.10Five countries with largest volume of wood removals <strong>2005</strong>(%)United States 18Brazil 10Canada 7Russian Federation 6China 4Remaining countries 55Eastern and Southern African countries reported steadily increasing wood removals:from 153 million m 3 in 1990 to 185 million m 3 in <strong>2005</strong>. Only Madagascar reported adecrease, owing to a reduction in removals of fuelwood. Northern, Western and CentralAfrica also show a steady increase in removals, with the African continent as a wholereporting an escalation from 499 million m 3 (1990) to 661 million m 3 (<strong>2005</strong>).East Asia reported a decline in removals, caused primarily by a significant decrease inChina as the result of a logging ban. Decreases were also reported in India, Indonesia andMalaysia in the South and Southeast Asia region. For Asia as a whole, the reduction inremovals was significant, from 454 million m 3 in 1990 down to 362 million m 3 in <strong>2005</strong>.Some European countries show a slight decrease, mainly due to reduced removals offuelwood in certain countries. However, after a decrease in the 2000 reporting period,the figures are again moving towards the level of 1990.North and Central America show a very stable development over the last 15 years:Removals decreased slightly from 855 million m 3 in 1990 to 837 million m 3 in <strong>2005</strong>.
Productive functions of forest resources 91TABLE 5.12Trends in wood removals 1990–<strong>2005</strong>Region/subregionWood removals(million m³)Industrial roundwood Fuelwood Total1990 2000 <strong>2005</strong> 1990 2000 <strong>2005</strong> 1990 2000 <strong>2005</strong>Eastern and Southern Africa 29 32 34 125 146 151 153 177 185Northern Africa 6 7 8 134 159 170 140 166 178Western and Central Africa 19 29 33 187 242 264 206 272 297Total Africa 54 69 75 445 547 585 499 616 661East Asia 131 116 115 70 60 56 201 176 171South and Southeast Asia 94 62 44 118 113 113 212 175 157Western and Central Asia 14 14 15 27 22 19 41 36 34Total Asia 239 192 174 215 195 189 454 387 362Total Europe 606 488 535 138 126 136 743 614 672Caribbean 4 3 4 17 16 16 20 20 19Central America 3 4 4 30 37 40 32 42 45North America 697 716 717 105 56 56 802 772 773Total North and Central America 703 724 725 151 109 112 855 833 837Total Oceania 34 47 54 10 12 10 44 59 64Total South America 144 207 224 302 183 173 446 390 398World 1 780 1 726 1 787 1 261 1 173 1 206 3 041 2 899 2 993Note: As some countries did not report a complete series, figures for <strong>2005</strong> are slightly different from those presented in thepreceding table.A steady increase was reported for Oceania. Australia, New Zealand and Papua NewGuinea account for most wood removals, which have gone from 44 million m 3 in 1990to 64 million m 3 in <strong>2005</strong>, owing to an increase in industrial roundwood. South Americareported a significant reduction, from 446 million m 3 in 1990 to 398 million m 3 in <strong>2005</strong>.REMOVALS OF NON-WOOD FOREST PRODUCTSThere has been growing recognition of – and expectations for – the role of NWFPsas an integral part of sustainable forest management in developed and developingcountries. <strong>FAO</strong> has defined NWFPs as follows: “Non-wood forest products consist ofgoods of biological origin other than wood, derived from forests, other wooded landand trees outside forests.” They perform a crucial role in meeting the subsistence needsof a large part of the world’s population living in or near forests and in providing themwith supplementary income-generating opportunities.A wide variety of products are collected from forests, woodlands and trees outsideforests – a major portion of which are consumed by households or sold locally, whilesome find export markets. Various products have been domesticated and are beingcultivated; in fact, the border between NWFPs and agricultural crops is becomingincreasingly blurred. The absence of a uniform classification system and limitedhuman/financial resources in the national institutions dealing with NWFPs make thegathering and reporting of data a challenge.Understanding the potential contribution of NWFPs to sustainable rural development,especially in poverty alleviation and food security, requires good statistical data, whichin most cases are gathered sporadically and are often unreliable. However, <strong>FAO</strong>recognizes the importance of NWFPs to social, economic and environmental contextsand is attempting to draw a global picture based on the best available information. Forthis reason, FRA 2000, for the first time, included a section on the status of NWFPs,and FRA <strong>2005</strong> seeks to provide additional quantitative information on the amount andvalue of NWFP removals.
92<strong>Global</strong> <strong>Forest</strong> <strong>Resources</strong> <strong>Assessment</strong> <strong>2005</strong>Information availabilitySystematic data collection on NWFPs at the national level is rare, although theirsignificant contribution to local livelihoods is well understood empirically. ForFRA <strong>2005</strong>, countries were asked to report on removals of 16 categories of NWFPs.In total, 71 countries reported data on removals of at least one NWFP category, andmany of these reported for one reporting year only. Many countries did not report any dataor only for one or a few categories. Even where national statistics exist, all removals are notalways recorded, so the figures reported are in many cases considered underestimates.Figure 5.11 shows the availability of information in terms of the forest area thatNWFP reporting countries represent. At the global level, they encompass 63 percentof total forest area. East Asia and Europe have better availability, and the reportingcountries in these subregions cover more than 90 percent of the forest area.Figure 5.12 shows the availability of information for each specific category ofNWFP. Four categories show significantly higher information availability than theothers: food, raw materials for medicine and aromatic products, exudates and otherplant products. Still, the countries reporting on these four categories only represent45–55 percent of the global forest area. For the remaining categories, the availabilityof information is weak, at least at the global level.Most of the removal data provided are based mainly on commercial figures, butmany NWFPs are used and consumed non-commercially. Thus it is assumed that thereal removal figures are considerably higher than those provided for FRA <strong>2005</strong>.Regarding the quality of the information, it is important to bear in mind that thefigures given in the country reports (even though reported using the same template)may reflect differences in the way data were collected. Asia and Europe show thegreatest availability of information. In fact, Asia has traditionally used NWFPs andoften includes them in official national accounts and international trade statistics.This is not generally the case in other regions. Thus aggregation of the reportedfigures and the drawing of any far-reaching conclusions should be avoided or donewith extreme care.FIGURE 5.11Information availability – NWFP removalsEastern and Southern AfricaNorthern AfricaWestern and Central AfricaEast AsiaSouth and Southeast AsiaWestern and Central AsiaEuropeCaribbeanCentral AmericaNorth AmericaOceaniaSouth AmericaWorld0 10 20 30 40 50 60 70 80 90 100Percentage of total forest areaInformation available for all years Information available for latest year Information not available for latest year
Productive functions of forest resources 93FIGURE 5.12Information availability – NWFP removals by product categoryPlant productsFoodFodderMedicine/aromaticColourants/dyesUtensils/crafts/constructionOrnamental plantsExudatesOther plant productsAnimal productsLiving animalsHides, skins and trophiesHoney and beeswaxBushmeatMedicineColourantsOther edible animal productsOther non-edible animalproducts0 10 20 30 40 50 60 70 80 90 100Percentage of total forest areaInformation available for all years Information available for latest year Information not available for latest yearTABLE 5.13Removals of four categories of NWFPs (plant products) <strong>2005</strong> (tonnestonnes)Region Food Raw material for medicine Exudates Other plant productsand aromatic productsAfrica 88 823 20 400 12 757 11 175Asia 3 562 991 90 181 1 495 663 606 782Europe 272 418 6 530 2 216 231 765North and Central America 6 443 2 867 38 733 149 231Oceania - 38 0 5 900South America 348 259 1 490 17 315 291 966World 4 278 935 121 505 1 566 684 1 296 819StatusTable 5.13 indicates the four categories of NWFP removals for which the mostinformation is available. As quantities have been calculated for reporting countries only,the regional and world totals are underestimates.According to the figures reported to FRA <strong>2005</strong>, among these four best-coveredcategories, Asia accounts for the largest removals. With a share of 74 percent, China hasby far the world’s largest removals of forest plant products for food, consisting mainlyof oil seeds, nuts and bamboo shoots. Other countries with significant removal volumesfor food are India, the Republic of Korea and Pakistan in Asia; the Czech Republic,Finland, Italy and Sweden in Europe; and Brazil in South America.China also accounts for 72 percent of removals in the category of exudates, such astannin extract and raw lacquer, followed by Viet Nam. In the category of plant rawmaterials for medicinal and aromatic uses, India accounts for half of reported globalremovals, mainly consisting of medicinal plants and spices. India also has a 42 percentshare of total removals in the category of other plant products, such as tendu leaves andlac, followed by Brazil and Mexico.
94<strong>Global</strong> <strong>Forest</strong> <strong>Resources</strong> <strong>Assessment</strong> <strong>2005</strong>TABLE 5.14Annual changes for four categories of NWFPs (plant products) per region 1990–<strong>2005</strong> (%)Region Food Medicine/aromatics Exudates Other plant products1990–2000 2000–<strong>2005</strong> 1990–2000 2000–<strong>2005</strong> 1990–2000 2000–<strong>2005</strong> 1990–2000 2000–<strong>2005</strong>Africa -0.2 0.9 -2.4 -4.2 11.0 9.9 4.0 -3.5Asia 6.0 4.8 7.2 0.4 2.6 1.0 0.7 -1.5Europe -0.6 -0.1 -6.9 5.3 -7.4 -13.6 0.4 -0.3North and Central America - - -0.1 0.9 0.3 0.5 0.8 0.7Oceania - - - - - - 1.6 0.3South America -2.7 -1.9 -1.5 -3.1 -6.5 -3.2 1.6 -7.5World 3.9 3.8 3.0 -0.3 2.3 1.0 1.0 -2.9For the remaining categories of NWFPs, information was provided by a limitednumber of countries, so calculation of regional totals is not meaningful. However, someparticular aspects may be highlighted.Fodder removals were reported by only 16 countries. Nevertheless, those countriesreported very large quantities, particularly in Asia, indicating that this is a very importantproduct category, however severely under-reported. Raw materials for utensils, craftsand construction, such as bamboo and rattan, were reported in large quantities fromcountries such as India and Myanmar. Ornamental plants – Christmas trees among them– were reported in large quantities from a number of European countries.Among animal products, a few African and European countries reported largequantities of live animals, hides, skins and trophies, as well as wild honey and beeswax.The reported figures for edible animals (game and bushmeat) are concentrated inEurope, with 98 percent of the global total. It is well known, however, that bushmeatis an important source of food in many African countries, but these reported very fewfigures.TrendsTable 5.14 shows the changes in removals for the four best-covered categories between1990 and 2000 and between 2000 and <strong>2005</strong>. The table is based exclusively on data fromcountries providing values for all three reporting years. Increasing trends are seenfor food and exudates, while both increases and decreases are seen for raw materialsof medicines and aromatics and for other plant products. The increase seen between1990 and 2000 appears to have slowed in recent years, although this may be due to thelimited data available and the use by some countries of figures for 2000 as estimatesfor <strong>2005</strong>.
95Chapter 6Protective functions of forestresourcesOVERVIEWEarly assessments of forest resources were focused on the productive functions offorests, particularly wood supply, as this was the main issue identified by policy-makers.In response to increased awareness in many countries of the important role of forests inproviding environmental services including protection – and consistent with the overallconcept of sustainable forest management – FRA <strong>2005</strong> also evaluates trends in thoseforest resources with a protective function.Each succeeding FRA has given more attention to environmental services. Whiledemand for wood has remained static or increased only slightly and demand for nonwoodforest products (NWFPs) has increased steadily but slowly, the demand forenvironmental services of forests – largely unmonetized – has burgeoned (Leslie, <strong>2005</strong>).Many of these services have to do with the protective role of forests.The world’s forests have many protective functions, some local and some global.Influence on climate. <strong>Forest</strong>s affect climate globally by reflecting less heat back intothe atmosphere than other types of land use that have more bare soil and less green cover.They also play a very significant role in the global carbon cycle that affects global climatechange (see Chapter 2). Locally, in both cities and rural areas, trees provide shade andabsorb heat energy, producing a cooling effect. During the cold season, they obstruct,filter and deflect wind, reducing wind chill. Windbreaks of trees can reduce evaporativelosses from small water bodies. These functions of reducing wind velocity, moderatingsoil temperature and increasing relative humidity are also beneficial in agroforestrysystems (Vergara and Briones, 1987).Protection from wind erosion. Wind-rows and shelterbelts reduce the loss of nutrientrichtopsoil and protect young plants from wind within their zone of influence. They alsohelp stabilize dunes.Coastal protection. Coastal forests, particularly mangroves, reduce shoreline erosionand siltation and the impacts of storm surges and tsunamis. Mangroves also filterand remove some of the nutrients and heavy metals coming from upstream land usesand industry, immobilizing them in the mud – as long as they prove non-toxic to themangroves themselves (Wharton et al., 1976). Salt-spray barriers of salt-tolerant treeshave been planted along windward coasts to protect crops.Protection from avalanches. The Alpine countries in Europe have had much experiencewith protection from snow avalanches by forests and have many forests designated forthis purpose. As more tourism and infrastructure enter the mountain areas of othercountries, this function of forests should be increasingly recognized.Air-pollution filters. Trees perform a valuable role in intercepting and trappingwindborne particulate matter – again, as long as the pollution does not damage orkill them. This is one of the benefits of urban forests and greenbelts. Dust, ash, pollenand smoke that adversely affect human health and visibility can be ‘raked’ from theatmosphere, then washed to the ground by rainfall or snow.Protecting water resources. <strong>Forest</strong>s protect water by reducing surface erosion andsedimentation, filtering water pollutants, regulating water yield and flow, moderatingfloods, enhancing precipitation (e.g. ‘cloud forests’) and mitigating salinity. Additionalinformation on forests and water is presented in a separate thematic study (Box 6.1).
96<strong>Global</strong> <strong>Forest</strong> <strong>Resources</strong> <strong>Assessment</strong> <strong>2005</strong>BOX 6.1FRA <strong>2005</strong> thematic study on forests and waterSince quantitative information on the role of forests in protecting water supply is rare, withfew statistics available, a qualitative thematic study on forests and water was carried outas part of FRA <strong>2005</strong>. The report of the study is being completed for release during 2006. Ithighlights the following main points:Reduction of soil erosion as it affects waterOne of the most effective protective functions of forests is reducing soil erosion by water,which degrades water quality. Soil erosion on sloping land is generally of two major types:surface erosion and ‘mass wasting’. <strong>Forest</strong>s have a beneficial role in both types.Surface erosion includes sheet, rill and small gully erosion, and is at a minimum inforests, with their understorey trees, shrubs and ground cover, and their forest floordebris. In fact, the small trees, understorey and litter protect soil from the impact offalling raindrops (soil dislodgement and splash erosion), overland flow of rainwater as asheet, or channelling into rills and gullies (Hamilton and King, 1983; Wiersum, 1984). It isthe removal of this ground protection, rather than removal of the tree canopy over 10 mhigh, that results in accelerated erosion. These uncompacted forest soils also have thehighest infiltration rates and storage capacities, which reduce the frequency and degreeof overland flow. Any activity that bares or compacts the soil reduces the protective roleof forests to varying degrees, e.g. tree extraction, litter collection, grazing in forestlandand fires. The more intensively forest is used, the greater the potential for erosion. Ifforest harvesting is contemplated, good management can minimize this impact.Mass wasting consists of landslips, slumps and debris flows (landslides) and, again,forests are the most effective vegetative cover for minimizing these soil movements,particularly shallow landslips and slumps. The mechanisms are the root shear strength andthe lowering of pore pressure (O’Loughlin, 1974). Slip-prone areas can be identified inland-use planning, and forest retention is warranted on these sites.Sediment. The product of erosion is sediment, which has adverse impacts duringtransport in flowing water and as a deposit in stream channels or standing water bodies(such as ponds, lakes and reservoirs). Sediment can harm or kill valuable aquatic life; impairwater quality for drinking, domestic use or industry; reduce reservoir capacity for floodcontrol, hydropower, irrigation or low flow augmentation; interfere with navigation;shorten the useful life of hydro-turbines or pumps; and build up river channel beds,aggravating flooding (Hamilton and Pearce, 1991). Thus the protective role of forests inreducing erosion on-site has a far-reaching, off-site effect through reduced sedimentation.Influence on water regulationThe influence of forests and forest alteration on water yield and timing is complex. Whereforests were the original land cover, the protective effect consists in maintaining as faras possible the ‘natural’ flow regime, which inevitably consisted of both flooding andlow flows to which stream channels and associated biota were adjusted. With humanintervention and occupancy, there is a need for better understanding of the forest/waterinteraction. With regard to floods, it is now quite clear that forests reduce stormflowpeaks and delay them better than other land cover, but that this effect occurs close to aforest and diminishes further downstream in the watershed (Hamilton and King, 1983). Onmajor rivers, headwater forests have little or no effect in reducing flood intensity in thedownstream reaches (Hewlett, 1982; <strong>FAO</strong>, <strong>2005</strong>f). But close to the protective forest, thefrequent, lower intensity storms are ameliorated more than with other land covers or landuses, to the benefit of local people.
Protective functions of forest resources 97<strong>Forest</strong>s absorb larger amounts of soil moisture than other vegetation, owing to greatercanopy evaporation and deeper roots. In most cases, tree removal results in greater lowflows during the dry season, but the other protective values are lost if trees are removed“to make more water” (Hamilton and King, 1983). <strong>Forest</strong> removal has at times beenadvocated to increase water availability. Indeed, where reforestation has occurred ingrasslands or semi-arid areas, the water demand by these forests has in some cases beena harmful and unintended consequence. This has led to oversimplified and exaggeratedpopular articles against the use of trees for water regulation.Precipitation-enhancing cloud forestsMontane cloud forests have a special protective role with regard to water resources; theycapture horizontally moving fog moisture in areas of persistent wind-blown clouds. Thiswater capture and the low evapotranspiration of cloud forests add water to the watershedabove normal vertical precipitation. These forests occur in the tropics and subtropics inbands or zones of frequent cloudiness and wind, at elevations of from 2 000–3 000 m oncontinental mountains to as low as 500 m on oceanic islands and in coastal situations. Theadditional water capture ranges from 15–20 percent of ordinary rainfall in humid areas(2 000–3 000 millimetres per year) up to 50–60 percent for exposed ridge tops and areas oflower precipitation (Bruijnzeel and Hamilton, 2000). Where fog/cloud situations exist in dryseasons or locations, 100 percent and higher additions have been recorded.Riparian forestsProtecting stream and river banks from undue horizontal erosion is only one function of abuffer zone of trees along both sides of a watercourse. The buffer area also acts as a filterand depository for sediment, pesticides and fertilizers from upslope land use. It may alsoreduce water temperatures through shading, thereby improving conditions for many formsof aquatic life. Several countries find this protective function so compelling that they haveestablished ‘green stream corridors’ or they protect such corridors through zoning regulations,including mandatory practices in logging. This trend merits being continued and accelerated.<strong>Forest</strong>s mitigating salinitySecondary salinity, as opposed to natural (or primary) salinity, can be caused by theremoval of forests. Reduction of the evapotranspiration of deep-rooted trees causes a risein the water table. In areas in which salts are present in the lower layers of the soil, thishigher water table can bring salts into the root zone and adversely affect plant growth,even proving toxic. This is especially critical where clearing and establishment of cropsis attempted. It is estimated that perhaps 7 percent of the agricultural area of westernAustralia is suffering from such secondary salinization in lands formerly forested (Ghassemi,Jakeman and Nix, 1995). Moreover, saline water draining from such areas can adverselyimpact downstream or downslope usefulness of water. Reforestation in these areas hasmade salinized land useful once again. <strong>Forest</strong>s are thus playing a protective role in areasprone to soil salinization. Wood harvesting, followed by regeneration, should not result insalinity as long as clear-felled areas are not extensive.ConclusionsIn view of the critical importance of water in adequate quantity and quality to meethuman needs, and the direct and indirect roles of forests in protecting these attributes,managers and policy-makers need to consider carefully the impacts of forest removal oralteration and forestation on water resources. To this end, the FRA <strong>2005</strong> thematic study onforests and water sets forth guidelines for each of a number of major situations in whichthe forest/water interaction is strong.
98<strong>Global</strong> <strong>Forest</strong> <strong>Resources</strong> <strong>Assessment</strong> <strong>2005</strong>Many countries have identified forest areas that serve a protective function andhave given them special status, e.g. avalanche protection, watershed reserve, naturalcatchment area or multiple-use management area. Maintenance of these environmentalservices, including protective functions, looms large among the management objectivesof the IUCN Category System for Protected Areas (1994). This is the system ofnomenclature most widely accepted and adopted throughout the world (Table 6.1), andefforts are underway to determine how it can be appropriately applied to the protectivefunctions of the forest estate.<strong>Forest</strong>s in all categories, whether they be in national parks or marine/coastal reserves,perform some of the protective functions discussed above. For example, a watershedreserve might fall within Category I (Strict Protection) or Category VI (ManagedResource Protection Area). Yet not all protected areas have protection of soil and wateras their main objective. Many are primarily established for the conservation of biologicaldiversity or natural/cultural features. Conversely, some forests that have protection astheir primary management objective may not form part of a protected area network, e.g.plantations established to combat desertification. The area of forest in protected areas isthus not necessarily a good measure of the protective functions of forests.Data for two variables in FRA <strong>2005</strong> provide some indication of the role of protectiveforests and are reviewed in this chapter:• area of forest designated for protective purposes (as the primary function or as oneof several functions);• area of protective forest plantations.Limited quantitative information for these variables is available (Figure 6.1), but aninitial evaluation has been made of the importance of the protective functions of forests.TABLE 6.1Protected area categories and management objectivesIUCN World Commission on Protected Areas Categories (IUCN, 1994)I. Strict protectionII.(a) (Strict Nature Reserve)(b) (Wilderness Area)Ecosystem conservation and recreation (National Park)III. Conservation of natural features (Natural Monument)IV. Conservation through active management (Habitat/Species Management Area)V. Landscape/seascape conservation and recreation (Protected Landscape/Seascape)VI. Sustainable use of natural ecosystems (Managed Resource Protected Area)FIGURE 6.1Information availability – protective functions of forest resourcesArea designated primarilyfor protection163 9 57Total area designatedfor protection80 5144Area of protective forestplantations168 6 550 10 20 30 40 50 60 70 80 90 100Percentage of total forest areaInformation available for all years Information available for latest year Information not available for latest yearNote: Figures present number of countries in each category.
Protective functions of forest resources 99KEY FINDINGSIn <strong>2005</strong> the extent of forests with protection as their designated primary functionwas 348 million hectares – or 9 percent of the global forest area. At the same time,1 190 million hectares of forest were identified as having a protective function as one ofthe designated functions (not necessarily the primary function).The findings of FRA <strong>2005</strong> suggest that there is a trend towards increasing identificationand designation of areas for forest protection. For the world as a whole, the percentageof forest with protection as the primary function increased from 8 percent in 1990 to9 percent in <strong>2005</strong> – equivalent to an increase of more than 50 million hectares since 1990.Similarly, the proportion of the world’s forests having a protective function as one ofthe designated functions increased from 61 percent in 1990 to 65 percent in <strong>2005</strong> – or anincrease of close to 60 million hectares.It would seem likely that the trend for a greater proportion of the world’s forests tobe classified as having “a primary function of protection” will continue, and that FRA2010 will show more than 9 percent in this category.On a global basis, the protective forest plantation area increased by 405 000 ha peryear during 1990–2000 and by 330 000 ha per year during 2000–<strong>2005</strong>. The proportionof protective forest plantations increased from 0.63 percent of total forest area in 1990,through 0.75 percent in 2000, to 0.82 percent in <strong>2005</strong>. However, regions and subregionsreported changes that varied markedly.In view of the many protective functions of forests and their growing importance,it is becoming increasingly necessary for countries to gather, analyse and presentinformation on the extent and condition of ‘protective forests’. All forests andwoodlands, even ‘productive’ forests, have varying degrees of protective roles, andthe protective values could often be enhanced by some alteration of the managementregime. While this might result in giving up or expending some direct monetary value(for example, foregoing harvesting on critical sites or upgrading harvesting practices),the value of these environmental services to human welfare, health and economies isbeing increasingly recognized. Environmental or ecological economics is providing newtools for monetizing these services (see, for example, Landell-Mills and Porras, 2002).FRA <strong>2005</strong> is a first attempt at evaluating the importance of the protective functionsof forests at the global level and is based on a limited number of quantitative variables.Nevertheless, these variables all show a positive trend, indicating an increased recognitionof the importance of the protective functions provided by forests.FOREST AREA DESIGNATED FOR PROTECTIVE PURPOSESThis variable indicates to what extent forest areas have been set aside for protectivepurposes, either by legal prescription or by decision of the landowner or manager.<strong>Forest</strong> designation is reported in two ways: ‘primary function’ and ‘total areawith function’. <strong>Forest</strong> areas with a specific, designated function considered to besignificantly more important than other functions are reported as ‘primary function’.All forest areas with a designated function (not necessarily primary) are reported under‘total area with function’.As mentioned previously, it is important to stress that the concept of ‘protectivefunction’ goes beyond the protected area definition, because forests and other woodedland can have a protective function although outside protected areas.Information availabilityOf 229 country reports, 172 contained information on designated primary functionsof forests, together accounting for 95 percent of the world’s forest area (Figure 6.2).Of these, only 134 reported that they had areas specifically designated for protectivepurposes, while several countries reported that they had insufficient information on thisspecific category or they included such areas as part of the category ‘multiple purpose’.
100<strong>Global</strong> <strong>Forest</strong> <strong>Resources</strong> <strong>Assessment</strong> <strong>2005</strong>FIGURE 6.2Information availability – area of forest designated primarily for protectionEastern and Southern AfricaNorthern AfricaWestern and Central AfricaEast AsiaSouth and Southeast AsiaWestern and Central AsiaEuropeCaribbeanCentral AmericaNorth AmericaOceaniaSouth AmericaWorld0 10 20 30 40 50 60 70 80 90 100Percentage of total forest areaInformation available for all years Information available for latest year Information not available for latest yearIn <strong>2005</strong> a total of 85 countries, representing 46.6 percent of the world’s forest area,reported data on total area of forests with a function of protection (not necessarilyprimary) (Figure 6.3). Some countries, for example Japan, stated that all forests areexpected to perform multiple functions. Such countries may not have designated anyland as having a primary function of protection: the entire forest area is expected tohave protective, productive and possibly other functions.Results show an improvement in the overall reporting of countries over the past 15 years.There is a clear prevalence of Asian countries among those reporting data for all threeyears, followed by European countries.StatusThe total extent of forests with protection as their primary function (Table 6.2) wasestimated in <strong>2005</strong> at 348 million hectares, equivalent to 9 percent of total forest area. Asiahas the highest proportion of forests with a primary function of protection (24 percent),followed by South America (11 percent) and Europe (9 percent). The figures for Westernand Central Africa are quite low. This may be due to the fact that only a few countriesin this subregion have reported on the protective function of forests.The relatively small proportion of forests with protection as the primary functionreported in North and Central America (0.5 percent) is due to lack of information onprotection as a primary function from Canada and the United States, which have includedthose areas in the multiple purpose category, identifying that as the primary function.This affects the overall analysis, given the large forest area in these two countries. Asimilar explanation is provided for the very low figure for Oceania: Australia does nothave a classification system that can directly report on the designated function classesused by FRA, and so has included areas with protective functions in the multiple purposecategory.It is also useful to consider the reporting of data on the total area of forest for whicha specific function of protection has been designated, regardless of whether it is primaryor not. <strong>Global</strong>ly, a total forest area of 1 190 million hectares was identified as having a
Protective functions of forest resources 101FIGURE 6.3Information availability – total area of forest designated for protectionEastern and Southern AfricaNorthern AfricaWestern and Central AfricaEast AsiaSouth and Southeast AsiaWestern and Central AsiaEuropeCaribbeanCentral AmericaNorth AmericaOceaniaSouth AmericaWorld0 10 20 30 40 50 60 70 80 90 100Percentage of total forest areaInformation available for all years Information available for latest year Information not available for latest yearTABLE 6.2Area of forest designated primarily for protection <strong>2005</strong>Region/subregion Information availability Area of forest designatedprimarily for protectionCountries <strong>Forest</strong> area % of totalreporting (1 000 ha)forest area 1 000 ha % of forest areaEastern and Southern Africa 16 211 181 93.2 6 018 2.8Northern Africa 13 125 667 95.9 12 567 10.0Western and Central Africa 15 118 280 42.6 2 206 1.9Total Africa 44 455 129 71.6 20 791 4.6East Asia 5 244 862 100.0 66 992 27.4South and Southeast Asia 17 283 126 100.0 59 097 20.9Western and Central Asia 23 43 579 100.0 13 069 30.0Total Asia 45 571 567 100.0 139 158 24.3Total Europe 36 991 192 99.0 90 488 9.1Caribbean 9 3 489 58.4 1 291 37.0Central America 7 22 411 100.0 1 068 4.8North America 4 677 464 100.0 986 0.1Total North and Central America 20 703 364 99.6 3 345 0.5Total Oceania 14 203 467 98.6 502 0.2Total South America 13 831 540 100.0 93 559 11.3World 172 3 756 260 95.0 347 842 9.3protective function in <strong>2005</strong> (Table 6.3). North America has the highest proportion offorests with a protective function, followed by Oceania and Asia.Twenty-five countries reported that all their forests had protection as one of thedesignated functions. These countries are Afghanistan, American Samoa, Austria,Bahrain, Belarus, Canada, the Democratic People’s Republic of Korea, Egypt, Georgia,Guadeloupe, India, Japan, Kuwait, Kyrgyzstan, Libyan Arab Jamahiriya, New Zealand,Quatar, Singapore, Tunisia, Ukraine, United Arab Emirates, United States of America,Uzbekistan, Viet Nam and Wallis and Futuna Islands.
102<strong>Global</strong> <strong>Forest</strong> <strong>Resources</strong> <strong>Assessment</strong> <strong>2005</strong>TABLE 6.3Total area of forest designated for protection <strong>2005</strong>Region/subregion Information availability Total area of forestdesignated for protectionCountries <strong>Forest</strong> area % of totalreporting (1 000 ha)forest area 1 000 ha % of forest areaEastern and Southern Africa 2 77 n.s. 30 39.0Northern Africa 5 4 160 3.2 2 490 59.9Western and Central Africa 5 48 595 17.5 1 516 3.1Total Africa 12 52 831 8.3 4 036 7.6East Asia 5 244 862 100.0 227 343 92.8South and Southeast Asia 17 283 126 100.0 183 714 64.9Western and Central Asia 13 14 176 32.6 13 600 95.9Total Asia 35 542 164 94.9 424 656 78.3Total Europe 22 133 854 13.4 50 371 37.6Caribbean 3 524 8.8 200 38.2Central America 1 4 294 19.2 3 133 73.0North America 3 613 226 90.5 613 225 100.0Total North and Central America 7 618 044 87.6 616 558 99.8Total Oceania 7 10 235 5.0 8 907 87.0Total South America 2 485 761 58.4 85 204 17.5World 85 1 842 890 46.6 1 189 732 64.6TABLE 6.4Trends in area of forest designated primarily for protection 1990–<strong>2005</strong>Region/subregion Information availability Area of forest designated(all 3 years)primarily for protection(1 000 ha)Countries <strong>Forest</strong> area % of totalreporting (1 000)forest area 1990 2000 <strong>2005</strong>Eastern and Southern Africa 15 198 343 87.6 6 440 6 102 5 840Northern Africa 13 125 667 95.9 13 323 12 866 12 567Western and Central Africa 15 118 280 42.6 1 630 2 320 2 206Total Africa 43 442 291 69.6 21 392 21 287 20 613East Asia 5 244 862 100.0 34 763 55 424 66 992South and Southeast Asia 17 283 126 100.0 57 422 58 907 59 097Western and Central Asia 21 43 272 99.3 12 079 12 933 13 047Total Asia 43 571 259 99.9 104 264 127 263 139 136Total Europe 34 984 468 98.3 77 705 89 599 90 098Caribbean 9 3 489 58.4 850 1 085 1 291Central America 7 22 411 100.0 1 344 1 178 1 068North America 4 677 464 100.0 0 1 047 986Total North and Central America 20 703 364 99.6 2 194 3 310 3 345Total Oceania 11 39 593 19.2 413 450 467Total South America 12 816 436 98.2 90 631 93 632 93 559World 163 3 557 412 90.0 296 598 335 541 347 217Note: As some countries did not report a complete series, figures for <strong>2005</strong> are slightly different from thosepresented in Table 6.2.TrendsThe results of the trend analysis, based on those countries that provided information forall three reporting years (1990, 2000 and <strong>2005</strong>), show an overall increase in the area offorests with protection as their primary function, from 8 percent in 1990 to 9 percent in<strong>2005</strong> (Table 6.4 and Figure 6.4). Similarly, there has been an increase in the proportionof the world’s forests with protection as one of the designated functions (not necessarilythe primary one) from 61 percent in 1990 to 65 percent in <strong>2005</strong> – or an increase of58 million hectares in the 80 reporting countries providing information for all years.
Protective functions of forest resources 103FIGURE 6.4Area of forest designated primarily for protection 1990–<strong>2005</strong>(million ha)Eastern and Southern AfricaNorthern AfricaWestern and Central AfricaEast AsiaSouth and Southeast AsiaWestern and Central AsiaEuropeCaribbeanCentral AmericaNorth AmericaOceaniaSouth America0 10 20 30 40 50 60 70 80 90 1001990 2000 <strong>2005</strong>PROTECTIVE FOREST PLANTATIONSRecognizing the important protective role of forests, many countries have plantedsubstantial areas of forests and trees for this purpose. These range from large-scaleforest plantations to stabilize sand dunes and combat desertification to windbreaks andindividual trees planted to provide shade.For FRA <strong>2005</strong>, countries were asked to characterize their forests in five classes:primary, modified natural, semi-natural, protective plantation and productive plantation.While the previous section focused on the total area of forests with a protective function,including both naturally regenerated and planted forests, this section focuses on forestplantations having a primary objective of protection – i.e. the fourth class.Protective forest plantations are defined as those with introduced species and insome cases native species, established through planting or seeding, with few species,even spacing and/or even-aged stands, predominantly for the provision of servicessuch as protection of soil and water, rehabilitation of degraded lands, combatingdesertification, etc.Some countries had difficulty in differentiating whether the purpose of a forestplantation was predominantly productive or protective because of forest plantationmanagement policies for multipurpose or multiple functionality. Protective forestplantations do not totally preclude some harvesting of wood, fibre and other products.It should be noted that this category only captures a subset of all the forests and treesplanted for protective purposes. It does not include, for instance, the planted componentof semi-natural forests (sown or planted native species), windbreaks with a width of lessthan 20 m or an area of less than 0.5 ha or individual trees or groups of trees. A thematicstudy on planted forests, to be released during 2006, complements FRA <strong>2005</strong> with moredetailed data and analysis (see Chapter 2, Box 2.1).Information availabilityOf the 174 countries that provided information on the characteristics of their forests,93 reported protective plantation data for 1990, 103 for 2000 and 101 for <strong>2005</strong>. The
104<strong>Global</strong> <strong>Forest</strong> <strong>Resources</strong> <strong>Assessment</strong> <strong>2005</strong>remaining countries reported that they had no protective forest plantations or wereunable to distinguish between productive and protective plantations.As can be seen in Figure 6.5, data availability is generally good, with all subregionsexcept Western and Central Africa and the Caribbean providing information for morethan 85 percent of the total forest area in the respective subregions.StatusThe global area of protective forest plantations reported in <strong>2005</strong> was 30.1 million hectares(Table 6.5). A few countries dominated their respective regions, including the RussianFIGURE 6.5Information availability – area of protective forest plantationsEastern and Southern AfricaNorthern AfricaWestern and Central AfricaEast AsiaSouth and Southeast AsiaWestern and Central AsiaEuropeCaribbeanCentral AmericaNorth AmericaOceaniaSouth AmericaWorld0 10 20 30 40 50 60 70 80 90 100Percentage of total forest areaInformation available for all years Information available for latest year Information not available for latest yearTABLE 6.5Area of protective forest plantations <strong>2005</strong>Region/subregion Information availability Area of protectiveforest plantationsCountries <strong>Forest</strong> area % of totalreporting (1 000 ha)forest area 1 000 ha % of forest areaEastern and Southern Africa 18 214 589 94.7 66 0.03Northern Africa 12 117 193 89.4 2 192 1.87Western and Central Africa 17 99 566 35.8 112 0.11Total Africa 47 431 347 67.9 2 370 0.55East Asia 5 244 862 100.0 13 160 5.37South and Southeast Asia 17 283 126 100.0 4 809 1.70Western and Central Asia 23 43 579 100.0 2 505 5.74Total Asia 45 571 567 100.0 20 474 3.58Total Europe 36 983 907 98.3 6 027 0.61Caribbean 12 4 090 68.5 170 4.16Central America 7 22 411 100.0 34 0.15North America 4 677 464 100.0 986 0.15Total North and Central America 23 703 965 99.7 1 190 0.17Total Oceania 11 203 455 98.6 32 0.02Total South America 12 783 827 94.3 31 n.s.World 174 3 678 069 93.1 30 125 0.82
Protective functions of forest resources 105Federation, which accounted for 84 percent of all protective forest plantations in Europe;Japan, with 50 percent in Asia; Mexico, with 83 percent in North and Central America;and Algeria and the Sudan, accounting respectively for 31 and 29 percent in Africa. The tencountries with the largest area of protective forest plantations (Figure 6.6) accounted for25.7 million hectares or 85 percent of the global protective forest plantation area.TrendsTrends were reported for those countries that provided data sets for all three reportingyears.On a global basis, the protective forest plantation area increased by 405 000 ha peryear during 1990–2000 and 330 000 ha per year during 2000–<strong>2005</strong>. The proportion ofprotective forest plantations increased from 0.63 percent of total forest area in 1990,through 0.75 percent in 2000, to 0.82 percent in <strong>2005</strong>. However, regions and subregionsreported changes that differed significantly (Table 6.6).FIGURE 6.6Ten countries with largest area of protective forest plantations <strong>2005</strong>(%)Japan 35Russian Federation 17China 9India 7Thailand 4Mexico 3Kazakhstan 3Viet Nam 3Algeria 2Sudan 2Remaining countries 15TABLE 6.6Trends in area of protective forest plantations 1990–<strong>2005</strong>Region/subregion Information availability Area of protective(all 3 years)forest plantations(1 000 ha)Countries <strong>Forest</strong> area % of totalreporting (1 000)forest area 1990 2000 <strong>2005</strong>Eastern and Southern Africa 18 214 589 94.7 66 66 66Northern Africa 12 117 193 89.4 1 840 2 021 2 192Western and Central Africa 16 99 414 35.8 70 87 112Total Africa 46 431 195 67.9 1 975 2 173 2 370East Asia 5 244 862 100.0 11 622 12 490 13 160South and Southeast Asia 17 283 126 100.0 3 869 4 451 4 809Western and Central Asia 22 43 443 99.7 2 175 2 518 2 505Total Asia 44 571 430 100.0 17 666 19 459 20 474Total Europe 34 978 682 97.7 4 569 5 574 6 027Caribbean 12 4 090 68.5 155 151 170Central America 7 22 411 100.0 32 29 34North America 4 677 464 100.0 - 1 047 986Total North and Central America 23 703 965 99.7 187 1 227 1 190Total Oceania 10 203 284 98.6 1 3 21Total South America 11 768 723 92.4 10 27 31World 168 3 657 281 92.5 24 408 28 464 30 114Note: As some countries did not report a complete series, figures for <strong>2005</strong> are slightly different from thosepresented in Table 6.5.
106FRA <strong>2005</strong> main reportTABLE 6.7Ten countries with largest area of protective forest plantations 1990–<strong>2005</strong>Country/area Area of protective Annual Annual changeforest plantations change rate(1 000 ha)(1 000 ha)(%)1990 2000 <strong>2005</strong> 1990–2000 2000–<strong>2005</strong> 1990–2000 2000–<strong>2005</strong>Japan 10 287 10 331 10 321 4.4 -2.0 n.s. n.s.Russian Federation 3 407 4 648 5 075 124.1 85.4 3.2 1.8China 1 335 2 159 2 839 82.4 136.0 4.9 5.6India 1 317 1 890 2 173 57.3 56.6 3.7 2.8Thailand 661 1 081 1 102 42.0 4.2 5.0 0.4Mexico 1 047 986 -12.2 -1.2Kazakhstan 1 034 1 056 909 2.2 -29.4 0.2 -3.0Viet Nam 303 666 903 36.3 47.4 8.2 6.3Algeria 614 644 742 3.0 19.6 0.5 2.9Sudan 764 705 675 -5.9 -5.9 -0.8 -0.8Total Top 10¹ 19 722 24 227 25 725 345.8 299.7 2.1 1.2¹ Does not include Mexico under area for 1990 and under annual change and annual change rate for the period1990–2000.The top ten countries reported markedly varied trends in protective forest plantationarea for 1990–2000 and 2000–<strong>2005</strong> (Table 6.7). Overall, the protective forest plantationarea in these countries increased by 346 000 ha per year 1 for 1990 and by 300 000 haper year during 2000–<strong>2005</strong>. However, it did not increase to the same extent for allcountries.Some countries also had difficulty in reporting the proportion of protective forestplantations as a percentage of total forest plantation area, so trends can also reflectreclassification of existing areas (e.g. Japan), rather than an increase in new protectiveforest plantations.¹ Excluding Mexico, which did not report for 1990.
107Chapter 7Socio-economic functionsOVERVIEW<strong>Forest</strong>s provide a wide range of economic and social benefits to humankind. Theseinclude contributions to the overall economy – for example through employment,processing and trade of forest products and energy – and investments in the forestsector. They also include the hosting and protection of sites and landscapes of highcultural, spiritual or recreational value. Maintaining and enhancing these functions is anintegral part of sustainable forest management.Information on the status of and trends in socio-economic benefits is thus essentialin evaluating progress towards sustainable forest management, together with the moreusual statistics on the predominantly environmental values considered under the otherthemes.Economic benefits are usually measured in monetary terms and may include: incomefrom employment in the sector; the value of the production of goods and services fromforests; and the contribution of the sector to the national economy, energy supplies andinternational trade. In addition, the economic viability or sustainability of the sectorcan be assessed by measures such as the profitability of forest enterprises or the levelof investment.The social functions of forests are often more difficult to measure and can varyconsiderably among countries, depending on their level of development and traditions.For example, in developed, post-industrial societies, the benefits of forests for recreationand amenity values or the maintenance of a rural way of life may be most important,while in developing countries, the area of forests available for subsistence activities orthe number of people employed in the sector may be a better indication of their socialvalue. Given the difficulties of measuring the social benefits of forests, social functionsare often measured in terms of inputs rather than outputs (e.g. the area or proportion offorests used to provide various social functions).All the international processes on criteria and indicators include a section on themonitoring and assessment of socio-economic functions or benefits of the forestry sector.A wide variety of variables may be measured: production and consumption; recreationand tourism; funding and investment in the forest sector; cultural, social and spiritualneeds and values; forestry employment; health and safety; and community needs.In FRA <strong>2005</strong>, countries provided information on four measures of socio-economicfunctions:• Value of wood and non-wood forest product removals. FRA <strong>2005</strong> examinesthe production of primary products, excluding the benefits of downstreamprocessing.• Employment in forestry. Figures refer to employment in forestry activities ratherthan employment in the whole forestry sector (i.e. they exclude employment inprocessing of wood and non-wood forest products) and they only include formalemployment. Countries were asked to provide information for 1990 and 2000 only.No forecasting to <strong>2005</strong> was done.• Ownership of forest and other wooded land. Three classes of ownership wereused: public, private and other. Countries were asked to provide information for1990 and 2000 only. No forecasting to <strong>2005</strong> was done.• Areas of forest designated for social services. Two measures were included: areaof forest for which the provision of social services was designated as the primary
108<strong>Global</strong> <strong>Forest</strong> <strong>Resources</strong> <strong>Assessment</strong> <strong>2005</strong>function and total area of forest for which recreation, education and other socialservices were designated as one of the functions.In general, the measures presented in FRA <strong>2005</strong> are more restrictive than thoseproposed in some international criteria and indicators processes because they refer tobenefits from forests only (rather than benefits from the whole forestry sector, whichinclude downstream processing). No information was requested from countries onsocio-economic indicators related to health and safety, funding, investment, recyclingand contribution to energy supplies, owing to a lack of information on these aspects inmany countries.In general, the availability of information was highest for the area of forest designated fordifferent functions and ownership of forests and lowest for the value of NWFP removals(Figure 7.1). In addition, the quality of information reported on the value of outputs(removals of wood and non-wood forest products) was quite weak in several respects (e.g.incompatible definitions and measurement units, partial responses from some countries,and statistics that contradict other sources or seem otherwise implausible).KEY FINDINGSThe reported value of roundwood removals in <strong>2005</strong> was about US$64 billion, with themajor part of this (US$57 billion) coming from removals of industrial roundwood. Thereported trend shows an increase of about 11 percent over the last 15 years, which is lessthan the rate of inflation over this period. Thus the reported value of removals in realterms has fallen at the global level. At the regional level, North and Central Americaaccounted for about one-third of the total reported value, followed by Europe and Asiawith about one-quarter each. Most regions show an increasing trend in the value ofremovals, with the exception of South America and, in particular, Asia. In part, theseexceptions may be attributed to a shift in the structure of wood supply from harvestingof high-value wood in natural forests to an increase in the supply of lower-value woodfrom forest plantations.FIGURE 7.1Information availability – socio-economic functionsValue of wood removals95 14120Value of non-wood forestproducts removals45 11173Employment115 2391Ownership149 872Area designated primarilyfor social services163 9 570 10 20 30 40 50 60 70 80 90 100Percentage of total forest areaInformation available for all years Information available for latest year Information not available for latest yearNote: Figures present number of countries in each category.
Socio-economic functions 109The reported value of NWFP removals amounted to about US$4.7 billion in <strong>2005</strong>.Of this, plant products accounted for about three-quarters of the reported total, or justunder US$3 billion, with a reported value of US$1.3 billion for food and US$0.5 billionfor other plant products. The most significant animal product was bushmeat, with areported value of US$0.6 billion. Asia and Europe accounted for almost all the totalvalue reported by countries, and the trends at global and regional levels generallyshowed a slight increase from 1990 to 2000. However, the above figures must all betreated with great caution, as the availability and quality of this information appear tobe quite weak and the reported statistics probably cover only a small fraction of the truetotal value of NWFP removals.Countries reported that some 10 million people are employed in forestry. This is adecline of 10 percent compared with the employment figure for 1990. Most of the declinehas occurred in the production of goods and can probably be attributed to increases inlabour productivity. The figures for both periods may include some employment ininformal activities. Although FRA <strong>2005</strong> does not include data on informal employmentor employment in the wood processing industry, it was difficult for some countries toseparate these. Thus, the actual figure for formal employment is probably somewhat lessthan 10 million. However, if the informal sector were to be intentionally included, theimportance of the forestry sector – for rural livelihoods, for example – would be muchhigher than reported here.With respect to ownership of forests and other wooded land, the area of privateownership is increasing, but the majority of the world’s forests remain under publicownership (84 percent of forest and 90 percent of other wooded land). There areconsiderable differences among regions, however, with some having a significantlyhigher proportion of private ownership than others (e.g. North and Central America,Oceania and South America).At the global level, almost 4 percent of forests are managed primarily for recreation,education, tourism and other social services. However, information availability is aproblem in many regions. Europe seems to give the most attention to the social servicesprovided by forest resources through active designation of areas for this purpose.In general, the economic contribution of forests is declining (e.g. the reporteddeclines in employment and in the real value of outputs from the sector), although thesocial contribution of forests may be increasing slightly in some regions (e.g. Europe).However, this does not necessarily indicate that the value of this contribution has fallen.Lower employment reflects increases in labour productivity, and the decline in the valueof output is the result of lower product prices. Both of these changes suggest that thesector is becoming more efficient, which benefits the downstream processing sector andconsumers. Thus the declining contribution can be viewed as an indicator of success.VALUE OF WOOD REMOVALSThe combined value of removals of wood and non-wood forest products is an indicatorof the contribution of forests and woodlands to national economies. This information isused to develop and monitor national policies, set priorities and allocate resources.The present analysis examines the value of wood removals from forests only (i.e. itexcludes other wooded land). It does, however, include the data from eight countries thatprovided information for forests and other wooded land combined (Algeria, Austria,Burkina Faso, Canada, Jamaica, Jordan, Namibia and Niger). Industrial roundwoodand fuelwood were reported separately for FRA <strong>2005</strong> and are analysed separately here.Information availabilityAt the global level, 109 countries, or some 42–47 percent of countries, depending on theyear, reported on the value of industrial roundwood removals, with most reporting forthe year 2000. Similarly, 37–41 percent of countries reported on the value of fuelwood
110<strong>Global</strong> <strong>Forest</strong> <strong>Resources</strong> <strong>Assessment</strong> <strong>2005</strong>removals, also with most reporting for 2000. The countries reporting on either or bothof these figures for <strong>2005</strong> account for almost 80 percent of the global forest area, althoughcountries reporting for all three years account for only half of the area (Figure 7.2).At the regional level, a higher proportion of countries in Asia, Europe and SouthAmerica provided information. In Africa, only about one-third of the countries didso, but almost all of these provided information on the value of both fuelwood andindustrial roundwood removals. In addition, most of the larger countries in Africareported. Similarly, despite the relatively low number of responses from Oceania andNorth and Central America, most of the countries with significant forest areas in thesetwo regions provided some information (e.g. Australia, Canada [1990 and 2000 only],Mexico, New Zealand, Papua New Guinea and the United States).Another indicator of the availability of information is given in Table 7.1. Thisshows the proportion of total global and regional production covered by the countriesFIGURE 7.2Information availability – value of wood removalsEastern and Southern AfricaNorthern AfricaWestern and Central AfricaEast AsiaSouth and Southeast AsiaWestern and Central AsiaEuropeCaribbeanCentral AmericaNorth AmericaOceaniaSouth AmericaWorld0 10 20 30 40 50 60 70 80 90 100Percentage of total forest areaInformation available for all years Information available for latest year Information not available for latest yearTABLE 7.1Proportion of roundwood production in value of wood removals <strong>2005</strong>Region Industrial roundwood production in 2004 Fuelwood production in 2004(million m³)(million m³)Total for Total for Proportion of Total for Total for Proportion ofregion countries total production region countries total productionreporting in countries reporting in countriesvalue reporting value reportingin <strong>2005</strong> values in <strong>2005</strong> values(%) (%)Africa 71 45 64 551 298 54Asia 220 219 100 777 487 63Europe 508 392 77 117 86 74North and Central America 624 426 68 130 110 85Oceania 51 50 99 9 0 0South America 149 146 98 194 172 89World 1 623 1 279 79 1 777 1 153 65Source: based on <strong>FAO</strong>STAT (<strong>FAO</strong>, <strong>2005</strong>a) and national reports.
Socio-economic functions 111providing value statistics for <strong>2005</strong> (<strong>FAO</strong>, <strong>2005</strong>a). As this table shows, the countriesproviding information on the value of industrial roundwood removals accountedfor almost 80 percent of global industrial roundwood production and 65 percent offuelwood production. 1Status<strong>Global</strong>ly, the total reported value of wood removals in <strong>2005</strong> was US$64 billion, withsome US$57 billion from industrial roundwood and a further US$7 billion fromfuelwood (Table 7.2). Although the volume of global fuelwood production is about thesame as the production of industrial roundwood, these figures suggest that the value offuelwood production per cubic metre is roughly one-tenth that of industrial roundwoodproduction, which seems plausible.At the regional level, North and Central America accounted for about one-third thetotal reported value of removals (and it should be noted that Canada is not included inthis figure). Asia and Europe come next, each accounting for about one-quarter of thetotal, followed by Africa, Oceania and South America.The reported value of industrial roundwood removals across the regions follows asimilar pattern. For fuelwood, however, Asia and Africa accounted for more than halfthe total reported value of removals – owing to the great number of people that usefuelwood in these regions (combined with the high population level in Asia). It is alsoworth noting that the reported value of fuelwood removals in Africa amounted to about40 percent of the reported value of all removals, whereas in other regions, the reportedvalue of fuelwood removals amounted to about 20 percent or less of the total.The availability of information about the value of wood removals is quite good, asthe countries providing this information account for a significant proportion of totalglobal production. However, it should be noted that some significant countries reportedthe value of only a part of their total production (e.g. the figures for fuelwood removalsin India and Indonesia were very low).TrendsFor comparability, Table 7.3 includes only information from countries that reportedvalue information for all three years. As a result, values for <strong>2005</strong> may be lower thanthose shown in Table 7.2 (which includes all reporting countries). In addition, Table 7.3does not include values for some significant countries that did not report any figuresor reported for only one or two years (e.g. Canada, which reported for 1990 and 2000only).<strong>Global</strong>ly, the reported trend in the value of wood removals shows a slight increase,from US$53 billion in 1990 to US$55 billion in 2000 and US$59 billion in <strong>2005</strong>. Most ofthis is due to a reported increase in the value of industrial roundwood removals, as thereported value of fuelwood removals has not changed significantly.The above figures amount to an 11 percent increase over the last 15 years. However,these figures have not been adjusted for inflation. After adjusting, the reported value ofwood removals has certainly fallen at the global level during this period.At the regional level, the reported trend in the value of wood removals shows anincrease in all regions except Asia and South America. In particular, the reported trendin Asia shows a significant decline, reflecting the declines reported in some majorcountries (e.g. Indonesia, Japan and Malaysia). In part, this can be attributed to lowerlevels of removals in these countries over the period.¹ However, some countries reported the value of removals for only a portion of their total production.This was particularly a problem for fuelwood removals (e.g. in India and Indonesia). Thus theproportion of global production actually covered by the value statistics is somewhat less than implied.
112<strong>Global</strong> <strong>Forest</strong> <strong>Resources</strong> <strong>Assessment</strong> <strong>2005</strong>TABLE 7.2Value of wood removals <strong>2005</strong>RegionValue(million US$)Industrial roundwood Fuelwood removals Industrial roundwoodremovalsplus fuelwood removalsAfrica 2 748 1 845 4 594Asia 14 366 2 120 16 486Europe 13 858 1 159 15 016North and Central America 19 659 579 20 238Oceania 1 839 n.s. 1 839South America 4 281 1 347 5 628World 56 750 7 050 63 800TABLE 7.3Trends in value of wood removals 1990–<strong>2005</strong>RegionValue(million US$)1990 2000 <strong>2005</strong>Industrial roundwood removalsAfrica 999 1 826 2 361Asia 20 375 15 806 14 365Europe 9 977 8 800 11 832North and Central America 10 313 19 090 19 536Oceania 276 577 660South America 4 697 3 355 4 232World 46 638 49 455 52 986Fuelwood removalsAfrica 968 1 206 1 369Asia 2 010 1 843 2 118Europe 638 633 970North and Central America 554 560 579Oceania n.s. n.s. n.s.South America 2 022 934 1 347World 6 193 5 176 6 383Industrial roundwood plus fuelwood removalsAfrica 1 967 3 032 3 729Asia 23 268 18 411 16 483Europe 10 616 9 433 12 802North and Central America 10 867 19 650 20 116Oceania 276 577 660South America 6 719 4 289 5 579World 53 714 55 391 59 369In South America, the reported value of wood removals declined significantly from1990 to 2000, but has since partly recovered – largely due to changes in Brazil, where thereported value of wood removals has followed a similar pattern. The level of industrialroundwood removals in that country has increased throughout the period, but thevalue has fallen and then risen again. This has been caused by a shift in the structureof production in Brazil over the last 15 years – from the production of industrialroundwood from natural forests (bringing a high price) to that from forest plantations(bringing a much lower price, but eventually greater production). A structural changesuch as this could also partly account for the trend in Asia.
Socio-economic functions 113The reported value of wood removals in Europe has increased slightly, showing aslight drop from 1990 to 2000 and then an increase. These changes probably reflectmarket liberalization in the formerly centrally planned economies of eastern Europe. Asignificant fall in production levels occurred in the early 1990s in Europe, followed byrapid growth in the latter part of the decade. The figures shown above do not captureall the profound changes that have occurred in Europe over the last 15 years (UNECE,<strong>2005</strong>), but they do indicate that the value of removals is now higher than at the start ofthese changes.In the other three regions (Africa, North and Central America and Oceania), thereported value of wood removals has roughly doubled. In Africa and Oceania this isdue, to some extent, to increases in the level of removals. In addition, in all three regions,it seems likely that this has been supported by an increase in unit prices over the period.In contrast to the other regions, it is also likely that the reported value of removals hasincreased in real terms (i.e. after adjusting for inflation).In terms of the substance of these figures, the most interesting feature is the trendin the reported value of wood removals shown in Brazil, as production shifted fromnatural forests to forest plantations. Given the current and projected trends in woodsupply, it can be expected that more countries will display such a trend in the future.This trend also highlights a final problem with these figures: they are an indicationof the gross rather than the net value of output (or value-added). A decline in thevalue of removals (as shown in Brazil) may not necessarily indicate that the economicsustainability of forestry has declined. Rather, it could indicate that the sector hasbecome more cost-efficient. In such cases, it is quite possible that gross value is decliningwhile value-added (and hence economic viability) is increasing. In the future, it wouldbe useful to include statistics for value-added for the whole sector, including processing,rather than only for the value of removals. These statistics would give a better indicationof economic sustainability. They are found in national income accounts and can often beobtained relatively easily (Lebedys, 2004).VALUE OF NWFP REMOVALSThe value of NWFP removals, like that of wood removals, is an indicator of thecontribution of forests and woodlands to national economies. It also indicates thecontribution of the sector to poverty alleviation, as these products are mostly collectedby relatively poor people living in rural areas.Information availabilityFifty-six countries provided information, accounting for slightly more than half theglobal forest area (Figures 7.3 and 7.4). In general, more information about value wasavailable for plant products than for animal products. Plant product categories forwhich availability of information was highest were food, medicinal and aromatic plants,exudates and other plant products. For animal products, information was more availablefor the value of removals of bushmeat, honey and beeswax. For many products andreporting years, less than 10 percent of the countries provided information.For almost all products and regions, more information was available for 2000 thanfor <strong>2005</strong>. For example, 18 percent of countries provided information on food in 2000. Atthe regional level, the proportion of countries providing this information was highest inAsia and Europe. Very little information was available outside these regions.Although availability of information about the value of NWFP removals appears tobe very low, it should be noted that values are likely to be zero (or close to zero) formany of the products in countries not providing this information. On the other hand,figures supplied by countries are also likely to be very low estimates of the total valueof their removals. Two main problems of underreporting were identified in countrystatistics. First, in many cases, countries reported the value of only part of total removals
114<strong>Global</strong> <strong>Forest</strong> <strong>Resources</strong> <strong>Assessment</strong> <strong>2005</strong>FIGURE 7.3Information availability – value of NWFP removalsEastern and Southern AfricaNorthern AfricaWestern and Central AfricaEast AsiaSouth and Southeast AsiaWestern and Central AsiaEuropeCaribbeanCentral AmericaNorth AmericaOceaniaSouth AmericaWorld0 10 20 30 40 50 60 70 80 90 100Percentage of total forest areaInformation available for all years Information available for latest year Information not available for latest yearFIGURE 7.4Information availability – value of NWFP removals by product categoryPlant productsFoodFodderMedicine/aromaticColourants/dyesUtensils/crafts/constructionOrnamental plantsExudatesOther plant productsAnimal productsLiving animalsHides, skins and trophiesHoney and beeswaxBushmeatMedicineColourantsOther edible animal productsOther non-edible animalproducts0 10 20 30 40 50 60 70 80 90 100Percentage of total forest areaInformation available for all years Information available for latest year Information not available for latest year(e.g. only removals for sale, or from state land, or of one of a number of products withina category). Second, the values reported were sometimes the value of exports only or ofthe income from licence fees to remove products.StatusIn <strong>2005</strong>, the total reported value of removals amounted to about US$4.7 billion (Table7.4). Plant products accounted for about three-quarters (or just under US$3 billion).Among these, food had the highest value (US$1.3 billion), followed by other plant
Socio-economic functions 115TABLE 7.4Value of NWFP removals <strong>2005</strong> (US$1 000)Region Category of NWFP TotalFood Exudates Ornamental Other plant Bushmeat Otherplants productsAfrica 4 469 42 180 70 16 001 3 064 831 415 897 199Asia 817 843 316 359 8 279 052 21 317 827 1 731 110Europe 381 936 801 344 065 139 154 616 721 321 942 1 804 619North and Central America 34 200 15 267 - 17 988 - 4 240 71 695Oceania - 0 0 11 463 181 6 946 18 590South America 96 386 1 673 - 32 003 4 099 63 069 197 230World 1 334 833 376 280 344 143 495 661 624 086 1 545 439 4 720 443products (US$0.5 billion). Fruit, berries and nuts were identified as the main foodproducts in most countries. Three specific products and countries accounted for therelatively high value of other plant product removals: bidi leaves in India, cork in Spainand manure in the Republic of Korea. Of the animal products, the reported value ofbushmeat removals was by far the most important, with a value of US$0.6 billion.At the regional level, Asia and Europe accounted for almost 90 percent of thetotal reported value of removals, with values of US$1.7 billion and US$1.8 billionrespectively. In Asia, food was by far the most significant product, with a reportedvalue of US$0.8 billion, followed by exudates and other plant products (US$0.3 billioneach). In Europe, the reported value of bushmeat removals was US$0.6 billion,followed by food (US$0.4 billion) and ornamental plants (US$0.3 billion).The other regions reported minimal values for NWFP removals in <strong>2005</strong>, owingto very limited availability of information. For example, the reported value ofbushmeat removals outside Europe was only US$5 million, which is likely to be a vastunderestimate of the true value of removals in these other regions. 2The reported global value of NWFP removals in <strong>2005</strong> (US$4.7 billion) compareswith a total value of global international trade in NWFPs of US$11.0 billion in2004 (derived from United Nations, <strong>2005</strong>c, following a methodology outlined in<strong>FAO</strong>, <strong>2005</strong>e). Although the latter figure includes some trade in processed NWFPs,international trade probably accounts for only a tiny proportion of NWFP removals.Thus a comparison of these two figures suggests that the values reported here are a vastunderestimate of the total value of NWFP removals.TrendsBecause of the lack of reported trends at the country level (i.e. very few countriesprovided statistics for all three years), Table 7.5 displays the total value reported foreach year. <strong>Global</strong>ly, it appears that the total value of removals increased from 1990to 2000, then declined from 2000 to <strong>2005</strong>. However, this is a function of the smallernumber of countries reporting information for <strong>2005</strong> (in particular, China is missing).Thus the following analysis focuses on changes from 1990 to 2000, in which theinformation is slightly more comparable.At the global level, the reported value of NWFP removals increased by 26 percent,from US$4.8 billion in 1990 to US$6.1 billion in 2000. The reported value of foodremovals increased significantly, from US$1.6 billion in 1990 to US$2.6 billion in 2000.The reported value of removals of exudates also almost doubled over the same periodto US$0.9 billion in 2000. In contrast, the reported values of removals of the other two² Much of the bushmeat produced in other regions is unregulated and/or illegal, so there are no officialstatistics and the product is not reported by countries.
116<strong>Global</strong> <strong>Forest</strong> <strong>Resources</strong> <strong>Assessment</strong> <strong>2005</strong>most significant NWFPs (bushmeat and other plant products) declined slightly from1990 to 2000.At the regional level, the reported value of NWFP removals increased significantlyin Asia (from US$2.0 billion in 1990 to US$3.4 billion in 2000) and increased veryslightly in Europe (from US$1.5 billion in 1990 to US$1.6 billion in 2000). However,these trends may not be very reliable, given the small proportion of total NWFPremovals covered by the information. For the same reason, reliable trends for the otherregions cannot be derived from the small number of reported values.The availability of information is very low for both the amount and the value ofNWFP removals. However, given that these removals can have an impact on largenumbers of poor people, there is great interest in this type of information (for example,the current interest in the contribution of forests to poverty alleviation and the emphasison poverty reduction strategies and achievement of the Millennium DevelopmentGoals in many developing countries). In view of this, it is recommended that countriescontinue developing ways to collect, estimate and analyse this information withappropriate support from international partners.EMPLOYMENTThe level of employment in forestry is an indicator of both the social and economicvalue of the sector to society. Employment provides income and, as forestry activitiesoccur in rural areas that are often poorer than the average, it gives some indication of thesector’s contribution to poverty alleviation. In social terms, the value of employment isin allowing individuals to become productive members of society.It is important to gather and analyse this information, as it is a significant indicatorof the impact of forests on people and demonstrates the contribution of the sector tobroader economic aims and objectives. Many, if not all, governments are concernedabout the level of employment and this is often a major performance indicator forgovernment policy.For FRA <strong>2005</strong>, employment was defined as: “Any type of work performed orservices rendered under a contract of hire, written or oral, in exchange for wageor salary, in cash or in kind”, based on definitions by the International LabourOrganization and the Employment Security Commission. However, information wasrequested only on employment related to the primary production of forest goods andrelated services, i.e. excluding the processing of wood and non-wood forest products.Thus the figures cannot be compared with statistics on employment in the forestrysector as a whole. The International Standard Industrial Classification, generally usedby national statistical agencies, is being revised for greater clarity and level of detailfor many economic activities (including forestry). It may be useful to review andrefine the definition of forestry employment once this has taken place, with a view toincreasing comparability between data sources and making full use of existing nationalemployment statistics.TABLE 7.5Reported values of total NWFP removals 1990–<strong>2005</strong> (US$1 000)Region 1990 2000 <strong>2005</strong>Africa 847 233 724 451 897 199Asia 1 951 852 3 395 433 1 731 110Europe 1 535 811 1 600 796 1 804 619North and Central America 48 372 108 074 71 695Oceania 18 889 42 648 18 590South America 423 652 234 107 197 230World 4 825 808 6 105 508 4 720 443Note: The figures in this table should not be interpreted as illustrating actual trends, since some countries did notreport on all product categories for all three reporting years.
Socio-economic functions 117FIGURE 7.5Information availability – employmentEastern and Southern AfricaNorthern AfricaWestern and Central AfricaEast AsiaSouth and Southeast AsiaWestern and Central AsiaEuropeCaribbeanCentral AmericaNorth AmericaOceaniaSouth AmericaWorld0 10 20 30 40 50 60 70 80 90 100Percentage of total forest areaInformation available for all years Information available for latest year Information not available for latest yearInformation availabilityAt the global level, 138 countries reported on employment. Those reporting for allthree years account for about 67 percent of global forest area (Figure 7.5).As a check on the quality of the information, the reported statistics were comparedwith the statistics on forestry employment reported by national statistical offices(Lebedys, 2004). This detailed examination of the quality of the statistics revealeda number of problems and issues, especially with a few of the significant countries(which affect the global results).For example, the United States included employment in sawmilling in theiremployment figures for FRA <strong>2005</strong> (resulting in a much higher number than foremployment in roundwood production alone). A similar problem may also have arisenfor countries that reported employment in the public forest administration wherethese administrations also own and manage forest processing facilities. Conversely, theRussian Federation included only employment in the Ministry of Natural <strong>Resources</strong>(which is likely to be an underestimate of total employment in forestry). 3Perhaps the greatest concern identified was that some countries may have reportedthe number of people employed part time in the sector, without converting thesefigures to full-time equivalents. The most notable example of this was India, wherethe national report showed very high levels of employment in the sector (5.6 millionand 4.9 million in 1990 and 2000 respectively). This was largely owing to the inclusionof some very high numbers for people employed in the establishment of forestplantations. These employment estimates were based on the number of hectares³ More generally, it should be noted that countries took different approaches to the inclusion/exclusionof employment in the public sector in their reported statistics. Some included all public-sectorworkers, while others apparently didn’t include any. The FRA definitions asked countries to include“employment in direct supervision activities by private and/or public entities”. However, this couldhave led to some errors, as it contradicts other standard economic classification systems (e.g. theInternational Standard Industrial Classification), which classify the government as a separate sector inthe economy. It should also be noted that “provision of services” was defined more broadly than inother standard classification systems (e.g. to include ecotourism in forest areas).
118<strong>Global</strong> <strong>Forest</strong> <strong>Resources</strong> <strong>Assessment</strong> <strong>2005</strong>planted multiplied by the average number of people employed per hectare. For forestplantation establishment, this factor was reported to be 3.8 persons per hectare. While3.8 persons per hectare, on average, may have been employed at some time in plantingtrees, it seems very unlikely that this is a figure for permanent employment in treeplanting.Another possible problem is that some of the reported statistics may include thenumbers of people collecting fuelwood and NWFPs for subsistence purposes. Theguidelines and definitions (<strong>FAO</strong>, 2004b) specifically stated that only paid employmentshould be included in the statistics, but it seems likely that several countries alsoincluded employment in subsistence production.Given the doubts about some of these figures, it is not possible to draw any robustconclusions about the current status and trends in forestry employment on the basisof the global totals for the statistics reported. A focused effort should be made toimprove the quality of employment statistics in a few key countries in which thereported statistics are missing, or are very high but may be based on minimal surveydata or very simple estimation techniques.StatusThe total reported level of employment in forestry in 2000 is 11.0 million people(Table 7.6), of which over half (6.0 million) are employed in the primary productionof goods.At the regional level, the reported level of employment is highest in Asia(8.3 million), with India accounting for over half of this and China a further onequarter(2.0 million). Next highest are Africa and Europe, with reported employmentof 0.9 million each, followed by North and Central America, with 0.6 million.Reported employment in the provision of services is generally much lower thanemployment in the primary production of goods, except in Africa and Asia. In Africa,this results from the inclusion of ecotourism employment in South Africa (estimatedat 200 000). In Asia, it reflects the inclusion of 2.3 million people reportedly employedin forest plantation establishment and management (see previous comments).Lebedys (2004) presents a figure of 4.2 million for total forestry employment in2000. Although that figure includes estimates for a number of countries, it is notablethat the statistics reported above amount to more than twice this figure. One country– India – accounts for a significant proportion of this discrepancy (the figure quotedin Lebedys is based on the results of an earlier <strong>FAO</strong> survey of forestry employmentin which India reported a 1994 level of employment of only 263 000). In many othercases, the figures reported here and in that report are quite similar or can be explainedby differences in definitions.TABLE 7.6Number of people employed in forestry in 2000RegionNumber employed(1 000 person-years)Primary production Provision Unspecified Totalof goodsof servicesAfrica 465 305 100 870Asia 4 425 3 008 875 8 308Europe 412 63 471 946North and Central America 415 55 135 605Oceania 28 4 6 37South America 215 20 9 245World 5 960 3 455 1 596 11 011
Socio-economic functions 119TrendsTrends are shown only for countries that reported for both years (Table 7.7). <strong>Global</strong>ly,reported employment in forestry declined slightly from 1990 to 2000, by about1 million (or 10 percent). At the regional level, Asia and Europe also showed thisdownward trend, while in the other regions, employment increased somewhat.The changes in employment can be explained by a number of factors. Most ofthe decline has occurred in the primary production of goods, which can probablybe attributed to increases in labour productivity (e.g. increased mechanization ofharvesting operations). In Europe, the decline in employment numbers can also beexplained by the restructuring of formerly centrally planned economies. In somecountries, this has led to decreased production and employment. More generally, theprivatization of forestry activities in eastern Europe has led to large increases in labourproductivity in the region and, as a consequence, a decline in employment numbers.The regions showing an increase in employment may reflect roundwood productionthat is increasing faster than increases in labour productivity (for a more detaileddiscussion, see Lebedys, 2004).OWNERSHIP OF FORESTS AND OTHER WOODED LANDSUnderstanding the impact of tenure issues on sustainable forest management andrecent trends is essential to the formulation of effective policies by governments. <strong>Forest</strong>ownership is in transition in many countries: ownership and control over naturalresources is increasingly shifting from the state to local communities and to individualhouseholds (Scherr, White and Kaimowitz, 2003). Current trends in privatizationand community involvement in forest management have been accompanied by rapidchanges in resource tenure patterns and increasing complexity of stakeholder relations.These changes, in addition to affecting the way in which forests are managed, havesocial, political and economic implications.Worldwide – and more specifically in developing countries – most forest areas areunder the formal jurisdiction of governments, and forest management is still primarilya state matter. Excessive deforestation and forest degradation have resulted frompopulation pressure, agricultural expansion, escalating demand for wood products,illegal logging, industrial development and rapid economic growth. This has triggereda debate not only on the effectiveness of public-sector forest management, but also onthe relevance of overall state ownership.Over the past 20 years, commitment has been growing to empower localcommunities, decentralize decision-making to local government units and increaseprivate-sector involvement in forest management. This development is paralleled byTABLE 7.7Trends in number of people employed in forestry 1990–2000RegionNumber employed(1 000 person-years)1990 2000Primary Provision Unspecified Total Primary Provision Unspecified Totalproduction of services production of servicesof goodsof goodsAfrica 222 23 55 301 292 35 90 417Asia 5 160 2 953 1 026 9 139 4 261 3 004 875 8 140Europe 413 70 509 992 335 62 365 762North and Central America 368 57 42 467 407 55 53 515Oceania 26 4 4 35 28 4 6 38South America 44 20 0 64 50 17 0 67World 6 233 3 128 1 637 10 998 5 372 3 178 1 389 9 939
120<strong>Global</strong> <strong>Forest</strong> <strong>Resources</strong> <strong>Assessment</strong> <strong>2005</strong>significant shifts in forest tenure and innovative institutional arrangements aimed atincreasing the direct involvement of stakeholders in forest management.To capture these trends, for the first time the assessment requested informationclassifying the world’s forests as public, private or other (including non-classified).Analysis of the information reported reveals that more work is needed in defining theownership- and tenure-related data to be collected and in ensuring that such data willbe gathered at the global level. A thematic study on forest ownership and resourcetenure will complement the information provided in FRA <strong>2005</strong> (Box 7.1).BOX 7.1FRA <strong>2005</strong> thematic study on forest ownership and resource tenureWith a view to assessing and understanding changes in forest ownership patterns,possible variations among continents and issues related to these trends, the <strong>FAO</strong> <strong>Forest</strong>ryDepartment has begun a thematic study aimed at complementing the informationcollected through the FRA <strong>2005</strong> reporting table on forest ownership.The study, to be released during 2006, was designed to collect, analyse and monitordata on forest ownership, resource tenure and related trends at the regional level inpolicy and law development.This phase is a pilot exercise conducted in East and Southeast Asia. Similar studiesare expected to be conducted in other regions. Its objective is to develop and test amethodology for collecting and monitoring forest ownership and tenure data at theglobal level that can be integrated into the FRA 2010 process. The exercise has beenimplemented on two levels:Regional.A pilot survey was conducted in 17 countries,¹ aimed at collecting detaileddata on forest areas for two variables: different types of ownership and different levelsof control of and access to resources. The information was gathered through the use ofa matrix designed for this purpose and was completed by country focal points (primarilygovernment agencies).National.Eleven country-specific case studies were conducted in nine countries²with the objective of expanding and strengthening the quantitative analysis done atthe regional level and of complementing this with detailed qualitative information ontypes of forest tenure, particularly on resource ownership, management agreementsand institutional arrangements. The case studies seek a better understanding of therelationship between forest resource tenure and forest management – and specifically ofthe implications for poverty alleviation.Results and main conclusions• <strong>Forest</strong>s remain public to a great extent (86 percent), with limited differences amongcountries, and mostly under the direct control of central governments (79 percent).• Devolution of management responsibilities to local communities involves no morethan 10 percent of forests (18 percent if small-scale forest holders are included). Ingeneral, rights are devolved for degraded forests.• Short-term management agreements prevail over long-term ones.• Despite the examples provided by some countries – known for their well-establishedtraditions of community forestry, joint forest management and private forestry– the scale of these schemes remains limited. <strong>Forest</strong>s and the forestry sector do notgenerally offer a more diversified and adapted system of tenurial arrangementsthan can be seen in the rural development context.• Some emerging trends are the allocation of forests to private households (China and
Socio-economic functions 121Viet Nam) and the interesting, but still limited and very recent granting of long-termagreements (100 years) to private companies (Malaysia).• The forestry sector seems slow to adapt to current trends such as decentralizationand greater stakeholder participation. Instead, it tends to react to shocks in extremeways (e.g. logging bans), which further weaken tenure rights.• In many countries, resource users and managers still have only a vagueunderstanding of their roles, responsibilities and rights: poor management is oftenthe result of limited knowledge and capacities.Evidence emerging from the case studies demonstrates the linkage between clear andsecure tenure arrangements and the contribution of forests to sustainable livelihoodsand better management. While security of tenure is recognized as a founding block ofeffective forest management, it is not a sufficient condition. Secure forest tenure needs tobe consolidated by effective capacity-building.A strong recommendation emerging from the study is that awareness must beincreased of the implications of forest ownership and tenure on forest managementand poverty reduction. It is expected that FRA 2010 could contribute significantly tothis goal.1Bangladesh, Bhutan, Brunei, Cambodia, China, India, Indonesia, Japan, Lao People’s DemocraticRepublic, Malaysia, Myanmar, Nepal, Pakistan, Philippines, Republic of Korea, Thailand andViet Nam.2China, India, Indonesia, Malaysia, Nepal, Pakistan, Philippines, Thailand and Viet Nam.Information availabilityOf the total of 229 countries and territories covered by FRA <strong>2005</strong>, 157 (69 percent)have reported on ownership of forests, accounting for 77 percent of total forest area(Figure 7.6). The percentage is slightly lower for ownership of other wooded land.The highest response rate was for Asia (93 percent) and Europe (84 percent),followed by Africa (62 percent), Oceania (47 percent) and North and Central America(45 percent). The lowest response rate was registered in South America, where only40 percent of the countries were able to report, with important gaps such as Argentina,Brazil, Colombia and Venezuela.Uncertainty in tenure-related issues, lack of up-to-date information, rapid changes,and the fact that forest ownership has been inserted only very recently into forestinventories affect the availability of reliable information. In addition, availability ofdata might be restricted to those countries that possess a rural cadastre, i.e. mainlydeveloped countries. In many cases, owing to rapid evolution of the situations ineastern European countries and China, monitoring of trends is hindered by thedifficulty and cost of obtaining current data. Data availability and trends also oftenvary greatly among regions and provinces in the same country.StatusMost of the conclusions reported here are limited to forests (Table 7.8). Many countriesincluding Australia and the United States provided data for ownership only of forestsand not of other wooded land; therefore it is not possible to merge or compare the twocategories. It can generally be said that no major differences in the ownership structureoccur between the ownership of forests and other wooded land, at least at subregionaland global scales.Public ownership is by far the predominant category in all regions and subregions(Figure 7.7). At the global level, 84 percent of forests and 90 percent of other woodedland are public. Given that the ‘public forest’ category in FRA <strong>2005</strong> includes not only
122<strong>Global</strong> <strong>Forest</strong> <strong>Resources</strong> <strong>Assessment</strong> <strong>2005</strong>forests owned by central, regional or local public bodies, but also those owned bygroups (villages, communities and indigenous groups), it is difficult to draw conclusionsabout the management of public forests: many different categories are included underthe same definition. Thus the most significant information is the percentage of privateforests and its trend.The highest percentage of private forests occurs in Central America (56 percent) andNorth America (29 percent). In Europe, private forests represent 10 percent. However,excluding the Russian Federation, they reach 51 percent. In Africa, private forests areuncommon.FIGURE 7.6Information availability – ownershipEastern and Southern AfricaNorthern AfricaWestern and Central AfricaEast AsiaSouth and Southeast AsiaWestern and Central AsiaEuropeCaribbeanCentral AmericaNorth AmericaOceaniaSouth AmericaWorld0 10 20 30 40 50 60 70 80 90 100Percentage of total forest areaInformation available for all years Information available for latest year Information not available for latest yearTABLE 7.8Ownership of forest area 2000Region/subregion Information availability Private ownership Public ownership Other ownershipCountries <strong>Forest</strong> area % of total 1 000 ha % 1 000 ha % 1 000 ha %reporting (1 000)forest areaEastern and Southern Africa 14 203 816 86.7 7 057 3.5 193 751 95.1 3 008 1.5Northern Africa 12 126 452 93.0 2 124 1.7 124 209 98.2 119 0.1Western and Central Africa 12 222 058 78.0 771 0.4 221 288 99.7 0 0Total Africa 38 552 326 84.3 9 951 1.8 539 248 97.6 3 127 0.6East Asia 5 225 663 100.0 18 875 8.4 206 788 91.6 0 0South and Southeast Asia 17 297 379 100.0 8 835 3.0 285 478 96.0 3 066 1.0Western and Central Asia 22 43 346 99.6 619 1.4 42 578 98.2 148 0.3Total Asia 44 566 388 100.0 28 329 5.0 534 845 94.4 3 214 0.6Total Europe 39 998 071 100.0 99 631 10.0 897 059 89.9 1 380 0.1Caribbean 9 3 669 64.3 536 14.6 3 061 83.4 72 2.0Central America 5 16 645 69.8 9 343 56.1 7 073 42.5 230 1.4North America 4 677 971 100.0 198 645 29.3 452 343 66.7 26 982 4.0Total North and Central America 18 698 285 98.7 208 525 29.9 462 477 66.2 27 284 3.9Total Oceania 11 204 933 98.5 48 575 23.7 125 527 61.3 30 831 15.0Total South America 7 136 240 16.0 23 528 17.3 103 379 75.9 9 333 6.9World 157 3 156 243 79.1 418 538 13.3 2 662 534 84.4 75 170 2.4
Socio-economic functions 123FIGURE 7.7Ownership of forests by subregion 2000Eastern and Southern AfricaNorthern AfricaWestern and Central AfricaEast AsiaSouth and Southeast AsiaWestern and Central AsiaEuropeCaribbeanCentral AmericaNorth AmericaOceaniaSouth AmericaWorld0 10 20 30 40 50 60 70 80 90 100Percentage of total forest areapublic private otherIn terms of forest area, the regions or subregions accounting for the greatestarea of private forests are North America ( about 200 million hectares) and Europe(100 million hectares), followed by Oceania (49 million hectares).TrendsPrivate ownership of forests is increasing, even though it is not possible to generalizethe trend at the regional level (Table 7.9). Private forests represented 11 percent ofglobal forests in 1990 and 13 percent in 2000. However, the increase involves limitedgeographical areas; the most relevant one is central Europe. There are no othersignificant trends at regional or subregional levels.In the cases in which the proportion of private forests decreases, the phenomenonis generally linked to a decrease in the forest area (including public), not to a shift inforest ownership.In Europe, private forests represented 8 percent of forests in 1990 and 9.7 percent in2000 – an increase of 14 percent. Private forests have increased in almost all countries;however these changes are most significant in central and eastern Europe, where privateforests increased from 2.5 million hectares to 7.5 million (i.e. from 7 percent to 23 percentof forest area) as a consequence of the privatization and restitution of forest land. TheBaltic countries, the Czech Republic and Hungary show the highest rates of increase.No conclusion can be drawn for Oceania, as Australia did not report data for 1990.However, private forests in New Zealand have increased to 33 percent, due primarilyto an increase in the area of planted forests on private land.In Asia, no major differences have been reported since 1990 for the region as awhole. At the country level, the only significant trends are the increased private forestarea in the Philippines, mainly reflecting the expansion of forest plantations and despitethe decrease in total forest area, and in Viet Nam, where private forests have increasedby more than 2 million hectares as a result of the process of allocation of publicforests to individual households (from 0.1 percent in 1990 to 18 percent in 2000 and20 percent in <strong>2005</strong>). No historical data are provided for China, which has also initiateda privatization process for forest resources.
124<strong>Global</strong> <strong>Forest</strong> <strong>Resources</strong> <strong>Assessment</strong> <strong>2005</strong>TABLE 7.9Trends in ownership of forest area 1990–2000Region/subregion Information availability Private ownership(both years)1 000 ha Annual change rateCountries <strong>Forest</strong> area % of total 1990–2000reporting 2000 forest area 1990 2000 (%)Eastern and Southern Africa 14 203 816 86.7 7 555 7 057 -0.7Northern Africa 11 126 135 92.8 2 189 2 116 -0.3Western and Central Africa 12 222 058 78.0 690 771 1.1Total Africa 37 552 009 84.2 10 433 9 943 -0.5East Asia 5 225 663 100.0 19 147 18 875 -0.1South and Southeast Asia 17 297 379 100.0 6 782 8 835 2.7Western and Central Asia 21 43 215 99.3 528 540 0.2Total Asia 43 566 257 100.0 26 457 28 250 0.7Total Europe 39 998 071 100.0 87 065 99 631 1.4Caribbean 8 3 623 63.5 646 505 -2.4Central America 5 16 645 69.8 10 041 9 343 -0.7North America 4 677 971 100.0 196 515 198 645 0.1Total North and Central America 17 698 239 98.7 207 202 208 494 0.1Total Oceania 8 39 400 18.9 3 206 3 978 2.2Total South America 5 106 360 12.5 12 038 23 478 6.7World 149 2 960 336 74.2 346 402 373 773 0.8Note: As some countries did not report a complete series, figures for 2000 are slightly different from thosepresented in Table 7.8.Finally, it is difficult to evaluate trends in Latin America, as not all countries havereported. The percentage of private forests has not changed in Chile, but has increasedvery significantly in Uruguay (58 percent) as a result of large-scale afforestation onprivate lands, encouraged by government incentives.FOREST AREA DESIGNATED FOR SOCIAL SERVICESThe area of forests designated for social services indicates to what extent countries andforest managers are actively considering these services as part of the benefits of forests.According to the definitions for FRA <strong>2005</strong>, social services may include recreation,tourism, education and conservation of sites with cultural or spiritual importance. Thedefinition leaves space for interpretation by individual countries of what to includeunder this theme.For FRA <strong>2005</strong>, countries were asked to report two measures of forest designation:• area of forest designated primarily for social services; and• total area of forest designated for social services.This is the first time that information on area designated for social services hasbeen collected within the framework of the assessment. Thus it will be important toanalyse carefully how the information provided by countries contributes to overallunderstanding of the use and functions of forest resources and how reporting can befurther improved in future assessments.Relatively few countries and territories (29 percent) reported having forest areasdesignated primarily for social services, and those that have reported are not necessarilyrepresentative of their entire region. This makes it difficult to draw any far-reachingconclusions on status and trends.Information availabilityOf the 229 countries and territories, 172 provided information on the social servicefunction of their forests (Figure 7.8). Of these, only 66 countries and territories(representing about 53 percent of the world’s forest area) reported actually havingforest areas designated for social services, and only 60 countries have presented
Socio-economic functions 125Public ownership Other ownership Region/subregion1 000 ha Annual change rate 1 000 ha Annual change rate1990–2000 1990–20001990 2000 (%) 1990 2000 (%)206 135 193 751 -0.6 3 292 3 008 -0.9 Eastern and Southern Africa133 604 123 900 -0.8 94 119 2.4 Northern Africa235 083 221 288 -0.6 0 0 0 Western and Central Africa574 822 538 939 -0.6 3 386 3 127 -0.8 Total Africa188 992 206 788 0.9 16 0 -100.0 East Asia311 856 285 478 -0.9 4 507 3 066 -3.8 South and Southeast Asia42 267 42 528 0.1 96 146 4.3 Western and Central Asia543 115 534 795 -0.2 4 619 3 212 -3.6 Total Asia902 051 897 059 -0.1 183 1 380 22.4 Total Europe2 443 3 046 2.2 170 72 -8.2 Caribbean9 147 7 073 -2.5 260 230 -1.2 Central America452 227 452 343 n.s. 29 058 26 982 -0.7 North America463 817 462 461 n.s. 29 488 27 284 -0.8 Total North and Central America6 509 6 219 -0.5 30 552 29 203 -0.5 Total Oceania60 590 78 646 2.6 35 603 4 236 -19.2 Total South America2 550 904 2 518 119 -0.1 103 831 68 443 -4.1 Worldcomplete trend data. The remaining countries and territories may still have areasdesignated for social services, but these are either included in other categories, such as‘multiple use’, or could not be quantified.There is considerable regional variation regarding data availability. East Asia,Europe and South America have good availability of information, while data are largelymissing from the remaining subregions. For North America, no data are availablefor primary function, and only one reporting unit – Saint Pierre and Miquelon – hasreported on total area of forest designated for social services.StatusTable 7.10 shows a subregional summary of areas designated primarily for social services.Out of the total of 141 million hectares reported, one country – Brazil – accounts forabout 80 percent, or 114 million hectares. It has reported all its ‘indigenous lands’ and‘sustainable development reserves’ in this category. At the global level, 3.7 percent offorest area (1.7 percent if excluding Brazil) is estimated as having social services as theprimary function. This percentage increases to 30.9 percent when looking at total areawith this function.As the Russian Federation accounts for most of the forest area in Europe, figures areprovided for Europe including and excluding the Federation. It is worth noting that, withoutthe Russian Federation, the forest area designated for social services in Europe is 8.3 percentof total forest area, which is a considerably higher percentage than for all other regions withthe exception of South America, because of the large areas reported by Brazil.Under total area with function (Table 7.11), Europe reports about 72 percent of its forestarea. The high percentages for North America (100 percent) and Oceania (88 percent) arebased on a few small countries that are not representative of the subregions.The only clear conclusion to be drawn is that Europe seems to give the mostattention to the social services provided by forest resources, through active designationof areas for this purpose. However, clearer definition of social services in futureassessments could help reduce the inconsistencies caused by differing interpretationsby the countries reporting.
126<strong>Global</strong> <strong>Forest</strong> <strong>Resources</strong> <strong>Assessment</strong> <strong>2005</strong>FIGURE 7.8Information availability – area of forest designated primarily for social servicesEastern and Southern AfricaNorthern AfricaWestern and Central AfricaEast AsiaSouth and Southeast AsiaWestern and Central AsiaEuropeCaribbeanCentral AmericaNorth AmericaOceaniaSouth AmericaWorld0 10 20 30 40 50 60 70 80 90 100Percentage of total forest areaInformation available for all years Information available for latest year Information not available for latest yearTABLE 7.10Area of forest designated primarily for social services <strong>2005</strong>Region/subregion Information availability Area of forest designatedprimarily for social servicesCountries <strong>Forest</strong> area % of totalreporting (1 000 ha)forest area 1 000 ha % of forest areaEastern and Southern Africa 16 211 181 93.2 12 n.s.Northern Africa 13 125 667 95.9 2 n.s.Western and Central Africa 15 118 280 42.6 364 0.3Total Africa 44 455 129 71.6 377 0.1East Asia 5 244 862 100.0 2 620 1.1South and Southeast Asia 17 283 126 100.0 143 0.1Western and Central Asia 23 43 579 100.0 906 2.1Total Asia 45 571 567 100.0 3 669 0.6Total Europe 36 991 192 99.0 22 477 2.3Caribbean 9 3 489 58.4 3 0.1Central America 7 22 411 100.0 36 0.2North America 4 677 464 100.0 0 0Total North and Central America 20 703 364 99.7 39 n.s.Total Oceania 14 203 467 98.7 67 n.s.Total South America 13 831 540 100.0 113 971 13.7World 172 3 756 260 95.1 140 600 3.7TrendsThe analysis of trends in area of forests primarily designated for social services is basedon those countries or territories that have reported a complete time series (Table 7.12).The strong trend for South America is entirely due to the reclassification by Brazil.Europe shows a decline under primary function, but a small increase under total areawith function. The decline is mostly the result of reclassification of forests in theRussian Federation. Asia shows a slight upward trend, while the number of reportingcountries in Africa, North and Central America and Oceania is too small to support astatement regarding trend.
Socio-economic functions 127TABLE 7.11Total area of forest designated for social services <strong>2005</strong>Region/subregion Information availability Total area of forestdesignated for social servicesCountries <strong>Forest</strong> area % of totalreporting (1 000 ha)forest area 1 000 ha % of forest areaEastern and Southern Africa 2 77 n.s. 14 18.2Northern Africa 0Western and Central Africa 4 45 840 16.5 293 0.6Total Africa 6 45 917 7.2 307 0.7East Asia 5 244 862 100.0 46 959 19.2South and Southeast Asia 15 193 833 68.5 96 369 49.7Western and Central Asia 7 8 427 19.4 2 896 34.4Total Asia 27 447 122 78.2 146 223 32.7Total Europe 16 124 526 12.4 89 734 72.1Caribbean 3 524 8.8 130 24.9Central America 0North America 1 3 n.s. 3 100.0Total North and Central America4 527 0.1 133 25.3Total Oceania 5 10 215 5.0 8 954 87.7Total South America 2 485 761 58.4 128 763 26.5World 60 1 114 068 28.2 374 116 33.6TABLE 7.12Trends in area of forest designated primarily for social services 1990–<strong>2005</strong>Region/subregion Information availability (all 3 years) Area of forest designated Annual change rateprimarily for social services (%)Countries <strong>Forest</strong> area % of totalreporting (1 000 ha)forest area 1990 2000 <strong>2005</strong> 1990–2000 2000–<strong>2005</strong>Eastern and Southern Africa 15 198 343 87.6 12 12 12 0 0Northern Africa 13 125 667 95.9 1 2 2 3.8 1.0Western and Central Africa 15 118 280 42.6 367 371 364 0.1 -0.4Total Africa 43 442 291 69.6 380 384 377 0.1 -0.4East Asia 5 244 862 100.0 1 506 2 184 2 620 3.8 3.7South and Southeast Asia 17 283 126 100.0 127 138 143 0.8 0.7Western and Central Asia 21 43 272 99.3 1 445 702 906 -6.8 5.3Total Asia 43 571 259 99.9 3 078 3 023 3 669 -0.1 4.0Total Europe 34 984 468 98.3 29 874 22 118 22 434 -3.0 0.3Caribbean 9 3 489 58.4 3 3 3 0 0Central America 7 22 411 100.0 36 36 36 0 0North America 4 677 464 100.0 0 0 0 0 0Total North and Central America 20 703 364 99.7 39 39 39 0 0Total Oceania 11 39 593 19.2 60 60 60 0 0Total South America 12 816 436 98.2 7 076 43 702 113 612 20.0 21.1World 163 3 557 412 90.0 40 507 69 326 140 191 5.5 15.1Note: As some countries did not report a complete series, figures for <strong>2005</strong> are slightly different from those presented in Table 7.10.
128<strong>Global</strong> <strong>Forest</strong> <strong>Resources</strong> <strong>Assessment</strong> <strong>2005</strong>
129Chapter 8Progress towards sustainableforest managementChapters 2–7 of this report focus on the results for individual thematic elements ofsustainable forest management. As indicated in those chapters and as illustrated inFigure 8.1 below, forests are managed for a variety of uses and values. But how wellare they managed? What does the information provided in FRA <strong>2005</strong> tell us aboutthe overall progress towards sustainable forest management since 1990 on the global,regional and subregional scale?The analysis presented in this chapter illustrates aggregated findings from FRA <strong>2005</strong>.For the first time, an attempt has been made to present trends more broadly, coveringsix of the seven thematic elements of sustainable forest management.The purpose is to shed more light on some of the complexities of sustainable forestmanagement and stimulate additional analyses and debate, thus promoting decisionmakingand action for further progress towards sustainable forest management. Detailsof the data and analyses applied in this chapter are provided in <strong>FAO</strong> (2006b).METHODOLOGYVariable selectionFor each of the six thematic elements, variables from the FRA <strong>2005</strong> reporting tableswere selected based on relevance to the theme and on information availability for thevariable. No relative weighting of variables was applied. An implicit weighting is,however, present, because one criteria in selecting the variables was that each thematicelement should be represented by two to five variables.Twenty-one variables were selected from 12 of the 15 reporting tables (Table 8.1).Some are derivations of the variables reported by countries: for example, carbon stockper hectare is derived from total carbon stock and forest area.An increase in the value of a variable is generally interpreted as making a positivecontribution to the thematic element (with the exception of area of forest affected by fire,insects and diseases or other disturbances) and thereby to sustainable forest management.FIGURE 8.1Designated functions of forests globally <strong>2005</strong>(%)Production 34.1Protection of soil and water 9.3Conservation of biodiversity 11.2Social services 3.7Multiple purpose 33.8No or unknown function 7.8
130<strong>Global</strong> <strong>Forest</strong> <strong>Resources</strong> <strong>Assessment</strong> <strong>2005</strong>TABLE 8.1List of variables selected for synthesis assessment by thematic areaThematic element FRA <strong>2005</strong> variables or derivatives UnitExtent of forest resources Area of forest haArea of other wooded landGrowing stock of forests m³Carbon stock per hectare in forest biomasshatonnes/haBiological diversity Area of primary forest haArea of forest designated primarilyfor conservation of biological diversityTotal forest area excluding area ofproductive forest plantations<strong>Forest</strong> health and vitality Area of forest affected by fire ha/yearProductive functions of forest resourcesArea of forest affected by insects,diseases and other disturbancesArea of forest designated primarilyfor productionArea of productive forest plantationsCommercial growing stock m³Total wood removalsTotal NWFP removalshahaha/yearhaham³/yeartonnes/yearProtective functions of forest resourcesArea of forest designated primarilyfor protectionArea of protective forest plantationshahaSocio-economic functions Value of total wood removals US$/yearValue of total NWFP removalsTotal employmentArea of forest under private ownershipArea of forest designated primarily forsocial servicesUS$/yearperson yearshahaThe extent to which this assumption holds depends on local or national circumstances.For example, an increase in forest area is likely to be seen as a positive development inmost countries, but where it is a result of abandonment of agricultural land and decliningrural populations, it may not be seen as positive by policy-makers or society.Four variables were selected for analysis of the extent of forest resources: area offorest, area of other wooded land, total growing stock and carbon stock in forestbiomass (per hectare).The biological diversity theme is represented by the variables of area of primaryforest, areas designated for conservation of biological diversity and total area of forestexcluding productive forest plantations. While it is recognized that productive forestplantations may provide some biological diversity conservation values comparedwith other types of land cover, this is not the primary management purpose andthese values are often limited. Primary forests are usually associated with high levelsof biological diversity, particularly in tropical regions, but in temperate and borealecosystems, primary forests can present a limited number of species and may not be agood indicator of biological diversity per se. Yet area of primary forest is an importantindicator of the status of the forest ecosystem as a whole.<strong>Forest</strong> health and vitality is described by two variables indicating the area affectedby fire, insects, diseases and other disturbances. Within this theme, stable or decreasingvalues are seen as a positive contribution to sustainable forest management. It isrecognized that a number of forest ecosystems are dependant on fire to maintaintheir vitality and regenerative capacity (particularly in boreal zones). However, fires
Progress towards sustainable forest management 131frequently run wild and destroy large areas of forest, resulting in soil erosion anddesertification – a serious threat to sustainable use of resources.For the productive functions theme, these variables are taken into account: area of forestdesignated for productive purposes, area of productive forest plantations, commercialgrowing stock, total wood removals and NWFP removals for the four categories ofproducts for which information availability is highest (see Chapter 5). It seeks to addressthe need to maintain an ample and valuable supply of primary forest products, while at thesame time ensuring that production and harvesting are sustainable and do not compromisethe management options of future generations. Thus an increase in wood removals maynot be positive in all cases, as the level of removals may not be sustainable.The protective functions theme is depicted by two variables indicating the totalarea of forest used primarily for protective functions and the area of forest plantationsmanaged for protective purposes.Socio-economic functions cover a wide range of forest benefits to mankind. Thevariables selected for this analysis are: level of private ownership, area of forestdesignated for recreation, education and other social services, total employment inforests and total value of removals. The level of private ownership is a somewhatambiguous variable. In some situations, an increase in this variable may be seen asa benefit for sustainable forest management, indicating devolution of managementresponsibility and control to individuals or communities. In other cases, it may meanthat forest property rights are being transferred from state or communal ownershipand concentrated in the hands of relatively few within the community.Information availabilityMany countries have not been able to provide complete data for all variables or for eachpoint in time. The extent to which countries can report on this limited set of variablesalso provides an indication of data availability and reporting capacity for the widerrange of uses and values that societies expect of forests. However, presenting data asregional aggregations overcomes some of the limitations in data availability on regionaland subregional scales. Poor quality, outdated or missing data are common problemsin natural resource or environmental management. Effective analysis and synthesis canbe used to expose weaknesses in data and identify those areas in which informationcollection efforts can be targeted to improve decision-making.Rules were created for handling gaps in data in the regions and subregions as follows.Information availability was determined as the sum of the area of forest of thosecountries reporting on a given variable, expressed as a percentage of total forest area inthe region or subregion. It is rated high if the reporting countries together represent75–100 percent of the total forest area, medium if the countries represent 50–74 percentand low if the percentage is 25–49 percent. If the reporting countries together accountfor less than 25 percent of the total forest area in the region, no findings are presentedowing to insufficient data.Data analysis and presentation of resultsThe country data included in the calculations are those for which countries havereported a complete time series for the variable for all reporting years.The change rate for variables on the subregional scale is expressed as the compoundchange rate in percent per annum for the period 1990–<strong>2005</strong> (1990-2000 for area of forestaffected by fire; area of forest affected by insects, diseases and other disturbances; totalemployment; and area of forest under private ownership). Thus the rate is based on twodifferent estimates – the accuracy of which is unknown. An arbitrary threshold of +/-0.50percent per year was selected for all variables in order to highlight large changes and todistinguish cases in which a difference between the two estimates may indicate an actualchange from those in which the difference may not be statistically significant.
132<strong>Global</strong> <strong>Forest</strong> <strong>Resources</strong> <strong>Assessment</strong> <strong>2005</strong>Simple, three-coloured ‘traffic light’ matrices were prepared to visualize changerates in the variables listed under each thematic area for a particular region. Theseindicate trends in the selected variables over time and the progress they reflect towardssustainable forest management. Trends can thus be positive, negative or with no majorchange (+/-0.50 percent per year) for each of the 21 variables.Results are presented at global, regional and subregional levels and related to keystatistics for each theme. For the subregional level, the number of positive and negativetrends in each subregion was also related to two parameters – forest area and ruralpoor population – with the aim of illustrating progress towards sustainable forestmanagement from different perspectives.RESULTS<strong>Global</strong> levelTable 8.2 summarizes trends in the selected variables at the global level.Extent of forest resources. The area of forest has decreased by an average of 8.4 millionhectares per year since 1990, or 0.21 percent per year. The other variables under thistheme also show a decrease over time, but none of the change rates exceed the thresholdof 0.50 percent annually.TABLE 8.2Trends towards sustainable forest management at the global levelThematic element Trends in FRA <strong>2005</strong> variables Data 1990–<strong>2005</strong> 1990–<strong>2005</strong> Unitor derivatives availability Annual Annualchange rate change(%)Extent of forest resources Area of forest H -0.21 -8 351 1 000 haArea of other wooded land M -0.35 -3 299 1 000 haGrowing stock of forests H -0.15 -570 million m³Carbon stock per hectare in forest H -0.02 -0.15 tonnes/habiomassBiological diversity Area of primary forest H -0.52 -5 848 1 000 haArea of forest designated primarily H 1.87 6 391 1 000 hafor conservation of biological diversityTotal forest area excluding area of H -0.26 -9 397 1 000 haproductive forest plantations<strong>Forest</strong> health and vitality Area of forest affected by fire M -0.49 -125 1 000 haArea of forest affected by insects, M 1.84 1 101 1 000 hadiseases and other disturbancesProductive functions of forest Area of forest designated primarily H -0.35 -4 552 1 000 haresourcesfor productionArea of productive forest plantations H 2.38 2 165 1 000 haCommercial growing stock H -0.19 -321 million m³Total wood removals H -0.11 -3 199 1 000 m³Total NWFP removals M 2.47 143 460 tonnesProtective functions of forest Area of forest designated primarily H 1.06 3 375 1 000 haresourcesfor protectionArea of protective forest plantations H 1.41 380 1 000 haSocio-economic functions Value of total wood removals L 0.67 377 million US$Value of total NWFP removals M 0.80 33 million US$Total employment M -0.97 -102 1 000 pers. yrsArea of forest under private ownership M 0.76 2 737 1 000 haArea of forest designated primarily H 8.63 6 646 1 000 hafor social servicesH = High (reporting countries represent 75–100% of total forest area)M = Medium (reporting countries represent 50–75% of total forest area)L = Low (reporting countries represent 25–50% of total forest area)= Positive change (greater than 0.50%)= No major change (between -0.50 and 0.50%)= Negative change (less than -0.50%)– = Insufficient data to determine trend
Progress towards sustainable forest management 133Biological diversity. The area of primary forest decreased by an average of 5.8 millionhectares per year (excluding the Russian Federation, where large differences in thevalues for 1990 and <strong>2005</strong> were due to the introduction of a new classification system).On a positive note, the area of forest designated for conservation of biological diversityincreased by about 6.4 million hectares per year during the same period – or a total of96 million hectares.<strong>Forest</strong> health and vitality. The area of forest adversely affected by insects, diseasesand other disturbances shows an increase equivalent to 1.1 million hectares per year,while the area adversely affected by forest fires shows a small decrease. However,information was missing from many countries, particularly from Africa.Productive functions of forest resources. The most prominent changes over time are adecrease in the area of forest designated primarily for productive purposes – an averageof 4.6 million hectares per year – and an increase in area of productive forest plantationsof 2.2 million hectares per year. This shift indicates that substantial areas of naturalforests previously allocated for productive purposes are now designated for other uses,while the proportion of wood removals coming from forest plantations is likely tosignificantly increase in the future.Protective functions of forests. Both variables under this theme show an increasesince 1990. The area of forest designated primarily for protective purposes has thusincreased by close to 3.4 million hectares per year or more than 50 million hectaresduring the last 15 years.Socio-economic functions. The nominal values of removals of wood and non-woodforest products have increased, but less than the average rate of inflation. Employmentin forest conservation and management has decreased by about 1 percent per year. Thearea of privately owned forests has increased by an average of 2.7 million hectares peryear in the period 1990–2000 (<strong>2005</strong> data not requested from countries). Area of forestdesignated for the provision of recreation, education and other social services hasincreased by more than 6.6 million hectares per year – or a total of 100 million hectaressince 1990 – primarily due to a large increase in Brazil, which is partly offset by a muchsmaller decrease in the Russian Federation caused by a reclassification of forests.Conclusions. Overall, the situation at the global level has remained relatively stable.Negative trends include decreases in area of primary forest and employment and anincrease in area of forest adversely affected by insects, diseases and other disturbances.Positive trends were reported in the area of forest designated for biological diversity andsocial services, as well as for area of productive and protective forest plantations, valueof wood removals and amount and value of NWFP removals, and area of forests underprivate ownership.AfricaTable 8.3 summarizes trends in the selected variables for Africa.Extent of forest resources. The region of Africa consists of three subregions (Easternand Southern Africa, Northern Africa and Western and Central Africa). Area of forestdecreased at an alarming rate during the period. There are indications, however, thatthe net loss of forests is slowing down. In the period 1990–2000, the net area changewas about -4.4 million hectares per year, whereas in the period 2000–<strong>2005</strong>, it averaged-4.0 million hectares per year. The decrease in other wooded land was about half thatof forest area (2.2 million hectares per year). The decrease in growing stock was belowthe threshold of 0.50 percent per year; however annual reductions in growing stock forthe period were about 275 million m 3 . Carbon stock per hectare did not change, but thisprobably reflects the fact that few countries have more than one estimate of growingstock over time. The overall trend for this theme is thus negative.Biological diversity. The area of primary forest in Africa decreased by some270 000 ha annually during 1990–<strong>2005</strong>. However, information for this variable was
134<strong>Global</strong> <strong>Forest</strong> <strong>Resources</strong> <strong>Assessment</strong> <strong>2005</strong>TABLE 8.3Trends towards sustainable forest management in AfricaThematic element Trends in FRA <strong>2005</strong> variables Data 1990–<strong>2005</strong> 1990–<strong>2005</strong> Unitor derivatives availability Annual Annualchange rate change(%)Extent of forest resources Area of forest H -0.64 -4 263 1 000 haArea of other wooded land M -0.52 -2 193 1 000 haGrowing stock of forests H -0.41 -275 million m³Carbon stock per hectare in forest H 0.01 0.1 tonnes/habiomassBiological diversity Area of primary forest M -0.68 -270 1 000 haArea of forest designated primarily M 0.27 182 1 000 hafor conservation of biological diversityTotal forest area excluding area of M -0.75 -3 361 1 000 haproductive forest plantations<strong>Forest</strong> health and vitality – Area of forest affected by fire 1 000 ha– Area of forest affected by insects,diseases and other disturbances1 000 haProductive functions of forest Area of forest designated primarily M -0.64 -911 1 000 haresourcesfor productionArea of productive forest plantations M 0.41 42 1 000 haCommercial growing stock M -0.39 -22 million m³Total wood removals H 1.89 10 767 1 000 m³– Total NWFP removals tonnesProtective functions of forest Area of forest designated primarily M -0.25 -52 1 000 haresourcesfor protectionArea of protective forest plantations M 1.22 26 1 000 haSocio-economic functions – Value of total wood removals million US$H = High (reporting countries represent 75–100% of total forest area)M = Medium (reporting countries represent 50–75% of total forest area)L = Low (reporting countries represent 25–50% of total forest area)= Positive change (greater than 0.50%)= No major change (between -0.50 and 0.50%)= Negative change (less than -0.50%)– = Insufficient data to determine trend– Value of total NWFP removals million US$Total employment L 3.44 12 1 000 pers. yrsArea of forest under private ownership H -0.48 -49 1 000 haArea of forest designated primarily M -0.04 -0.2 1 000 hafor social servicesbased on 46 countries that together account for 67 percent of the forest area, withinformation missing from most of the countries in the Congo Basin (which representsthe second largest area of tropical primary forest after the Amazon Basin). Some of thisdecrease was caused by deforestation, some by alteration of forests through selectivelogging and other human interventions. This ‘altered’ forest area was subsequentlyclassified as modified natural forest. On a positive note, there has been an increase inthe area of forest designated primarily for conservation of biological diversity of closeto 3 million hectares since 1990.<strong>Forest</strong> health and vitality. Data availability was insufficient for trend analysis.Productive functions of forest resources. There was a steady increase in woodremovals from 500 million m 3 in 1990 to 661 million m 3 in <strong>2005</strong>, or an annual increaseof almost 11 million m 3 . Yet the area designated for production of wood and non-woodforest products decreased by nearly a million hectares per year. Most of the increasein wood removals stemmed from increased production of fuelwood – on average, anincrease of more than 9 million m 3 /year – particularly in Western and Central Africa. Alarge part of this may have been collected from areas outside forests (other wooded landand trees outside forests). Some may have come from forests designated for multiple
Progress towards sustainable forest management 135purposes – including community forests – rather than from forests designated primarilyfor productive purposes.Protective functions of forest resources. The area of forest designated for protectivefunctions shows a slight decrease, while the area of protective forest plantations showsan increase.Socio-economic functions. The status of the information is generally quite weak anddata availability is low for most of the variables under this theme. Employment in forestmanagement and conservation seemed to have increased, while the area under privateownership declined.Conclusions. On the whole, progress towards sustainable forest management inAfrica appears to have been limited during the last 15 years. There are some indicationsthat the net loss of forest area has slowed down and that the area of forest designated forconservation of biological diversity increased slightly. However, the continued, rapidloss of forest area (the largest of any region during this 15-year period) is particularlydisconcerting. A summary of information by subregion can be found in Table 8.9.AsiaTable 8.4 summarizes trends in the selected variables for Asia.Extent of forest resources. The region of Asia consists of three subregions showinggreat variation (East Asia, South and Southeast Asia and Western and Central Asia).In the period 1990–<strong>2005</strong>, area of forest was virtually stable, with an annual decrease of191 000 ha or -0.03 percent. However, it should be noted that, within this period, a netloss of forests of about 792 000 ha per year in the 1990s was reversed into an annual netgain of 1 million hectares in the period 2000–<strong>2005</strong>, largely due to increased plantationactivity in the region, particularly in China. The annual net loss of forests in South andSoutheast Asia averaged about 2.7 million hectares per year. In the period 1990–<strong>2005</strong>,the regional net annual decrease in growing stock was about 290 million m 3 /year. Therewas, however, a large variation among the three subregions, with an annual net increaseof 260 million m 3 in East Asia and 13 million m 3 in Western and Central Asia. In Southand Southeast Asia the annual net decrease was 559 million m 3 . Carbon stock perhectare was largely unchanged – reflecting the fact that few countries had more thanone estimate of growing stock per hectare over time. Over the last 15 years, the regionaltrend for this theme was largely stable or slightly negative, with some recent positivetrends in a number of countries.Biological diversity. The area of primary forest decreased at the alarming rate of1.5 million hectares per year during the last 15 years – entirely explained by large lossesin the subregion of South and Southeast Asia, particularly in Indonesia. The cause ofthe decrease was not only deforestation but also alteration of forests through selectivelogging and other human interventions, which resulted in a subsequent classification ofsuch forests as modified natural forest. About 13 percent of the forest area is currentlydesignated primarily for conservation of biological diversity, representing an averageannual increase of some 850 000 ha or about 1.3 percent since 1990.<strong>Forest</strong> health and vitality. The area affected by fire and other disturbances increasedslightly, but data for the area of forest affected by insects, diseases and other disturbanceswere generally quite weak.Productive functions of forest resources. The forest area designated primarily forthe production of wood and non-wood forest products decreased by an average of774 000 ha per year, while the area of productive forest plantations increased by anaverage of about 1 million hectares per year or 2.9 percent. In the last five years, thearea of productive forest plantations increased by 1.6 million hectares per year, which isthe highest increase of any region. This rapid expansion took place primarily in China,where the area of productive forest plantations increased by about 460 000 ha/year inthe 1990s and 1.35 million hectares per year in the period 2000–<strong>2005</strong> – an increase of
136<strong>Global</strong> <strong>Forest</strong> <strong>Resources</strong> <strong>Assessment</strong> <strong>2005</strong>TABLE 8.4Trends towards sustainable forest management in AsiaThematic element Trends in FRA <strong>2005</strong> variables Data 1990–<strong>2005</strong> 1990–<strong>2005</strong> Unitor derivatives availability Annual Annualchange rate change(%)Extent of forest resources Area of forest H -0.03 -194 1 000 haArea of other wooded land M -0.36 -697 1 000 haGrowing stock of forests H -0.58 -286 million m³Carbon stock per hectare in forest H -0.15 -1 tonnes/habiomassBiological diversity Area of primary forest H -1.52 -1 510 1 000 haArea of forest designated primarily H 1.31 848 1 000 hafor conservation of biological diversityTotal forest area excluding area of H -0.23 -1 224 1 000 haproductive forest plantations<strong>Forest</strong> health and vitality Area of forest affected by fire H 1.15 127 1 000 haArea of forest affected by insects, M 0.30 35 1 000 hadiseases and other disturbancesProductive functions of forest Area of forest designated primarily H -0.30 -774 1 000 haresourcesfor productionArea of productive forest plantations H 2.90 1 033 1 000 haCommercial growing stock M 0.51 95 million m³Total wood removals H -1.49 -6 116 1 000 m³Total NWFP removals M 3.71 160 796 tonnesProtective functions of forest Area of forest designated primarily H 1.94 2 325 1 000 haresourcesfor protectionArea of protective forest plantations H 0.99 187 1 000 haSocio-economic functions Value of total wood removals H -2.27 -452 million US$H = High (reporting countries represent 75–100% of total forest area)M = Medium (reporting countries represent 50–75% of total forest area)L = Low (reporting countries represent 25–50% of total forest area)= Positive change (greater than 0.50%)= No major change (between -0.50 and 0.50%)= Negative change (less than -0.50%)– = Insufficient data to determine trendValue of total NWFP removals L 1.40 191 million US$Total employment H -1.15 -100 1 000 pers. yrsArea of forest under private ownership H 0.66 179 1 000 haArea of forest designated primarily H 1.18 39 1 000 hafor social services193 percent compared with the previous decade. Total wood removals have decreasedsignificantly during this period – also partly because of China, where a logging ban wasin effect for a large part of the forest area and wood is now being imported – includingfrom outside the region. Several countries noted that the figures for wood removalssubmitted do not take into account illegal removals or informal collection of fuelwood,so actual removals may be underestimated.Protective functions of forest resources. Both the area of forest designated forprotective purposes and the area of forest plantations managed for this purpose showan increase, reflecting a greater attention to the role forests play in the conservation ofsoil and water and other protective functions.Socio-economic functions. The value of wood removals decreased, over and abovethe decrease in the amount of wood removed, while the value of NWFPs increasedduring the last 15 years. Employment also shows a reduction, while the area of forestunder private ownership and the areas designated for recreation, education and othersocial services increased.Conclusions. Overall, forest area was almost the same in <strong>2005</strong> as in 1990 (572 millionhectares versus 574 – or a decrease of 0.03 percent per year), owing to large-scale afforestation
Progress towards sustainable forest management 137efforts during the last 7-8 years, particularly in China. <strong>Forest</strong> health deteriorated, but forestfires, pests and diseases were still affecting a relatively small proportion of the total forestarea in Asia (2.2, 2.6 and 2.4 percent respectively). The rapid decrease in area of primaryforest is cause for concern, while the increase in area designated for conservation ofbiological diversity and for protective functions is commendable. In short, there has beenmixed progress over the last 15 years. A summary of information by subregion can befound in Table 8.9.EuropeTable 8.5 summarizes trends in the selected variables for Europe.Extent of forest resources. <strong>Forest</strong> area in Europe increased by an average of 805 000 haper year or 0.08 percent of total forest area. Over the last 15 years, total growing stockincreased by nearly 340 million m 3 per year and forests in Europe became more denselystocked. Average volume per hectare increased from 103 to 107 m 3 /ha (124 to 141m 3 /haexcluding the Russian Federation – an annual increase of 1.2 m 3 per hectare per year),which also means that forests were sequestrating more carbon. The area of other woodedland, on the other hand, diminished at a rate of 0.28 percent – or 286 000 ha – per year.TABLE 8.5Trends towards sustainable forest management in EuropeThematic element Trends in FRA <strong>2005</strong> variables Data 1990–<strong>2005</strong> 1990–<strong>2005</strong> Unitor derivatives availability Annual Annualchange rate change(%)Extent of forest resources Area of forest H 0.08 805 1 000 haArea of other wooded land H -0.28 -286 1 000 haGrowing stock of forests H 0.33 340 million m³Carbon stock per hectare in forest H 0.02 0.1 tonne/habiomassBiological diversity Area of primary forest H 0.37 956 1 000 haArea of forest designated primarily H 4.72 1 224 1 000 hafor conservation of biological diversityTotal forest area excluding area of H 0.03 332 1 000 haproductive forest plantations<strong>Forest</strong> health and vitality Area of forest affected by fire H 4.27 54 1 000 haArea of forest affected by insects, H 6.27 729 1 000 hadiseases and other disturbancesProductive functions of forest Area of forest designated primarily H -0.44 -3 277 1 000 haresourcesfor productionArea of productive forest plantations H 1.71 322 1 000 haCommercial growing stock H -0.52 -322 million m³Total wood removals H -0.67 -4 783 1 000 m³Total NWFP removals H -0.49 -1 872 tonnesProtective functions of forest Area of forest designated primarily H 0.99 826 1 000 haresourcesfor protectionArea of protective forest plantations H 1.86 97 1 000 haSocio-economic functions – Value of total wood removals million US$H = High (reporting countries represent 75–100% of total forest area)M = Medium (reporting countries represent 50–75% of total forest area)L = Low (reporting countries represent 25–50% of total forest area)= Positive change (greater than 0.50%)= No major change (between -0.50 and 0.50%)= Negative change (less than -0.50%)– = Insufficient data to determine trendValue of total NWFP removals H 1.46 22 million US$Total employment H -2.61 -23 1 000 pers. yrsArea of forest under private ownership H 1.36 1 257 1 000 haArea of forest designated primarily H -1.89 -496 1 000 hafor social services
138<strong>Global</strong> <strong>Forest</strong> <strong>Resources</strong> <strong>Assessment</strong> <strong>2005</strong>Biological diversity. Four percent of forest area is currently designated primarily forconservation of biological diversity. If the Russian Federation is excluded, the share isabout 12 percent. There was a large increase in this area since 1990 (1.2 million hectaresper year). The figures on primary forest include the Russian Federation, in whichlarge changes were primarily owing to the introduction of a new classification system.Excluding the Federation, there was still a slight increase, which is explained by the factthat areas of natural forest have been set aside and protected from human intervention.With time, these areas evolve into forests in which there are no clearly visible indicationsof human activity and ecological processes are not significantly disturbed, which is thedefinition of primary forests used in FRA <strong>2005</strong>.<strong>Forest</strong> health and vitality. An increase in the average area of forest affected by otherdisturbances was evident when comparing the 1988–1992 period with that of 1998–2002.The storms that hit Europe in December 1999 may have resulted in an increase in areasaffected by insects and diseases as well. The area affected by forest fires also increasedduring this period in relative or percentage terms, but was still a very small proportion(0.2 percent) of the total forest area.Productive functions of forest resources. The total volume of wood removals andcommercial growing stock decreased in the last 15 years. There was a large increasein area of productive forest plantations, almost 5 million hectares during 1990–<strong>2005</strong>or an annual increase of about 1.7 percent. The area of forest used primarily for woodproduction decreased and forest plantations now account for a larger proportion offorest area available for wood supply. The change in area of forest designated primarilyfor production was less than 0.5 percent per year. However, this area has decreased byclose to 50 million hectares since 1990, with corresponding gains in the areas of forestdesignated for multiple-purpose, conservation and protective functions.Protective functions of forest resources. The area of forest designated primarily forprotection increased by more than 800 000 ha per year for the period 1990–<strong>2005</strong>.Socio-economic functions. The area of forest under private ownership increasedby more than 1 million hectares per year. To a large extent this is owing to theongoing privatization process in central and eastern European countries. The level ofemployment in forest conservation and management decreased – probably due to anincrease in mechanization and streamlining in organizations, as well as to a decrease inthe amount of wood removals. The area of forest designated primarily for the provisionof recreation, education and other social services decreased since 1990, mainly as aresult of the reclassification of forests in the Russian Federation during this period. Thetotal area of forest in Europe providing such services (as either primary or secondaryfunction) is the highest in the world (72 percent of total forest area).Conclusions. Data availability was high and the status of forest resources in Europewas essentially stable, although forests in Europe suffered from occasional storms. Thesevere storms of 1999 were the main reason for the negative trend in the health andvitality of forests. The focus of forest management in Europe has clearly shifted awayfrom productive functions towards conservation of biological diversity, protection andmultiple uses.North and Central AmericaTable 8.6 summarizes trends in the selected variables for North and Central America.Extent of forest resources. The region of North and Central America consists ofthree subregions (the Caribbean, Central America and North America). <strong>Forest</strong> areafor the region as a whole is virtually the same as in 1990, as is the area of other woodedland. There was a decrease in forest area in Central America of about 350 000 ha peryear for the period 1990–<strong>2005</strong>. In North America, forest area decreased by about100 000 ha annually from 2000 to <strong>2005</strong> – down from a net increase of 17 000 ha peryear in 1990–2000. This current net loss of forests was primarily due to a decrease in
Progress towards sustainable forest management 139TABLE 8.6Trends towards sustainable forest management in North and Central AmericaThematic element Trends in FRA <strong>2005</strong> variables Data 1990–<strong>2005</strong> 1990–<strong>2005</strong> Unitor derivatives availability Annual Annualchange rate change(%)Extent of forest resources Area of forest H -0.05 -329 1 000 haArea of other wooded land M 0.01 16 1 000 haGrowing stock of forests H 0.23 159 million m³Carbon stock per hectare in forest L 0.05 0.3 tonnes/habiomassBiological diversity Area of primary forest H -0.17 -545 1 000 haArea of forest designated primarily H 0.86 712 1 000 hafor conservation of biological diversityTotal forest area excluding area of H -0.12 -800 1 000 haproductive forest plantations<strong>Forest</strong> health and vitality Area of forest affected by fire H -0.14 -6 1 000 haArea of forest affected by insects, H 0.88 307 1 000 hadiseases and other disturbancesProductive functions of forest Area of forest designated primarily H -0.05 -21 1 000 haresourcesfor productionArea of productive forest plantations H 3.46 471 1 000 haCommercial growing stock H 0.27 160 million m³Total wood removals H -0.14 -1 201 1 000 m³– Total NWFP removals tonnesProtective functions of forest Area of forest designated primarily H 2.85 77 1 000 haresourcesfor protectionArea of protective forest plantations H 13.14 67 1 000 haSocio-economic functions Value of total wood removals M 4.19 617 million US$H = High (reporting countries represent 75–100% of total forest area)M = Medium (reporting countries represent 50–75% of total forest area)L = Low (reporting countries represent 25–50% of total forest area)= Positive change (greater than 0.50%)= No major change (between -0.50 and 0.50%)= Negative change (less than -0.50%)– = Insufficient data to determine trendValue of total NWFP removals M 2.66 1.6 million US$Total employment H 0.98 4.8 1 000 pers. yrsArea of forest under private ownership H 0.06 129 1 000 haArea of forest designated primarily H 0 0 1 000 hafor social servicesthe forest plantation establishment rate in the United States (down from an average of596 900 ha/year in 1990–2000 to an average of 157 400 ha/year in the period 2000–<strong>2005</strong>)and the continued, albeit decreasing, net loss of forests in Mexico. In contrast, therewas an annual increase in forest area of about 40 000 ha in the Caribbean subregion,mainly due to natural expansion onto abandoned agricultural land. There is limitedinformation on carbon stock in forests, due to lack of information from Canada andan incomplete dataset from the United States.Biological diversity. There were decreases in the areas of primary forest and oftotal forest excluding productive forest plantations, but the change rates were below0.2 percent per year. The area of forest designated for conservation of biological diversityincreased by 712 000 ha per year since 1990, or more than 10 million hectares in total.<strong>Forest</strong> health and vitality. The area adversely affected by forest fires shows onlylimited changes over time, while the area affected by insects, diseases and otherdisturbances increased.Productive functions of forest resources. The most prominent change over time wasthe increase in area of productive forest plantations – from 3.3 percent of total forestarea in 1990 to 5.1 percent in 2000 and 5.4 percent in <strong>2005</strong>. The area of forest designated
140<strong>Global</strong> <strong>Forest</strong> <strong>Resources</strong> <strong>Assessment</strong> <strong>2005</strong>primarily for productive purposes remained fairly stable, while total wood removalsdecreased slightly, by 1.2 million m 3 per year – or 0.14 percent.Protective functions of forest resources. Both of the variables related to protectivefunctions showed an increase in relative (percentage) terms during the last 15 years.However, the increases in absolute terms were fairly small compared with other variables.Socio-economic functions. The value of both wood and non-wood forest productsincreased since 1990, despite a slight decrease in the amount of wood removals. The levelof employment in forest conservation and management also shows an increase.Conclusions. Progress towards sustainable forest management was generally positivein North and Central America as a whole during the period 1990–<strong>2005</strong>, with none ofthe annual rates of negative trends being more than 0.20 percent – except for the areaadversely affected by insects, diseases and other disturbances. There was, however,considerable variation among subregions, as can be seen in Table 8.9.OceaniaTable 8.7 summarizes trends in the selected variables for Oceania.Extent of forest resources. Area of forest was essentially stable over the period 1990–<strong>2005</strong>. The reported annual change was -417 000 ha per year or -0.2 percent per year.Information availability was insufficient to determine trends in the remaining variablesunder this theme.Biological diversity. There was a slight increase in area of primary forest. Informationavailability was insufficient on area of forest designated for biological diversity conservation(1990 data were missing for Australia). Total forest area, excluding area of productiveforest plantations, decreased slightly, following the trend for forest area as a whole.<strong>Forest</strong> health and vitality. Data availability was insufficient for trend analysis.Productive functions of forest resources. Information availability was insufficient onarea of forest designated for productive purposes (1990 data were missing for Australia)and on commercial growing stock. The area of productive forest plantations increased,as did the amount of wood removals.Protective functions of forest resources. Information availability was insufficient onarea of forest designated for protective purposes (1990 data were missing for Australia).However, the area of protective forest plantations increased at the very high rate of28 percent per year, from 500 ha in 1990 to 3 100 ha in 2000 and 21 100 in <strong>2005</strong>.Socio-economic functions. The number of persons employed in the primaryproduction of forest goods and services and related activities increased from 1990 to2000 (data not requested for <strong>2005</strong>). Information availability was insufficient for ananalysis of the other variables.Conclusions. The status of the information for Oceania was generally very weak,and low data availability was a serious issue in the region. Data were insufficient fordetermining regional trends for two-thirds of the variables. Thus it is difficult to assessprogress towards sustainable forest management.South AmericaTable 8.8 summarizes trends in the selected variables for South America.Extent of forest resources. <strong>Forest</strong> area in South America decreased at an alarming rateand continues to do so. The annual net loss during the period 1990–2000 was 3.8 millionhectares, and in the period 2000–<strong>2005</strong> the annual net loss increased to 4.3 millionhectares, which was the highest annual net loss of any region during this five-yearperiod and corresponds to almost 60 percent of the total annual net loss. However, itshould be noted that the figures for Brazil referred to areas of forest cleared, withouttaking into account the part of clear-cut areas that may have regenerated and returned toforest. Net loss for the region as a whole may thus be overestimated and was below thethreshold of 0.50 percent per year for the period 1990–<strong>2005</strong> as a whole. Growing stock
Progress towards sustainable forest management 141TABLE 8.7Trends towards sustainable forest management in OceaniaThematic element Trends in FRA <strong>2005</strong> variables Data 1990–<strong>2005</strong> 1990–<strong>2005</strong> Unitor derivatives availability Annual Annualchange rate change(%)Extent of forest resources Area of forest H -0.20 -417 1 000 ha– Area of other wooded land 1 000 ha– Growing stock of forests million m³– Carbon stock per hectare in forest tonnes/habiomassBiological diversity Area of primary forest H 0.24 82 1 000 ha– Area of forest designated primarily 1 000 hafor conservation of biological diversityTotal forest area excluding area of H -0.23 -471 1 000 haproductive forest plantations<strong>Forest</strong> health and vitality – Area of forest affected by fire 1 000 ha– Area of forest affected by insects, 1 000 hadiseases and other disturbancesProductive functions of forest – Area of forest designated primarily 1 000 haresourcesfor productionArea of productive forest plantations H 3.00 91 1 000 ha– Commercial growing stock million m³Total wood removals H 2.56 1 348 1 000 m³– Total NWFP removals tonnesProtective functions of forest – Area of forest designated primarily 1 000 haresourcesfor protectionArea of protective forest plantations H 28.34 1.4 1 000 haSocio-economic functions – Value of total wood removals million US$H = High (reporting countries represent 75–100% of total forest area)M = Medium (reporting countries represent 50–75% of total forest area)L = Low (reporting countries represent 25–50% of total forest area)= Positive change (greater than 0.50%)= No major change (between -0.50 and 0.50%)= Negative change (less than -0.50%)– = Insufficient data to determine trend– Value of total NWFP removals million US$Total employment H 0.79 0.3 1 000 pers. yrs– Area of forest under private ownership 1 000 ha– Area of forest designated primarily 1 000 hafor social servicesfollowed the trend of total forest area, while carbon stock per hectare reportedly did notchange – probably reflecting the fact that few countries had more than one estimate ofgrowing stock over time.Biological diversity. Primary forests currently account for 77 percent of totalforest area in the region but continue to decrease rapidly. The net loss of primaryforest increased from 3.0 million hectares per year in the period 1990–2000 to almost3.9 million hectares in the period 2000–<strong>2005</strong>. Apart from deforestation, the decrease wascaused by alteration of forests through selective logging and other human interventions,which resulted in a subsequent classification of such forests as modified natural forests.On a positive note, the area of forest designated primarily for conservation of biologicaldiversity increased by about 3.3 million hectares per year in the last 15 years, or a totalof 50 million hectares – equivalent in size to the area of primary forest lost during thisperiod.<strong>Forest</strong> health and vitality. The area of forest adversely affected by fire and otherdisturbances increased, but was still relatively small (less than 1 percent combined).However, some countries presented incomplete information on this topic, so the figuresshould be considered underestimates.
142<strong>Global</strong> <strong>Forest</strong> <strong>Resources</strong> <strong>Assessment</strong> <strong>2005</strong>TABLE 8.8Trends towards sustainable forest management in South AmericaThematic element Trends in FRA <strong>2005</strong> variables Data 1990–<strong>2005</strong> 1990–<strong>2005</strong> Unitor derivatives availability Annual Annualchange rate change(%)Extent of forest resources Area of forest H -0.46 -3 952 1 000 haArea of other wooded land L -0.13 -138 1 000 haGrowing stock of forests M -0.51 -503 million m³Carbon stock per hectare in forest H 0 0 tonnes/habiomassBiological diversity Area of primary forest H -0.53 -3 297 1 000 haArea of forest designated primarily H 3.69 3 342 1 000 hafor conservation of biological diversityTotal forest area excluding area of H -0.49 -3 872 1 000 haproductive forest plantations<strong>Forest</strong> health and vitality Area of forest affected by fire H 1.00 1 1 000 haArea of forest affected by insects, M 4.13 46 1 000 hadiseases and other disturbancesProductive functions of forest Area of forest designated primarily H 0.21 190 1 000 haresourcesfor productionArea of productive forest plantations H 2.16 207 1 000 haCommercial growing stock M -0.97 -229 million m³Total wood removals H -0.76 -3 214 1 000 m³Total NWFP removals M -2.14 -16 800 tonnesProtective functions of forest Area of forest designated primarily H 0.21 195 1 000 haresourcesfor protectionArea of protective forest plantations H 7.48 1 1 000 haSocio-economic functions Value of total wood removals H -1.23 -760 million US$H = High (reporting countries represent 75–100% of total forest area)M = Medium (reporting countries represent 50–75% of total forest area)L = Low (reporting countries represent 25–50% of total forest area)= Positive change (greater than 0.50%)= No major change (between -0.50 and 0.50%)= Negative change (less than -0.50%)– = Insufficient data to determine trendValue of total NWFP removals M -5.10 -15 million US$– Total employment 1 000 pers. yrs– Area of forest under private ownership 1 000 haArea of forest designated primarily H 20.33 7 102 1 000 hafor social servicesProductive functions of forest resources. The area designated for productive functionswas essentially stable, while the area of productive forest plantations increased. Totalwood removals decreased by about 3.2 million m 3 per year. This was caused by adecrease in the amount of fuelwood removals of 8.6 million m 3 per year, partly offsetby an increase in the amount of removals of industrial wood of 5.3 million m 3 per year.Commercial growing stock and NWFP removals decreased during the period.Protective functions of forest resources. Both variables showed an increase since1990. Protective forest plantations increased by 7.5 percent per year, but the area is stillrelatively small (31 000 ha in <strong>2005</strong> – or 0.004 percent of total forest area).Socio-economic functions. The area designated for social services increased by morethan 7 million hectares per year since 1990. This mainly reflected the allocation of largeareas in Brazil as ‘indigenous lands’ and ‘sustainable development reserves’, where bothof these categories were classified as designated for social services.Conclusions. Overall, progress towards sustainable forest management was mixed inSouth America. The increasing trend in the area of net forest loss is cause for concern,as is the rate of loss of primary forest. Yet there were also positive signs in the increasedareas of forest designated for conservation of biological diversity and for social services.
Progress towards sustainable forest management 143The decrease in removals of fuelwood may reflect a reduced demand for this productin the region, but was partly offset by an increase in removals of industrial wood. Thearea of productive forest plantations increased and may meet a larger proportion of thedemand for wood in the future.Subregional levelThree regions (Africa, Asia and North and Central America) having significantintraregional differences were divided into three subregions each and subregionaltrends were determined using the same method used for the regions. No subdivisionswere made of Europe, Oceania and South America, which can be considered relativelyhomogeneous with respect to the variables studied. The possible exception is Europe,where the Russian Federation dominates owing to its size, but the preference in thisstudy was not to single out any individual country in the presentation. The resulting setof 12 subregions and regions constituted the basis for the analysis in this section, and as aset is referred to as the ‘subregions’. Table 8.9 summarizes the results for each subregionand illustrates some important intraregional differences.In Africa, Western and Central Africa had more positive trends than negative ones,while Eastern and Southern Africa had predominantly negative trends. However, it is alsonoteworthy that information availability for Western and Central Africa was generallypoorer than for the other subregions (except for the extent of forest resources), whichmay have affected the results. North America and the Caribbean also had a majority ofpositive trends, whereas Central America had a preponderance of negative ones. The mostsignificant difference occurs in Asia, where East Asia had a strong set of positive trends,while the South and Southeast Asia subregion was dominated by negative trends. Clearly,the division into subregions reveals trend patterns that are not prominent on a regionalscale, just as the regional breakdown highlighted variations masked on the global scale. Asis also clear from Table 8.9, there is a mix of positive and negative trends in all subregions.In considering progress towards sustainable forest management, the very largedifferences among the subregions in size and population structure must be taken intoconsideration. Two parameters – forest area (Table 1 in Chapter 2) and the number ofrural poor people (Table 3 in Chapter 1) – were selected and applied as arbitrary weightsto indicate the relative significance of the observed trends (Figure 8.2).When weighting by forest area, Europe, North America and South America dominatethe picture. It is also clear that Europe and North America contribute considerably tothe positive and stable trends and less to the negative ones, whereas the trends for SouthAmerica are mostly negative. Overall, there seems to be a balance between positive andnegative trends, assuming that the selected variables are valid, that they are all weightedequally and that a weighting by forest area of each subregion is relevant.When weighting by rural poor population, the picture becomes dramatically different.Some of the African subregions are more prominent, and the subregion of South andSoutheast Asia dominates. Obviously, the developed regions become less significant, asthere are relatively few rural poor in these areas. Compared with the weighting by forestarea, there is a higher proportion of negative trends from this poverty perspective.DISCUSSIONApproach and limitationsSeveral disclaimers must be advanced regarding the methodology and findings presentedin this chapter:• As stated in Chapter 1, the variables in FRA <strong>2005</strong> do not address all aspects ofsustainable forest management.• Information availability is not satisfactory for all variables, which leaves a numberof gaps in the analysis.• Selection of variables is subjective and may not be valid in other contexts or scales.
144<strong>Global</strong> <strong>Forest</strong> <strong>Resources</strong> <strong>Assessment</strong> <strong>2005</strong>TABLE 8.9Trends towards sustainable forest management by subregionThemes and variables Africa AsiaExtent of forest resourcesEastern Northern Western East South Westernand Southern and Central and Southeast and CentralArea of forest H H H H H HArea of other wooded land M L H H M HGrowing stock of forests H H H H H HCarbon stock per hectare in forestbiomass H H H H H HBiological diversityArea of primary forest H H L H H HArea of forest designated primarilyfor conservation of biological diversity H H L H H HTotal forest area excluding areaof productive forest plantations H H L H H H<strong>Forest</strong> health and vitalityArea of forest affected by fire – – – H H HArea of forest affected by insects,diseases and other disturbances – – – H L MProductive functions of forest resourcesArea of forest designated primarilyfor production H H L H H HArea of productive forest plantations H H L H H HCommercial growing stock H L L H M HTotal wood removals H H H H H HTotal NWFP removals – – – H L MProtective functions of forest resourcesArea of forest designated primarilyfor protection H H L H H HArea of protective forest plantations H H L H H HSocio-economic functionsValue of total wood removals – L – H H HValue of total NWFP removals – M – – L MTotal employment L M L H M HArea of forest under private ownership H H H H H HArea of forest designated primarily forsocial services H H L H H HH = High (reporting countries represent 75–100% of total forest area)M = Medium (reporting countries represent 50–75% of total forest area)L = Low (reporting countries represent 25–50% of total forest area)= Positive change (greater than 0.50%)= No major change (between -0.50 and 0.50%)= Negative change (less than -0.50%)– = Insufficient data to determine trend• Indications of positive or negative values for trends can be argued in several cases,particularly if the trend is seen in a bigger policy perspective. For example, the lossof forest area can be positive if agricultural development and efforts to improvefood security and self-sufficiency are national priorities.• Indications of positive or negative trends are not presented in relation to thecurrent status of forests and their management.• Although no weights are explicitly applied in the analyses, the selection of certainvariables is in itself a weighting.• Aggregation of trends by region and subregion obscures positive or negative trendsin individual countries. Results cannot therefore be seen as applicable to individualcountries in any region.
Progress towards sustainable forest management 145Europe North and Central America Oceania South America Themes and variablesCaribbean Central NorthExtent of forest resourcesH H H H H H Area of forestH H H M – L Area of other wooded landH H H H – M Growing stock of forestsCarbon stock per hectare in forestH L – – – M biomassBiological diversityH M H H H H Area of primary forestArea of forest designated primarilyH M H H – H for conservation of biological diversityTotal forest area excluding areaH M H H H H of productive forest plantations<strong>Forest</strong> health and vitalityH M – H – H Area of forest affected by fireArea of forest affected by insects,H – – H – M diseases and other disturbancesProductive functions of forest resourcesArea of forest designated primarilyH M H H – H for productionH M H H H H Area of productive forest plantationsH M M H – M Commercial growing stockH H H H H H Total wood removalsH L – – – M Total NWFP removalsProtective functions of forest resourcesArea of forest designated primarilyH M H H – H for protectionH M H H H H Area of protective forest plantationsSocio-economic functions– L H M – H Value of total wood removalsH L – M – M Value of total NWFP removalsH H M H H – Total employmentH M M H – – Area of forest under private ownershipArea of forest designated primarilyH M H H – H for social servicesThe analysis is clearly sensitive to the selection of variables. The options for variableswere limited by the set of FRA <strong>2005</strong> reporting tables and further reduced by the informationavailability for several of these. In addition, there is a high covariation between some variables,which must be considered before drawing far-reaching conclusions from the findings.The methodology used to illustrate these key trends does not take into account valuejudgments or variations in stakeholder perceptions of forest benefits and the relativeimportance of different variables. While such evaluation methodologies exist, e.g. Delphiapproaches, which were tested in the FRA <strong>2005</strong> process (<strong>FAO</strong>, 2003c), the objectivesof this study were to provide an example of how existing information, collected as partof FRA <strong>2005</strong>, can be used in an initial analysis of progress towards sustainable forestmanagement and to stimulate further discussion and more detailed analyses.
146<strong>Global</strong> <strong>Forest</strong> <strong>Resources</strong> <strong>Assessment</strong> <strong>2005</strong>FIGURE 8.2Distribution of subregional trends¹Eastern and Southern AfricaNorthern AfricaWestern and Central AfricaEast AsiaSouth and Southeast AsiaWestern and Central AsiaEuropeCaribbeanCentral AmericaNorth AmericaOceaniaSouth America0 10 20 30 40 50 60Percentage of total forest areaEastern and Southern AfricaNorthern AfricaWestern and Central AfricaEast AsiaSouth and Southeast AsiaWestern and Central AsiaEuropeCaribbeanCentral AmericaNorth AmericaOceaniaSouth America0 10 20 30 40 50 60Percentage of rural poor populationPositive trends Small changes Negative trends Missing data¹ The number of observed trends for each subregion in Table 8.9 has been multiplied by forest area (top), and number of ruralpoor (bottom). The results have been scaled to show the proportion in percentages of observed changes in each case.In conclusion, the analyses and presentations in this chapter are limited by thevariables and data available in the FRA <strong>2005</strong> reporting tables. Many relevant parametersare not included owing to lack of information at the global level, and a more detailedanalysis must take into consideration the varying conditions between regions andcountries. It should also be noted that the analyses do not cover all aspects of sustainableforest management: the thematic element of the legal, institutional and policy frameworkas well as forest benefits generated in secondary production and trade were explicitlyexcluded from FRA <strong>2005</strong>. Nevertheless, the results provide a global picture of key trendswith respect to the management and use of forest resources. It should be seen as oneillustration of progress, or lack of progress, towards sustainable forest management.
Progress towards sustainable forest management 147<strong>Forest</strong> or poverty perspective?The illustration of trends in relation to both forest area and rural poor populationprovides an additional example for discussion and further analyses. It is an attemptto combine subregional trends for all studied thematic elements of sustainable forestmanagement and to relate them to the relative proportion of the global forest area andthe number of rural poor people in each subregion. The number of observed positiveand negative trends should be seen as an illustration rather than an absolute result.Still, the presentation provides some insight into the very different conclusions thatmay be reached. <strong>Forest</strong> resources assessments have often had a relatively restrictedapproach, emphasizing results related to measures of forest area. However, the broadobjective of sustainable forest management, addressing also sustainable development,would suggest that a variety of analytical perspectives be included that encompasssocio-cultural, economic and environmental dimensions of forest resources, theirmanagement and uses.Is there progress towards sustainable forest management?Given the complexity of this question, the answer cannot be a definitive one. There aremany good signs and positive trends, but many negative trends remain. While intensiveforest plantation and conservation efforts are on the rise, primary forests continue tobecome degraded or converted to agriculture at alarming rates. As the analyses aboveillustrate, the answer also depends on the scale and perspective applied.
148<strong>Global</strong> <strong>Forest</strong> <strong>Resources</strong> <strong>Assessment</strong> <strong>2005</strong>
149Chapter 9Conclusions<strong>FAO</strong> has been coordinating global forest resources assessments since 1946. FRA <strong>2005</strong>is the latest and the most comprehensive assessment to date. Information was collectedand analysed from 229 countries and territories for three points in time: 1990, 2000 and<strong>2005</strong>. Some 40 variables were included, related to the extent, condition, uses and valuesof forests and other wooded land.More than 800 people were involved in the FRA <strong>2005</strong> process, including 172 officiallynominated national correspondents, their colleagues, an advisory group, internationalexperts, <strong>FAO</strong> and UNECE staff, consultants and volunteers from around the world.The outcome of this process is better data, a more transparent reporting process andenhanced national capacity in data analysis and reporting.This section offers general conclusions for FRA <strong>2005</strong> and highlights considerationsfor future assessments. It does not repeat detailed findings from previous chapters.PROGRESS TOWARDS SUSTAINABLE FOREST MANAGEMENTIt is clear from the findings of FRA <strong>2005</strong> that there is mixed progress towardssustainable forest management. Using the thematic elements of this managementapproach as a framework for FRA <strong>2005</strong> has helped broaden the perspective on globalforest resources. In addition to providing information on traditional variables suchforest area change and deforestation, i.e. the first thematic element of sustainable forestmanagement, FRA <strong>2005</strong> also includes detailed information on key aspects related tobiological diversity, forest health and the productive, protective and socio-economicfunctions of forests, other wooded land and trees outside forests. The result is a muchricher review of key trends in forest resources, their functions and benefits. Whilemany trends remain alarming, it is clear that there are also many positive developmentsregarding forest resources, their management and uses.When interpreting the findings from FRA <strong>2005</strong>, the scale is crucial. At the globallevel, the world’s forest resources appear to be doing fine (Chapter 8, Table 8.2): changesin most variables are relatively small and the large changes indicate more positive thannegative trends. However, this picture changes dramatically when the information isbroken down by region and subregion (Tables 8.3–8.9 in the same chapter), revealingconsiderable differences, with alarming trends in several tropical subregions. It is likelythat the variations are even greater at national and subnational scales, but it is not thepurpose of this report to draw conclusions at these levels.All regions and subregions display a mix of positive and negative trends, whichmakes it difficult to say anything definite about the level of progress towardssustainable forest management. The FRA process and this report do not venture intoweighting the studied variables, i.e. stating that one trend is more important thananother. Nor is an assessment of progress towards sustainable forest management at thecountry level included. That would be the task of further analyses, for example, as partof national forest programmes or other policy or planning processes. The report does,however, illustrate that conclusions and the focus on key developments shift accordingto the perspective, for example viewed from the size of the forest estate or from thenumber of rural poor people. This poses the question of where and how emphases offuture efforts to achieve sustainable forest management should be applied, which willhopefully stimulate a healthy debate and further analyses of the performance of theforestry sector.
150<strong>Global</strong> <strong>Forest</strong> <strong>Resources</strong> <strong>Assessment</strong> <strong>2005</strong>Alarming trendsThe global forest resources assessment process delivers observed trends of keyparameters related to forestry and the forest ecosystem. The FRA process does notinclude scenario development. By contrast, the <strong>FAO</strong>-led forestry outlook studies,the Millennium Ecosystem <strong>Assessment</strong> (MEA, <strong>2005</strong>) and the <strong>Global</strong> environmentaloutlook 3 (UNEP, 2002) are examples of processes that make good use of the knowledgegenerated by the FRA process to predict the future. Yet the FRA <strong>2005</strong> findings providea number of observations that are alarming in the light of aspirations for sustainableforest management:• Deforestation continues at an alarming rate in several regions and countries andshows no sign of slowing down at the global level.• The area of primary forest is decreasing by about 6 million hectares each year.Partly due to deforestation, partly due to selective logging and other humanactivities, which leave visible signs of human impact and thus transform the forestinto a modified natural forest in the FRA <strong>2005</strong> classification system.• In some regions, the area of forest adversely affected by forest fires, insects anddiseases is increasing.• The value of wood removals in increasing, but less than the inflation rate. Beingone of the main sources of income for the forest owner, this may have negativeimpacts on future investments in forest conservation and management.• The level of employment in forest management and conservation is decreasing insome regions and at the global level.Although not all of the above trends are universally perceived as negative (a decreasein the value of wood removals may indicate that functions other than wood productionare given priority or that production costs have decreased over time), considerableefforts will be needed to address a number of alarming trends in order to progresstowards sustainable forest management in all countries and regions. National forestprogrammes offer a potential vehicle for discussion of issues and agreement on priorityactions at the national and subnational level.Considerations for future assessmentsAs clearly illustrated in the previous chapter, the assessment of progress towardssustainable forest management depends on the context, the scale and the perspectiveapplied. This should be kept in mind in future assessments.Efforts should also be made to widely disseminate the results and make use of themin scenario development and outlook studies.SCOPE AND COVERAGE OF FRA <strong>2005</strong>The scope and coverage of global forest resources assessments have evolved overthe past half century, from a timber supply orientation through a strong focus onenvironmental issues to a broader approach in FRA 2000 (Holmgren and Persson,2002). FRA <strong>2005</strong> continued this trend by explicitly addressing six of the seven thematicelements of sustainable forest management. Using these elements as the reportingframework for FRA <strong>2005</strong> was an ambitious approach, suggested by the Kotka IVexpert consultation (Luhtala and Varjo, 2003) and subsequently endorsed by COFO(<strong>FAO</strong>, 2003a). However, three and a half years after the Kotka IV meeting, it can beconcluded that this reporting framework has been successfully implemented.A critical first step in the FRA <strong>2005</strong> process was to select and define the globalreporting variables. Following a consultative process, including a global consultationwith national correspondents to FRA in November 2003 (<strong>FAO</strong>, 2004a), 15 reportingtables with about 40 variables were defined (<strong>FAO</strong>, 2004b). The tables and variableswere generalized to facilitate reporting from all regions, which by necessity limits thedegree of detail and emphasizes the need to consult country-specific classifications
Conclusions 151and references for more detailed analyses. At the same time, the reporting tablesrepresented a broader coverage of forest resources parameters than in previous globalassessments, including forest designation, forest characteristics, quantity and value ofNWFPs, and employment in forestry.One important consideration in defining the tables was the availability of informationat the country level. For example, while more detailed information related to protectivefunctions of forest resources was desirable, it was not considered meaningful to requestinformation if very few countries could respond. On the other hand, certain parameters,including NWFP values and forest fire occurrence, were considered important enoughto include even if the response frequency were low. The tables represent a compromisebetween information availability and the objective of reporting on each of the thematicelements of sustainable forest management. Overall, the response frequency was verygood, with nine tables having information for more than 80 percent of the global forestarea, and all tables having more than 50 percent coverage (Figure 9.1).However, the conclusion regarding poor information availability for FRA 2000 isstill valid: most developing countries had difficulty reporting because their nationalmonitoring systems are not adequate – neither for international reporting nor fordomestic needs. And data quality is an issue, as illustrated in Table 2 in Annex 3, whichprovides indications of the date of data sources and the methodologies used to estimatekey parameters.To address the issue of data availability and quality, <strong>FAO</strong> has developed a programmeto support national forest assessments (<strong>FAO</strong>, <strong>2005</strong>g), and results from efforts over thelast five years are visible in a number of country reports to FRA <strong>2005</strong>. Easier accessto satellite imagery and some recent national inventories have also resulted in updatedinformation on forest area in many countries. The area-weighted average year for thelatest data on forest area is thus 2000 for FRA <strong>2005</strong>, compared with 1990 for FRA2000. Nevertheless, information gaps on most other variables remain wide in manycountries, including major forest countries.The tables containing data on ‘designation’ and ‘characteristics’ of forests containednew variables that were not previously defined in FRA. The forest designation tableFIGURE 9.1Information availability – reporting tables in relation to global forest areaExtent of forestOwnership of forest and other wooded landDesignated functions of forest and other wooded landCharacteristics of forest and other wooded landGrowing stockBiomass stockCarbon stockDisturbances affecting health and vitalityDiversity of forest tree speciesGrowing stock compositionWood removalsValue of wood removalsNWFP removalsValue of NWFP removalsEmployment in forestry0 10 20 30 40 50 60 70 80 90 100Percentage of total forest areaCountries reporting on latest reporting yearLatest reporting year not available
152<strong>Global</strong> <strong>Forest</strong> <strong>Resources</strong> <strong>Assessment</strong> <strong>2005</strong>replaced a set of variables that had been difficult to reconcile in FRA 2000, i.e. forestsin protected areas, area available for wood supply and area with a forest managementplan. The designation table addressed the thematic elements of sustainable forestmanagement more directly and did not allow overlaps among the variables included.The characteristics table introduced the concepts of ‘modified natural forest’ and ‘seminaturalforest’ to global reporting and subdivided forest plantations into two groups:protective and productive. This provided a more detailed picture of the degree to whichforests have been established or impacted by humans. In both cases, countries wereat first slightly resistant to the new concepts, as few of them possessed data directlyapplicable to this classification system, but, as the reporting process came to a close,both new tables had a response rate of above 90 percent of total forest area (Figure 9.1).Further, a wide range of findings in this report could be based on these tables, whichwould seem to justify the additions. These cases do, however, illustrate the difficultiesof introducing new concepts into global reporting.The experience of linking to related reporting processes and attempting to harmonizeoverlapping variables was generally good. However, differences in definitions continuedto be an issue and some countries communicated that reporting responsibilities inthe countries were neither clear nor synchronized, leading to confusion. It was alsoobvious that the conscious approach to harmonizing reporting might not generateimmediate relief for workloads. On the contrary, the initial effort to harmonize andstreamline international reporting may be quite labour intensive. While harmonizationof reporting is an obvious goal for all stakeholders, it seems that the investment willtake time to generate returns.As mentioned in Chapter 2, no independent remote sensing survey was carried outfor FRA <strong>2005</strong> due to lack of resources. Recalling the experience of FRA 2000, it wouldhave been beneficial to verify findings at the regional level with an independent datasource and to obtain more detailed information on the dynamics and underlying causesof changes in land use, forest cover and forest characteristics. However, the key surveyresults from FRA 2000 are still valid. Looking at the changes in forest area for Africa,one might draw the same conclusion as in FRA 2000 – that country reports probablystill overestimate forest area loss. The discrepancy is smaller, but still clearly significant(the country reports in FRA <strong>2005</strong> add up to an annual net loss of 4.4 million hectaresfor Africa in the 1990s, whereas the FRA 2000 remote sensing survey estimated lossesat 2.1 million hectares per year (with a standard error of 0.4 million hectares per year)).Poor information availability for Africa can probably explain some of the difference,but the fact remains that forest area loss based on country reporting for FRA <strong>2005</strong> isprobably overestimated for Africa for the 1990s.Considerations for future assessments• Changes to classification systems or definitions of the current reporting tablesshould not be made without very good reasons.• Efforts to streamline reporting and to establish long-term goals between reportingprocesses that aim to reduce the reporting burden on countries should besustained.• Efforts to support national forest assessments and build capacities of developingcountries to generate systematic information and knowledge to feed into policyprocesses and international reporting should be enhanced.• <strong>Resources</strong> should be sought to implement a remote sensing survey for FRA 2010to complement country reporting, along the lines tested in recent years (<strong>FAO</strong>,2003d). Such a remote sensing survey should preferably also address broader landusemonitoring aspects.
Conclusions 153FRA <strong>2005</strong> PROCESSThe active, direct involvement of countries was a defining characteristic of FRA <strong>2005</strong>.Following the recommendation of the Kotka IV expert consultation (Luhtala andVarjo, 2003), <strong>FAO</strong> invested considerable resources in establishing a network of nationalcorrespondents and organizing global and regional meetings to support the reportingprocess and build capacity. Countries readily provided the expertise and resourcesneeded to participate, and the network currently counts 172 officially nominatednational correspondents. In conclusion, while resource demanding, the network ofnational correspondents was a critical success factor for FRA <strong>2005</strong>.The decision to document the information from each country report in a workingpaper proved costly in terms of workload. While guidelines were issued in relevantlanguages, it turned out to be a daunting task: regional focal points in the FRA teamhelped national correspondents follow each step in the transformation of national datato the FRA <strong>2005</strong> reporting tables. The efforts involved considerable knowledge-sharingand capacity enhancement on all sides. The proper documentation of all backgroundmaterial, calculations and assumptions will be very valuable for the next globalassessment, and is likely to reduce the workload considerably. The turnover of staffin countries and at <strong>FAO</strong> requires that procedures are in place to secure institutionalmemory between assessments.There are many implicit linkages between the FRA process and other internationalreporting processes, for example the criteria and indicator processes, United Nationsconventions, CPF member institutions, Millennium Development Goals monitoring,the MEA and international NGOs. Some of these traditionally make good use of FRAresults as baseline information on forest resources. With the current improvementsin country participation, quality control and broadened scope, the relevance of FRAinformation is likely to increase. However, there may be information needs regardingforests that are not currently covered by FRA, but that could be included if linkageswith international processes and bodies were made more explicit.Considerations for future assessments• The network of FRA national correspondents should be sustained and effortsmade to enhance collaboration with other reporting processes at the nationallevel.• More explicit collaboration with international processes and institutions shouldbe sought in order to streamline reporting efforts. This might include more activesharing of information, joint information requests, or other forms of collaboration.In particular, the planned reporting to MCPFE, ITTO and the Convention onBiological Diversity (CBD) within the next five years may present an opportunityfor such closer collaboration in the next FRA.• Building on the experience of the high workloads involved in the development ofcountry reports, the option of online reporting/updating by countries should beexplored.• The possibility and eventual advantages of including agricultural aspects in FRA,as they relate to forests and forestry, should be considered. This might be done aspart of an independent remote sensing survey of forests and land use, or it mightbe part of regular country reporting.• It is suggested that 1990 and 2000 be kept as reference years in the next assessmentalso, in order to deepen the understanding of key forestry trends.CONCLUDING REMARKSFRA <strong>2005</strong> is the most comprehensive assessment to date, in terms of both the contentand the number of contributors. It tells us that forests cover 30 percent of the land areaof planet Earth. They range from boreal and temperate forests to arid woodlands and
154<strong>Global</strong> <strong>Forest</strong> <strong>Resources</strong> <strong>Assessment</strong> <strong>2005</strong>tropical moist forests. And from undisturbed primary forests to forests managed andused for a variety of purposes.FRA <strong>2005</strong> also tells us that deforestation continues at an alarmingly high rate, butthat the net loss of forest area is slowing down thanks to forest planting, landscaperestoration and natural expansion of forests on abandoned land.<strong>Forest</strong>s are increasingly being conserved and managed for multiple uses andvalues, and play a crucial role in climate change mitigation and in the conservationof biodiversity and of soil and water resources. If managed sustainably, forests alsocontribute significantly to local and national economies and to the well-being ofcurrent and future generations.By providing new information on forest area change – one of the 48 indicators ofthe Millennium Development Goals – FRA <strong>2005</strong> allows us to gauge the importantrole of the world’s forest resources in meeting the targets set for reducing poverty andensuring a sustainable global environment.By also providing data on carbon, biological diversity, forest contributions tonational economies and many more variables, this comprehensive assessment aimsto support decision-making for policies and programmes in forestry and sustainabledevelopment at all levels.NEXT STEPSAn in-depth evaluation of FRA <strong>2005</strong> will be carried out in early 2006. Readers areencouraged to contribute to this exercise. <strong>FAO</strong> will continue to work actively withcountries to identify and address information gaps to continuously improve knowledgeof forests and forestry. Joint planning for the next global assessment (FRA 2010) willbegin in 2006, and an expert consultation (Kotka V) is planned for June 2006 to provideinputs to this next assessment.
155BibliographyAizpuru, M., Achard, F. & Blasco, F. 2000. <strong>Global</strong> assessment of cover change of themangrove forests using satellite imagery at medium to high resolution. EEC researchproject no. 15017-1999-05. Ispra, Italy, Joint Research Centre.Bruijnzeel, L.A. & Hamilton, L.S. 2000. Decision time for cloud forests. IHP HumidTropics Programme Series No. 13. Paris, UNESCO.CBD. 2002. Review of the status and trends of, and major threats to, the forest biologicaldiversity, p. 154. In Report of the ad hoc technical expert group on forest biologicaldiversity. CBD Technical Series No. 7. Convention on Biological Diversity (also availableat www.biodiv.org/doc/publications/cbd-ts-07.pdf/).CIA. <strong>2005</strong>. The world factbook. Washington, DC, Central Intelligence Agency (alsoavailable at www.cia.gov/cia/publications/factbook).Chape, S., Blyth, S., Fish, L., Fox, P. & Spalding, M., eds. 2003. 2003 United Nations listof protected areas. Gland, Switzerland, and Cambridge, UK, IUCN; & Cambridge, UK,WCMC.Clough, B.F. 1993. The economic and environmental values of mangrove forests and theirpresent state of conservation in the South-East Asia/Pacific Region. Mangrove EcosystemsTechnical Reports. Vol. 3. ITTO/ISME/JIAM Project PD71/89. Rev. 1(F). Okinawa,Japan, International Society for Mangrove Ecosystems (ISME).Davidenko, E.P. & Eritsov, A. 2003. The fire season 2002 in Russia. Report of the Aerial<strong>Forest</strong> Fire Service, Avialesookhrana. International <strong>Forest</strong> Fire News, 28: 15–17.Diop, E.S. 1993. Conservation and sustainable utilization of mangrove forests in LatinAmerica and Africa Regions. Part II. Africa. Mangrove Ecosystems Technical Reports.Vol. 3. ITTO/ISME Project PD114/90. Okinawa, Japan, ISME.Dudley, N. & Solton, S. 2003. Biological diversity, tree species composition and environmentalprotection in regional FRA-2000. Geneva Timber and <strong>Forest</strong> Discussion Paper No. 33(ECE/TIM/DP/33). Geneva, United Nations Economic Commission for Europe(UNECE) & <strong>FAO</strong>.ECOSOC. 2003. Progress in implementation: forest health and productivity. Report of theSecretary-General. E/CN.18/2003/5, 13 March 2003. Item 3(a)(ii) of the provisionalagenda: implementation of the proposals for action of the Intergovernmental Panelon <strong>Forest</strong>s/Intergovernmental Forum on <strong>Forest</strong>s and the plan of action of the UnitedNations Forum on <strong>Forest</strong>s. Prepared for Third Session of the United Nations Forum on<strong>Forest</strong>s, Geneva, 26 May – 6 June 2003. United Nations Economic and Social Council(ECOSOC).<strong>FAO</strong>. 1948. <strong>Forest</strong> resources of the world. Unasylva, 2 (4). Washington, DC.<strong>FAO</strong>. 1951. Report of the sixth session of the Conference of <strong>FAO</strong>. Rome.<strong>FAO</strong>. 1960. World forest inventory 1958. Rome.<strong>FAO</strong>. 1966. World forest inventory 1963. Rome.<strong>FAO</strong>. 1976a. Appraisal of forest resources of the Latin American Region. Presented at the12th session of the Latin American <strong>Forest</strong>ry Commission, Havana, Cuba, February1976. FO:LACF/76.<strong>FAO</strong>. 1976b. <strong>Forest</strong> resources in the European Region. Rome.<strong>FAO</strong>. 1976c. <strong>Forest</strong> resources in the Asia and Far East Region. Rome.<strong>FAO</strong>. 1981a. <strong>Forest</strong> resources of tropical Asia. Rome.<strong>FAO</strong>. 1981b. Los recursos forestales de la America tropical. Rome.<strong>FAO</strong>. 1981c. <strong>Forest</strong> resources of tropical Africa. Rome.<strong>FAO</strong>. 1982. Tropical forest resources, by J.P. Lanly. <strong>FAO</strong> <strong>Forest</strong>ry Paper No. 30. Rome.
156<strong>Global</strong> <strong>Forest</strong> <strong>Resources</strong> <strong>Assessment</strong> <strong>2005</strong><strong>FAO</strong>. 1988. Interim report on the state of forest resources in the developing countries. Rome.<strong>FAO</strong>. 1989. Plant genetic resources: their conservation in situ for human use. Prepared incollaboration with the United Nations Educational, Scientific and Cultural Organization(UNESCO), UNEP and IUCN. Rome.<strong>FAO</strong>. 1993. <strong>Forest</strong> resources assessment 1990. Rome.<strong>FAO</strong>. 1995. <strong>Forest</strong> resources assessment 1990 – global synthesis. <strong>FAO</strong> <strong>Forest</strong>ry Paper No. 124.Rome.<strong>FAO</strong>. 1995–<strong>2005</strong>. International standards for phytosanitary measures. ISPM Nos. 1–24. Rome,Secretariat of the International Plant Protection Convention (also available at www.ippc.int/id/13399?language=en).<strong>FAO</strong>. 1997a. Estimating biomass and biomass change of tropical forests: a primer, by SandraBrown. <strong>FAO</strong> <strong>Forest</strong>ry Paper No. 134. Rome.<strong>FAO</strong>. 1997b. State of the World’s <strong>Forest</strong>s 1997. Rome.<strong>FAO</strong>. 1999a. The <strong>FAO</strong> strategic plan for forestry. Rome (also available at www.fao.org/forestry).<strong>FAO</strong>. 1999b. 1997 – International Plant Protection Convention (new revised text). Rome,Secretariat of the International Plant Protection Convention (also available at www.ippc.int/id/37959?language=en).<strong>FAO</strong>. 2000. Basic texts of the Food and Agriculture Organization of the United Nations, Vols. Iand II – 2000 edition. Rome. (also available at www.fao.org/documents/docrep/003/x8700e/x8700e00.htm.<strong>FAO</strong>. 2001a. Criteria and indicators for sustainable forest management: a compendium. FroylanCastaneda, Christel Palmberg-Lerche and Petteri Vuorinen, eds. <strong>Forest</strong> Management WorkingPaper 5, <strong>Forest</strong> <strong>Resources</strong> Development Service, <strong>Forest</strong> <strong>Resources</strong> Division. Rome.<strong>FAO</strong>. 2001b. <strong>Global</strong> forest resources assessment 2000 – main report. <strong>FAO</strong> <strong>Forest</strong>ry Paper No. 140.Rome (also available at www.fao.org/forestry/site/7949/en).<strong>FAO</strong>. 2002a. Final report – Kotka IV expert consultation on <strong>Global</strong> <strong>Forest</strong> <strong>Resources</strong> <strong>Assessment</strong>s– Linking National and International Efforts. Rome (also available at www.fao.org/forestry/site/4180/en).<strong>FAO</strong>. 2002b. International standards for phytosanitary measures: guidelines for regulatingwood packaging material in international trade. ISPM No. 15 (available at www.ippc.int/id/16259?language=en).<strong>FAO</strong>. 2002c. <strong>Forest</strong> assessment and monitoring. Unasylva 210 (also available at www.fao.org/documents/docrep/005/y4001e/y4001e00.htm).<strong>FAO</strong>. 2003a. Report of the Sixteenth Session of the Committee on <strong>Forest</strong>ry, Rome, Italy,10–14 March 2003. COFO-2003/REP. Rome (also available at www.fao.org/DOCREP/MEETING/007/Y9203e/Y9203e00.htm).<strong>FAO</strong>. 2003b. <strong>FAO</strong> Yearbook of <strong>Forest</strong> Products. Rome.<strong>FAO</strong>. 2003c. <strong>Global</strong> forest resources assessment update <strong>2005</strong> – FRA <strong>2005</strong> – pilot study for countryreporting: India. <strong>Forest</strong> <strong>Resources</strong> <strong>Assessment</strong> Working Paper 78. Rome.<strong>FAO</strong>. 2003d. Information framework for global monitoring of forests, land use and theenvironment. Informal meeting, 22–23 January 2003. <strong>FAO</strong> <strong>Forest</strong> <strong>Resources</strong> <strong>Assessment</strong>Working Paper 65. Rome.<strong>FAO</strong>. 2004a. Proc. Training of National Correspondents on Assessing and Monitoring of <strong>Forest</strong>Land Use and Changes, 17–21 November 2003, Rome. <strong>FAO</strong> <strong>Forest</strong> <strong>Resources</strong> <strong>Assessment</strong>Working Paper 80. Rome.<strong>FAO</strong>. 2004b. <strong>Global</strong> forest resources assessment <strong>2005</strong> – specification of national reporting tablesfor FRA <strong>2005</strong>. <strong>FAO</strong> <strong>Forest</strong> <strong>Resources</strong> <strong>Assessment</strong> Working Paper 81. Rome.<strong>FAO</strong>. 2004c. <strong>Global</strong> forest resources assessment <strong>2005</strong> – guidelines for country reporting toFRA <strong>2005</strong>. <strong>FAO</strong> <strong>Forest</strong> <strong>Resources</strong> <strong>Assessment</strong> Working Paper 82. Rome.<strong>FAO</strong>. 2004d. <strong>Global</strong> forest resources assessment <strong>2005</strong> – terms and definitions. <strong>FAO</strong> <strong>Forest</strong><strong>Resources</strong> <strong>Assessment</strong> Working Paper 83. Rome.<strong>FAO</strong>. <strong>2005</strong>a. <strong>FAO</strong>STAT. Rome (available at faostat.fao.org/faostat).
Bibliography 157<strong>FAO</strong>. <strong>2005</strong>b. Documents for reporting to FRA <strong>2005</strong>. Rome (available at www.fao.org/forestry/site/32180/en).<strong>FAO</strong>. <strong>2005</strong>c. <strong>Global</strong> forest resources assessment <strong>2005</strong> – other areas. Country Report 230.Rome.<strong>FAO</strong>. <strong>2005</strong>d. What is sustainable forest management? Rome (available at www.fao.org/forestry/site/24447/en).<strong>FAO</strong>. <strong>2005</strong>e. State of the World’s <strong>Forest</strong>s <strong>2005</strong>. Rome (also available at www.fao.org/documents/docrep/007/y5574e/y5574e00.htm).<strong>FAO</strong>. <strong>2005</strong>f. <strong>Forest</strong>s and floods: drowning in fiction or thriving on facts? RAP Publication<strong>2005</strong>/03. Bangkok, <strong>FAO</strong> Regional Office for Asia and the Pacific.<strong>FAO</strong>. <strong>2005</strong>g. Support to national forest assessments. <strong>FAO</strong> <strong>Forest</strong>ry Department website(available at www.fao.org/forestry/site/24673/en).<strong>FAO</strong>. 2006a. FRA 2000 and FRA <strong>2005</strong>: comparing estimates of forest area and forest areachange. <strong>Forest</strong> <strong>Resources</strong> <strong>Assessment</strong> Working Paper 102. Rome. In press.<strong>FAO</strong>. 2006b. Documentation of calculations to determine progress towards sustainableforest management in the FRA <strong>2005</strong> main report. <strong>Forest</strong> Resource <strong>Assessment</strong> WorkingPaper 104. Rome. In press.<strong>FAO</strong> & UNEP. 1981a. Proyecto de Evaluación de los Recursos <strong>Forest</strong>ales Tropicales: losrecursos forestales de la America tropical. Rome, <strong>FAO</strong>, UNEP.<strong>FAO</strong> & UNEP. 1981b. Tropical <strong>Forest</strong> <strong>Resources</strong> <strong>Assessment</strong> Project: forest resources oftropical Africa. Part II. Country briefs. Rome.<strong>FAO</strong> & UNEP. 1981c. Tropical <strong>Forest</strong> <strong>Resources</strong> <strong>Assessment</strong> Project: forest resources oftropical Asia. Rome.Fisher, P. & Spalding, M.D. 1993. Protected areas with mangrove habitat. Cambridge, UK,World Conservation Centre. (draft)Ghassemi, F., Jakeman, A. & Nix, H. 1995. Salinization of land and water resources. Sydney,University of New South Wales Press; and Wallingford, UK, CAB International.GBA-2000 (<strong>Global</strong> Burnt Area 2000 Project). 2000. <strong>Global</strong> Burnt Area 2000 Project.Ispra, Italy, <strong>Global</strong> Vegetation Monitoring Unit (GVMU), Joint Research Centre (JRC)(www.grid.unep.ch/activities/earlywarning/preview/ims/).Groombridge, B. 1992. <strong>Global</strong> biodiversity: status of the earth’s living resources. WCMC/The National History Museum/IUCN/UNEP/WWF/WRI. London, Chapman & Hall.Hamilton, L.S. & King, P.N. 1983. Tropical forested watersheds: hydrologic and soilsresponse to major uses or conversions. Boulder, Colorado, Westview Press.Hamilton, L.S. & Pearce, A.J. 1991. Biophysical aspects in watershed management, pp. 33–52.In K.W. Easter, J.A. Dixon & M.M. Hufschmidt, eds. Watershed resources management:studies from Asia and the Pacific. Singapore, Institute of Southeast Asian Studies.Hewlett, J.D. 1982. <strong>Forest</strong>s and floods in the light of recent investigation, pp. 543–560.In Proc. Canadian Hydrological Symposium, June 14–15, Fredericton, N.B. NationalResearch Council, Ottawa.Hocking, D. 2003. More on forest health. New Zealand Tree Grower: August.Holmgren, P. & Persson, R. 2002. Evolution and prospects of global forest assessments.Unasylva 210: 3–9 (also available at www.fao.org/documents/docrep/005/y4001e/y4001e00.htm).IPCC. 2000. Land use, land-use change and forestry. Special report, Cambridge University.Geneva, Intergovernmental Panel on Climate Change (IPCC).IPCC. 2003. Good practice guidance for land use, land-use change and forestry. Kanagawa,Japan, Institute for <strong>Global</strong> Environmental Strategies.IUCN. 1994. Guidelines for protected area management categories. Gland, Switzerland,Commission on National Parks and Protected Areas (CNPPA), World Conservation Union(IUCN); and Cambridge, UK, UNEP World Conservation Monitoring Centre (WCMC).IUCN. 2000. IUCN 2000 red list of threatened species. Gland, Switzerland (also availableat www.redlist.org/).
158<strong>Global</strong> <strong>Forest</strong> <strong>Resources</strong> <strong>Assessment</strong> <strong>2005</strong>IUCN. 2004. IUCN 2004 red list of threatened species. Gland, Switzerland (also availableat www.redlist.org/).Kudoh, J. <strong>2005</strong>. Report of the View of Northeast Asia <strong>Forest</strong> Fire from Cosmos InternationalSymposium, Center for Northeast Asian Studies (CNEAS), Tohoku University, Sendai,Miyagi, Japan, 17–18 January <strong>2005</strong>.Lacerda, L.D. 1993. Conservation and sustainable utilization of mangrove forests inLatin America and Africa Regions. Vol. 2, Part I. Latin America. Mangrove EcosystemsTechnical Reports. ITTO/ISME Project PD114/90 (F). Okinawa, Japan, ISME.Landell-Mills, N. & Porras, I.T. 2002. Silver bullet or fool’s gold?: a global review of marketsfor forest environmental services and their impact on the poor. London, InternationalInstitute for Environment and Development.Lanly, J.P. 1983. <strong>Assessment</strong> of forest resources of the tropics. Commonwealth <strong>Forest</strong>ryReview, 44(6): 287–318.Lanly, J.P. 1988. An interim report on the state of the forest resources in the developingcountries. FO:Misc/88/7. Rome, <strong>FAO</strong>.Lebedys, A. 2004. Trends and current status of the contribution of the forestry sector tonational economies. <strong>Forest</strong> Finance Working Paper FSFM/ACC/07. Rome, <strong>FAO</strong>.Leslie, A. <strong>2005</strong>. What will we want from the forests? ITTO Tropical <strong>Forest</strong> Update 15(1): 14–16.Luhtala, A. & Varjo, J., eds. 2003. Proc. <strong>FAO</strong> expert consultation on <strong>Global</strong> <strong>Forest</strong><strong>Resources</strong> <strong>Assessment</strong> 2002, Kotka, Finland, 1–5 July 2002. Research Paper 889. Helsinki,Finnish <strong>Forest</strong> Research Institute.Mayaux, P., Holmgren, P., Achard, F., Hugh, E., Stibig, H-J. & Branthomme, A. <strong>2005</strong>.Tropical forest cover change in the 1990s and options for future monitoring, pp. 373-384.Royal Society, Philosophical Transactions: Biological Sciences, 360(1454).MEA (Millennium Ecosystem <strong>Assessment</strong>). <strong>2005</strong>. Ecosystems and human well-being: synthesis.Washington, DC, Island Press (also available at www.millenniumassessment.org).Murphy, S.T. 1996. Status and impact of invasive conifer aphid pests in Africa. In Proc.IUFRO Symposium on Impact of Diseases and Insect Pests in Tropical <strong>Forest</strong>s. Vienna,International Union of <strong>Forest</strong> Research Organizations.O’Loughlin, C.L. 1974. The effect of timber removal on the stability of forest soils.Hydrology 13: 121–134.Persson, R. 1974. World forest resources – review of the world’s forest resources in the early1970s. Department of <strong>Forest</strong> Survey, Reports and Dissertations No. 17. Stockholm,Royal College of <strong>Forest</strong>ry.Persson, R. 1975. <strong>Forest</strong> resources of Africa – an approach to international forest resourceappraisals. Part I. Country appraisals. Department of <strong>Forest</strong> Survey, Reports andDissertations No. 18. Stockholm, Royal College of <strong>Forest</strong>ry.Persson, R. 1977. <strong>Forest</strong> resources of Africa – an approach to international forest resourceappraisals. Part II. Regional analyses. Department of <strong>Forest</strong> Survey, Reports andDissertations No. 22. Stockholm, Royal College of <strong>Forest</strong>ry.Saenger, P., Hegerl, E.J. & Davie, J.D.S. 1983. <strong>Global</strong> status of mangrove ecosystems.Commission on Ecology Papers No. 3. Gland, Switzerland, IUCN.Scherr, S.J., White. A. & Kaimowitz, D. 2003. A new agenda for forest conservation andpoverty reduction: making markets work for low-income producers. Washington, DC,<strong>Forest</strong> Trends & Center for International <strong>Forest</strong>ry Research (CIFOR).Sommer, A. 1976. Attempt at an assessment of the world’s tropical moist forests. Unasylva,112–113: 5–27.Space, J. 1997. Strategic plan, <strong>Global</strong> forest resources assessment 2000. Rome, <strong>FAO</strong>.(unpublished)Spalding, M.D., Blasco, F. & Field, C.D., eds. 1997. World mangrove atlas. Okinawa,Japan, ISME.The Nature Conservancy. 2004. Fire, ecosystems & people: a preliminary assessment of fireas a global conservation issue. Tallahassee, FL (available at http://nature.org/initiatives/
Bibliography 159fire/files/fire_report_version1.pdf).UNECE. <strong>2005</strong>. European forest sector outlook study 1960-2000-2020 – main report.Geneva Timber and <strong>Forest</strong> Study Paper No. ECE/TIM/SP/20. Geneva, United NationsEconomic Commission for Europe (also available at www.unece.org/trade/timber/docs/sp/sp-20.pdf).UNECE & <strong>FAO</strong>. 1985. <strong>Forest</strong> resources of the ECE region (Europe, the USSR, NorthAmerica). Geneva, UNECE.UNECE & <strong>FAO</strong>. 2000. <strong>Forest</strong> resources of Europe, CIS, North America, Australia, Japanand New Zealand. Geneva Timber and <strong>Forest</strong> Study Paper No. 17 (ECE/TIM/SP/17).New York and Geneva, UNECE.UNECE & <strong>FAO</strong>. 2001. <strong>Forest</strong> fire statistics 1998–2000. Timber Bulletin, LIV (2001). ECE/TIM/BULL/54/4. Rome, <strong>FAO</strong>.UNECE, <strong>FAO</strong>, International Labour Organization (ILO) & <strong>Global</strong> Fire MonitoringCenter (GFMC). 2000. Baltic Exercise for Fire Information and <strong>Resources</strong> Exchange– BALTEX FIRE 2000, 5–9 June 2000, Kuopio, Finland. Conference report. Helsinki.UNEP (United Nations Environment Programme). 2002. <strong>Global</strong> environment outlook3: past, present and future perspectives. London & Sterling, VA, Earthscan PublicationsLtd (also available at www.unep.org/geo).United Nations. <strong>2005</strong>a. Millennium development goal indicators database. A-RES-55-2.New York, United Nations Statistics Division (available at http://millenniumindicators.un.org/).United Nations. <strong>2005</strong>b. United Nations Statistics Office list of countries and areas. NewYork (available at http://unstats.un.org/unsd/methods/m49/m49alpha.htm).United Nations. <strong>2005</strong>c. UN commodity trade statistics database (UN Comtrade). NewYork (available at http://unstats.un.org/unsd/comtrade/).Vergara, N.T. & Briones, N.D., eds. 1987. Agroforestry in the humid tropics: its protectiveand ameliorating role to enhance productivity and sustainability. Honolulu, East-WestCenter.Wharton, C.H., Odum, H.T., Ewel, K., Duever, M., Lugo, A., Boyt, R., Bartholemew, J.,De Bellevue, E., Brown, S., Brown, M. & Duever, L. 1976. <strong>Forest</strong>ed wetlands of Florida:their management and use. Gainesville, FL, Center for Wetlands.White, P.S. & Pickett, S.T.A. 1985. The ecology of natural disturbance and patch dynamics.Orlando, FL, Academic Press.Wiersum, K.F. 1984. Surface erosion under various tropical agroforestry systems. InC. O’Loughlin & A. Pearce, eds. Effects of forest land use on erosion and slope stability,pp. 231–239. Honolulu, Environment and Policy Institute (EAPI), East-West Center.Wilent, S. <strong>2005</strong>. Mountain pine beetles threaten Canadian, US forests. Society of American<strong>Forest</strong>ers. The <strong>Forest</strong>ry Source, 10(5).World Bank. <strong>2005</strong>. World development indicators <strong>2005</strong>. Washington, DC (also available athttp://publications.worldbank.org/WDI).WWF & IUCN. 1998. Protected areas for the new millennium: the implications of IUCN’sprotected area categories for forest conservation. Discussion paper. Gland, Switzerland,World Wide Fund for Nature (WWF) & IUCN.
160<strong>Global</strong> <strong>Forest</strong> <strong>Resources</strong> <strong>Assessment</strong> <strong>2005</strong>
161Annex 1ContributorsFRA ADVISORY GROUPR. Keenan (Australia); E. Rametsteiner (Austria); C. Bahamondez (Chile); T. Kajarlainen(Finland); J.K. Rawat (India); H. Santoso (Indonesia); R. Michalak (Poland); S. Gueye (Senegal);T. Thuresson (Sweden); A. Newton (UK); P. Drichi (Uganda); R. Ridder (USA); B. Smith (USA);G. Vildanova (Uzbekistan); M. Lobovikov (INBAR); S. Johnson (ITTO); A. Karotkov (UNECE);J. Zhang (UNEP)NATIONAL CORRESPONDENTS/LOCAL CONTACTSAfghanistanG. Haideri, G.N. NaseriAlbaniaAlgeriaAmerican SamoaAngolaAntigua and BarbudaArgentinaArmeniaAustraliaAustriaAzerbaijan, Republic ofBahamasBahrainBangladeshBarbadosBelarusBelgiumBelizeBeninBermudaBhutanS. Karadumi, I. Ajidini, K. Dano, S. Dule, B. Hate, G. Hoxhaj, E. Islamii,G. Kacori, V. MineA. Ghazi, M. MezaliJ. DonneganN. RodriguesE. WilliamsC. Montenegro, S. Brandán, M. Burghi, S. Chiavasa, L. Corinaldesi,N. Esper, I. Gasparri, M. Larrieu, L. La Rosa, E. Manghi, J. Menendez,D. PinascoA. Ghulidjanyan, M. MatevosyanA. Gerrand, J. Devonshire, G. Dunn, M. Gavran, M. Parsons, M. WoodJ. Hangler, R. BüchsenmeisterA. OrujovC. RussellI.M.A. RazaqA. Quazi Liaquat, Y. Ali, S.M. Kamruzzaman, M.A. Latif, I. Mazharul,R. Siddique, D. SukumarB. ClarkeV.L. Krasovski, M.V. KuzmenkovC. Laurent, C. De Schepper, H. Lecomte, D. Perrin, S. Vanwijnsberge,M. WaterinckxO. Salas, E. Cherrington, E. Green, T. SantosP. GbetohoS. Gillam, J. FurbertD.B. Dhital, professional staff and divisional forest officers of <strong>Forest</strong><strong>Resources</strong> Development Division, <strong>Forest</strong>ry Development CorporationLimited
162<strong>Global</strong> <strong>Forest</strong> <strong>Resources</strong> <strong>Assessment</strong> <strong>2005</strong>BoliviaBosnia and HerzegovinaBotswanaBrazilBritish Indian OceanTerritoryBrunei DarussalamBulgariaBurkina FasoBurundiCambodiaCameroonCanadaCape VerdeCayman IslandsCentral African RepublicChadChannel IslandsChileChinaColombiaComoresCongoCook IslandsCosta RicaF. Pizarro Romero, O. Camacho, R. Guzmán GutiérrezD. Blagojevic, Z. MaunagaM. Sekgopo, T. SantosT. Rezende de Azevedo, S. Ahrens, J. de Arimatéa Silva, C. BacelarSantos, V. Castro Souza, J. Freitas Veloso, G. Gomide, N. Higuchi,Y.M. Malheiros de Oliveira, F. Pareyn, G.S.C. Pinho, C. RobertoSanquetta, A. Valéria Rezende, J.E. Rocha Collares, I. Sorensini, S. CarlosSaabS. Gillam, C. SheppardM.H.J. Yussof, forest officers and <strong>Forest</strong>ry Department, Fire BrigadeDepartment, Land Department, Survey Department, local contractorsI. Angelov, A. Bobeva, I.V. Ivanov, N. Yonov, L. ZhelevS. CoulibalyA. BararwandikaT. Sokhom, P. Sam, O. SiphanJ. BalomogB. Haddon, M. Gillis, R. Jacques, K. PowerA. Mendes, E. Barbosa Simões, G.C.C. SilvaS. Gillam, M. CottamL. Dimanche, A. Medi, A. ZangaB. Djekourbian, D. AlariS. Gillam, L. Magris, A. McCutcheonM.V. Oyarzún Acosta, C. Bahamondez, F. Bascuñán, L. Martínez, F. Olave,S. del Pozo, J.C. Rodríguez Acuña, V. SandovalS. Chunyu, X. Chaozong, H. Guosheng, X. Jun, F. Li, Z. Min, L. Ying,Z. Xiaoquan, C. Xinyun, C. XuefengG. Arango Fernández, C.E. Barbosa Castillo, M.C. Cardona Ruiz,L.P. Corredor, S.P. Cruz Arguello, Y. González Hernández, J.E. Henao,M.H. Hoyos, L.S. Pulido Pérez, M.L. Rodríguez Montenegro, J.A. RuizHernández, Ministerio de Ambiente, Vivienda y Desarrollo Territorial,Ministerio de Agricultura y Desarrollo Rural, Fondo para el Financiamientodel Sector Agropecuario, Ministerio del Interior, Fedemaderas, AsociaciónNacional de Industriales, Departamento Administrativo Nacional deEstadísticas, Proyecto Reservas <strong>Forest</strong>alesA. IssoufG. Claver Boundzanga, J-C. Banzouzi, B. Bezou, P. Bonazebi, M. Ibara,A. Kabi, J.B. Kikota, J. Kimbembe, G. Lembe, A. Loukoundo,J. Moumbouilou, B. Mpati, I. Nganga, P. Ngouala, G. Nkéoua, D. Nsosso,J. SambaN. TokariL. Noches González, C.A. Calvo Sanabria, G. Canet Brenes, Z. TrejosEsquivel, S. Lobo Valverde
Annex 1: Contributors 163Côte d’IvoireCroatiaCubaCyprusCzech RepublicDemocratic People’sRepublic of KoreaDemocratic Republic ofthe CongoDenmarkDjiboutiDominicaDominican RepublicEcuadorEgyptEl SalvadorEstoniaEthiopiaFaroe IslandsFalkland IslandsFijiFinlandFranceFrench GuyanaFrench PolynesiaGambiaGeorgiaGermanyGhanaK.K. N’Guettia VenanceR. Ojurovicć, S. Gospočić, V. Grgasović, J. Gračan, P. Jurjević, T. Rožman,Ž. Štahan, I. TikvićI.C. Diago Urfé, A. Alvarez Brito, C.A. Diaz Maza, J.Ma. GareaAlonso, C. Hernández del Vallín, J.A. Herrero Echevarría, E. LinaresLanda, A. Mercadet Portillo, C.A. Moreno Beltrán, L. Palenzuela Díaz,J. Puerto García, A. Sáez Martínez, S. Sánchez Fajardo, A.I. ZuluetaAcostaC. Alexandrou, A. Andreou, A. Horattas, L. Loizou, A. Sarris, T. TsintidesV. Henzlik, J. Dobias, V. StranskyK. Sung-Ho, R.S. CholG. Zasy Ngisako, A. Kondjo Shoko, S. Malele Mbala, C. MusampaKamunganduV.K. Johannsen, B.B. Jørgensen, E.D. Kjær, P.H. Larsen, J.P. Skovsgaard,L. VesterdalM.M. MohamedE. Hypolite, C. Bellot, A. Gallion, A. JamesH.M. Abreu, A. Hernández BatistaM. Trelles Jiménez, J. Aguiar, R. Alulima, R. Cruz, C. Enríquez Castro,J. Hidalgo, W. Palacios, R. Sánchez, H. ThielM.A. Mustafa, E.S. Ali Khalifa, M.A. El-Satar, M.M. Megahed,H.S. Rashed, A. Said ZakiR.A. Herrera Guzmán, L.A. Gómez Vaquerano, J.A. OlanoM. Valgepea, V. Adermann, E. Asi, K. Karoles, L. Maamets, H. Ounap,E. PärtL. Berhanu, M. Bekele, Z. Fanta, T. Mammo, S.G. Meskel, S. Nune, K. Segu,M. Tadesse, G. Tilahun, A. WorkuV.K. Johannsen, T. Leivsson, J. ViđS. Gillam, H. HallS. Lagataki, N. Vakacegu, J. WakoloE. Tomppo, A. Ihalainen, M. Katila, H. MäkeläC. Vidal, A. Colin, N. HamzaJ. Demenois, O. BrunauxK. Rengulbai, M. TaereaL. BojangP. Torchinava, N. Burduli, State Department of Statistics, Ministry ofFinance, Institute of Mountain <strong>Forest</strong>ryF. Schmitz, M. Brück, J. Dengg, E. Engert, W. Kloos, M. Köhler, N. Riehl,S. von Scheliha, M. Schwörer, D. Steinhauser, S. Strich, B. WinklerK. Affum Baffoe, F. Amponsah-Doku
164<strong>Global</strong> <strong>Forest</strong> <strong>Resources</strong> <strong>Assessment</strong> <strong>2005</strong>GibraltarGreeceGreenlandGrenadaGuadeloupeGuamGuatemalaGuineaGuinea-BissauGuyanaHaïtiHondurasHungaryIcelandIndiaIndonesiaIran, Islamic Republic ofIraqIrelandIsle of ManIsraelItalyJamaicaJapanJordanKazakhstanKenyaKyrgyzstanLao People’s DemocraticRepublicLatviaLebanonS. Gillam, M. FennerI. NikolauV.K. Johannsen, K. Høegh, A. Jakobsen, F. RuneA. Joseph, A. ThomasN. Debroize, C. TambyJ. Donnegan, D. LimtiacoL.E. Barrera Garavito, C. Ramírez, R. RodasD. DiawaraK. Diombera, C. Correia, A.S. Da Silva, J.A. Pereira, D.S. EmbaloJ. Singh, S. Mahadeo, A. MohaseL-J. BonifaceO. Peralta, H. Hernández, R. Nelson Lezama, A. ZúnigaP. Csóka, C. MózesA. Snorrason, Th. Eysteinsson, E. Gunnarsson, B. KjartanssonS.S.K. Ramalinge Gowda, S. Dasgupta, A. SaxenaL. Kumarwardhani, K. Budi Prihatno, I. Exploitasia, H. Indradudy,Losuh, A. Mulyono, M. Pabemba, I. Poespita, T. Saputro, Y. SeptianiS. Shariatnegad, G.A. Abdinejad, A. Farzaneh, F. Hatami, M. Jafari,K. Kabiri, M.H. Moshtagh Kahnamouie, H. Poorzaki, K. Pourmoghadam,M. Seifollahian, S. Shafiee FarS.S. Al-Kawaz, J.M. Jafar, S.H. NemaP. Cafferkey, K. Coggins, J. Costello, J. Fennessy, D. Furlong, G. Gallagher,E. Hendrick, J. Martin, G. Murphy, J. O’Carroll, C. O’Donovan,A. O’Sullivan, J. O’Sullivan, P. PurserS. Gillam, P. WilliamsonI. Tauber, G. SchillerA. Mariano, L. MarlettaO. Evelyn, U. Edwards, M. Headley, A. MorganY. Imaizumi, H. OkaM.A. Ali Al Daqish, M. NsourK. Meirembekov, E. Kelemseit, K.Z. UstemirovN.J. Kathendu, K.C. David, K. WamichweA. BurhanovT. LeuangkhammaN. Struve, experts from Ministry of Agriculture and State <strong>Forest</strong>ServiceF. Asmar, M. Bassil, I. El-Hawi, F. El-Husseini, G. Kassar, A. Kozah,Z. Tamim
Annex 1: Contributors 165LesothoLiberiaLibyan Arab JamahiriyaLithuaniaLuxembourgMadagascarMalawiMalaysiaMaldivesMaliMarshall IslandsMauritaniaMauritiusMexicoMicronesia, FederatedStates ofMoldovaMonacoMongoliaMontserratMoroccoMozambiqueMyanmarNamibiaNepalNetherlandsNew CaledoniaNew ZealandS.P. Moshoeshoe, E.S. SekaleliT.R. Quioh, D.E. WilsonO.M. Shawesh, A.T. Al Hassoumi, S. Saleh IbrahimA. Kuliešis, A. Butkus, R. Deltuvas, D. Dudutis, V. Karasauskis,V. Kraujalis, J. Mazeika, S. Mozgeris, R. Ozolincius, J. Saladis, V. Vaiciunas,D. Vižlenskas, P. ZolubasM. Wagner, J. Rondeux, F. WolterF. Andriantsilavo, I. Andriamarozaka, J. Andrianiaina, C. Camara,R. Harison, Y.M. Nomenaharitiana Rabenitany, J-P. Paddack,A. Rabary, C.S. Rabotoarison, M. Radiharisoa, L. Rajaonarivelo,J-R. Rakotoarijaona, G. Rakotonarivo, V. Rakotondrabenja, J-P. Ralaivao,V. Randriamampianina, P. Rarivomanana, E. Ratsimandison,H. Razakamanarivo, F.M. RejoS. KainjaT.S. Kiam, Y.Y. Hwai, P. Manggil, R. bin SulaimanH. RasheedM. Barry, M. CoulibalyJ. Donnegan, F.H. MullerM. Ould HamzaS.A. Paupiah, S. Appiah, R. Basenoo, K. Beegun, P. Bhujohory, N. Nawjee,D. Rama, S. RojeeA. Sandoval Uribe, E. Díaz Ponce Dávalos, A. Victoria Hernández,R. Orozco Gálvez, G. López-Forment, R. Palafox Rivas, A. RodríguezAguilar, F. Takaki TakakiJ. Donnegan, I. LebehnP. StratulatC. CrovettoN-Y. Oyudar, J. TserendavvaC. Gerald, G.A. GrayA. ZakiM.R. Cruz, C. Banze, C. Cuambe, J. Macuácua, A. Marzoli, P. Mugas,A. Muhate, I. NorjamäkiS. Lwin, M.W. Aung Kyi, S.W. Hlaing, T. Htun, K. Maung, K.M. Nyunt,H. Nyo, M.M. ThanN. KanimeA.V. Parajuli, S. Gopal, D.K. Kharal, B.N. OliJ.M. Paasman, G. Grimberg, J.F. OldenburgerV. Duong Dang, S. Mercky, J-P. RicciP. Lane, L. Burrows, G. Cameron, J. Dennis, D. Loubser, J. Moore, G. Pearce,P. Warren
166<strong>Global</strong> <strong>Forest</strong> <strong>Resources</strong> <strong>Assessment</strong> <strong>2005</strong>NicaraguaNigerNigeriaNiueNorthern MarianaIslandsNorwayOmanPakistanPalauPanamaPapua New GuineaParaguayPerúPhilippinesPitcairnPolandPortugalPuerto RicoRepublic of KoreaRéunionRomaniaRussian FederationRwandaSaint Kitts and NevisSaint LuciaSaint Pierre and MiquelonSaint Vincent and theGrenadinesSamoaSaudi ArabiaSenegalSerbia and MontenegroM. Cuadra Cruz, Y. González, M. García Roa, J. Herrera Rivera, S. SánchezSegoviaI. Adamou, B. IdrissaJ.B. Adesina, G. UjorT.V. Leki MokoiaJ. Donnegan, M.M. PangelinanS.M. TomterA.M. Bin Mostahil Al-KathiryK.M. Suleman, S.M. Rafiq, B.A. WaniJ. Donnegan, K. RengulbaiR. Gutiérrez Rivera, H. Bonilla, J. Branca, A. Caicedo, N. Cubas, J. Díaz,D. González, J.A. González, T. Hernández, C. Herrera, N. Herrera,M. Hurtado, J. Justavino, F. Magallón, C. Melgarejo, C. Prieto, R. BrownSalazar, T. SilveraV. AmbiaD. Mann, M. AquinoR. Malleux Hernani, L.A. Córdova Arrieta, J. Malleux Orjeda, A. MorizakiR.T. Acosta, M. Amaro, N. Bambalan, M.Ma. Quintos-NatividadS. Gillam, K. MaddocksR. Michalak, M. Jablonski, G. ZajączkowskiO. DuarteE. Gonzáles, T.J. BrandeisS-H. Kim, K-H. Lee, Y-M. SonB. NavezM. Moise, I. Abrudan, D. Achim, S. Maftei, R. TomescuA. Filipchuk, B. MoiseevS. Murererehe, C. HabimanaI. Palmer-Rannie, I. WattsC. IsaacF. UrtizbéréaC. RichardA.S. Lemalu, A. MathiasK.B. Nasir Al Mosa, Y.M. Ali EldoolS. Gueye, W. Bodian, C. Dieng, I. Ndiaye, B. WeleD. Jovic, A. Ceranic, G. Ivanovic, R. Jankovic, R. Kankaras, D. Karadzic,M. Medarevic, L. Mihajlovic, S. Milic, S. Orlovic, S. Stajic, M. Stingic,A. Svilicic
Annex 1: Contributors 167SeychellesSierra LeoneSingaporeSlovakiaSloveniaSolomon IslandsSomaliaSouth AfricaSouth Georgia andSouth Sandwich IslandsSpainSri LankaSudanSurinameSwazilandSwedenSwitzerlandSyrian Arab RepublicTajikistanTanzania, UnitedRepublic ofThailandTimor-LesteTogoTongaTrinidad and TobagoTunisiaTurkeyTurkmenistanUgandaUkraineB. Esther, J. Prosper, F. Coeur de LionE.K. Alieu, S.A. Mansaray, G. KokerG. Davison, L. Chan, C.P. TingR. Longauer, J. Bavlsik, J. Ďurkovič, V. Longauerová, J. Mecko, J. Minďáš,M. Moravčík, P. Pavlenda, R. Petráš, R. Svitok, J. Vladovič, J. TutkaM. Hočevar, J. Beguš, M. Božič, K. Celič, S. Golob, D. Hladnik, J. Jakša,A. Kobler, M. Kovač, G. Kušar, D. Matijašić, R. Mavsar, M. Medved,M. Mohorič, R. Pisek, M. Piškur, A. Rotter, D. Šabić, P. SimončičG. KonairamoJ.A. OsmanS. Malasa, S. MabenaS. Gillam, H. HallR. Vallejo Bombín, B. Pino Díaz, Ma.J. Rodriguez de Sancho, J.Ma. SolanoLópezA. SathurusingheS.Y. Mohamed Ahmed, O.O. Abd Alla, H. Ali El Atta, N. Dawelbait,F.A.A. Mhe Eddin, H. Kamal Eddin, E-F. Ettagi, S.M. El Hassan,M.I. Eddin Hussein, S.A. Al Mahi, S. Bakhit Mandu, M. E-G. AttaEl Mannan, N. Mohamdein, L. Mohamein, M.O. Ibn Oaf, E-S.A. AllaEl Sheikh, E-N.A. Alla El Siddig, M. SiragR. Somopawiro, M.L. Kingweg, R. Matai, A. SanredjoS.T. GamedzeM. FridhP. Brassel, J. Boehl, U-B. Braendli, T. Gruenenfelder, A. Lanz, H.P. Schaffer,C-L. SuterZ. Jibawi, A. DaoudK. Akhmadov, K. Abdukodirov, I. Akhmadov, C. ShomuratovaI.Y. Mnangwone, A.A. Bohero, F.E. HauleJ. Charuppat, T. CharuppatM. da Silva, C. Molhnar, E. NacurayK. Sessi, K. KokouH.O. Fa’anunuA. Ramnarine, S. Faizool, S. RamnarineR. Aini, G. Gader, A. Mokhtar, S. Hélal, M.A. Zarrouk, S.B. Salah, K. SelmiY. Erdogan, F. TasciA. Atamuradov, S. KarryevaP. DrichiV.F. Romanovskyy, V. Brezhnev, V. Parpan, M. Popkov, V. Tkach
168<strong>Global</strong> <strong>Forest</strong> <strong>Resources</strong> <strong>Assessment</strong> <strong>2005</strong>United Arab EmiratesUnited KingdomUnited States of AmericaUnited States VirginIslandsUruguayUzbekistanVanuatuVenezuelaViet NamWallis and Futuna IslandsYemenZambiaZimbabweA.R. Almoalla, A.S. Ali, M. Ismail, M.M. Ali Makkawi, B.F. MobarakS. Gillam, P.H. Blair, J. Gilbert, S. Gregory, R. Milne, G. Patterson, S. Pryor,B. Selmes, S. Ward, V. West, S. WongB. Smith, D. Fujii, L. Heath, J. Howard, L. Langner, P. Miles, S. Oldfield,K. Skog, J. Smith, B. Tkacz, J. VissageT. J. BrandeisR.D. Echeverría, J.P. Nebel, F. Porcile, D. San RománG. Vildanova, S. Allayarov, U. Davronov, B. Dyakin, M. Ganiev, A. Sultanov,M. Tursunbaeva, M. YakubovR.M. Virnamangga, P. Kamasteia, M. KilmanR. Silva, A. Catalán, O. Perez, J.G. Valero LacruzD.H. KhanhJ. Fourmy, J-M. Izard, F. NuttensM.H. MoqbilD.M. TomboJ. Mudekwe, D. Kwesha, S. Mandinyenya, D. Maruzane, C. Musokonyi,F. Tete<strong>FAO</strong>/UNECE STAFF, CONSULTANTS AND VOLUNTEERSH. Abdel Nour, S. Afifi, G. Allard, D.O. Altrell, M. Amatiste Cardelli, I. Amsallem, G. Arias, P. BaezaLopez, L. Ball, F. Banoun, T.J. Brandeis, M. Brodsky, A. Branthomme, A. Braslavsky, J.B. Carle, C.M.Carneiro, E. Carosella, F. Castañeda, R. Cenciarelli, L. Chen, N. Dawelbait, A. Del Lungo, G. De Pol,F. Dicarlo, J. Donnegan, P. Durst, C. Eckelmann, M.H. El-Lakany, I. Farias, V. Ferrier, S. Fortuna, M.Garzuglia, K. Govil, M. Grylle, H. Guarin, L. Hamilton, T. Hofer, P. Holmgren, R. Hong, G. Jianchun,Ö. Jonsson, M. Jurvelius, M. Kashio, H. Katsuhisa, M. Kattila, S. Kelatwang, W. Killmann, D. Kneeland,P. Kone, A. Korotkov, J.P. Koyo, M. Laverdière, A. Lebedys, J. Lorbach, P. Lowe, Q. Ma, L.G.Marklund, M. Martin, A. Mathias, G. Maynard, D. McGuire, M. Mengarelli, E. Müller, A. Nabulon,CTS. Nair, T. Omran, H. Ortiz Chour, I. Osepashvili, A. Perlis, M. Piazza, J.A. Prado Donoso,C. Prins, D. Reeb, F. Romano, M. Ryan, M. Saket, F. Salinas, V. Sasse, D. Schoene, P. Sigaud, J. Solari,R. Tavani, O. Tenjoh-Okwen, L. Travertino Grande, F. Urbani, P. Vuorinen, S. Walter, A. Whiteman,D. Wiell, M.L. Wilkie, D. WilliamsonINTERNATIONAL ORGANIZATIONS AND INSTITUTIONSCenter for International <strong>Forest</strong>ry Research (CIFOR); Convention on Biological Diversity (CBD);Intergovernmental Panel on Climate Change (IPCC); International Institute for Applied SystemsAnalysis (IIASA); International Network for Bamboo and Rattan (INBAR); International TropicalTimber Organization (ITTO); International Union of <strong>Forest</strong> Research Organizations (IUFRO);Millennium Ecosystem <strong>Assessment</strong>; Ministerial Conference on the Protection of <strong>Forest</strong>s in Europe(MCPFE); Montréal Process (Working Group on Criteria and Indicators for the Conservation andSustainable Management of Temperate and Boreal <strong>Forest</strong>s); Ramsar Convention on Wetlands; UnitedNations Economic Commission for Europe (UNECE); United Nations Environment Programme(UNEP); United Nations Forum on <strong>Forest</strong>s (UNFF); United Nations Framework Convention onClimate Change (UNFCCC); World Bank; World Conservation Monitoring Centre (UNEP-WCMC);World Conservation Union (IUCN); World <strong>Resources</strong> Institute (WRI)
169Annex 2Terms and definitions for the nationalreporting tables for FRA <strong>2005</strong>FOREST AND OTHER WOODED LAND<strong>Forest</strong>Land spanning more than 0.5 hectares with trees higher than 5 metres and a canopycover of more than 10 percent, or trees able to reach these thresholds in situ. It doesnot include land that is predominantly under agricultural or urban land use.<strong>Forest</strong> is determined both by the presence of trees and the absence of otherpredominant land uses. The trees should be able to reach a minimum height of5 metres (m) in situ. Areas under reforestation that have not yet reached butare expected to reach a canopy cover of 10 percent and a tree height of 5 m areincluded, as are temporarily unstocked areas, resulting from human interventionor natural causes, which are expected to regenerate.Includes: areas with bamboo and palms provided that height and canopycover criteria are met; forest roads, firebreaks and other small open areas;forest in national parks, nature reserves and other protected areas such asthose of specific scientific, historical, cultural or spiritual interest; windbreaks,shelterbelts and corridors of trees with an area of more than 0.5 ha and width ofmore than 20 m; plantations primarily used for forestry or protective purposes,such as rubber-wood plantations and cork oak stands.Excludes: tree stands in agricultural production systems, for example infruit plantations and agroforestry systems. The term also excludes trees inurban parks and gardens.Other wooded landOther landOther land withtree coverLand not classified as forest, spanning more than 0.5 hectares; with treeshigher than 5 m and a canopy cover of 5–10 percent, or trees able to reachthese thresholds in situ; or with a combined cover of shrubs, bushes andtrees above 10 percent. It does not include land that is predominantly underagricultural or urban land use.All land that is not classified as forest or other wooded land.Includes: agricultural land, meadows and pastures, built-up areas, barren land,etc.; areas classified under the subcategory ‘other land with tree cover’.Land classified as other land, spanning more than 0.5 hectares with a canopycover of more than 10 percent of trees able to reach a height of 5 m at maturity.Includes: groups of trees and scattered trees in agricultural landscapes, parks,gardens and around buildings, provided that the area, height and canopy covercriteria are met; includes tree plantations established mainly for other purposesthan wood, such as fruit orchards.LAND AREALand areaTotal country area excluding area under inland water bodies.The definition of inland water bodies generally includes major rivers and lakes.Validated data in this category are obtained mainly from the UnitedNations Statistics Division, New York. Possible variations in the data maybe due to updating and revisions of the country data and not necessarily toany change of area.
170<strong>Global</strong> <strong>Forest</strong> <strong>Resources</strong> <strong>Assessment</strong> <strong>2005</strong>Inland waterbodiesInland water bodies generally include major rivers, lakes and waterreservoirs.OWNERSHIPPrivate ownershipPublic ownershipOther ownershipLand owned by individuals, families, private cooperatives, corporations,industries, private religious and educational institutions, pension orinvestment funds and other private institutions.Private owners may be engaged in agriculture or other occupationsincluding forestry.Land owned by the state (national, state and regional governments) orgovernment-owned institutions or corporations or other public bodiesincluding cities, municipalities and villages.Land that is classified neither as public ownership nor as private ownership.Includes: land for which ownership is not defined or unknown.DESIGNATED FUNCTIONS OF FOREST AND OTHER WOODED LANDDesignated For the purpose of FRA <strong>2005</strong>, the designated function refers to the function orfunctionspurpose assigned to a piece of land either by legal prescriptions or by decisionof the landowner/manager. It applies to land classified as forest and as otherwooded land.Conservation ofbiodiversityMultiple purposePrimary functionProductionProtection of soiland waterSocial servicesTotal area withfunction<strong>Forest</strong>/other wooded land designated for conservation of biological diversity.Includes, but is not limited to, protected areas.<strong>Forest</strong>/other wooded land designated for any combination of: production ofgoods, protection of soil and water, conservation of biodiversity and provisionof socio-cultural services, and where none of these alone can be considered asbeing significantly more important than the others.A designated function is considered to be primary when it is significantly moreimportant than other functions. This includes areas that are legally or voluntarilyset aside for specific purposes.The category ‘multiple purpose’ is considered a primary function whenlegal prescriptions and/or landowner decisions explicitly assign functions thatcorrespond to two or more of the designation categories and where none ofthese is significantly more important than the others.<strong>Forest</strong>/other wooded land designated for production and extraction of forestgoods, including both wood and non-wood forest products (NWFPs).<strong>Forest</strong>/other wooded land designated for protection of soil and water.<strong>Forest</strong>/other wooded land designated for the provision of social services.May include: recreation, tourism, education and/or conservation of cultural/spiritual sites.Total area where a specific function has been designated, regardless of whetherit is primary or not.The designation categories for total area with function are not exclusive. Hence,areas can be counted more than once, for example: areas with multiple purposesas primary function should be counted once for each specific function includedin the multiple purposes; areas with a specific designated primary function shouldbe counted more than once if other, less significant, functions have also beendesignated.
Annex 2: Terms and definitions for the national reporting tables for FRA <strong>2005</strong> 171Unknownfunction<strong>Forest</strong>/other wooded land for which a specific function has not been designatedor where the designated function is unknown.FOREST CHARACTERISTICSModified natural <strong>Forest</strong>/other wooded land of naturally regenerated native species where there areforest/other clearly visible indications of human activities.wooded landIncludes, but is not limited to: selectively logged-over areas, naturallyregenerating areas following agricultural land use, areas recovering from humaninducedfires, etc.; areas where it is not possible to distinguish whether theregeneration has been natural or assisted.Primary forest/other wooded landProductiveplantation(in forest/otherwooded land)Protectiveplantation(in forest/otherwooded land)Semi-naturalforest/otherwooded land<strong>Forest</strong>/other wooded land of native species, where there are no clearly visibleindications of human activities and the ecological processes are not significantlydisturbed.Includes: areas where collection of NWFPs occurs, provided the humanimpact is small. Some trees may have been removed.<strong>Forest</strong>/other wooded land of introduced species and in some cases native species,established through planting or seeding, mainly for production of wood or nonwoodgoods.Includes: all stands of introduced species established for production of woodor non-wood goods.May include: areas of native species characterized by few species, straight treelines and/or even-aged stands.<strong>Forest</strong>/other wooded land of native or introduced species, established throughplanting or seeding mainly for provision of services.Includes: all stands of introduced species established for provision ofenvironmental services, such as soil and water protection, pest control andconservation of habitats of biological diversity; areas of native species characterizedby few species, straight tree lines and even-aged stands.<strong>Forest</strong>/other wooded land of native species, established through planting,seeding or assisted natural regeneration.Includes: areas under intensive management where native species are usedand deliberate efforts are made to increase/optimize the proportion of desirablespecies, thus leading to changes in the structure and composition of the forest.Naturally regenerated trees from other species than those planted/seeded maybe present.May include: areas with naturally regenerated trees of introduced species.Includes: areas under intensive management where deliberate efforts, such asthinning or fertilizing, are made to improve or optimize desirable functions ofthe forest. These efforts may lead to changes in the structure and compositionof the forest.GROWING STOCKGrowing stockVolume over bark of all living trees more than X cm in diameter at breastheight (DBH). Includes the stem from ground level or stump height up to atop diameter of Y cm, and may also include branches to a minimum diameterof W cm.The diameter is measured at 30 cm above the end of the buttresses if theseare higher than 1 m.Includes: windfallen living trees.Excludes: Smaller branches, twigs, foliage, flowers, seeds and roots.
172<strong>Global</strong> <strong>Forest</strong> <strong>Resources</strong> <strong>Assessment</strong> <strong>2005</strong>Commercialgrowing stockThe part of the growing stock that is considered as commercial or potentiallycommercial under current market conditions (and with a diameter at breastheight of Z cm or more).Includes: all commercial and potentially commercial (merchantable)species for domestic and international markets.Excludes: growing stock on areas where legal, economic or other specificrestrictions prevent felling and removal of wood.When most species are commercial, i.e. in the temperate and boreal zone,the commercial growing stock can be close to the total growing stock. Onthe other hand, when only a small fraction of all species are merchantable, itcan be considerably smaller.BIOMASSBiomassAbove-groundbiomassBelow-groundbiomassDead-woodbiomassOrganic material both above ground and below ground, and both living anddead, e.g., trees, crops, grasses, tree litter, roots, etc. Biomass includes thepool definition for above- and below-ground biomass.All living biomass above the soil, including stem, stump, branches, bark,seeds and foliage.Where the forest understorey is a relatively small component of the abovegroundbiomass, it is acceptable to exclude it, provided this is done in a consistentmanner throughout the inventory time series.All living biomass of live roots. Fine roots of less than (suggested) 2 mmdiameter are sometimes excluded because these often cannot be distinguishedempirically from soil organic matter or litter.May include: the below-ground part of the stump.All non-living woody biomass not contained in the litter, either standing,lying on the ground, or in the soil. Includes wood lying on the surface, deadroots, and stumps larger than or equal to 10 cm in diameter or any otherdiameter used by the country.CARBON STOCKCarbon stockCarbon in abovegroundbiomassCarbon in belowgroundbiomassCarbon in deadwoodbiomassThe quantity of carbon in a ‘pool’, meaning a reservoir or system that has thecapacity to accumulate or release carbon.Examples of carbon pools are: living biomass (including above- andbelow-ground biomass); dead organic matter (including dead wood andlitter); soils (soil organic matter). The units are mass.Carbon in all living biomass above the soil, including stems, stump, branches,bark, seeds and foliage.Where the forest understorey is a relatively small component of theabove-ground biomass carbon pool, it is acceptable to exclude it, providedthis is done in a consistent manner throughout the inventory time series.Carbon in all living biomass of live roots.Includes: the below-ground part of the stump.Excludes: fine roots of less than 2 mm diameter because these often cannotbe distinguished empirically from soil organic matter or litter.Carbon in all non-living woody biomass not contained in the litter, eitherstanding, lying on the ground or in the soil. Dead wood includes woodlying on the surface, dead roots, and stumps larger than or equal to 10 cm indiameter or any other diameter used by the country.
Annex 2: Terms and definitions for the national reporting tables for FRA <strong>2005</strong> 173Carbon in litterSoil carbonCarbon in all non-living biomass with a diameter less than a minimumdiameter chosen by the country, in various states of decomposition above themineral or organic soil. This includes the litter, fumic and humic layers.Includes: live fine roots of less than 2 mm (or other value chosen by thecountry as diameter limit for below-ground biomass), where they cannot beempirically distinguished from the litter.Organic carbon in mineral and organic soils (including peat) to a specified depthchosen by the country and applied consistently through the time series.Includes: live fine roots of less than 2 mm (or other value chosen bythe country as diameter limit for below-ground biomass) with soil organicmatter, where they cannot be distinguished from it empirically.DISTURBANCES AFFECTING FOREST HEALTH AND VITALITYDisturbances A disturbance is defined as “an environmental fluctuation and destructive(affecting forest event that disturb forest health, structure, and/or change resources orhealth and physical environment at any given spatial or temporal scale”. Disturbancesvitality)that affect health and vitality include biotic agents, such as insects anddiseases, and abiotic agents, such as fire, pollution and extreme weatherconditions (White and Pickett, 1985).Disturbance bydiseasesDisturbance byfireDisturbance byinsectsOther disturbanceDisturbance caused by diseases attributable to pathogens, such as bacteria,fungi, phytoplasmas or viruses.Disturbance caused by wildfire, regardless of whether it broke out inside oroutside the forest/other wooded land.A wildfire is any unplanned and uncontrolled wildland fire that, regardlessof ignition source, may require suppression response.Disturbance caused by insect pests that are detrimental to tree health.Disturbance caused by factors other than fire, insects or diseases.May include: areas affected by drought, flooding, windfalls, acid rain, etc.THREATENED SPECIESEndangered A taxon is endangered when the best available evidence indicates that itspeciesmeets any of the criteria A to E specified for the endangered category of theIUCN red list and it is therefore considered to be facing a very high risk ofextinction in the wild (IUCN, 2000).Criticallyendangered speciesVulnerable speciesNative speciesA taxon is critically endangered when the best available evidence indicatesthat it meets any of the criteria A to E for the critically endangered categoryof the IUCN red list and is therefore considered to be facing an extremelyhigh risk of extinction in the wild.A taxon is vulnerable when the best available evidence indicates that it meetsany of the criteria A to E for the vulnerable category of the IUCN red list andis therefore considered to be facing a high risk of extinction in the wild.A native species is one which naturally exists at a given location or in aparticular ecosystem, i.e. it has not been moved there by humans (CBD,2002, p.154).The term native species is synonymous with indigenous species.
174<strong>Global</strong> <strong>Forest</strong> <strong>Resources</strong> <strong>Assessment</strong> <strong>2005</strong>WOOD AND NWFP REMOVALWood removal The wood removed (volume of round wood over bark) for production ofgoods and services other than energy production (woodfuel).The term removal differs from fellings as it excludes felled trees left in theforest.Includes: removal from fellings in an earlier period and from trees killed ordamaged by natural causes; removal by local people or owners for their own use.Woodfuel removalNon-wood forestproduct removalThe wood removed for energy production purposes, regardless of whetherfor industrial, commercial or domestic use.Includes: wood collected or removed directly from forest or otherwooded land for energy purposes only and excludes woodfuel produced as aby-product or residual matter from the industrial processing of round wood;removal from fellings in an earlier period and from trees killed or damagedby natural causes; removal by local people or owners for their own use.Annual removal of an NWFP from forest and other wooded land.VALUE OF WOOD AND NWFP REMOVALValue of wood Value of the wood removed for production of goods and services other thanremovalenergy production (woodfuel).The value to be reported refers to the market value at the site of removal.Where values are obtained from a point further down the production chain,transport costs and possible handling and/or processing costs should bededucted. If the wood is removed for subsistence use, the value shouldbe calculated based on local market price. The value should be reportedexcluding taxes.Value of woodfuelremovalValue of nonwoodforestproduct removalValue of the wood removed for energy production purposes, regardless ofwhether for industrial, commercial or domestic use.The value to be reported refers to the market value at the site of removal.Where values are obtained from a point further down the production chain,transport costs and possible handling and/or processing costs should bededucted. If the wood is removed for subsistence use, the value shouldbe calculated based on local market price. The value should be reportedexcluding taxes.Value of the annual removal of primary NWFPs.The value to be reported refers to the market value at the site of removal.Values are obtained from a point further down the production chain,transport costs and possible handling and/or processing costs should bededucted. If the NWFP is removed for subsistence use, the value shouldbe calculated based on local market price. The value should be reportedexcluding taxes.EMPLOYMENTEmploymentAny type of work performed or services rendered under a contract of hire,written or oral, in exchange for wage or salary, in cash or in kind (based ondefinitions by ILO and the Employment Security Commission).
Annex 2: Terms and definitions for the national reporting tables for FRA <strong>2005</strong> 175Employmentrelated tothe primaryproduction ofgoodsEmploymentrelated to theprovision ofservicesEmploymentin unspecifiedforestry activitiesEmployment in activities related to the primary production of goods, suchas industrial roundwood, woodfuel and NWFPs.Includes: employment in direct productive activities such as planting,seeding, silviculture, logging, terrain transport, collection of NWFPs,including administrative and supervisory staff in companies that are engagedin such activities; employment in direct supporting activities to productionof goods, such as plant production in nurseries, etc.; contractors working inactivities as mentioned under the first item above, even if these are legallyconsidered self-employed; employment in direct supervision of theseactivities by private and/or public entities.Employment in activities directly related to the provision of forest andwoodland services.Includes: employment in activities such as forest-related ecotourism,establishment and management of protective plantations, guarding ofnational parks, etc., regardless of whether carried out by private or publicentities; employment in direct supervision of these activities by private and/or public entities.Employment in unspecified forestry activities related to the primaryproduction of goods and/or the provision of forest services.
176<strong>Global</strong> <strong>Forest</strong> <strong>Resources</strong> <strong>Assessment</strong> <strong>2005</strong>
177Annex 3<strong>Global</strong> tablesNOTESCountry nomenclature and regional groups used in the tablesThe country names used in these tables follow standard UN practice regarding nomenclature andalphabetical listing of countries. The regional groups represent <strong>FAO</strong>’s standardized regional breakdownof the world according to geographical criteria.TotalsNumbers may not tally because of rounding. <strong>Global</strong> and regional totals are omitted in those cases wherethe sum of the reported values would not give a correct estimate because of incomplete data sets.Abbreviationsn.s. = not significant, indicating a very small value- = not availablen.ap. = not applicableo.b. = over barkCONTENTS1. Basic data on countries and areas 1782. Information status on area of forest, growing stock and biomass 1843. Extent of forest and other wooded land <strong>2005</strong> 1904. Change in extent of forest and other wooded land 1990-<strong>2005</strong> 1965. Ownership of forest and other wooded land 2000 2026. Designated functions of forest – primary function <strong>2005</strong> 2087. Designated functions of forest – total area with function <strong>2005</strong> 2148. Characteristics of forest and other wooded land <strong>2005</strong> 2209. Change in extent of primary forest 1990-<strong>2005</strong> 23210. Change in extent of forest plantations 1990-<strong>2005</strong> 23811. Growing stock in forest and other wooded land <strong>2005</strong> 24412. Annual change in growing stock 1990-<strong>2005</strong> 25013. Biomass stock in forest and other wooded land <strong>2005</strong> 25614. Carbon stock in forest and other wooded land <strong>2005</strong> 26215. Disturbances affecting forest and other wooded land 2000 26816. Composition of growing stock and diversity of tree species 2000 27417. Removals of wood products 1990-<strong>2005</strong> 28018. Removals of non-wood forest products <strong>2005</strong> 28619. Value of wood and non-wood forest products removals <strong>2005</strong> 29820. Employment in forestry 1990 and 2000 304
178<strong>Global</strong> <strong>Forest</strong> <strong>Resources</strong> <strong>Assessment</strong> <strong>2005</strong>TABLE 1Basic data on countries and areasCountry/area Land area a Population 2004 b GDP 2004 b(1 000 ha)Total Density Annual Rural Per capita Annual(1 000) (Population/km 2 ) growth(% of total) (US$)growthraterate(%) (%)Angola 124 670 13 963 11.2 3.2 63.6 887 11.2Botswana 56 673 1 727 3.1 0.3 48.0 3 684 4.6British Indian Ocean Territory 8 1 15.0Comoros 186 614 275.6 2.4 64.4 361 1.9Kenya 56 914 32 447 57.0 1.7 59.5 343 2.1Lesotho 3 035 1 809 59.6 0.9 81.9 540 3.1Madagascar 58 154 17 332 29.8 2.6 73.2 239 5.3Malawi 9 408 11 182 118.9 2.0 83.3 165 3.8Mauritius 203 1 234 608.0 1.0 56.5 4 289 4.2Mayotte 37 172 459.9Mozambique 78 409 19 129 24.4 1.8 63.2 270 7.8Namibia 82 329 2 033 2.5 0.9 67.0 1 905 4.2Réunion 250 777 310.8Seychelles 45 85 188.2 1.3 49.9 6 573 -2.0South Africa 121 447 45 584 37.5 42.6 3 307 3.7Swaziland 1 720 1 120 65.1 1.3 76.3 1 356 2.1Uganda 19 710 25 920 131.5 2.5 87.7 285 5.7United Republic of Tanzania 88 359 36 571 41.4 1.9 63.6 322 6.3Zambia 74 339 10 547 14.2 1.4 63.8 366 4.7Zimbabwe 38 685 13 151 34.0 0.4 64.6Total Eastern and Southern Africa 814 581 235 398Algeria 238 174 32 373 13.6 1.7 40.6 1 981 5.2Burkina Faso 27 360 12 387 45.3 2.3 81.8 257 3.9Chad 125 920 8 823 7.0 2.8 74.6 277 31.0Djibouti 2 318 716 30.9 1.4 15.9 861 3.0Egypt 99 545 68 738 69.1 1.7 57.8 1 663 4.3Eritrea 10 100 4 477 44.3 2.0 79.6 163 1.8Ethiopia 100 000 69 961 70.0 1.9 84.1 113 13.4Libyan Arab Jamahiriya 175 954 5 674 3.2 2.1 13.4 7 483 4.5Mali 122 019 11 937 9.8 2.4 67.0 260 2.2Mauritania 102 522 2 906 2.8 2.0 37.0 396 6.6Morocco 44 630 30 586 68.5 1.6 41.9 1 302 3.5Niger 126 670 12 095 9.6 2.8 77.3 174 0.9Somalia 62 734 9 938 15.8 3.2 64.6Sudan 237 600 34 356 14.5 2.4 60.2 448 6.0Tunisia 15 536 10 012 64.4 1.2 35.9 2 315 5.8Western Sahara 26 600 274 1.0Total Northern Africa 1 517 682 315 253Benin 11 062 6 890 62.3 2.5 54.7 389 2.7Burundi 2 568 7 343 285.9 1.9 89.7 104 5.5Cameroon 46 540 16 400 35.2 1.9 47.9 651 4.8Cape Verde 403 481 119.4 2.5 43.3 1 328 5.5Central African Republic 62 298 3 947 6.3 1.7 56.8 232 0.9Congo 34 150 3 855 11.3 2.6 46.1 956 4.0Côte d’Ivoire 31 800 17 142 53.9 1.8 54.6 583 -2.3
Annex 3: <strong>Global</strong> tables 179Democratic Republic of the Congo 226 705 54 775 24.2 3.0 67.7 89 6.3Equatorial Guinea 2 805 506 18.0 2.4 51.0 3 989 10.0Gabon 25 767 1 374 5.3 2.2 15.6 3 859 2.0Gambia 1 000 1 449 144.9 1.9 73.9 344 8.3Ghana 22 754 21 053 92.5 1.8 54.2 285 5.2Guinea 24 572 8 073 32.9 2.1 64.3 433 2.6Guinea-Bissau 2 812 1 533 54.5 2.9 65.2 137 4.3Liberia 9 632 3 449 35.8 2.2 52.7 120 2.0Nigeria 91 077 139 824 153.5 2.4 52.5 361 3.6Rwanda 2 467 8 412 341.0 2.8 79.9 263 3.7Saint Helena 31 7 24.1Sao Tome and Principe 96 161 167.3 2.0 62.1 342 4.5Senegal 19 253 10 455 54.3 2.1 49.7 504 6.0Sierra Leone 7 162 5 436 75.9 1.9 60.5 206 7.4Togo 5 439 4 966 91.3 2.1 64.3 294 3.0Total Western and Central Africa 630 393 317 531Total Africa 2 962 656 868 182TABLE 1Basic data on countries and areasCountry/area Land area a Population 2004 b GDP 2004 b(1 000 ha)Total Density Annual Rural Per capita Annual(1 000) (Population/km 2 ) growth(% of total) (US$)growthraterate(%) (%)China 932 742 1 326 544 142.2 0.6 60.4 1 162 9.5Democratic People’sRepublic of Korea12 041 22 745 188.9 0.6 38.6Japan 36 450 127 764 350.5 0.2 34.4 39 195 2.7Mongolia 156 650 2 515 1.6 1.4 43.1 462 10.6Republic of Korea 9 873 48 142 487.6 0.5 19.5 12 743 4.6Total East Asia 1 147 756 1 527 710Bangladesh 13 017 140 494 1 079.3 1.7 75.4 396 5.5Bhutan 4 700 896 19.1 2.5 91.2 695 4.9Brunei Darussalam 527 361 68.6 1.4 23.2Cambodia 17 652 13 630 77.2 1.7 80.8 328 6.0India 297 319 1 079 721 363.2 1.4 71.5 538 6.9Indonesia 181 157 217 588 120.1 1.4 53.3 906 5.1Lao People’s Democratic Republic 23 080 5 792 25.1 2.3 78.8 372 6.0Malaysia 32 855 25 209 76.7 1.7 35.6 4 221 7.1Maldives 30 300 998.4 2.2 70.7 2 693 8.8Myanmar 65 755 49 910 75.9 1.1 70.0Nepal 14 300 25 190 176.2 2.1 84.6 245 3.7Pakistan 77 088 152 061 197.3 2.4 65.5 566 6.4Philippines 29 817 82 987 278.3 1.8 38.2 1 079 6.2Singapore 67 4 335 6 470.2 2.0 0.0 23 636 8.4Sri Lanka 6 463 19 444 300.9 1.1 79.0 965 6.0Thailand 51 089 62 387 122.1 0.6 67.8 2 399 6.1Timor-Leste 1 487 925 62.2 5.3 92.3 355 1.8Viet Nam 32 549 82 162 252.4 1.0 73.8 500 7.5Total South and Southeast Asia 848 952 1 963 392Afghanistan 65 209 17 685 45.3 76.2 7.5Armenia 2 820 3 050 108.1 -0.2 35.7 975 10.1
180<strong>Global</strong> <strong>Forest</strong> <strong>Resources</strong> <strong>Assessment</strong> <strong>2005</strong>Azerbaijan 8 260 8 280 100.2 0.6 50.0 957 11.2Bahrain 71 725 1 021.7 1.9 9.9Cyprus 924 776 83.9 0.7 30.7 13 245 3.7Georgia 6 949 4 521 65.1 -1.0 48.3 897 8.5Iran (Islamic Republic of) 163 620 66 928 40.9 1.3 32.7 1 812 6.5Iraq 43 737 24 700 57.8 2.2 33.0Israel 2 171 6 798 313.1 1.6 8.3 17 752 4.3Jordan 8 893 5 440 61.2 2.5 20.8 1 908 7.5Kazakhstan 269 970 14 958 5.5 0.5 44.1 1 822 9.4Kuwait 1 782 2 460 138.0 2.6 3.7Kyrgyzstan 19 180 5 099 26.6 0.9 66.1 324 7.1Lebanon 1 023 4 554 445.2 1.2 12.3 4 358 6.3Occupied Palestinian Territory 602 3 508 564.0 4.1Oman 30 950 2 659 8.6 2.3 21.9Qatar 1 100 637 57.9 2.1 7.8Saudi Arabia 214 969 23 215 10.8 3.0 12.0 9 259 5.2Syrian Arab Republic 18 378 17 783 96.8 2.3 49.8 1 150 3.6Tajikistan 14 060 6 430 45.7 0.7 75.5 226 10.6Turkey 76 963 71 727 93.2 1.4 33.2 3 197 8.9Turkmenistan 46 993 4 931 10.5 1.4 54.4 1 142 17.0United Arab Emirates 8 360 4 284 51.2 14.7Uzbekistan 41 424 25 930 62.6 1.3 63.5 645 7.7Yemen 52 797 19 763 37.4 3.0 74.0 550 2.7Total Western and Central Asia 1 101 205 346 841Total Asia 3 097 913 3 837 943TABLE 1Basic data on countries and areasCountry/area Land area a Population 2004 b GDP 2004 b(1 000 ha)Total Density Annual Rural Per capita Annual(1 000) (Population/km 2 ) growth(% of total) (US$)growthraterate(%) (%)Albania 2 740 3 188 116.4 0.6 55.6 1 470 6.2Andorra 48 66 141.0Austria 8 273 8 115 98.1 0.3 34.2 24 674 2.2Belarus 20 748 9 832 47.4 -0.5 28.7 1 516 11.0Belgium 3 028 10 405 344.2 0.3 2.8 23 134 2.9Bosnia and Herzegovina 5 120 3 836 74.9 0.0 55.2 1 384 4.7Bulgaria 11 063 7 780 70.3 -0.6 29.9 1 951 5.6Channel Islands 19 149 745.0 0.0 69.5Croatia 5 592 4 508 80.6 0.1 40.6 4 857 3.7Czech Republic 7 728 10 183 131.8 -0.2 25.6 6 148 4.0Denmark 4 243 5 397 127.2 0.2 14.5 30 930 2.4Estonia 4 239 1 345 31.7 -0.6 30.5 5 170 6.2Faeroe Islands 140 48 34.3Finland 30 459 5 215 17.1 0.1 39.1 25 107 3.7France 55 010 59 991 109.1 0.4 23.5 23 157 2.3Germany 34 895 82 631 236.8 0.1 11.7 23 209 1.6Gibraltar 1 28 2 788.4Greece 12 890 11 075 85.9 0.4 38.9 11 885 4.2Holy See 1Hungary 9 210 10 072 109.4 -0.6 34.5 5 339 4.0Iceland 10 025 290 2.9 0.4 7.1 32 449 5.2
Annex 3: <strong>Global</strong> tables 181Ireland 6 889 4 019 58.3 0.6 39.9 29 118 4.9Isle of Man 57 77 134.6Italy 29 411 57 573 195.8 -0.1 32.5 19 344 1.2Latvia 6 205 2 303 37.1 -0.8 33.9 4 502 8.5Liechtenstein 16 34 212.5Lithuania 6 268 3 439 54.9 -0.4 33.3 4 398 6.7Luxembourg 259 450 174.0 0.5 7.9 47 926 4.5Malta 32 401 1 253.1 0.5 8.1 9 508 1.4Monaco 2 33 16 923.1Netherlands 3 388 16 250 479.6 0.2 33.7 23 255 1.4Norway 30 625 4 582 15.0 0.4 20.5 39 198 2.9Poland 30 629 38 160 124.6 -0.1 38.1 4 885 5.3Portugal 9 150 10 436 114.1 0.7 44.9 10 395 1.0Republic of Moldova 3 288 4 218 128.3 -0.5 53.8 398 7.3Romania 22 987 21 858 95.1 -0.3 45.3 2 115 8.3Russian Federation 1 688 850 142 814 8.5 -0.4 26.7 2 302 7.2San Marino 6 28 462.8Serbia and Montenegro 10 200 8 152 79.9 -0.7 47.8 1 272 7.2Slovakia 4 808 5 390 110.5 0.0 42.3 4 488 5.5Slovenia 2 012 1 995 99.2 0.0 49.2 10 871 4.6Spain 49 944 41 286 82.7 0.5 23.4 15 079 3.1Sweden 41 162 8 985 21.8 0.3 16.6 28 912 3.6Switzerland 3 955 7 382 186.7 0.4 32.5 34 190 1.7The former Yugoslav Republicof Macedonia2 543 2 062 81.1 0.6 40.4 1 772 2.5Ukraine 57 935 48 008 82.9 -0.7 32.7 917 12.1United Kingdom 24 088 59 405 246.6 0.1 10.8 26 506 3.1Total Europe 2 260 180 723 495TABLE 1Basic data on countries and areasCountry/area Land area a Population 2004 b GDP 2004 b(1 000 ha)Total Density Annual Rural Per capita Annual(1 000) (Population/km 2 ) growth(% of total) (US$)growthraterate(%) (%)Anguilla 8 13 172.1Antigua and Barbuda 44 80 181.8 2.7 61.9 9 608 4.1Aruba 19 99 521.1Bahamas 1 001 320 32.0 0.8 10.3Barbados 43 272 632.1 0.4 47.7Bermuda 5 64 1 280.0 0.3 0.0British Virgin Islands 15 23 151.0Cayman Islands 26 44 169.2 57.3Cuba 10 982 11 365 103.5 0.3 24.2Dominica 75 71 95.3 0.4 27.6 3 534 2.0Dominican Republic 4 838 8 861 183.2 1.4 40.3 2 450 2.0Grenada 34 106 310.9 1.1 58.6 3 798 -2.8Guadeloupe 169 449 265.5Haiti 2 756 8 592 311.8 1.8 61.9 437 -3.8Jamaica 1 083 2 665 246.1 0.8 47.8 2 975 2.0Martinique 106 433 408.4Montserrat 10 9 93.4Netherlands Antilles 80 222 277.5 0.8 30.1
182<strong>Global</strong> <strong>Forest</strong> <strong>Resources</strong> <strong>Assessment</strong> <strong>2005</strong>Puerto Rico 887 3 929 442.9 0.8 3.1Saint Kitts and Nevis 36 47 130.5 0.6 68.0 7 427 4.0Saint Lucia 61 164 268.3 1.9 69.1 4 276 3.5Saint Vincent and the Grenadines 39 108 277.7 -0.8 40.7 3 382 4.0Trinidad and Tobago 513 1 323 258.0 0.8 24.2 7 921 6.2Turks and Caicos Islands 43 21 47.8United States Virgin Islands 34 113 332.8 1.4 6.2Total Caribbean 22 907 39 393TABLE 1Basic data on countries and areasCountry/area Land area a Population 2004 b GDP 2004 b(1 000 ha)Total Density Annual Rural Per capita Annual(1 000) (Population/km 2 ) growth(% of total) (US$)growthraterate(%) (%)Belize 2 280 283 12.4 3.2 51.5 3 669 4.2Costa Rica 5 106 4 061 79.5 1.4 38.8 4 534 4.2El Salvador 2 072 6 658 321.3 1.9 40.2 2 124 1.7Guatemala 10 843 12 628 116.5 2.6 53.3 1 676 2.7Honduras 11 189 7 141 63.8 2.5 54.0 952 4.6Nicaragua 12 140 5 604 46.2 2.2 42.3 778 3.7Panama 7 443 3 028 40.7 1.5 42.5 4 373 6.2Total Central America 51 073 39 403Canada 922 097 31 902 3.5 0.9 19.2 24 712 2.9Greenland 41 045 57 0.1 -0.4 17.3Mexico 190 869 103 795 54.4 1.5 24.2 5 968 4.4Saint Pierre and Miquelon 23 7 30.5United States of America 915 896 293 507 32.1 0.9 19.6 36 790 4.4Total North America 2 069 930 429 268Total North and Central America 2 143 910 508 064American Samoa 20 57 285.0Australia 768 230 20 120 2.6 1.2 7.7 22 074 3.0Cook Islands 23 21 93.0Fiji 1 827 848 46.4 1.5 47.5 2 232 3.8French Polynesia 366 246 67.2 1.2 47.9Guam 55 164 298.0 1.4 6.2Kiribati 73 98 134.0 1.5 51.3 532 1.8Marshall Islands 18 60 330.9 33.6 1 738 1.5Micronesia (Federated States of) 70 127 180.6 1.8 70.3 1 745 -3.8Nauru 2 13 652.4New Caledonia 1 828 229 12.5 1.9 38.6New Zealand 26 799 4 061 15.2 1.3 14.1 14 984 4.4Niue 26 2 8.3Northern Mariana Islands 46 77 161.4Palau 46 20 43.5 31.6 6 360 2.0Papua New Guinea 45 286 5 625 12.4 2.2 86.8 622 2.8Pitcairn 4 0Samoa 283 179 63.3 0.6 77.6 1 417 3.2Solomon Islands 2 799 471 16.8 3.1 83.2 621 3.8Tokelau 1 1 139.2Tonga 72 102 141.4 0.3 66.2 1 638 1.6
Annex 3: <strong>Global</strong> tables 183Tuvalu 3 12Vanuatu 1 219 215 17.6 2.3 76.7 1 110 3.0Wallis and Futuna Islands 20 16 80.1Total Oceania 849 116 32 764TABLE 1Basic data on countries and areasCountry/area Land area a Population 2004 b GDP 2004 b(1 000 ha)Total Density Annual Rural Per capita Annual(1 000) (Population/km 2 ) growth(% of total) (US$)growthraterate(%) (%)Argentina 273 669 38 226 14.0 0.8 9.7 7 511 9.0Bolivia 108 438 8 986 8.3 1.9 36.1 1 036 3.6Brazil 845 942 178 718 21.1 1.2 16.4 3 675 5.2Chile 74 880 15 956 21.3 1.2 12.7 5 448 6.1Colombia 103 870 45 300 43.6 1.6 23.1 2 069 4.0Ecuador 27 684 13 213 47.7 1.6 37.7 1 435 6.6Falkland Islands 1 217 3 0.2French Guiana 8 815 196 2.2Guyana 19 685 772 3.9 0.4 62.0 962 1.6Paraguay 39 730 5 782 14.6 2.4 42.1 1 413 2.9Peru 128 000 27 547 21.5 1.5 25.8 2 207 5.1South Georgia andthe South Sandwich Islands409 0Suriname 15 600 443 2.8 1.1 23.4 2 388 4.6Uruguay 17 502 3 399 19.4 0.6 7.3 5 826 12.3Venezuela (Bolivarian Republic of) 88 205 26 127 29.6 1.8 12.1 4 575 17.3Total South America 1 753 646 364 668WORLD c 13 067 421 6 335 116aTotal area of the country excluding areas under inland water bodies. The figures are from <strong>FAO</strong>STAT (<strong>FAO</strong>, <strong>2005</strong>a) where available, otherwisefrom CIA (<strong>2005</strong>).bFrom World Bank (<strong>2005</strong>).cWorld totals correspond to the sum of the reporting units. About 35 million hectares of land in Antarctica, some Arctic and Antarctic islands andsome other small islands are not included. See <strong>FAO</strong> (<strong>2005</strong>c) for more information on these areas.
184<strong>Global</strong> <strong>Forest</strong> <strong>Resources</strong> <strong>Assessment</strong> <strong>2005</strong>TABLE 2Information status on area of forest, growing stock and biomassCountry/area Most recent data on forest area a <strong>Forest</strong> area <strong>Forest</strong> area Growing Biomasstime series b projection c stock time estimation dField survey/ Remote Expert series bmapping sensing estimateAngola 1970 1983 MLT LEM SIN GPGBotswana 1990 <strong>2005</strong> SIN DEF SIN EXPBritish Indian Ocean Territory 1990 SIN ANC - -Comoros 1984 MLT LEM MLT GPGKenya 2000 MLT MOD SIN GPG/EXPLesotho 1995 MLT LEM - GPG/NATMadagascar 2004 SIN DEF SIN GPGMalawi 1991 MLT LEM SIN GPG/BWNMauritius 2000 MLT LEM SIN GPGMayotte 1997 MLT LEM - -Mozambique 1994 MLT LEM SIN GPGNamibia 1992 2000 MLT LEM SIN GPGRéunion 2000 MLT LEM - -Seychelles 1992 SIN ANC SIN GPGSouth Africa 1995 SIN ANC SIN GPGSwaziland 1999 EXP LEM SIN GPGUganda 2001 MLT LEM SIN EXPUnited Republic of Tanzania 1995 MLT LEM SIN GPGZambia 1969 1974 MLT LEM SIN GPG/NATZimbabwe 1992 MLT LEM SIN GPGEastern and Southern AfricaAlgeria 1984 2000 MLT DEF SIN GPGBurkina Faso 1980 1987 MLT LEM MLT GPGChad 1988 MLT DEF SIN GPGDjibouti 1985 SIN ANC SIN GPGEgypt 2004 MLT LEM SIN GPGEritrea 1997 SIN DEF - -Ethiopia 1994 MLT LEM SIN GPGLibyan Arab Jamahiriya <strong>2005</strong> SIN ANC SIN GPGMali 1991 SIN DEF SIN GPGMauritania 1982 1991 MLT LEM SIN GPGMorocco 1990 SIN DEF MLT GPGNiger 1984 2000 SIN DEF SIN GPGSomalia 1980 SIN REG SIN GPGSudan 2000 MLT LEM SIN GPGTunisia 2000 <strong>2005</strong> MLT DEF SIN GPGWestern Sahara 1990 EXP DEF SIN GPGNorthern AfricaBenin 1996 <strong>2005</strong> MLT LEM - -Burundi 1997 2001 MLT LEM - -Cameroon <strong>2005</strong> SIN DEF SIN GPGCape Verde 2003 SIN DEF SIN GPGCentral African Republic 1994 SIN DEF SIN GPGCongo 1993 MLT DEF SIN GPGCôte d’Ivoire 1993 1993 MLT MOD SIN GPGDemocratic Republic of the Congo 1989 MLT LEM SIN GPG
Annex 3: <strong>Global</strong> tables 185TABLE 2Information status on area of forest, growing stock and biomassCountry/area Most recent data on forest area a <strong>Forest</strong> area <strong>Forest</strong> area Growing Biomasstime series b projection c stock time estimation dField survey/ Remote Expert series bmapping sensing estimateEquatorial Guinea 1990 1998 MLT LEM SIN GPGGabon 1999 MLT LEM SIN GPGGambia 1993 MLT LEM SIN GPG/BWNGhana 1996 MLT DEF SIN GPG/NATGuinea 1988 SIN DEF SIN GPGGuinea-Bissau 1976 1990 MLT LEM SIN GPGLiberia 2000 MLT LEM SIN GPGNigeria 1994 MLT LEM SIN GPGRwanda 2001 MLT LEM MLT GPG/NATSaint Helena 1980 SIN ANC - -Sao Tome and Principe 1989 SIN ANC SIN GPGSenegal 2004 MLT MOD SIN GPG/NATSierra Leone 1986 1986 MLT LEM - -Togo 1970 2002 MLT LEM - -Western and Central AfricaChina 2001 2001 <strong>2005</strong> MLT MOD MLT GPG/NATDemocratic People’sRepublic of Korea1996 1996 MLT LEM MLT GPGJapan 2002 2002 MLT LEM MLT GPG/NATMongolia 2002 <strong>2005</strong> MLT LEM SIN GPGRepublic of Korea 2000 MLT LEM MLT GPG/NATEast AsiaBangladesh 1995 1995 MLT LEM MLT GPGBhutan 1999 1999 MLT LEM SIN GPG/BWNBrunei Darussalam 1979 1979 1996 MLT LEM SIN GPG/BWNCambodia 2002 2002 MLT LEM SIN GPG/BWNIndia 2001 2001 MLT REG MLT GPG/NAT/EXPIndonesia 2000 2000 MLT LEM MLT GPG/EXPLao People’s Democratic Republic 1997 2002 MLT LEM SIN GPG/BWNMalaysia 1997 <strong>2005</strong> MLT MOD MLT GPG/BWNMaldives 1991 <strong>2005</strong> SIN LEM - -Myanmar 2000 2000 MLT LEM MLT GPG/BWNNepal 1994 1994 <strong>2005</strong> MLT LEM MLT GPG/NATPakistan 1984 1990 <strong>2005</strong> MLT LEM SIN GPG/BWNPhilippines 2003 MLT LEM MLT GPG/EXPSingapore 1997 SIN ANC - -Sri Lanka 1996 1996 MLT LEM MLT GPG/BWNThailand 1998 1998 MLT LEM SIN GPGTimor-Leste 1989 2000 MLT LEM - -Viet Nam 2003 <strong>2005</strong> MLT LEM MLT GPG/BWNSouth and Southeast AsiaAfghanistan 1979 MLT LEM SIN GPGArmenia 1988 MLT DEF MLT GPG/NATAzerbaijan 1988 SIN ANC SIN GPG/NATBahrain 1998 SIN MOD - -Cyprus 1999 <strong>2005</strong> MLT MOD SIN GPG
186<strong>Global</strong> <strong>Forest</strong> <strong>Resources</strong> <strong>Assessment</strong> <strong>2005</strong>TABLE 2Information status on area of forest, growing stock and biomassCountry/area Most recent data on forest area a <strong>Forest</strong> area <strong>Forest</strong> area Growing Biomasstime series b projection c stock time estimation dField survey/ Remote Expert series bmapping sensing estimateGeorgia 1995 MLT LEM MLT GPGIran (Islamic Republic of) 2000 1998 MLT MOD MLT GPG/NATIraq 1990 <strong>2005</strong> MLT MOD - -Israel 2003 1995 MLT LEM SIN -Jordan 1990 <strong>2005</strong> SIN ANC SIN GPGKazakhstan 2003 MLT LEM MLT GPGKuwait 1996 <strong>2005</strong> SIN MOD - -Kyrgyzstan 2003 MLT LEM MLT GPGLebanon 2004 2004 MLT MOD SIN GPGOccupied Palestinian Territory <strong>2005</strong> MLT ANC - -Oman 1990 SIN ANC - -Qatar 1997 SIN MOD - -Saudi Arabia 1996 SIN ANC SIN GPGSyrian Arab Republic 1992 EXP LEM - -Tajikistan 1997 MLT ANC MLT GPGTurkey 1999 MLT LEM MLT GPGTurkmenistan 1988 SIN ANC MLT GPGUnited Arab Emirates 2003 MLT LEM SIN GPG/BWNUzbekistan 2004 MLT MOD MLT GPGYemen 1993 1993 SIN ANC SIN GPGWestern and Central AsiaAlbania 2003 MLT REG MLT GPGAndorra 1990 <strong>2005</strong> SIN ANC - -Austria 2001 MLT MOD MLT GPG/NATBelarus 2000 MLT MOD MLT GPGBelgium 1999 MLT LEM MLT GPG/NAT/EXPBosnia and Herzegovina 2000 MLT MOD MLT GPG/EXPBulgaria 2004 MLT MOD MLT GPGChannel Islands <strong>2005</strong> SIN ANC - -Croatia 1996 MLT LEM MLT GPG/EXPCzech Republic 2003 MLT LEM MLT NATDenmark 2000 MLT MOD MLT GPGEstonia 2003 MLT LEM MLT GPGFaeroe Islands 2000 SIN ANC - -Finland 1999 MLT MOD MLT NATFrance 2003 MLT LEM MLT GPG/NATGermany 2002 MLT MOD MLT GPG/NATGibraltar - ANC - -Greece 1992 MLT LEM SIN ECEHoly See - ANC - -Hungary 2000 MLT MOD MLT GPGIceland 1991 MLT MOD MLT GPG/NATIreland 2002 MLT MOD MLT GPGIsle of Man 1991 SIN ANC - -Italy 2002 2001 MLT LEM MLT GPG/NATLatvia 1994 MLT LEM MLT GPGLiechtenstein <strong>2005</strong> MLT MOD SIN GPG
Annex 3: <strong>Global</strong> tables 187TABLE 2Information status on area of forest, growing stock and biomassCountry/area Most recent data on forest area a <strong>Forest</strong> area <strong>Forest</strong> area Growing Biomasstime series b projection c stock time estimation dField survey/ Remote Expert series bmapping sensing estimateLithuania 2003 MLT MOD MLT NATLuxembourg 2000 MLT ANC MLT NATMalta <strong>2005</strong> SIN ANC SIN GPGMonaco - ANC - -Netherlands 2000 MLT LEM MLT GPGNorway 2000 MLT LEM MLT NATPoland 2003 <strong>2005</strong> MLT LEM MLT GPGPortugal 1995 MLT LEM MLT ECERepublic of Moldova 1997 MLT DEF MLT GPGRomania 2003 MLT LEM SIN GPGRussian Federation 2003 2003 <strong>2005</strong> MLT LEM MLT NATSan Marino - ANC - -Serbia and Montenegro 1995 MLT LEM SIN GPGSlovakia 2003 MLT MOD MLT NATSlovenia 1990 SIN/EXP MOD MLT GPGSpain 1998 MLT LEM MLT GPGSweden 2002 MLT LEM MLT NATSwitzerland 1994 MLT LEM MLT GPGThe former Yugoslav Republicof Macedonia1990 SIN ANC SIN GPGUkraine 2002 MLT LEM MLT NATUnited Kingdom 1999 MLT/EXP MOD MLT ECEEuropeAnguilla 1982 SIN ANC - -Antigua and Barbuda 1980 SIN ANC - -Aruba 1986 SIN ANC - -Bahamas 1986 SIN ANC SIN -Barbados 1998 SIN ANC - -Bermuda <strong>2005</strong> SIN ANC - -British Virgin Islands 1991 MLT LEM - BWNCayman Islands 2000 SIN ANC - -Cuba 1990 MLT LEM MLT EXPDominica 2000 MLT LEM - -Dominican Republic 1998 SIN ANC SIN GPGGrenada 1991 MLT LEM - -Guadeloupe 1999 MLT LEM - -Haiti 1956 1988 MLT LEM SIN BWNJamaica 1989 1998 MLT LEM SIN GPG/BWNMartinique 1997 SIN ANC - -Montserrat 1982 SIN ANC - -Netherlands Antilles 1991 SIN ANC - -Puerto Rico 2000 MLT LEM SIN EXPSaint Kitts and Nevis 1992 MLT ANC - -Saint Lucia 1989 SIN ANC - -Saint Vincent and the Grenadines 1993 MLT LEM - -Trinidad and Tobago 1994 MLT LEM SIN GPGTurks and Caicos Islands 1983 SIN ANC - -
188<strong>Global</strong> <strong>Forest</strong> <strong>Resources</strong> <strong>Assessment</strong> <strong>2005</strong>TABLE 2Information status on area of forest, growing stock and biomassCountry/area Most recent data on forest area a <strong>Forest</strong> area <strong>Forest</strong> area Growing Biomasstime series b projection c stock time estimation dField survey/ Remote Expert series bmapping sensing estimateUnited States Virgin Islands 2000 MLT REG SIN NATCaribbeanBelize 2000 SIN ANC SIN GPGCosta Rica 2000 MLT LEM SIN GPG/NAT/EXPEl Salvador 2003 SIN DEF - -Guatemala 2003 2003 SIN DEF SIN GPGHonduras 1990 MLT DEF MLT -Nicaragua 1998 MLT LEM SIN GPGPanama 2000 MLT LEM MLT GPGCentral AmericaCanada 2001 2001 SIN ANC SIN -Greenland <strong>2005</strong> SIN ANC - -Mexico 2002 MLT LEM - -Saint Pierre and Miquelon 2004 SIN ANC - -United States of America 2002 MLT LEM MLT NATNorth AmericaAmerican Samoa 2001 2001 MLT MOD SIN GPGAustralia 2002 2002 <strong>2005</strong> MLT MOD - -Cook Islands 1998 MLT MOD - -Fiji 2002 MLT MOD - -French Polynesia 2000 SIN ANC - -Guam 2002 SIN ANC SIN GPGKiribati 1996 SIN ANC - -Marshall Islands - ANC - -Micronesia (Federated States of) 1983 SIN ANC SIN GPGNauru 1996 ANC - -New Caledonia 1974 1999 SIN ANC SIN GPGNew Zealand 2002 MLT LEM - GPG/NATNiue 1994 MLT LEM - -Northern Mariana Islands 2002 MLT LEM - -Palau 2002 MLT LEM SIN GPGPapua New Guinea 1996 MLT LEM SIN -Pitcairn <strong>2005</strong> SIN ANC - -Samoa 2003 MLT LEM - -Solomon Islands 2003 MLT LEM - -Tokelau <strong>2005</strong> SIN ANC - -Tonga 1998 SIN ANC - -Tuvalu 1983 EXP ANC - -Vanuatu 1992 SIN ANC - -Wallis and Futuna Islands 2003 MLT LEM - -OceaniaArgentina 1998 1998 MLT LEM MLT GPGBolivia 2000 SIN DEF SIN GPGBrazil 2004 MLT DEF MLT NAT
Annex 3: <strong>Global</strong> tables 189TABLE 2Information status on area of forest, growing stock and biomassCountry/area Most recent data on forest area a <strong>Forest</strong> area <strong>Forest</strong> area Growing Biomasstime series b projection c stock time estimation dField survey/ Remote Expert series bmapping sensing estimateChile 2001 2001 MLT LEM MLT GPG/NATColombia 2001 MLT LEM - NATEcuador 2000 MLT LEM - -Falkland Islands <strong>2005</strong> SIN ANC - -French Guiana 2000 MLT LEM SIN -Guyana 1999 SIN ANC - EXPParaguay 2002 SIN DEF - -Peru 2000 MLT LEM - -South Georgia andthe South Sandwich IslandsSIN ANC - -Suriname 1998 SIN ANC SIN GPG/NATUruguay 1999 MLT LEM SIN -Venezuela (Bolivarian Republic of) 1995 MLT LEM - -South AmericaaWhere data were collected over a range of years, the midpoint year is given.bSIN: reported figures based on data for one point in time; MLT: reported figures based on data for two or more points in time; EXP: reportedfigures based on expert estimates.cANC: assumed no change between two or more reference years; DEF: separate studies on deforestation or forest area changes used forestimation and forecasting; LEM: linear interpolation or extrapolation; MOD: model-based method of estimation between two or more points bymaking assumptions to modify linear trends (use of plantation area, regeneration area, land-use matrix or assuming no change, etc.).dNAT: national factors developed by research; GPG: factors from IPCC (2003); BWN: expansion factors from <strong>FAO</strong> (1997a); ECE: estimates and factorsfrom UNECE & <strong>FAO</strong> (2000); EXP: expert estimates.
190<strong>Global</strong> <strong>Forest</strong> <strong>Resources</strong> <strong>Assessment</strong> <strong>2005</strong>TABLE 3Extent of forest and other wooded land <strong>2005</strong>Country/area Land area Inland water Total area(1 000 ha) (1 000 ha)<strong>Forest</strong> Other wooded land Other land(1 000 ha) (1 000 ha)1 000 ha % of land Total With treeareacoverAngola 59 104 47.4 - 65 566 - 0 124 670Botswana 11 943 21.1 34 791 9 939 - 1 500 58 173British Indian Ocean Territory 3 32.5 0 5 - 0 8Comoros 5 2.9 - 180 - n.s. 186Kenya 3 522 6.2 34 920 18 472 10 320 1 123 58 037Lesotho 8 0.3 31 2 996 - - 3 035Madagascar 12 838 22.1 17 054 28 262 - 550 58 704Malawi 3 402 36.2 - 6 006 7 2 440 11 848Mauritius 37 18.2 15 151 - 1 204Mayotte 5 14.7 - 32 - 0 37Mozambique 19 262 24.6 40 919 18 228 - 1 750 80 159Namibia 7 661 9.3 8 473 66 195 - 100 82 429Réunion 84 33.6 55 111 18 1 251Seychelles 40 88.9 - 5 - 0 45South Africa 9 203 7.6 21 409 90 835 - 462 121 909Swaziland 541 31.5 289 890 - 16 1 736Uganda 3 627 18.4 1 150 14 933 - 4 394 24 104United Republic of Tanzania 35 257 39.9 4 756 48 346 - 6 150 94 509Zambia 42 452 57.1 3 161 28 726 - 922 75 261Zimbabwe 17 540 45.3 - 21 145 - 390 39 075Total Eastern and Southern Africa 226 534 27.8 167 023 421 024 10 345 19 799 834 380Algeria 2 277 1.0 1 595 234 302 - - 238 174Burkina Faso 6 794 29.0 7 427 9 178 - 4 000 27 400Chad 11 921 9.5 9 152 104 847 - 2 480 128 400Djibouti 6 0.2 220 2 092 - 2 2 320Egypt 67 0.1 20 99 458 - 600 100 145Eritrea 1 554 15.4 7 257 1 289 - 1 660 11 760Ethiopia 13 000 11.9 44 650 51 981 - 799 110 430Libyan Arab Jamahiriya 217 0.1 330 175 407 - 0 175 954Mali 12 572 10.3 16 532 92 916 - 2 000 124 019Mauritania 267 0.3 3 110 99 145 - 30 102 552Morocco 4 364 9.8 406 39 860 - 25 44 655Niger 1 266 1.0 3 740 121 664 8 000 30 126 700Somalia 7 131 11.4 - 55 603 - 1 032 63 766Sudan 67 546 28.4 - 170 054 - 12 981 250 581Tunisia 1 056 6.8 170 14 310 2 207 825 16 361Western Sahara 1 011 3.8 - 25 589 - - 26 600Total Northern Africa 131 048 8.6 94 609 1 297 696 10 207 26 464 1 549 817Benin 2 351 21.3 3 959 4 752 - 200 11 262Burundi 152 5.9 722 1 694 - 215 2 783Cameroon 21 245 45.6 14 758 10 537 - 1 004 47 544Cape Verde 84 20.7 - 319 - 0 403Central African Republic 22 755 36.5 10 122 29 421 - - 62 298Congo 22 471 65.8 10 547 1 132 - 50 34 200
Annex 3: <strong>Global</strong> tables 191TABLE 3Extent of forest and other wooded land <strong>2005</strong>Country/area Land area Inland water Total area(1 000 ha) (1 000 ha)<strong>Forest</strong> Other wooded land Other land(1 000 ha) (1 000 ha)1 000 ha % of land Total With treeareacoverCôte d’Ivoire 10 405 32.7 2 626 18 769 379 446 32 246Democratic Republic of the Congo 133 610 58.9 83 277 9 819 - 7 781 234 486Equatorial Guinea 1 632 58.2 31 1 142 - 0 2 805Gabon 21 775 84.5 - 3 992 - 1 000 26 767Gambia 471 41.7 125 534 - 0 1 130Ghana 5 517 24.2 0 17 237 - 1 100 23 854Guinea 6 724 27.4 5 850 11 998 - 14 24 586Guinea-Bissau 2 072 73.7 236 505 - 800 3 612Liberia 3 154 32.7 0 6 478 179 1 505 11 137Nigeria 11 089 12.2 5 495 74 493 220 1 300 92 377Rwanda 480 19.5 61 1 926 - 167 2 634Saint Helena 2 6.5 0 29 - 0 31Sao Tome and Principe 27 28.4 29 40 10 0 96Senegal 8 673 45.0 5 001 5 579 - 419 19 672Sierra Leone 2 754 38.5 384 4 024 - 12 7 174Togo 386 7.1 1 246 3 807 - 240 5 679Total Western and Central Africa 277 829 44.1 144 468 208 227 788 16 253 646 776Total Africa 635 412 21.4 406 100 1 926 946 21 339 62 516 3 030 974China 197 290 21.2 87 615 647 837 - 27 063 959 805Democratic People’sRepublic of Korea6 187 51.4 - 5 854 - 13 12 054Japan 24 868 68.2 - 11 582 - 1 330 37 780Mongolia 10 252 6.5 2 388 144 010 - 0 156 650Republic of Korea 6 265 63.5 - 3 608 - 53 9 926Total East Asia 244 862 21.3 90 003 812 891 - 28 459 1 176 215Bangladesh 871 6.7 58 12 087 343 1 383 14 400Bhutan 3 195 68.0 611 894 - 0 4 700Brunei Darussalam 278 52.8 160 89 - 50 577Cambodia 10 447 59.2 270 6 935 - 452 18 104India 67 701 22.8 4 110 225 508 815 31 407 328 726Indonesia 88 495 48.8 - 92 662 9 648 9 300 190 457Lao People’s Democratic Republic 16 142 69.9 4 643 2 295 - 600 23 680Malaysia 20 890 63.6 - 11 965 - 120 32 975Maldives 1 3.0 0 29 - 0 30Myanmar 32 222 49.0 10 834 22 699 - 1 903 67 658Nepal 3 636 25.4 1 897 8 767 - 418 14 718Pakistan 1 902 2.5 1 389 73 797 - 2 522 79 610Philippines 7 162 24.0 3 611 19 044 - 183 30 000Singapore 2 3.4 0 65 0 1 68Sri Lanka 1 933 29.9 0 4 530 - 98 6 561Thailand 14 520 28.4 - 36 569 - 223 51 312Timor-Leste 798 53.7 - 689 - - 1 487Viet Nam 12 931 39.7 2 259 17 359 - 620 33 169Total South and Southeast Asia 283 127 33.4 29 842 535 983 10 806 49 280 898 232
192<strong>Global</strong> <strong>Forest</strong> <strong>Resources</strong> <strong>Assessment</strong> <strong>2005</strong>TABLE 3Extent of forest and other wooded land <strong>2005</strong>Country/area Land area Inland water Total area(1 000 ha) (1 000 ha)<strong>Forest</strong> Other wooded land Other land(1 000 ha) (1 000 ha)1 000 ha % of land Total With treeareacoverAfghanistan 867 1.3 - 64 342 - 0 65 209Armenia 283 10.0 45 2 492 7 160 2 980Azerbaijan 936 11.3 54 7 270 - 400 8 660Bahrain n.s. 0.6 0 71 - 0 71Cyprus 174 18.9 214 536 26 1 925Georgia 2 760 39.7 50 4 139 - 21 6 970Iran (Islamic Republic of) 11 075 6.8 5 340 147 205 83 1 200 164 820Iraq 822 1.9 927 41 988 70 95 43 832Israel 171 8.3 85 1 806 - 44 2 106Jordan 83 0.9 52 8 758 222 28 8 921Kazakhstan 3 337 1.2 15 622 251 011 3 2 520 272 490Kuwait 6 0.3 0 1 776 - 0 1 782Kyrgyzstan 869 4.5 313 17 998 - 810 19 990Lebanon 136 13.3 106 780 114 17 1 040Occupied Palestinian Territory 9 1.5 - 593 - 19 621Oman 2 n.s. 1 303 19 941 50 0 21 246Qatar n.s. n.s. n.s. 1 100 - 0 1 100Saudi Arabia 2 728 1.3 34 155 178 086 0 0 214 969Syrian Arab Republic 461 2.5 35 17 882 231 140 18 518Tajikistan 410 2.9 142 13 444 102 259 14 255Turkey 10 175 13.2 10 689 56 099 - 519 77 482Turkmenistan 4 127 8.8 0 42 866 - 1 817 48 810United Arab Emirates 312 3.7 4 8 044 195 0 8 360Uzbekistan 3 295 8.0 904 37 225 - 3 316 44 740Yemen 549 1.0 1 406 50 842 42 0 52 797Total Western and Central Asia 43 588 4.0 71 446 976 294 1 145 11 366 1 102 694Total Asia 571 577 18.5 191 291 2 325 168 11 951 89 105 3 177 141Albania 794 29.0 261 1 685 - 135 2 875Andorra 16 35.6 - 29 - 0 45Austria 3 862 46.7 118 4 293 - 113 8 386Belarus 7 894 38.0 914 11 940 - 12 20 760Belgium 667 22.0 27 2 334 - 25 3 053Bosnia and Herzegovina 2 185 43.1 549 2 339 - 47 5 120Bulgaria 3 625 32.8 27 7 411 - 36 11 099Channel Islands 1 4.1 0 18 0 n.s. 19Croatia 2 135 38.2 346 3 111 - 62 5 654Czech Republic 2 648 34.3 0 5 080 96 159 7 887Denmark 500 11.8 136 3 607 - 66 4 309Estonia 2 284 53.9 82 1 873 - 284 4 523Faeroe Islands n.s. 0.1 - 140 - 0 140Finland 22 500 73.9 802 7 145 177 3 367 33 814France 15 554 28.3 1 708 37 748 269 140 55 150Germany 11 076 31.7 - 23 819 - 808 35 703Gibraltar 0 0 0 1 0 0 1Greece 3 752 29.1 2 780 6 358 - 306 13 196
Annex 3: <strong>Global</strong> tables 193Holy See 0 0 0 n.s. - 0 n.s.Hungary 1 976 21.5 0 7 235 95 92 9 303Iceland 46 0.5 104 9 875 8 275 10 300Ireland 669 9.7 41 6 179 - 138 7 027Isle of Man 3 6.1 0 54 0 n.s. 57Italy 9 979 33.9 1 047 18 385 - 723 30 134Latvia 2 941 47.4 115 3 149 29 255 6 460Liechtenstein 7 43.1 0 9 - 0 16Lithuania 2 099 33.5 77 4 092 62 262 6 530Luxembourg 87 33.5 1 170 - 0 259Malta n.s. 1.1 0 32 - 0 32Monaco 0 0 0 n.s. n.s. 0 n.s.Netherlands 365 10.8 0 3 023 0 765 4 153Norway 9 387 30.7 2 613 18 625 - 1 751 32 376Poland 9 192 30.0 - 21 437 - 640 31 269Portugal 3 783 41.3 84 5 283 - 48 9 198Republic of Moldova 329 10.0 31 2 928 - 96 3 384Romania 6 370 27.7 258 16 359 - 852 23 839Russian Federation 808 790 47.9 74 185 805 875 4 698 18 690 1 707 540San Marino n.s. 1.6 0 6 - 0 6Serbia and Montenegro 2 694 26.4 808 6 698 269 17 10 217Slovakia 1 929 40.1 - 2 879 32 93 4 901Slovenia 1 264 62.8 44 706 24 13 2 027Spain 17 915 35.9 10 299 21 730 - 655 50 599Sweden 27 528 66.9 3 257 10 377 1 353 3 834 44 996Switzerland 1 221 30.9 67 2 667 - 174 4 129The former Yugoslav Republicof MacedoniaTABLE 3Extent of forest and other wooded land <strong>2005</strong>Country/area Land area Inland water Total area(1 000 ha) (1 000 ha)<strong>Forest</strong> Other wooded land Other land(1 000 ha) (1 000 ha)1 000 ha % of land Total With treeareacover906 35.8 82 1 543 - 40 2 571Ukraine 9 575 16.5 41 48 319 907 2 435 60 370United Kingdom 2 845 11.8 20 21 223 24 203 24 291Total Europe 1 001 394 44.3 100 925 1 157 788 8 044 37 611 2 297 719Anguilla 6 71.4 - 2 - - 8Antigua and Barbuda 9 21.4 16 19 - 0 44Aruba n.s. 2.2 0 19 - 0 19Bahamas 515 51.5 36 450 - 387 1 388Barbados 2 4.0 - 41 - 0 43Bermuda 1 20.0 0 4 0 0 5British Virgin Islands 4 24.4 2 10 - 0 15Cayman Islands 12 48.4 4 10 - n.s. 26Cuba 2 713 24.7 260 8 009 257 104 11 086Dominica 46 61.3 n.s. 29 - 0 75Dominican Republic 1 376 28.4 678 2 784 - 35 4 873Grenada 4 12.2 5 25 - 0 34Guadeloupe 80 47.2 2 87 - 2 171Haiti 105 3.8 - 2 651 - 19 2 775Jamaica 339 31.3 188 556 82 16 1 099
194<strong>Global</strong> <strong>Forest</strong> <strong>Resources</strong> <strong>Assessment</strong> <strong>2005</strong>TABLE 3Extent of forest and other wooded land <strong>2005</strong>Country/area Land area Inland water Total area(1 000 ha) (1 000 ha)<strong>Forest</strong> Other wooded land Other land(1 000 ha) (1 000 ha)1 000 ha % of land Total With treeareacoverMartinique 46 43.9 - 60 - 4 110Montserrat 4 35.0 - 6 - 0 10Netherlands Antilles 1 1.5 33 46 - 0 80Puerto Rico 408 46.0 - 479 - 8 895Saint Kitts and Nevis 5 14.7 6 25 - 0 36Saint Lucia 17 27.9 5 39 - 1 62Saint Vincent and the Grenadines 11 27.4 2 26 - 0 39Trinidad and Tobago 226 44.1 74 213 - 0 513Turks and Caicos Islands 34 80.0 - 9 - 0 43United States Virgin Islands 10 27.9 - 24 - 0 34Total Caribbean 5 974 26.1 1 310 15 622 339 576 23 482Belize 1 653 72.5 115 512 - 16 2 296Costa Rica 2 391 46.8 10 2 705 - 4 5 110El Salvador 298 14.4 201 1 573 167 32 2 104Guatemala 3 938 36.3 1 672 5 233 139 46 10 889Honduras 4 648 41.5 710 5 831 - 20 11 209Nicaragua 5 189 42.7 1 022 5 929 - 860 13 000Panama 4 294 57.7 1 288 1 861 143 109 7 552Total Central America 22 411 43.9 5 018 23 644 449 1 087 52 160Canada 310 134 33.6 91 951 520 012 - 74 964 997 061Greenland n.s. n.s. 8 41 037 - 0 41 045Mexico 64 238 33.7 19 908 106 723 - 4 951 195 820Saint Pierre and Miquelon 3 13.0 - 20 - 1 24United States of America 303 089 33.1 - 612 807 32 899 47 013 962 909Total North America 677 464 32.7 111 866 1 280 599 32 899 126 929 2 196 859Total North and Central America 705 849 32.9 118 194 1 319 865 33 687 128 592 2 272 501American Samoa 18 89.4 - 2 - 0 20Australia 163 678 21.3 421 590 a 182 962 - 5 892 774 122Cook Islands 16 66.5 - 8 - 0 23Fiji 1 000 54.7 - 827 59 0 1 827French Polynesia 105 28.7 - 261 - 34 400Guam 26 47.1 0 29 - 0 55Kiribati 2 30.0 - 71 17 0 73Marshall Islands - - - 18 - 0 18Micronesia (Federated States of) 63 90.6 - 7 - 0 70Nauru 0 0 0 2 - 0 2New Caledonia 717 39.2 787 324 - 30 1 858New Zealand 8 309 31.0 2 557 15 933 - 254 27 053Niue 14 54.2 - 12 - 0 26Northern Mariana Islands 33 72.4 - 13 - 0 46Palau 40 87.6 - 6 - 0 46Papua New Guinea 29 437 65.0 4 474 11 375 - 998 46 284Pitcairn 4 83.3 0 n.s. 0 0 4
Annex 3: <strong>Global</strong> tables 195TABLE 3Extent of forest and other wooded land <strong>2005</strong>Country/area Land area Inland water Total area(1 000 ha) (1 000 ha)<strong>Forest</strong> Other wooded land Other land(1 000 ha) (1 000 ha)1 000 ha % of land Total With treeareacoverSamoa 171 60.4 22 90 63 1 284Solomon Islands 2 172 77.6 - 627 - 91 2 890Tokelau 0 0 0 1 - 0 1Tonga 4 5.0 1 68 - 3 75Tuvalu 1 33.3 0 2 - 0 3Vanuatu 440 36.1 476 304 - 0 1 219Wallis and Futuna Islands 5 35.3 1 8 5 n.s. 14Total Oceania 206 254 24.3 429 908 212 948 145 7 303 856 414Argentina 33 021 12.1 60 961 179 687 - 4 371 278 040Bolivia 58 740 54.2 2 473 47 225 - 1 420 109 858Brazil 477 698 57.2 - 357 858 - 15 932 851 488Chile 16 121 21.5 13 241 45 518 - 783 75 663Colombia 60 728 58.5 18 202 24 940 - 10 021 113 891Ecuador 10 853 39.2 1 448 15 382 - 672 28 356Falkland Islands 0 0 0 1 217 0 0 1 217French Guiana 8 063 91.8 0 724 0 213 9 000Guyana 15 104 76.7 3 580 1 002 - 1 812 21 497Paraguay 18 475 46.5 - 21 255 - 945 40 675Peru 68 742 53.7 22 132 37 126 600 522 128 522South Georgia andthe South Sandwich Islands0 0 0 409 - 0 409Suriname 14 776 94.7 - 824 - 727 16 327Uruguay 1 506 8.6 4 15 992 13 120 17 622Venezuela (Bolivarian Republic of) 47 713 54.1 7 369 33 123 - 3 000 91 205Total South America 831 540 47.7 129 410 782 282 613 40 538 1 783 770WORLD 3 952 025 30.3 1 375 829 7 724 961 75 779 365 666 13 418 518a<strong>FAO</strong> estimate based on the assumption that the area of other wooded land has been constant since 2000.
196<strong>Global</strong> <strong>Forest</strong> <strong>Resources</strong> <strong>Assessment</strong> <strong>2005</strong>TABLE 4Change in extent of forest and other wooded land 1990–<strong>2005</strong>Country/area <strong>Forest</strong> Other wooded landArea Annual change rate Area(1 000 ha) (1 000 ha)1990 2000 <strong>2005</strong> 1990–2000 2000–<strong>2005</strong> 1990 2000 <strong>2005</strong>1 000 ha/year % a 1 000 ha/year % aAngola 60 976 59 728 59 104 -125 -0.2 -125 -0.2 - - -Botswana 13 718 12 535 11 943 -118.0 -0.9 -118 -1.0 34 791 34 791 34 791British Indian Ocean Territory 3 3 3 0 0 0 0 0 0 0Comoros 12 8 5 n.s. -4.0 -1 -7.4 - - -Kenya 3 708 3 582 3 522 -13 -0.3 -12 -0.3 35 530 35 120 34 920Lesotho 5 7 8 n.s. 3.4 n.s. 2.7 103 55 31Madagascar 13 692 13 023 12 838 -67 -0.5 -37 -0.3 21 148 18 453 17 054Malawi 3 896 3 567 3 402 -33 -0.9 -33 -0.9 - - -Mauritius 39 38 37 n.s. -0.3 n.s. -0.5 18 17 15Mayotte 6 6 5 n.s. -0.4 n.s. -0.4 - - -Mozambique 20 012 19 512 19 262 -50 -0.3 -50 -0.3 42 419 41 419 40 919Namibia 8 762 8 033 7 661 -73 -0.9 -74 -0.9 9 023 8 656 8 473Réunion 87 87 84 n.s. -0.1 -1 -0.7 57 54 55Seychelles 40 40 40 0 0 0 0 - - -South Africa 9 203 9 203 9 203 0 0 0 0 21 409 21 409 21 409Swaziland 472 518 541 5 0.9 5 0.9 152 276 289Uganda 4 924 4 059 3 627 -86 -1.9 -86 -2.2 1 404 1 235 1 150United Republic of Tanzania 41 441 37 318 35 257 -412 -1.0 -412 -1.1 22 374 10 629 4 756Zambia 49 124 44 676 42 452 -445 -0.9 -445 -1.0 4 081 3 468 3 161Zimbabwe 22 234 19 105 17 540 -313 -1.5 -313 -1.7 5 437 - -Total Eastern and Southern Africa 252 354 235 047 226 534 -1 731 -0.7 -1 702 -0.7Algeria 1 790 2 144 2 277 35 1.8 27 1.2 1 840 1 662 1 595Burkina Faso 7 154 6 914 6 794 -24 -0.3 -24 -0.3 7 427 7 427 7 427Chad 13 110 12 317 11 921 -79 -0.6 -79 -0.7 10 070 9 458 9 152Djibouti 6 6 6 0 0 0 0 220 220 220Egypt 44 59 67 2 3.0 2 2.6 20 20 20Eritrea 1 621 1 576 1 554 -4 -0.3 -4 -0.3 7 569 7 361 7 257Ethiopia 15 114 13 705 13 000 -141 -1.0 -141 -1.1 44 650 44 650 44 650Libyan Arab Jamahiriya 217 217 217 0 0 0 0 330 330 330Mali 14 072 13 072 12 572 -100 -0.7 -100 -0.8 16 532 16 532 16 532Mauritania 415 317 267 -10 -2.7 -10 -3.4 3 110 3 110 3 110Morocco 4 289 4 328 4 364 4 0.1 7 0.2 407 407 406Niger 1 945 1 328 1 266 -62 -3.7 -12 -1.0 4 640 4 040 3 740Somalia 8 282 7 515 7 131 -77 -1.0 -77 -1.0 - - -Sudan 76 381 70 491 67 546 -589 -0.8 -589 -0.8 - 54 153 -Tunisia 643 959 1 056 32 4.1 19 1.9 328 177 170Western Sahara 1 011 1 011 1 011 0 0 0 0 - - -Total Northern Africa 146 093 135 958 131 048 -1 013 -0.7 -982 -0.7Benin 3 322 2 675 2 351 -65 -2.1 -65 -2.5 3 590 3 836 3 959Burundi 289 198 152 -9 -3.7 -9 -5.2 722 722 722Cameroon 24 545 22 345 21 245 -220 -0.9 -220 -1.0 14 758 14 758 14 758Cape Verde 58 82 84 2 3.6 n.s. 0.4 - - -Central African Republic 23 203 22 903 22 755 -30 -0.1 -30 -0.1 10 122 10 122 10 122Congo 22 726 22 556 22 471 -17 -0.1 -17 -0.1 10 649 10 581 10 547
Annex 3: <strong>Global</strong> tables 197TABLE 4Change in extent of forest and other wooded land 1990–<strong>2005</strong>Country/area <strong>Forest</strong> Other wooded landArea Annual change rate Area(1 000 ha) (1 000 ha)1990 2000 <strong>2005</strong> 1990–2000 2000–<strong>2005</strong> 1990 2000 <strong>2005</strong>1 000 ha/year % a 1 000 ha/year % aCôte d’Ivoire 10 222 10 328 10 405 11 0.1 15 0.1 2 675 2 662 2 626Democratic Republic of the Congo 140 531 135 207 133 610 -532 -0.4 -319 -0.2 83 277 83 277 83 277Equatorial Guinea 1 860 1 708 1 632 -15 -0.8 -15 -0.9 5 22 31Gabon 21 927 21 826 21 775 -10 n.s. -10 n.s. - - -Gambia 442 461 471 2 0.4 2 0.4 170 140 125Ghana 7 448 6 094 5 517 -135 -2.0 -115 -2.0 0 0 0Guinea 7 408 6 904 6 724 -50 -0.7 -36 -0.5 5 850 5 850 5 850Guinea-Bissau 2 216 2 120 2 072 -10 -0.4 -10 -0.5 293 241 236Liberia 4 058 3 455 3 154 -60 -1.6 -60 -1.8 0 0 0Nigeria 17 234 13 137 11 089 -410 -2.7 -410 -3.3 9 717 6 902 5 495Rwanda 318 344 480 3 0.8 27 6.9 175 61 61Saint Helena 2 2 2 0 0 0 0 0 0 0Sao Tome and Principe 27 27 27 0 0 0 0 29 29 29Senegal 9 348 8 898 8 673 -45 -0.5 -45 -0.5 5 301 5 101 5 001Sierra Leone 3 044 2 851 2 754 -19 -0.7 -19 -0.7 765 511 384Togo 685 486 386 -20 -3.4 -20 -4.5 1 246 1 246 1 246Total Western and Central Africa 300 914 284 608 277 829 -1 631 -0.6 -1 356 -0.5Total Africa 699 361 655 613 635 412 -4 375 -0.64 -4 040 -0.62China 157 141 177 001 197 290 1 986 1.2 4 058 2.2 101 498 97 683 87 615Democratic People’sRepublic of Korea8 201 6 821 6 187 -138 -1.8 -127 -1.9 - - -Japan 24 950 24 876 24 868 -7 n.s. -2 n.s. - - -Mongolia 11 492 10 665 10 252 -83 -0.7 -83 -0.8 6 264 3 034 2 388Republic of Korea 6 371 6 300 6 265 -7 -0.1 -7 -0.1 - - -Total East Asia 208 155 225 663 244 862 1 751 0.8 3 840 1.6Bangladesh 882 884 871 n.s. n.s. -2 -0.3 44 53 58Bhutan 3 035 3 141 3 195 11 0.3 11 0.3 566 609 611Brunei Darussalam 313 288 278 -2 -0.8 -2 -0.7 142 155 160Cambodia 12 946 11 541 10 447 -140 -1.1 -219 -2.0 335 298 270India 63 939 67 554 67 701 362 0.6 29 n.s. 5 894 4 732 4 110Indonesia 116 567 97 852 88 495 -1 872 -1.7 -1 871 -2.0 - - -Lao People’s Democratic Republic 17 314 16 532 16 142 -78 -0.5 -78 -0.5 2 875 4 053 4 643Malaysia 22 376 21 591 20 890 -78 -0.4 -140 -0.7 - - -Maldives 1 1 1 0 0 0 0 0 0 0Myanmar 39 219 34 554 32 222 -466 -1.3 -466 -1.4 10 219 10 629 10 834Nepal 4 817 3 900 3 636 -92 -2.1 -53 -1.4 1 180 1 753 1 897Pakistan 2 527 2 116 1 902 -41 -1.8 -43 -2.1 1 191 1 323 1 389Philippines 10 574 7 949 7 162 -262 -2.8 -157 -2.1 2 230 3 292 3 611Singapore 2 2 2 0 0 0 0 0 0 0Sri Lanka 2 350 2 082 1 933 -27 -1.2 -30 -1.5 0 0 0Thailand 15 965 14 814 14 520 -115 -0.7 -59 -0.4 - - -Timor-Leste 966 854 798 -11 -1.2 -11 -1.3 - - -Viet Nam 9 363 11 725 12 931 236 2.3 241 2.0 0 1 816 2 259Total South and Southeast Asia 323 156 297 380 283 127 -2 578 -0.8 -2 851 -1.0
198<strong>Global</strong> <strong>Forest</strong> <strong>Resources</strong> <strong>Assessment</strong> <strong>2005</strong>TABLE 4Change in extent of forest and other wooded land 1990–<strong>2005</strong>Country/area <strong>Forest</strong> Other wooded landArea Annual change rate Area(1 000 ha) (1 000 ha)1990 2000 <strong>2005</strong> 1990–2000 2000–<strong>2005</strong> 1990 2000 <strong>2005</strong>1 000 ha/year % a 1 000 ha/year % aAfghanistan 1 309 1 015 867 -29 -2.5 -30 -3.1 - - -Armenia 346 305 283 -4 -1.3 -4 -1.5 45 45 45Azerbaijan 936 936 936 0 0 0 0 54 54 54Bahrain n.s. n.s. n.s. n.s. 5.6 n.s. 3.8 0 0 0Cyprus 161 173 174 1 0.7 n.s. 0.2 - 214 214Georgia 2 760 2 760 2 760 n.s. n.s. n.s. n.s. 53 51 50Iran (Islamic Republic of) 11 075 11 075 11 075 0 0 0 0 5 340 5 340 5 340Iraq 804 818 822 1 0.2 1 0.1 1 245 1 033 927Israel 154 164 171 1 0.6 1 0.8 16 62 85Jordan 83 83 83 0 0 0 0 55 54 52Kazakhstan 3 422 3 365 3 337 -6 -0.2 -6 -0.2 13 049 14 765 15 622Kuwait 3 5 6 n.s. 3.5 n.s. 2.7 0 0 0Kyrgyzstan 836 858 869 2 0.3 2 0.3 283 303 313Lebanon 121 b 131 136 1 0.8 1 0.8 - 117 106b Occupied Palestinian Territory 99 9 0 0 0 0 - - -Oman 2 2 2 0 0 0 0 1 303 1 303 1 303Qatar n.s. n.s. n.s. 0 0 0 0 n.s. n.s. n.s.Saudi Arabia 2 728 2 728 2 728 0 0 0 0 34 155 34 155 34 155Syrian Arab Republic 372 432 461 6 1.5 6 1.3 35 35 35Tajikistan 408 410 410 n.s. n.s. 0 0 142 142 142Turkey 9 680 10 052 10 175 37 0.4 25 0.2 10 905 10 728 10 689Turkmenistan 4 127 4 127 4 127 0 0 0 0 0 0 0United Arab Emirates 245 310 312 6 2.4 n.s. 0.1 4 4 4Uzbekistan 3 045 3 212 3 295 17 0.5 17 0.5 - - 904Yemen 549 549 549 0 0 0 0 1 406 1 406 1 406Total Western and Central Asia 43 176 43 519 43 588 34 0.1 14 n.s.Total Asia 574 487 566 562 571 577 -792 -0.14 1 003 0.18Albania 789 769 794 -2 -0.3 5 0.6 256 255 261Andorra 16 16 16 0 0 0 0 - - -Austria 3 776 3 838 3 862 6 0.2 5 0.1 118 117 118Belarus 7 376 7 848 7 894 47 0.6 9 0.1 895 915 914Belgium 677 667 667 -1 -0.1 0 0 21 27 27Bosnia and Herzegovina 2 210 2 185 2 185 -2 -0.1 0 0 500 549 549Bulgaria 3 327 3 375 3 625 5 0.1 50 1.4 130 105 27Channel Islands 1 1 1 0 0 0 0 0 0 0Croatia 2 116 2 129 2 135 1 0.1 1 0.1 322 338 346Czech Republic 2 630 2 637 2 648 1 n.s. 2 0.1 0 0 0Denmark 445 486 500 4 0.9 3 0.6 136 136 136Estonia 2 163 2 243 2 284 8 0.4 8 0.4 - 94 82Faeroe Islands n.s. n.s. n.s. 0 0 0 0 - - -Finland 22 194 22 475 22 500 28 0.1 5 n.s. 923 830 802France 14 538 15 351 15 554 81 0.5 41 0.3 2 087 1 814 1 708Germany 10 741 11 076 11 076 34 0.3 0 0 - - -Gibraltar 0 0 0 0 0 0 0 0 0 0Greece 3 299 3 601 3 752 30 0.9 30 0.8 3 212 2 924 2 780
Annex 3: <strong>Global</strong> tables 199Holy See 0 0 0 0 0 0 0 0 0 0Hungary 1 801 1 907 1 976 11 0.6 14 0.7 0 0 0Iceland 25 38 46 1 4.3 2 3.9 104 104 104Ireland 441 609 669 17 3.3 12 1.9 40 41 41Isle of Man 3 3 3 0 0 0 0 0 0 0Italy 8 383 9 447 9 979 106 1.2 106 1.1 880 992 1 047Latvia 2 775 2 885 2 941 11 0.4 11 0.4 112 120 115Liechtenstein 6 7 7 n.s. 0.6 0 0 0 0 0Lithuania 1 945 2 020 2 099 8 0.4 16 0.8 80 83 77Luxembourg 86 87 87 n.s. 0.1 0 0 3 1 1Malta n.s. n.s. n.s. 0 0 0 0 0 0 0Monaco 0 0 0 0 0 0 0 0 0 0Netherlands 345 360 365 2 0.4 1 0.3 0 0 0Norway 9 130 9 301 9 387 17 0.2 17 0.2 2 870 2 699 2 613Poland 8 881 9 059 9 192 18 0.2 27 0.3 - - -Portugal 3 099 3 583 3 783 48 1.5 40 1.1 236 84 84Republic of Moldova 319 326 329 1 0.2 1 0.2 31 31 31Romania 6 371 6 366 6 370 0 n.s. 1 n.s. 314 234 258Russian Federation 808 950 809 268 808 790 32 n.s. -96 n.s. 75 144 72 706 74 185San Marino n.s. n.s. n.s. 0 0 0 0 0 0 0Serbia and Montenegro 2 559 2 649 2 694 9 0.3 9 0.3 820 812 808Slovakia 1 922 1 921 1 929 n.s. n.s. 2 0.1 - - -Slovenia 1 188 1 239 1 264 5 0.4 5 0.4 44 44 44Spain 13 479 16 436 17 915 296 2.0 296 1.7 12 447 11 016 10 299Sweden 27 367 27 474 27 528 11 n.s. 11 n.s. 3 223 3 246 3 257Switzerland 1 155 1 199 1 221 4 0.4 4 0.4 59 64 67The former Yugoslav Republicof MacedoniaTABLE 4Change in extent of forest and other wooded land 1990–<strong>2005</strong>Country/area <strong>Forest</strong> Other wooded landArea Annual change rate Area(1 000 ha) (1 000 ha)1990 2000 <strong>2005</strong> 1990–2000 2000–<strong>2005</strong> 1990 2000 <strong>2005</strong>1 000 ha/year % a 1 000 ha/year % a906 906 906 0 0 0 0 82 82 82Ukraine 9 274 9 510 9 575 24 0.3 13 0.1 29 41 41United Kingdom 2 611 2 793 2 845 18 0.7 10 0.4 20 20 20Total Europe 989 320 998 091 1 001 394 877 0.09 661 0.07Anguilla 6 6 6 0 0 0 0 - - -Antigua and Barbuda 9 9 9 0 0 0 0 16 16 16Aruba n.s. n.s. n.s. 0 0 0 0 0 0 0Bahamas 515 515 515 0 0 0 0 36 36 36Barbados 2 2 2 0 0 0 0 - - -Bermuda 1 1 1 0 0 0 0 0 0 0British Virgin Islands 4 4 4 n.s. -0.1 n.s. -0.1 2 2 2Cayman Islands 12 12 12 0 0 0 0 4 4 4Cuba 2 058 2 435 2 713 38 1.7 56 2.2 254 264 260Dominica 50 47 46 n.s. -0.5 n.s. -0.6 n.s. n.s. n.s.Dominican Republic 1 376 1 376 1 376 0 0 0 0 678 678 678Grenada 4 4 4 n.s. n.s. 0 0 4 5 5Guadeloupe 84 81 80 n.s. -0.3 n.s. -0.3 2 2 2Haiti 116 109 105 -1 -0.6 -1 -0.7 - - -
200<strong>Global</strong> <strong>Forest</strong> <strong>Resources</strong> <strong>Assessment</strong> <strong>2005</strong>TABLE 4Change in extent of forest and other wooded land 1990–<strong>2005</strong>Country/area <strong>Forest</strong> Other wooded landArea Annual change rate Area(1 000 ha) (1 000 ha)1990 2000 <strong>2005</strong> 1990–2000 2000–<strong>2005</strong> 1990 2000 <strong>2005</strong>1 000 ha/year % a 1 000 ha/year % aJamaica 345 341 339 n.s. -0.1 n.s. -0.1 190 189 188Martinique 46 46 46 0 0 0 0 - - -Montserrat 4 4 4 0 0 0 0 - - -Netherlands Antilles 1 1 1 0 0 0 0 33 33 33Puerto Rico 404 407 408 n.s. 0.1 n.s. n.s. - - -Saint Kitts and Nevis 5 5 5 0 0 0 0 6 6 6Saint Lucia 17 17 17 0 0 0 0 5 5 5Saint Vincent and the Grenadines 9 10 11 n.s. 0.8 n.s. 0.8 3 2 2Trinidad and Tobago 235 228 226 -1 -0.3 n.s. -0.2 65 72 74Turks and Caicos Islands 34 34 34 0 0 0 0 - - -United States Virgin Islands 12 10 10 n.s. -1.3 n.s. -1.8 - - -Total Caribbean 5 350 5 706 5 974 36 0.6 54 0.9Belize 1 653 1 653 1 653 0 0 0 0 115 115 115Costa Rica 2 564 2 376 2 391 -19 -0.8 3 0.1 15 10 10El Salvador 375 324 298 -5 -1.5 -5 -1.7 201 201 201Guatemala 4 748 4 208 3 938 -54 -1.2 -54 -1.3 1 672 1 672 1 672Honduras 7 385 5 430 4 648 -196 -3.0 -156 -3.1 271 559 710Nicaragua 6 538 5 539 5 189 -100 -1.6 -70 -1.3 876 973 1 022Panama 4 376 4 307 4 294 -7 -0.2 -3 -0.1 851 1 143 1 288Total Central America 27 639 23 837 22 411 -380 -1.5 -285 -1.2Canada 310 134 310 134 310 134 0 0 0 0 91 951 91 951 91 951Greenland n.s. n.s. n.s. 0 0 0 0 8 8 8Mexico 69 016 65 540 64 238 -348 -0.5 -260 -0.4 20 705 20 174 19 908Saint Pierre and Miquelon 3 3 3 0 0 0 0 - - -United States of America 298 648 302 294 303 089 365 0.1 159 0.1 - - -Total North America 677 801 677 971 677 464 17 n.s. -101 n.s.Total North and Central America 710 790 707 514 705 849 -328 -0.05 -333 -0.05American Samoa 18 18 18 n.s. -0.2 n.s. -0.2 - - -Australia 167 904 164 645 163 678 -326 -0.2 -193 -0.1 - 421 590 421 590 cCook Islands 15 16 16 n.s. 0.4 0 0 - - -Fiji 979 1 000 1 000 2 0.2 0 0 - - -French Polynesia 105 105 105 0 0 0 0 - - -Guam 26 b 26 26 n.s. n.s. 0 0 - 0 0Kiribati 2 2 2 0 0 0 0 - - -Marshall Islands - - - - - - - - - -Micronesia (Federated States of) 63 63 63 0 0 0 0 - - -Nauru 0 0 0 0 0 0 0 0 0 0New Caledonia 717 717 717 0 0 0 0 787 787 787New Zealand 7 720 8 226 8 309 51 0.6 17 0.2 2 557 2 557 2 557Niue 17 15 14 n.s. -1.3 n.s. -1.4 - - -Northern Mariana Islands 35 34 33 n.s. -0.3 n.s. -0.3 - - -Palau 38 40 40 n.s. 0.4 n.s. 0.4 - - -Papua New Guinea 31 523 30 132 29 437 -139 -0.5 -139 -0.5 4 474 4 474 4 474
Annex 3: <strong>Global</strong> tables 201TABLE 4Change in extent of forest and other wooded land 1990–<strong>2005</strong>Country/area <strong>Forest</strong> Other wooded landArea Annual change rate Area(1 000 ha) (1 000 ha)1990 2000 <strong>2005</strong> 1990–2000 2000–<strong>2005</strong> 1990 2000 <strong>2005</strong>1 000 ha/year % a 1 000 ha/year % aPitcairn 4 4 4 0 0 0 0 0 0 0Samoa 130 171 171 4 2.8 0 0 - 22 22Solomon Islands 2 768 2 371 2 172 -40 -1.5 -40 -1.7 - - -Tokelau 0 0 0 0 0 0 0 0 0 0Tonga 4 4 4 0 0 0 0 1 1 1Tuvalu 1 1 1 0 0 0 0 0 0 0Vanuatu 440 440 440 0 0 0 0 476 476 476Wallis and Futuna Islands 6 5 5 n.s. -0.8 n.s. -2.0 2 1 1Total Oceania 212 514 208 034 206 254 -448 -0.21 -356 -0.17Argentina 35 262 33 770 33 021 -149 -0.4 -150 -0.4 60 280 60 734 60 961Bolivia 62 795 60 091 58 740 -270 -0.4 -270 -0.5 2 473 2 473 2 473Brazil 520 027 493 213 477 698 -2 681 -0.5 -3 103 -0.6 - - -Chile 15 263 15 834 16 121 57 0.4 57 0.4 16 065 13 806 13 241Colombia 61 439 60 963 60 728 -48 -0.1 -47 -0.1 18 219 18 158 18 202Ecuador 13 817 11 841 10 853 -198 -1.5 -198 -1.7 1 201 1 360 1 448Falkland Islands 0 0 0 0 0 0 0 0 0 0French Guiana 8 091 8 063 8 063 -3 n.s. 0 0 0 0 0Guyana 15 104 b 15 104 15 104 n.s. n.s. 0 0 - 3 580 3 580Paraguay 21 157 19 368 18 475 -179 -0.9 -179 -0.9 - - -Peru 70 156 69 213 68 742 -94 -0.1 -94 -0.1 - 22 132 22 132South Georgia andthe South Sandwich Islands0 0 0 0 0 0 0 0 0 0Suriname 14 776 14 776 14 776 0 0 0 0 - - -Uruguay 905 1 409 1 506 50 4.5 19 1.3 4 4 4Venezuela (Bolivarian Republic of) 52 026 49 151 47 713 -288 -0.6 -288 -0.6 7 526 7 421 7 369Total South America 890 818 852 796 831 540 -3 802 -0.44 -4 251 -0.50WORLD 4 077 291 3 988 610 3 952 025 -8 868 -0.22 -7 317 -0.18aRate of gain or loss in percent of the remaining forest area each year within the given period.b<strong>FAO</strong> estimates based on information provided by these countries for 2000 and <strong>2005</strong>.c<strong>FAO</strong> estimate based on the assumption that the area of other wooded land has been constant since 2000.
202<strong>Global</strong> <strong>Forest</strong> <strong>Resources</strong> <strong>Assessment</strong> <strong>2005</strong>TABLE 5Ownership of forest and other wooded land 2000Country/area <strong>Forest</strong> Other wooded landTotal area Public Private Other Total area Public Private Other(1 000 ha) (%) (%) (%) (1 000 ha) (%) (%) (%)Angola 59 728 100 0 0 - - - -Botswana 12 535 71.0 5.0 24.0 34 791 71.0 5.0 24.0British Indian Ocean Territory 3 - - - 0 - - -Comoros 8 100 0 0 - - - -Kenya 3 582 97.8 2.2 0 35 120 90.0 10.0 0Lesotho 7 100 0 0 55 100 0 0Madagascar 13 023 98.0 2.0 0 18 453 100 0 0Malawi 3 567 - - - - - - -Mauritius 38 52.6 47.4 0 17 11.8 88.2 0Mayotte 6 - - - - - - -Mozambique 19 512 100 - - 41 419 100 - -Namibia 8 033 - - - 8 656 - - -Réunion 87 78.7 21.3 - 54 35.6 64.4 -Seychelles 40 77.5 22.5 - - - - -South Africa 9 203 66.0 34.0 - 21 409 84.3 15.7 -Swaziland 518 - - - 276 - - -Uganda 4 059 29.8 70.2 - 1 235 20.8 79.2 -United Republic of Tanzania 37 318 99.8 0.2 - 10 629 100 - -Zambia 44 676 100 - - 3 468 - - 100Zimbabwe 19 105 - - - - - - -Total Eastern and Southern Africa 235 047 95.1 3.5 1.5 175 582 87.1 5.8 7.1Algeria 2 144 83.7 16.3 - 1 662 100 - -Burkina Faso 6 914 - - - 7 427 - - -Chad 12 317 100 0 0 9 458 100 0 0Djibouti 6 - - - 220 - - -Egypt 59 50.0 50.0 0 20 100 0 0Eritrea 1 576 - - - 7 361 - - -Ethiopia 13 705 100 0 0 44 650 100 0 0Libyan Arab Jamahiriya 217 83.9 16.1 0 330 100 0 0Mali 13 072 100 - - 16 532 100 - -Mauritania 317 97.5 2.5 0 3 110 - - -Morocco 4 328 96.8 0.5 2.7 407 100 0 0Niger 1 328 100 0 0 4 040 100 0 0Somalia 7 515 100 - - - - - -Sudan 70 491 97.7 2.3 - 54 153 97.7 2.3 -Tunisia 959 94.4 5.6 - 177 4.0 96.0 -Western Sahara 1 011 - - - - - - -Total Northern Africa 135 958 98.2 1.7 0.1 149 547 98.9 1.1 0Benin 2 675 - - - 3 836 - - -Burundi 198 - - - 722 - - -Cameroon 22 345 100 0 0 14 758 100 0 0Cape Verde 82 100 0 0 - - - -Central African Republic 22 903 - - - 10 122 - - -Congo 22 556 100 0 0 10 581 100 0 0Côte d’Ivoire 10 328 100 - - 2 662 100 - -Democratic Republic of the Congo 135 207 100 0 0 83 277 100 0 0
Annex 3: <strong>Global</strong> tables 203TABLE 5Ownership of forest and other wooded land 2000Country/area <strong>Forest</strong> Other wooded landTotal area Public Private Other Total area Public Private Other(1 000 ha) (%) (%) (%) (1 000 ha) (%) (%) (%)Equatorial Guinea 1 708 - - - 22 - - -Gabon 21 826 - - - - - - -Gambia 461 100 n.s. 0 140 100 0 0Ghana 6 094 100 0 0 0 - - -Guinea 6 904 - - - 5 850 - - -Guinea-Bissau 2 120 84.2 15.8 0 241 - - -Liberia 3 455 - - - 0 - - -Nigeria 13 137 100 0 0 6 902 100 0 0Rwanda 344 77.0 23.0 0 61 77.0 23.0 0Saint Helena 2 - - - 0 - - -Sao Tome and Principe 27 - - - 29 - - -Senegal 8 898 100 n.s. 0 5 101 99.9 0.1 0Sierra Leone 2 851 - - - 511 - - -Togo a 486 27.0 73.0 - 1 246 27.0 73.0 -Total Western and Central Africa 284 608 99.7 0.3 0 146 061 99.3 0.7 0Total Africa 655 613 97.6 1.8 0.6 471 189 94.4 2.8 2.8China 177 001 100 - - 97 683 100 - -Democratic People’sRepublic of Korea6 821 100 0 0 - - - -Japan 24 876 41.9 58.1 0 - - - -Mongolia 10 665 100 0 0 3 034 100 0 0Republic of Korea 6 300 30.0 70.0 0 - - - -Total East Asia 225 663 91.6 8.4 0 100 717 100 0 0Bangladesh 884 98.2 1.8 0 53 100 - -Bhutan 3 141 100 - - 609 100 - -Brunei Darussalam 288 100 0 - 155 94.8 5.2 -Cambodia 11 541 100 0 0 298 100 0 0India 67 554 98.4 1.6 0 4 732 98.4 1.6 0Indonesia 97 852 100 0 0 - - - -Lao People’s Democratic Republic 16 532 100 0 0 4 053 100 0 0Malaysia 21 591 93.4 6.6 0 - - - -Maldives 1 - - - 0 - - -Myanmar 34 554 100 0 0 10 629 100 0 0Nepal 3 900 99.9 0.1 - 1 753 100 - -Pakistan 2 116 66.0 34.0 - 1 323 66.0 34.0 -Philippines 7 949 89.5 10.5 - 3 292 - - -Singapore 2 100 0 0 0 - - -Sri Lanka 2 082 92.5 7.5 - 0 - - -Thailand 14 814 86.8 13.2 - - - - -Timor-Leste 854 33.0 67.0 0 - - - -Viet Nam 11 725 56.1 17.7 26.1 1 816 - - -Total South and Southeast Asia 297 380 96.0 3.0 1.0 28 713 97.7 2.3 0Afghanistan 1 015 100 0 0 - - - -Armenia 305 100 0 0 45 100 0 0Azerbaijan 936 100 0 0 54 100 0 0
204<strong>Global</strong> <strong>Forest</strong> <strong>Resources</strong> <strong>Assessment</strong> <strong>2005</strong>TABLE 5Ownership of forest and other wooded land 2000Country/area <strong>Forest</strong> Other wooded landTotal area Public Private Other Total area Public Private Other(1 000 ha) (%) (%) (%) (1 000 ha) (%) (%) (%)Bahrain n.s. 100 0 0 0 - - -Cyprus 173 61.2 38.8 0 214 23.7 76.3 0Georgia 2 760 100 0 0 51 100 0 0Iran (Islamic Republic of) 11 075 100 0 0 5 340 100 0 0Iraq 818 100 0 0 1 033 0 0 100Israel 164 - - - 62 - - -Jordan 83 85.5 0 14.5 54 55.6 22.2 22.2Kazakhstan 3 365 100 0 0 14 765 100 0 0Kuwait 5 100 0 0 0 - - -Kyrgyzstan 858 100 0 0 303 100 0 0Lebanon 131 38.2 60.3 1.5 117 13.7 79.9 6.4Occupied Palestinian Territory 9 - - - - - - -Oman 2 - - 100 1 303 100 - -Qatar n.s. - - - n.s. - - -Saudi Arabia 2 728 99.3 0.7 0 34 155 99.6 0.4 0Syrian Arab Republic 432 100 - - 35 100 - -Tajikistan 410 87.8 0 12.2 142 47.2 52.8 0Turkey 10 052 99.9 0.1 0 10 728 100 n.s. 0Turkmenistan 4 127 100 0 0 0 - - -United Arab Emirates 310 100 0 0 4 100 0 0Uzbekistan 3 212 100 0 0 - - - -Yemen 549 5.0 80.0 15.0 1 406 5.0 80.0 15.0Total Western and Central Asia 43 519 98.2 1.4 0.3 69 811 95.9 2.3 1.8Total Asia 566 562 94.4 5.0 0.6 199 241 98.3 1.1 0.7Albania 769 99.1 0.9 0 255 98.8 0.9 0Andorra 16 - - - - - - -Austria 3 838 19.6 80.4 0 117 19.7 80.3 0Belarus 7 848 100 0 0 915 100 0 0Belgium 667 43.5 56.5 0 27 38.9 61.5 0Bosnia and Herzegovina 2 185 78.6 21.4 0 549 84.0 16.0 0Bulgaria 3 375 91.6 8.4 0 105 94.3 4.8 0Channel Islands 1 - - - 0 - - -Croatia 2 129 78.7 21.3 0 338 97.0 2.7 0Czech Republic 2 637 76.7 23.3 0 0 - - -Denmark 486 28.4 71.6 0 136 - - -Estonia 2 243 37.5 22.4 40.0 94 8.5 37.2 54.3Faeroe Islands n.s. - - - - - - -Finland 22 475 32.1 67.8 0.1 830 68.9 31.0 0.1France 15 351 26.0 74.0 - 1 814 9.6 90.4 -Germany 11 076 52.8 47.2 0 - - - -Gibraltar 0 - - - 0 - - -Greece 3 601 77.5 22.5 0 2 924 86.5 13.5 0Holy See 0 - - - 0 - - -Hungary 1 907 60.5 39.5 0 0 - - -Iceland 38 46.6 53.2 0.8 104 28.9 69.0 2.0Ireland 609 64.0 36.0 0 41 16.1 83.9 0Isle of Man 3 - - - 0 - - -
Annex 3: <strong>Global</strong> tables 205TABLE 5Ownership of forest and other wooded land 2000Country/area <strong>Forest</strong> Other wooded landTotal area Public Private Other Total area Public Private Other(1 000 ha) (%) (%) (%) (1 000 ha) (%) (%) (%)Italy 9 447 35.0 65.0 0 992 - - -Latvia 2 885 54.0 45.1 0.9 120 16.7 70.8 12.5Liechtenstein 7 92.8 7.2 0 0 100 0 0Lithuania 2 020 77.3 22.7 0 83 69.9 30.1 0Luxembourg 87 45.7 54.3 0 1 10.7 89.3 0Malta n.s. 100 0 0 0 - - -Monaco 0 - - - 0 - - -Netherlands 360 49.7 50.3 0 0 - - -Norway 9 301 14.0 86.0 0 2 699 29.3 70.7 0Poland 9 059 83.2 16.8 0 - - - -Portugal 3 583 7.3 92.7 0 84 22.6 77.4 0Republic of Moldova 326 100 0 0 31 100 0 0Romania 6 366 94.3 5.7 0 234 0 100 0Russian Federation 809 268 100 0 0 72 706 100 0 0San Marino n.s. - - - 0 - - -Serbia and Montenegro 2 649 54.0 46.0 0 812 73.0 27.0 0Slovakia 1 921 52.4 43.2 4.4 - - - -Slovenia 1 239 27.7 72.3 0 44 4.5 95.0 0Spain 16 436 30.0 67.9 2.1 11 016 22.3 74.9 2.8Sweden 27 474 19.7 80.3 0 3 246 55.7 44.3 0Switzerland 1 199 68.0 32.0 - 64 79.7 20.3 -The former Yugoslav Republicof Macedonia906 78.0 22.0 0 82 - - 100Ukraine 9 510 100 0 0 41 100 0 0United Kingdom 2 793 36.2 63.8 0 20 0 100 0Total Europe 998 091 89.9 10.0 0.1 100 525 84.5 15.0 0.5Anguilla 6 - - - - - - -Antigua and Barbuda 9 - - - 16 - - -Aruba n.s. - - - 0 - - -Bahamas 515 80.0 20.0 - 36 80.1 19.9 -Barbados 2 4.1 95.9 - - - - -Bermuda 1 - - - 0 - - -British Virgin Islands 4 - - - 2 - - -Cayman Islands 12 - - - 4 - - -Cuba 2 435 95.2 2.9 1.9 264 98.1 1.1 1.1Dominica 47 - - - n.s. - - -Dominican Republic 1 376 - - - 678 - - -Grenada 4 69.0 31.0 - 5 69.0 31.0 -Guadeloupe 81 47.8 52.2 0 2 100 0 0Haiti 109 - - - - - - -Jamaica 341 27.6 65.1 7.3 189 5.1 91.1 3.5Martinique 46 33.1 66.9 0 - - - -Montserrat 4 - - - - - - -Netherlands Antilles 1 - - - 33 - - -Puerto Rico 407 - - - - - - -Saint Kitts and Nevis 5 - - - 6 - - -Saint Lucia 17 47.1 52.9 - 5 4.0 96.0 -
206<strong>Global</strong> <strong>Forest</strong> <strong>Resources</strong> <strong>Assessment</strong> <strong>2005</strong>TABLE 5Ownership of forest and other wooded land 2000Country/area <strong>Forest</strong> Other wooded landTotal area Public Private Other Total area Public Private Other(1 000 ha) (%) (%) (%) (1 000 ha) (%) (%) (%)Saint Vincent and the Grenadines 10 - - - 2 - - -Trinidad and Tobago 228 75.4 24.6 - 72 100 - -Turks and Caicos Islands 34 - - - - - - -United States Virgin Islands 10 - - - - - - -Total Caribbean 5 706 83.4 14.6 2.0 1 313 65.5 32.9 1.7Belize 1 653 - - - 115 - - -Costa Rica 2 376 24.3 75.7 - 10 40.0 60.0 -El Salvador 324 72.5 25.3 2.2 201 72.6 25.4 2.0Guatemala 4 208 42.2 52.5 5.3 1 672 - - -Honduras 5 430 75.0 25.0 0 559 75.0 25.0 0Nicaragua 5 539 - - - 973 - - -Panama 4 307 9.6 90.4 0 1 143 26.6 73.4 0Total Central America 23 837 42.5 56.1 1.4 4 673 45.6 54.2 0.2Canada 310 134 92.1 7.9 n.s. 91 951 97.9 2.1 0Greenland n.s. - - - 8 - - -Mexico 65 540 58.8 - 41.2 20 174 28.0 - 72.0Saint Pierre and Miquelon 3 86.7 13.3 - - - - -United States of America 302 294 42.4 57.6 - - - - -Total North America 677 971 66.7 29.3 4.0 112 132 85.3 1.7 13.0Total North and Central America 707 514 66.2 29.9 3.9 118 118 84.5 2.8 12.7American Samoa 18 - - - - - - -Australia 164 645 72.0 27.1 0.9 421 590 - - -Cook Islands 16 0 100 0 - - - -Fiji 1 000 6.8 93.2 0 - - - -French Polynesia 105 - - - - - - -Guam 26 - - - 0 - - -Kiribati 2 0 100 0 - - - -Marshall Islands - - - - - - - -Micronesia (Federated States of) 63 - - - - - - -Nauru 0 - - - 0 - - -New Caledonia 717 73.8 0.8 25.4 787 76.4 11.8 11.8New Zealand 8 226 63.4 36.6 0 2 557 - - -Niue 15 0 100 0 - - - -Northern Mariana Islands 34 - - - - - - -Palau 40 - - - - - - -Papua New Guinea 30 132 3.1 0 96.9 4 474 3.1 0 96.9Pitcairn 4 - - - 0 - - -Samoa 171 98.2 1.8 - 22 90.9 9.1 -Solomon Islands 2 371 - - - - - - -Tokelau 0 - - - 0 - - -Tonga 4 100 - - 1 - - -Tuvalu 1 - - - 0 - - -Vanuatu 440 - - - 476 - - -Wallis and Futuna Islands 5 0 0 100 1 0 0 100Total Oceania 208 034 61.3 23.7 15.0 429 908 14.4 1.8 83.8
Annex 3: <strong>Global</strong> tables 207TABLE 5Ownership of forest and other wooded land 2000Country/area <strong>Forest</strong> Other wooded landTotal area Public Private Other Total area Public Private Other(1 000 ha) (%) (%) (%) (1 000 ha) (%) (%) (%)Argentina 33 770 - - - 60 734 - - -Bolivia 60 091 - - - 2 473 - - -Brazil 493 213 - - - - - - -Chile 15 834 24.9 73.1 2.0 13 806 - - -Colombia 60 963 - - - 18 158 - - -Ecuador 11 841 77.1 - 22.9 1 360 - - -Falkland Islands 0 - - - 0 - - -French Guiana 8 063 99.8 0.2 0 0 - - -Guyana 15 104 66.3 - 33.7 3 580 66.3 - 33.7Paraguay 19 368 - - - - - - -Peru 69 213 83.1 15.2 1.7 22 132 0.8 0.1 99.0South Georgia andthe South Sandwich Islands0 - - - 0 - - -Suriname 14 776 99.7 0.3 - - - - -Uruguay 1 409 2.7 97.3 0 4 0 100.0 0Venezuela (Bolivarian Republic of) 49 151 - - - 7 421 - - -Total South America 852 796 75.9 17.3 6.9 129 668 9.9 0.1 89.9WORLD 3 988 610 84.4 13.3 2.4 1 448 649 89.8 3.8 6.5aThe country provided information for this table for forest and other wooded land combined. For the purposes of data display and analysis, <strong>FAO</strong>has distributed these values to the categories forest and other wooded land respectively.
208<strong>Global</strong> <strong>Forest</strong> <strong>Resources</strong> <strong>Assessment</strong> <strong>2005</strong>TABLE 6Designated functions a of forest – primary function <strong>2005</strong>Country/area Total forest area % of total forest whose primary function is designated as:(1 000 ha)Production Protection Conservation Social Multiple None orservices purpose unknownAngola 59 104 4.0 - 3.2 - - 92.9Botswana 11 943 - - - - - -British Indian Ocean Territory 3 - - - - - -Comoros 5 26.6 73.4 0 0 0 0Kenya 3 522 n.s. 100 - - - -Lesotho 8 92.5 - - - - 7.5Madagascar 12 838 26.3 1.4 39.4 - 32.9 -Malawi 3 402 - - - - - -Mauritius 37 29.7 43.2 21.6 8.1 - -Mayotte 5 - - - - - -Mozambique 19 262 17.5 - 2.3 - 80.2 -Namibia b 7 661 - - 35.9 - 16.5 47.5Réunion 84 6.2 14.9 72.0 0.8 0 6.1Seychelles 40 2.5 15.0 5.0 20.0 15.0 42.5South Africa 9 203 15.5 - 10.3 - 74.2 -Swaziland 541 26.8 - - - - 73.0Uganda 3 627 14.9 - 14.8 - - 70.2United Republic of Tanzania 35 257 71.0 - 6.0 - 22.9 -Zambia 42 452 7.1 4.2 15.0 - 73.7 -Zimbabwe 17 540 10.1 2.8 - - 87.1 -Total Eastern and Southern Africa 226 534 19.4 2.8 9.5 n.s. 39.0 29.1Algeria 2 277 32.9 63.0 4.0 0.1 - -Burkina Faso 6 794 8.2 - 0.3 n.s. - 91.5Chad 11 921 90.3 0.1 9.6 - - -Djibouti 6 - - - - - -Egypt 67 1.9 50.0 - - 48.1 -Eritrea 1 554 1.9 0.9 4.9 - 0.7 91.5Ethiopia 13 000 3.8 - - - 96.2 -Libyan Arab Jamahiriya 217 - 100 - - - -Mali 12 572 8.0 69.0 23.0 - - -Mauritania 267 - - - - - 100Morocco 4 364 - - - - - -Niger 1 266 - 0.2 17.4 - 82.4 -Somalia 7 131 n.s. - - - 100 -Sudan 67 546 44.9 2.6 12.7 - - 39.9Tunisia 1 056 23.0 42.0 3.7 - 31.3 -Western Sahara 1 011 - - - - - -Total Northern Africa 131 048 35.2 10.0 10.4 n.s. 16.8 27.7Benin 2 351 - - - - - -Burundi 152 - - - - - -Cameroon 21 245 29.3 2.7 48.6 1.0 18.4 -Cape Verde 84 80.0 8.8 11.2 - - -Central African Republic 22 755 21.2 - 78.8 - - -Congo 22 471 88.2 - 4.4 - 7.4 -Côte d’Ivoire 10 405 88.7 3.3 7.8 0.2 - -Democratic Republic of the Congo 133 610 - - - - - -
Annex 3: <strong>Global</strong> tables 209TABLE 6Designated functionsª of forest – primary function <strong>2005</strong>Country/area Total forest area % of total forest whose primary function is designated as:(1 000 ha)Production Protection Conservation Social Multiple None orservices purpose unknownEquatorial Guinea 1 632 - - - - - -Gabon 21 775 - - - - - -Gambia 471 - - - - 100 -Ghana 5 517 22.7 6.4 0.8 1.2 - 68.9Guinea 6 724 1.5 7.3 44.7 - - 46.5Guinea-Bissau 2 072 39.6 11.7 45.4 3.4 - -Liberia 3 154 41.5 - 4.1 - 48.3 6.2Nigeria 11 089 27.6 0 49.6 0 0 22.7Rwanda 480 76.2 10.8 0 0 12.9 0Saint Helena 2 - - - - - -Sao Tome and Principe 27 - - - - - -Senegal 8 673 59.6 0.4 18.1 n.s. 21.9 -Sierra Leone 2 754 10.3 1.2 2.8 - - 85.7Togo 386 68.0 16.0 16.0 - - -Total Western and Central Africa 277 829 44.6 1.9 35.0 0.3 8.1 10.1Total Africa 635 412 30.3 4.6 16.4 0.1 24.8 23.8China 197 290 58.0 31.3 2.7 1.2 6.8 -Democratic People’sRepublic of Korea6 187 86.2 - 13.8 - - -Japan 24 868 0 0 0 0 100 0Mongolia 10 252 8.9 44.0 46.2 0.9 - -Republic of Korea 6 265 77.8 11.4 7.5 3.3 - 0Total East Asia 244 862 51.2 27.4 4.7 1.1 15.6 0Bangladesh 871 31.7 7.8 20.9 1.1 38.5 0Bhutan 3 195 15.9 45.8 27.2 - - 11.1Brunei Darussalam 278 62.6 6.8 29.1 1.4 - -Cambodia 10 447 32.3 3.9 21.3 0.9 3.9 37.8India 67 701 21.2 14.8 21.7 - 42.4 -Indonesia 88 495 53.9 27.5 18.6 - - -Lao People’s Democratic Republic 16 142 21.6 54.7 23.5 0.2 - -Malaysia 20 890 56.6 18.2 5.4 - 19.8 -Maldives 1 - - - - - -Myanmar 32 222 77.0 4.7 15.2 - 3.2 -Nepal 3 636 5.1 12.1 21.4 - 14.7 46.8Pakistan 1 902 32.0 - 11.4 - 56.7 -Philippines 7 162 75.0 11.0 12.0 - - 2.0Singapore 2 - - 100 - - -Sri Lanka 1 933 8.8 1.0 28.9 - 61.3 -Thailand 14 520 13.8 7.6 58.3 - 1.1 19.3Timor-Leste 798 17.3 59.3 23.4 - - -Viet Nam 12 931 39.8 45.5 14.7 - - -Total South and Southeast Asia 283 127 42.4 20.9 20.2 0.1 13.3 3.2Afghanistan 867 - - - - 100 -Armenia 283 0 61.8 17.0 21.2 0 0Azerbaijan 936 0 92.3 7.7 - 0 0
210<strong>Global</strong> <strong>Forest</strong> <strong>Resources</strong> <strong>Assessment</strong> <strong>2005</strong>TABLE 6Designated functionsª of forest – primary function <strong>2005</strong>Country/area Total forest area % of total forest whose primary function is designated as:(1 000 ha)Production Protection Conservation Social Multiple None orservices purpose unknownBahrain n.s. - 100 - - - -Cyprus b 174 24.7 - 2.9 10.3 55.6 5.7Georgia b 2 760 0 78.4 8.2 13.4 0 0Iran (Islamic Republic of) 11 075 13.5 - 1.4 - 85.1 -Iraq 822 - 80.0 20.0 - - -Israel 171 - 12.9 4.1 - 83.0 -Jordan 83 0 6.0 1.2 1.2 91.6 0Kazakhstan 3 337 0 0 15.9 12.8 71.3 0Kuwait 6 - 100 - - - -Kyrgyzstan 869 0 78.0 7.4 1.5 13.1 0Lebanon 136 97.4 - 2.6 - - -Occupied Palestinian Territory 9 - - - - - -Oman 2 100 - - - - -Qatar n.s. - - - - - -Saudi Arabia 2 728 - - - - 100 -Syrian Arab Republic 461 - - - - 100 -Tajikistan 410 5.4 10.7 83.9 0 0 0Turkey 10 175 78.3 13.9 7.6 0.2 0 0Turkmenistan 4 127 0 97.5 2.5 - 0 0United Arab Emirates 312 - - - - 100 -Uzbekistan 3 295 0.2 91.5 8.3 - - -Yemen 549 - - - - 100 -Total Western and Central Asia 43 588 22.2 30.0 6.4 2.1 39.3 n.s.Total Asia 571 577 44.7 24.3 12.5 0.6 16.3 1.6Albania 794 68.3 22.7 9.0 - - -Andorra 16 - - - - - -Austria 3 862 - - - - - -Belarus 7 894 50.6 28.3 5.9 15.2 0 0Belgium 667 - - - - 100 -Bosnia and Herzegovina 2 185 56.1 - - - - 43.9Bulgaria 3 625 - - - - - -Channel Islands 1 - - - - - -Croatia 2 135 94.7 2.3 0.3 0.3 2.4 0Czech Republic 2 648 75.2 6.3 7.0 11.5 - 0Denmark 500 38.6 6.8 16.2 - 38.6 -Estonia 2 284 71.8 22.0 6.2 0 0 0Faeroe Islands n.s. - - - - - -Finland 22 500 91.2 0 7.2 0.2 1.5 0France 15 554 96.9 1.5 1.2 0.3 - -Germany 11 076 - 21.9 19.3 42.3 - 16.5Gibraltar 0 - - - - - -Greece 3 752 92.1 - 4.2 - - 3.7Holy See 0 - - - - - -Hungary 1 976 64.5 13.3 20.6 1.5 0 n.s.Iceland 46 19.8 10.4 0 14.8 54.1 0Ireland 669 90.1 0 0.9 - - 9.0Isle of Man 3 - - - - - -
Annex 3: <strong>Global</strong> tables 211TABLE 6Designated functionsª of forest – primary function <strong>2005</strong>Country/area Total forest area % of total forest whose primary function is designated as:(1 000 ha)Production Protection Conservation Social Multiple None orservices purpose unknownItaly 9 979 - - 29.9 - - 70.1Latvia 2 941 n.s. 5.9 13.6 1.5 79.0 0Liechtenstein 7 40.0 32.0 20.0 8.0 - -Lithuania 2 099 70.3 9.8 8.9 3.2 7.8 -Luxembourg 87 32.6 - - - 67.4 -Malta n.s. - - - - 100 -Monaco 0 - - - - - -Netherlands 365 1.1 0 24.7 - 74.2 -Norway 9 387 62.9 27.6 1.5 - 8.0 0Poland 9 192 63.5 20.7 4.8 11.0 0 0Portugal 3 783 78.0 5.7 16.3 - - 0Republic of Moldova 329 64.1 6.7 13.4 - - 15.8Romania 6 370 51.3 38.9 4.4 5.4 0 0Russian Federation 808 790 76.9 8.7 2.0 1.5 10.8 -San Marino n.s. - - - - - -Serbia and Montenegro 2 694 - - - - - -Slovakia 1 929 9.5 17.8 5.0 12.6 55.1 0Slovenia 1 264 54.3 12.7 6.7 13.9 12.3 0Spain 17 915 9.4 13.1 37.3 0.1 40.2 0Sweden 27 528 73.1 0.1 12.2 - 14.5 -Switzerland 1 221 62.7 35 2.4 0 0 -The former Yugoslav Republicof Macedonia906 82.2 - - - - 17.8Ukraine 9 575 47.9 30.4 2.6 19.0 0 0United Kingdom 2 845 33.7 0.2 5.1 3.7 53.1 4.2Total Europe 1 001 394 73.1 9.1 3.8 2.3 10.7 1.0Anguilla 6 - - - - - -Antigua and Barbuda 9 - - - - - -Aruba n.s. - - - - - -Bahamas 515 - - - - - -Barbados 2 - - 17.6 - - 82.4Bermuda 1 - - - - - -British Virgin Islands 4 - - - - - -Cayman Islands 12 - - - - - -Cuba 2 713 32.1 45.9 22.0 - - -Dominica 46 - - - - - -Dominican Republic 1 376 - - - - - -Grenada 4 5.1 13.5 56.0 - - 25.1Guadeloupe 80 3.5 - 18.5 - 22.7 55.3Haiti 105 49.8 - 4.1 - - 46.7Jamaica 339 2.4 4.5 21.3 0 6.0 65.8Martinique 46 - - - - - -Montserrat 4 - - - - - 100Netherlands Antilles 1 - - - - - -Puerto Rico 408 - - - - - -Saint Kitts and Nevis 5 - - - - - -Saint Lucia 17 - - - - 58.8 41.2
212<strong>Global</strong> <strong>Forest</strong> <strong>Resources</strong> <strong>Assessment</strong> <strong>2005</strong>TABLE 6Designated functionsª of forest – primary function <strong>2005</strong>Country/area Total forest area % of total forest whose primary function is designated as:(1 000 ha)Production Protection Conservation Social Multiple None orservices purpose unknownSaint Vincent and the Grenadines 11 - - - - - -Trinidad and Tobago 226 19.5 13.3 6.2 1.3 0 59.7Turks and Caicos Islands 34 - - - - - -United States Virgin Islands 10 - - - - - -Total Caribbean 5 974 28.1 37.0 20.2 0.1 1.4 13.3Belize 1 653 - - 37.0 - - 63.0Costa Rica 2 391 0.1 1.9 24.5 - 73.5 -El Salvador 298 2.0 - 2.3 - - 95.6Guatemala 3 938 26.8 - 62.3 - - 10.9Honduras 4 648 41.7 1.7 32.5 0.8 23.3 0Nicaragua 5 189 - - 35.6 - 64.4 -Panama 4 294 7.2 21.9 34.0 0 36.8 -Total Central America 22 411 14.8 4.8 37.8 0.2 34.6 7.8Canada 310 134 1.3 - 4.9 - 86.7 7.1Greenland n.s. - - - - - -Mexico 64 238 0.1 1.5 6.8 - 91.5 -Saint Pierre and Miquelon 3 - - - - 100 -United States of America 303 089 12.0 - 19.8 - 68.1 -Total North America 677 464 6.0 0.1 11.8 - 78.9 3.3Total North and Central America 705 849 6.4 0.5 12.6 n.s. 77.1 3.4American Samoa 18 - - - - 100 -Australia 163 678 8.0 - 13.1 - 77.6 1.3Cook Islands 16 - 7.1 - - 92.9 -Fiji 1 000 10.1 33.9 7.4 0 48.7 0French Polynesia 105 - - - - - -Guam 26 - - - - 100 -Kiribati 2 - - - - - -Marshall Islands - - - - - - -Micronesia (Federated States of) 63 - - - - - -Nauru 0 - - - - - -New Caledonia 717 2.8 14.4 9.9 8.4 2.8 61.8New Zealand 8 309 22.0 0.2 77.7 - - -Niue 14 - - - - - 100Northern Mariana Islands 33 - - - - 100 -Palau 40 - - - - 100 -Papua New Guinea 29 437 24.8 - 4.6 - 4.9 65.7Pitcairn 4 - - - - - -Samoa 171 47.1 20.4 16.7 4.2 5.0 6.7Solomon Islands 2 172 - - - - - -Tokelau 0 - - - - - -Tonga 4 0.6 - - - - 99.4Tuvalu 1 - - - - - -Vanuatu 440 - - - - - -Wallis and Futuna Islands 5 10.8 80.1 9.1 - - -Total Oceania 206 254 11.0 0.2 14.4 n.s. 63.5 10.8
Annex 3: <strong>Global</strong> tables 213TABLE 6Designated functionsª of forest – primary function <strong>2005</strong>Country/area Total forest area % of total forest whose primary function is designated as:(1 000 ha)Production Protection Conservation Social Multiple None orservices purpose unknownArgentina 33 021 3.7 - 3.4 - 6.3 86.5Bolivia 58 740 0 0 20.0 0 80.0 0Brazil 477 698 5.5 17.8 8.1 23.8 44.8 -Chile 16 121 45.3 30.0 13.7 0 11.1 -Colombia 60 728 12.7 1.0 14.1 0 - 72.2Ecuador 10 853 1.5 21.5 44.2 - 18.9 13.8Falkland Islands 0 - - - - - -French Guiana 8 063 0 0 4.0 0 31.5 64.4Guyana 15 104 34.9 - 1.0 2.4 - 61.7Paraguay 18 475 0.2 n.s. 10.0 n.s. 0 89.8Peru 68 742 36.7 0.5 26.9 n.s. 26.0 9.9South Georgia andthe South Sandwich Islands0 - - - - - -Suriname 14 776 27.1 - 12.8 - 3.3 56.8Uruguay 1 506 59.7 23.0 17.2 - - -Venezuela (Bolivarian Republic of) 47 713 38.1 0 61.9 0 0 -Total South America 831 540 11.6 11.3 14.4 13.7 34.6 14.5WORLD 3 952 025 34.1 9.3 11.2 3.7 33.8 7.8aDesignated function is defined as “the function or purpose assigned to a piece of land either by legal prescriptions or by the land owner/manager”.bThe country provided information for this table for forest and other wooded land combined. For the purposes of data display and analysis, <strong>FAO</strong>has distributed these values to the categories forest and other wooded land respectively.
214<strong>Global</strong> <strong>Forest</strong> <strong>Resources</strong> <strong>Assessment</strong> <strong>2005</strong>TABLE 7Designated functions of forest – total area with function a <strong>2005</strong> (1 000 ha)Country/area Total forest Production Protection Conservation SocialareaservicesAngola 59 104 - - - -Botswana 11 943 - - - -British Indian Ocean Territory 3 - - - -Comoros 5 - - - -Kenya 3 522 - - - -Lesotho 8 - - - -Madagascar 12 838 - - - -Malawi 3 402 - - - -Mauritius 37 11 18 10 6Mayotte 5 - - - -Mozambique 19 262 - - - -Namibia 7 661 - - - -Réunion 84 - - - -Seychelles 40 7 12 2 8South Africa 9 203 - - - -Swaziland 541 - - - -Uganda 3 627 - - - -United Republic of Tanzania 35 257 - - - -Zambia 42 452 - - 10 260 -Zimbabwe 17 540 - - - -Total Eastern and Southern Africa 226 534Algeria b 2 277 - - - -Burkina Faso 6 794 - - - -Chad 11 921 - - - -Djibouti 6 - - - -Egypt 67 67 67 - -Eritrea 1 554 33 32 104 -Ethiopia 13 000 - - - -Libyan Arab Jamahiriya 217 - 217 - -Mali 12 572 - - - -Mauritania 267 - - - -Morocco 4 364 - - - -Niger 1 266 1 116 1 118 220 -Somalia 7 131 - - - -Sudan 67 546 - - - -Tunisia 1 056 574 1 056 1 056 -Western Sahara 1 011 - - - -Total Northern Africa 131 048Benin 2 351 - - - -Burundi 152 - - - -Cameroon 21 245 14 440 736 6 289 210Cape Verde 84 - - - -Central African Republic 22 755 4 826 - 17 926 -Congo 22 471 - - - -Côte d’Ivoire 10 405 10 409 348 808 17Democratic Republic of the Congo 133 610 - - - -Equatorial Guinea 1 632 - - - -
Annex 3: <strong>Global</strong> tables 215TABLE 7Designated functions of forest – total area with function a <strong>2005</strong> (1 000 ha)Country/area Total forest Production Protection Conservation SocialareaservicesGabon 21 775 - - - -Gambia 471 - - - -Ghana 5 517 1 255 353 43 66Guinea 6 724 - - - -Guinea-Bissau 2 072 - - - -Liberia 3 154 - - - -Nigeria 11 089 - - - -Rwanda 480 - - - -Saint Helena 2 - - - -Sao Tome and Principe 27 - - - -Senegal 8 673 6 617 47 2 007 0Sierra Leone 2 754 317 32 77 -Togo 386 - - - -Total Western and Central Africa 277 829Total Africa 635 412China 197 290 189 544 185 854 82 924 15 739Democratic People’sRepublic of Korea6 187 5 335 6 187 852 852Japan 24 868 23 743 24 868 24 868 24 868Mongolia 10 252 912 9 248 9 248 4 825Republic of Korea 6 265 4 874 1 186 1 186 675Total East Asia 244 862Bangladesh 871 612 250 250 527Bhutan 3 195 508 2 333 2 333 869Brunei Darussalam 278 174 100 100 282Cambodia 10 447 3 778 3 031 2 627 501India 67 701 43 036 67 701 53 364 67 701Indonesia 88 495 47 707 40 788 40 788 -Lao People’s Democratic Republic 16 142 3 488 12 654 12 622 3 822Malaysia 20 890 15 960 19 661 4 930 1 120Maldives 1 - - - -Myanmar 32 222 25 822 7 425 7 425 7 425Nepal 3 636 718 1 749 1 216 776Pakistan 1 902 1 686 1 294 216 216Philippines 7 162 5 372 1 647 1 647 859Singapore 2 - 2 2 2Sri Lanka 1 933 1 356 1 762 1 762 1 743Thailand 14 520 2 150 9 725 9 572 8 623Timor-Leste 798 138 660 660 -Viet Nam 12 931 5 148 12 931 7 783 1 902Total South and Southeast Asia 283 127Afghanistan 867 867 867 867 867Armenia 283 9 241 131 110Azerbaijan 936 151 889 72 -Bahrain n.s. - n.s. - -Cyprus b 174 43 163 163 115Georgia 2 760 550 2 760 2 700 370
216<strong>Global</strong> <strong>Forest</strong> <strong>Resources</strong> <strong>Assessment</strong> <strong>2005</strong>TABLE 7Designated functions of forest – total area with function a <strong>2005</strong> (1 000 ha)Country/area Total forest Production Protection Conservation SocialareaservicesIran (Islamic Republic of) 11 075 - - - -Iraq 822 - - - -Israel 171 60 - - -Jordan 83 - - - -Kazakhstan 3 337 - - 530 428Kuwait 6 - 6 - -Kyrgyzstan 869 562 869 64 869Lebanon 136 133 136 4 136Occupied Palestinian Territory 9 - - - -Oman 2 2 - - -Qatar n.s. - - - -Saudi Arabia 2 728 - - - -Syrian Arab Republic 461 - - - -Tajikistan 410 22 44 344 -Turkey 10 175 - - - -Turkmenistan 4 127 4 023 4 023 104 -United Arab Emirates 312 - 312 312 -Uzbekistan 3 295 3 020 3 289 3 289 -Yemen 549 - - - -Total Western and Central Asia 43 588Total Asia 571 577Albania 794 542 180 71 -Andorra 16 - - - -Austria b 3 862 - 3 862 3 862 -Belarus 7 894 3 996 7 894 466 7 894Belgium 667 667 99 209 -Bosnia and Herzegovina 2 185 - - - -Bulgaria 3 625 - - - -Channel Islands 1 - - - -Croatia 2 135 2 049 504 482 667Czech Republic 2 648 2 860 726 656 605Denmark 500 494 322 81 -Estonia 2 284 1 639 503 142 -Faeroe Islands n.s. - - - -Finland 22 500 20 888 0 22 500 22 500France 15 554 - - - -Germany 11 076 - - - -Gibraltar 0 - - - -Greece 3 752 - - - -Holy See 0 - - - -Hungary 1 976 1 338 292 425 34Iceland 46 41 36 36 36Ireland 669 - - - -Isle of Man 3 - - - -Italy 9 979 - 8 921 2 980 9 979Latvia 2 941 - - - -Liechtenstein 7 - - - -Lithuania 2 099 1 823 206 2 099 2 099
Annex 3: <strong>Global</strong> tables 217TABLE 7Designated functions of forest – total area with function a <strong>2005</strong> (1 000 ha)Country/area Total forest Production Protection Conservation SocialareaservicesLuxembourg 87 - - - -Malta n.s. - - - -Monaco 0 - - - -Netherlands 365 279 0 301 301Norway 9 387 6 656 2 593 9 387 9 387Poland 9 192 8 701 - - -Portugal 3 783 - - - -Republic of Moldova 329 - - - -Romania 6 370 5 102 2 481 854 1 000Russian Federation 808 790 - - - -San Marino n.s. - - - -Serbia and Montenegro 2 694 - - - -Slovakia 1 929 - - - -Slovenia 1 264 1 171 443 281 441Spain 17 915 1 971 10 991 13 872 913Sweden 27 528 20 126 35 27 528 27 528Switzerland 1 221 1 192 427 29 -The former Yugoslav Republicof Macedonia906 - - - -Ukraine 9 575 5 451 9 575 1 436 4 788United Kingdom 2 845 2 361 280 521 1 562Total Europe 1 001 394Anguilla 6 - - - -Antigua and Barbuda 9 - - - -Aruba n.s. - - - -Bahamas 515 - - - -Barbados 2 - - - -Bermuda 1 - - - -British Virgin Islands 4 - - - -Cayman Islands 12 - - - -Cuba 2 713 - - - -Dominica 46 - - - -Dominican Republic 1 376 - - - -Grenada 4 - - - -Guadeloupe 80 3 80 33 33Haiti 105 52 4 4 4Jamaica 339 43 116 93 93Martinique 46 - - - -Montserrat 4 - - - -Netherlands Antilles 1 - - - -Puerto Rico 408 - - - -Saint Kitts and Nevis 5 - - - -Saint Lucia 17 - - - -Saint Vincent and the Grenadines 11 - - - -Trinidad and Tobago 226 - - - -Turks and Caicos Islands 34 - - - -United States Virgin Islands 10 - - - -Total Caribbean 5 974
218<strong>Global</strong> <strong>Forest</strong> <strong>Resources</strong> <strong>Assessment</strong> <strong>2005</strong>TABLE 7Designated functions of forest – total area with function a <strong>2005</strong> (1 000 ha)Country/area Total forest Production Protection Conservation SocialareaservicesBelize 1 653 - - - -Costa Rica 2 391 - - - -El Salvador 298 - - - -Guatemala 3 938 - - - -Honduras 4 648 - - - -Nicaragua 5 189 - - - -Panama 4 294 312 3 133 2 827 -Total Central America 22 411Canada 310 134 272 827 310 134 310 134 -Greenland n.s. - - - -Mexico 64 238 - - - -Saint Pierre and Miquelon 3 3 2 1 3United States of America 303 089 - 303 089 - -Total North America 677 464Total North and Central America 705 849American Samoa 18 18 18 18 18Australia 163 678 - - - -Cook Islands 16 16 16 14 -Fiji 1 000 588 368 209 517French Polynesia 105 - - - -Guam 26 - - - -Kiribati 2 - - - -Marshall Islands - - - - -Micronesia (Federated States of) 63 - - - -Nauru 0 - - - -New Caledonia 717 133 133 91 60New Zealand 8 309 1 852 8 309 8 309 8 309Niue 14 - - - -Northern Mariana Islands 33 - - - -Palau 40 - - - -Papua New Guinea 29 437 - - - -Pitcairn 4 - - - -Samoa 171 89 60 75 51Solomon Islands 2 172 - - - -Tokelau 0 - - - -Tonga 4 - - - -Tuvalu 1 - - - -Vanuatu 440 - - - -Wallis and Futuna Islands 5 4 5 2 -Total Oceania 206 254Argentina 33 021 - - - -Bolivia 58 740 30 555 - 58 740 -Brazil 477 698 41 122 85 149 258 334 128 428Chile 16 121 - - - -Colombia 60 728 - - - -Ecuador 10 853 - - - -
Annex 3: <strong>Global</strong> tables 219TABLE 7Designated functions of forest – total area with function a <strong>2005</strong> (1 000 ha)Country/area Total forest Production Protection Conservation SocialareaservicesFalkland Islands 0 - - - -French Guiana 8 063 1 217 55 1 261 335Guyana 15 104 - - - -Paraguay 18 475 - - - -Peru 68 742 - - - -South Georgia andthe South Sandwich Islands0 - - - -Suriname 14 776 - - - -Uruguay 1 506 - - - -Venezuela (Bolivarian Republic of) 47 713 - - - -Total South America 831 540WORLD 3 952 025a“Total area with function” represents the total area having a specific function, regardless of whether it is a primary function or not.bThe country provided information for this table for forest and other wooded land combined. For the purposes of data display and analysis, <strong>FAO</strong>has distributed these values to the categories forest and other wooded land respectively.
220<strong>Global</strong> <strong>Forest</strong> <strong>Resources</strong> <strong>Assessment</strong> <strong>2005</strong>Country/areaTABLE 8Characteristics of forest and other wooded land <strong>2005</strong> (1 000 ha)<strong>Forest</strong>Total area Primary Modified Semi-natural Productive Protectivenatural plantation plantationAngola 59 104 0 58 973 0 131 0Botswana 11 943 - - - - -British Indian Ocean Territory 3 - - - - -Comoros 5 0 4 0 1 -Kenya 3 522 704 2 616 - 202 -Lesotho 8 1 - - 7 -Madagascar 12 838 10 347 2 198 - 234 59Malawi 3 402 1 132 2 067 - 204 -Mauritius 37 0 22 n.s. 11 4Mayotte 5 - 5 - n.s. -Mozambique 19 262 - 19 224 - 38 -Namibia 7 661 - 7 661 - - -Réunion 84 55 6 18 2 2Seychelles 40 2 33 - 5 -South Africa 9 203 - 7 777 - 1 426 -Swaziland 541 - 395 31 114 -Uganda 3 627 - 3 591 - 36 -United Republic of Tanzania 35 257 - 35 107 - 150 -Zambia 42 452 - 42 377 - 75 -Zimbabwe 17 540 - 17 385 - 154 -Total Eastern and Southern Africa 226 534Algeria 2 277 - 1 206 316 12 742Burkina Faso 6 794 0 5 918 800 71 5Chad 11 921 190 11 716 - - 15Djibouti 6 - - - - -Egypt 67 - - - 1 66Eritrea 1 554 - 1 526 - 14 14Ethiopia 13 000 - 12 509 - 491 -Libyan Arab Jamahiriya 217 - - - - 217Mali 12 572 - - - - -Mauritania 267 - - - - -Morocco 4 364 - 3 754 47 563 -Niger 1 266 220 936 - - 110Somalia 7 131 - 7 128 - 3 -Sudan 67 546 13 509 47 282 1 351 4 728 675Tunisia 1 056 - 320 238 150 348Western Sahara 1 011 - - - - -Total Northern Africa 131 048Benin 2 351 - 2 237 - 114 -Burundi 152 0 67 0 86 0Cameroon 21 245 - - - - -Cape Verde 84 - - - 67 17Central African Republic 22 755 - 22 750 - 5 -Congo 22 471 7 464 14 957 - 51 -Côte d’Ivoire 10 405 625 9 443 0 337 0Democratic Republic of the Congo 133 610 - - - - -
Annex 3: <strong>Global</strong> tables 221TABLE 8Characteristics of forest and other wooded land <strong>2005</strong> (1 000 ha)Other wooded landCountry/areaTotal area Primary Modified Semi-natural Productive Protectivenatural plantation plantation- - - - - - Angola34 791 - - - - - Botswana0 - - - - - British Indian Ocean Territory- - - - - - Comoros34 920 - 34 920 - - - Kenya31 - 31 - - - Lesotho17 054 - - - - - Madagascar- - - - - - Malawi15 0 15 n.s. - - Mauritius- - - - - - Mayotte40 919 - 40 919 - - - Mozambique8 473 - 8 473 - - - Namibia55 16 8 31 0 0 Réunion- - - - - - Seychelles21 409 0 21 409 0 0 0 South Africa289 - 289 - - - Swaziland1 150 - 1 150 - - - Uganda4 756 - 4 756 - - - United Republic of Tanzania3 161 - 3 161 - - - Zambia- - - - - - Zimbabwe167 023 Total Eastern and Southern Africa1 595 - 1 595 - - - Algeria7 427 - 7 427 - - - Burkina Faso9 152 - 9 152 - - - Chad220 - - - - - Djibouti20 - 20 - - - Egypt7 257 - 7 257 - - - Eritrea44 650 - 44 650 - - - Ethiopia330 - 330 - - - Libyan Arab Jamahiriya16 532 - 16 532 - - - Mali3 110 - - - - - Mauritania406 - 406 - - - Morocco3 740 - 3 740 - - - Niger- - - - - - Somalia- - - - - - Sudan170 - 170 - - - Tunisia- - - - - - Western Sahara94 609 Total Northern Africa3 959 - - - - - Benin722 - - - - - Burundi14 758 - - - - - Cameroon- - - - - - Cape Verde10 122 - - - - - Central African Republic10 547 - 10 547 - - - Congo2 626 0 2 626 0 0 0 Côte d’Ivoire83 277 - - - - - Democratic Republic of the Congo
222<strong>Global</strong> <strong>Forest</strong> <strong>Resources</strong> <strong>Assessment</strong> <strong>2005</strong>Country/areaTABLE 8Characteristics of forest and other wooded land <strong>2005</strong> (1 000 ha)<strong>Forest</strong>Total area Primary Modified Semi-natural Productive Protectivenatural plantation plantationEquatorial Guinea 1 632 - - - - -Gabon 21 775 - - - 36 -Gambia 471 - 471 - n.s. -Ghana 5 517 353 5 004 - 160 -Guinea 6 724 63 6 568 60 30 3Guinea-Bissau 2 072 940 1 132 - 0 n.s.Liberia 3 154 129 3 017 - 8 -Nigeria 11 089 326 10 414 0 349 0Rwanda 480 0 62 - 367 52Saint Helena 2 - - - - -Sao Tome and Principe 27 12 16 - - -Senegal 8 673 1 598 6 710 - 332 33Sierra Leone 2 754 - 2 751 - 3 -Togo 386 0 348 - 30 8Total Western and Central Africa 277 829Total Africa 635 412China 197 290 11 632 114 332 39 957 28 530 2 839Democratic People’sRepublic of Korea6 187 852 - 5 335 - -Japan 24 868 4 591 9 955 - - 10 321Mongolia 10 252 4 733 5 407 - 112 -Republic of Korea 6 265 - 4 901 - 1 364 -Total East Asia 244 862Bangladesh 871 - 592 - 195 84Bhutan 3 195 413 2 529 251 2 0Brunei Darussalam 278 278 - - - -Cambodia 10 447 322 10 066 0 59 -India 67 701 - 32 943 31 532 1 053 2 173Indonesia 88 495 48 702 - 36 394 3 399 -Lao People’s Democratic Republic 16 142 1 490 14 428 - 223 1Malaysia 20 890 3 820 - 15 497 1 573 -Maldives 1 - - - - -Myanmar 32 222 - 31 373 - 696 153Nepal 3 636 349 384 2 850 43 10Pakistan 1 902 - 1 584 - 318 -Philippines 7 162 829 5 713 - 304 316Singapore 2 2 0 0 0 0Sri Lanka 1 933 167 1 571 - 171 24Thailand 14 520 6 451 4 970 - 1 997 1 102Timor-Leste 798 - 755 - - 43Viet Nam 12 931 85 10 151 - 1 792 903Total South and Southeast Asia 283 127Afghanistan 867 - 867 - - -Armenia 283 14 259 0 0 10Azerbaijan 936 400 516 - - 20
Annex 3: <strong>Global</strong> tables 223TABLE 8Characteristics of forest and other wooded land <strong>2005</strong> (1 000 ha)Other wooded landCountry/areaTotal area Primary Modified Semi-natural Productive Protectivenatural plantation plantation31 - - - - - Equatorial Guinea- - - - - - Gabon125 - 125 - - - Gambia0 - - - - - Ghana5 850 - - - - - Guinea236 - - - - - Guinea-Bissau0 - - - - - Liberia5 495 0 5 495 - 0 0 Nigeria61 - 61 - - - Rwanda0 - - - - - Saint Helena29 - - - - - Sao Tome and Principe5 001 600 4 352 - 0 49 Senegal384 - 198 - - - Sierra Leone1 246 0 1 246 - - - Togo144 468 Total Western and Central Africa406 100 Total Africa87 615 - 71 421 16 194 - - China- - - - - -Democratic People’sRepublic of Korea- - - - - - Japan2 388 1 102 1 273 - - 13 Mongolia- - - - - - Republic of Korea90 003 Total East Asia58 - - - - - Bangladesh611 98 417 96 0 0 Bhutan160 - - 156 3 1 Brunei Darussalam270 - 270 - - - Cambodia4 110 - 2 046 1 745 104 215 India- - - - - - Indonesia4 643 - - - - - Lao People’s Democratic Republic- - - - - - Malaysia0 - - - - - Maldives10 834 - 10 834 - - - Myanmar1 897 - - 1 897 - - Nepal1 389 - 1 389 - - - Pakistan3 611 - - - - - Philippines0 - - - - - Singapore0 - - - - - Sri Lanka- - - - - - Thailand- - - - - - Timor-Leste2 259 - - - - - Viet Nam29 842 Total South and Southeast Asia- - - - - - Afghanistan45 - 42 0 0 3 Armenia54 15 39 0 0 0 Azerbaijan
224<strong>Global</strong> <strong>Forest</strong> <strong>Resources</strong> <strong>Assessment</strong> <strong>2005</strong>Country/areaTABLE 8Characteristics of forest and other wooded land <strong>2005</strong> (1 000 ha)<strong>Forest</strong>Total area Primary Modified Semi-natural Productive Protectivenatural plantation plantationBahrain n.s. - - - - n.s.Cyprus 174 22 111 36 0 5Georgia 2 760 500 2 200 0 0 60Iran (Islamic Republic of) 11 075 200 10 031 228 616 -Iraq 822 0 809 0 0 13Israel 171 - 70 - - 101Jordan 83 0 37 6 0 40Kazakhstan 3 337 0 2 428 0 0 909Kuwait 6 - - - - 6Kyrgyzstan 869 241 562 - 24 42Lebanon 136 0 129 0 8 0Occupied Palestinian Territory 9 - - - - -Oman 2 - - - - 2Qatar n.s. - - - - -Saudi Arabia 2 728 - 2 728 - - -Syrian Arab Republic 461 - 198 - - 264Tajikistan 410 297 12 35 22 44Turkey 10 175 975 5 925 738 1 916 621Turkmenistan 4 127 104 4 023 - 0 -United Arab Emirates 312 0 0 0 0 312Uzbekistan 3 295 57 2 643 534 5 56Yemen 549 - 161 388 - -Total Western and Central Asia 43 588Total Asia 571 577Albania 794 85 621 0 3 86Andorra 16 - - - - -Austria 3 862 - - - - -Belarus 7 894 400 5 712 1 780 2 -Belgium 667 0 0 392 275 0Bosnia and Herzegovina 2 185 2 1 184 857 142 -Bulgaria 3 625 - - - - -Channel Islands 1 - - - - -Croatia 2 135 10 2 063 0 61 0Czech Republic 2 648 0 14 2 634 0 0Denmark 500 0 6 179 281 34Estonia 2 284 142 1 390 751 1 0Faeroe Islands n.s. - - - - -Finland 22 500 1 419 0 21 081 0 0France 15 554 30 - 13 556 1 968 -Germany 11 076 0 0 11 076 0 0Gibraltar 0 - - - - -Greece 3 752 0 3 618 0 0 134Holy See 0 - - - - -Hungary 1 976 0 415 1 016 454 91Iceland 46 0 17 0 17 12Ireland 669 0 0 90 579 0Isle of Man 3 - - - - -
Annex 3: <strong>Global</strong> tables 225TABLE 8Characteristics of forest and other wooded land <strong>2005</strong> (1 000 ha)Other wooded landCountry/areaTotal area Primary Modified Semi-natural Productive Protectivenatural plantation plantation0 - - - - - Bahrain214 - 214 - - - Cyprus50 0 50 0 0 0 Georgia5 340 - 5 340 - - - Iran (Islamic Republic of)927 0 927 0 0 0 Iraq85 - 85 - - - Israel52 0 42 10 0 - Jordan15 622 0 15 561 0 0 61 Kazakhstan0 - - - - - Kuwait313 - - - - - Kyrgyzstan106 0 106 0 0 0 Lebanon- - - - - - Occupied Palestinian Territory1 303 - 1 303 - - - Omann.s. - - - - - Qatar34 155 - 34 155 - - - Saudi Arabia35 - 35 - - - Syrian Arab Republic142 0 10 10 0 122 Tajikistan10 689 359 2 256 - - - Turkey0 0 0 0 0 0 Turkmenistan4 4 0 0 0 0 United Arab Emirates904 - 904 - - - Uzbekistan1 406 - 1 406 - - - Yemen71 446 Total Western and Central Asia191 291 Total Asia261 0 261 0 n.s. 0 Albania- - - - - - Andorra118 - 118 - - - Austria914 0 714 200 0 - Belarus27 0 0 27 0 0 Belgium549 - 549 - - - Bosnia and Herzegovina27 0 0 27 0 0 Bulgaria0 - - - - - Channel Islands346 2 344 0 0 0 Croatia0 - - - - - Czech Republic136 - - - - - Denmark82 0 82 0 0 0 Estonia- - - - - - Faeroe Islands802 326 0 476 0 0 Finland1 708 - - 1 708 - - France- - - - - - Germany0 - - - - - Gibraltar2 780 0 2 780 0 0 0 Greece0 - - - - - Holy See0 0 0 0 0 0 Hungary104 0 104 0 0 0 Iceland41 1 40 0 0 0 Ireland0 - - - - - Isle of Man
226<strong>Global</strong> <strong>Forest</strong> <strong>Resources</strong> <strong>Assessment</strong> <strong>2005</strong>Country/areaTABLE 8Characteristics of forest and other wooded land <strong>2005</strong> (1 000 ha)<strong>Forest</strong>Total area Primary Modified Semi-natural Productive Protectivenatural plantation plantationItaly 9 979 - - - 146 -Latvia 2 941 14 2 282 644 1 0Liechtenstein 7 2 5 - n.s. -Lithuania 2 099 26 1 548 384 100 41Luxembourg 87 - - 58 28 -Malta n.s. 0 0 0 0 n.s.Monaco 0 - - - - -Netherlands 365 0 0 361 4 0Norway 9 387 250 - 8 875 262 -Poland 9 192 53 - 9 107 32 -Portugal 3 783 55 - 2 494 1 067 167Republic of Moldova 329 0 328 0 1 0Romania 6 370 233 651 5 339 92 57Russian Federation 808 790 255 470 536 358 - 11 888 5 075San Marino n.s. - - - - -Serbia and Montenegro 2 694 4 115 2 536 39 0Slovakia 1 929 24 946 940 17 2Slovenia 1 264 119 1 107 38 0 0Spain 17 915 812 11 582 4 050 1 471 0Sweden 27 528 4 726 - 22 135 667 0Switzerland 1 221 14 15 1 188 4 0The former Yugoslav Republicof Macedonia906 0 876 - 30 -Ukraine 9 575 59 4 729 4 399 81 307United Kingdom 2 845 0 646 275 1 902 22Total Europe 1 001 394Anguilla 6 - - - - -Antigua and Barbuda 9 - - - - -Aruba n.s. - - - - -Bahamas 515 - 515 - 0 0Barbados 2 - 2 - - -Bermuda 1 - - - - -British Virgin Islands 4 - - - - -Cayman Islands 12 - - - - -Cuba 2 713 - 2 319 - 230 164Dominica 46 27 19 0 n.s. -Dominican Republic 1 376 - - - - -Grenada 4 1 3 - n.s. -Guadeloupe 80 19 58 2 1 0Haiti 105 - 81 - 24 -Jamaica 339 - 325 - 8 6Martinique 46 - 45 - 1 -Montserrat 4 - 4 - - -Netherlands Antilles 1 - - - - -Puerto Rico 408 - - - - -Saint Kitts and Nevis 5 - - - - -Saint Lucia 17 - - - - -
Annex 3: <strong>Global</strong> tables 227TABLE 8Characteristics of forest and other wooded land <strong>2005</strong> (1 000 ha)Other wooded landCountry/areaTotal area Primary Modified Semi-natural Productive Protectivenatural plantation plantation1 047 - - - - - Italy115 - - - - - Latvia0 n.s. n.s. - - - Liechtenstein77 - 77 - - - Lithuania1 - - - - - Luxembourg0 - - - - - Malta0 - - - - - Monaco0 - - - - - Netherlands2 613 261 2 352 0 0 - Norway- - - - - - Poland84 44 40 - 0 - Portugal31 0 31 0 0 0 Republic of Moldova258 - - - - - Romania74 185 73 169 - 0 0 1 016 Russian Federation0 - - - - - San Marino808 0 686 122 0 0 Serbia and Montenegro- - - - - - Slovakia44 - - - - - Slovenia10 299 0 10 299 0 0 0 Spain3 257 3 166 91 0 0 0 Sweden67 0 0 67 0 0 Switzerland82 0 82 - - -The former Yugoslav Republicof Macedonia41 0 20 20 0 0 Ukraine20 0 10 10 0 0 United Kingdom100 925 Total Europe- - - - - - Anguilla16 - - - - - Antigua and Barbuda0 - - - - - Aruba36 - 36 - 0 0 Bahamas- - - - - - Barbados0 - - - - - Bermuda2 - - - - - British Virgin Islands4 - - - - - Cayman Islands260 - - - 170 90 Cuban.s. n.s. - - 0 - Dominica678 - - - - - Dominican Republic5 - - - - - Grenada2 2 0 0 0 0 Guadeloupe- - - - - - Haiti188 - 167 - - 21 Jamaica- - - - - - Martinique- - - - - - Montserrat33 - - - - - Netherlands Antilles- - - - - - Puerto Rico6 - - - - - Saint Kitts and Nevis5 - - - - - Saint Lucia
228<strong>Global</strong> <strong>Forest</strong> <strong>Resources</strong> <strong>Assessment</strong> <strong>2005</strong>Country/areaTABLE 8Characteristics of forest and other wooded land <strong>2005</strong> (1 000 ha)<strong>Forest</strong>Total area Primary Modified Semi-natural Productive Protectivenatural plantation plantationSaint Vincent and the Grenadines 11 - 10 - n.s. -Trinidad and Tobago 226 14 197 0 15 0Turks and Caicos Islands 34 - - - - -United States Virgin Islands 10 - - - - -Total Caribbean 5 974Belize 1 653 612 1 041 - - -Costa Rica 2 391 180 1 319 888 1 3El Salvador 298 6 286 - 6 -Guatemala 3 938 1 957 1 859 - 122 -Honduras 4 648 1 512 2 261 845 - 30Nicaragua 5 189 1 849 3 289 - 51 -Panama 4 294 3 023 1 210 0 60 1Total Central America 22 411Canada 310 134 165 424 144 710 - - -Greenland n.s. - - - - -Mexico 64 238 32 850 30 330 - 72 986Saint Pierre and Miquelon 3 - 3 - - -United States of America 303 089 104 182 175 523 6 323 17 061 -Total North America 677 464Total North and Central America 705 849American Samoa 18 - - - - -Australia 163 678 5 233 156 679 - 1 766 -Cook Islands 16 - 14 - - 1Fiji 1 000 894 5 - 101 -French Polynesia 105 - 95 - 10 -Guam 26 - - - - -Kiribati 2 - - - - -Marshall Islands - - - - - -Micronesia (Federated States of) 63 - - - - -Nauru 0 - - - - -New Caledonia 717 431 277 - 10 -New Zealand 8 309 3 506 2 951 - 1 832 20Niue 14 - 14 - n.s. -Northern Mariana Islands 33 - - - - -Palau 40 - - - - -Papua New Guinea 29 437 25 211 4 134 - 92 -Pitcairn 4 - - - - -Samoa 171 n.s. 110 29 21 11Solomon Islands 2 172 - - - - -Tokelau 0 - - - - -Tonga 4 - 4 - n.s. -Tuvalu 1 - - - - -Vanuatu 440 - - - - -Wallis and Futuna Islands 5 n.s. 4 0 1 0Total Oceania 206 254
Annex 3: <strong>Global</strong> tables 229TABLE 8Characteristics of forest and other wooded land <strong>2005</strong> (1 000 ha)Other wooded landCountry/areaTotal area Primary Modified Semi-natural Productive Protectivenatural plantation plantation2 - 2 - - - Saint Vincent and the Grenadines74 - 74 - - - Trinidad and Tobago- - - - - - Turks and Caicos Islands- - - - - - United States Virgin Islands1 310 Total Caribbean115 0 115 - - - Belize10 - 10 - - - Costa Rica201 - 201 - - - El Salvador1 672 - - - - - Guatemala710 - 710 - - - Honduras1 022 - 1 022 - - - Nicaragua1 288 0 1 288 0 0 0 Panama5 018 Total Central America91 951 69 855 22 096 - - - Canada8 - - - - - Greenland19 908 17 482 2 426 - - - Mexico- - - - - - Saint Pierre and Miquelon- - - - - - United States of America111 866 Total North America118 194 Total North and Central America- - - - - - American Samoa421 590 - - - - - Australia- - - - - - Cook Islands- - - - - - Fiji- - - - - - French Polynesia0 - - - - - Guam- - - - - - Kiribati- - - - - - Marshall Islands- - - - - - Micronesia (Federated States of)0 - - - - - Nauru787 412 375 - - - New Caledonia2 557 411 2 146 - - - New Zealand- - - - - - Niue- - - - - - Northern Mariana Islands- - - - - - Palau4 474 - - - - - Papua New Guinea0 - - - - - Pitcairn22 - 11 4 4 2 Samoa- - - - - - Solomon Islands0 - - - - - Tokelau1 - 1 - - - Tonga0 - - - - - Tuvalu476 - - - - - Vanuatu1 0 1 0 0 0 Wallis and Futuna Islands429 908 Total Oceania
230<strong>Global</strong> <strong>Forest</strong> <strong>Resources</strong> <strong>Assessment</strong> <strong>2005</strong>Country/areaTABLE 8Characteristics of forest and other wooded land <strong>2005</strong> (1 000 ha)<strong>Forest</strong>Total area Primary Modified Semi-natural Productive Protectivenatural plantation plantationArgentina 33 021 - 31 792 - 1 229 -Bolivia 58 740 29 360 29 360 - 20 -Brazil 477 698 415 890 56 424 - 5 384 -Chile 16 121 4 142 9 292 26 2 661 0Colombia 60 728 53 062 7 337 - 312 16Ecuador 10 853 4 794 5 895 - 164 -Falkland Islands 0 - - - - -French Guiana 8 063 7 701 361 0 1 0Guyana 15 104 9 314 5 789 - - -Paraguay 18 475 1 850 16 582 - 43 -Peru 68 742 61 065 6 923 0 754 -South Georgia andthe South Sandwich Islands0 - - - - -Suriname 14 776 14 214 550 5 7 0Uruguay 1 506 296 444 - 751 15Venezuela (Bolivarian Republic of) 47 713 - - - - -Total South America 831 540WORLD 3 952 025
Annex 3: <strong>Global</strong> tables 231TABLE 8Characteristics of forest and other wooded land <strong>2005</strong> (1 000 ha)Other wooded landCountry/areaTotal area Primary Modified Semi-natural Productive Protectivenatural plantation plantation60 961 - - - - - Argentina2 473 - - - - - Bolivia- - - - - - Brazil13 241 0 13 185 0 56 0 Chile18 202 18 039 163 - - - Colombia1 448 - 1 448 - - - Ecuador0 - - - - - Falkland Islands0 0 0 0 0 0 French Guiana3 580 - 3 580 - - - Guyana- - - - - - Paraguay22 132 2 213 19 919 - 0 - Peru0 - - - - -South Georgia andthe South Sandwich Islands- - - - - - Suriname4 - 4 - - - Uruguay7 369 - - - - - Venezuela (Bolivarian Republic of)129 410 Total South America1 375 829 WORLD
232<strong>Global</strong> <strong>Forest</strong> <strong>Resources</strong> <strong>Assessment</strong> <strong>2005</strong>TABLE 9Change in extent of primary forest 1990–<strong>2005</strong>Country/area Area of primary forest % of total forest area Annual change rate(1 000 ha) (ha/year)1990 2000 <strong>2005</strong> 1990 2000 <strong>2005</strong> 1990–2000 2000–<strong>2005</strong>Angola 0 0 0 0 0 0 0 0Botswana - - - - - - - -British Indian Ocean Territory - - - - - - - -Comoros 0 0 0 0 0 0 0 0Kenya 742 716 704 20.0 20.0 20.0 -2 520 -2 400Lesotho 1 1 1 12.0 8.6 7.5 0 0Madagascar 10 503 10 381 10 347 76.7 79.7 80.6 -12 200 -6 800Malawi 1 727 1 330 1 132 44.3 37.3 33.3 -39 700 -39 600Mauritius 0 0 0 0 0 0 0 0Mayotte - - - - - - - -Mozambique - - - - - - - -Namibia - - - - - - - -Réunion 55 55 55 63.0 63.0 65.0 -30 -20Seychelles 2 2 2 5.0 5.0 5.0 0 0South Africa - - - - - - - -Swaziland - - - - - - - -Uganda - - - - - - - -United Republic of Tanzania - - - - - - - -Zambia - - - - - - - -Zimbabwe - - - - - - - -Total Eastern and Southern AfricaAlgeria - - - - - - - -Burkina Faso 0 0 0 0 0 0 0 0Chad 209 196 190 1.6 1.6 1.6 -1 300 -1 200Djibouti - - - - - - - -Egypt - - - - - - - -Eritrea - - - - - - - -Ethiopia - - - - - - - -Libyan Arab Jamahiriya - - - - - - - -Mali - - - - - - - -Mauritania - - - - - - - -Morocco - - - - - - - -Niger 220 220 220 11.3 16.6 17.4 0 0Somalia - - - - - - - -Sudan 15 276 14 098 13 509 20.0 20.0 20.0 -117 807 -117 807Tunisia - - - - - - - -Western Sahara - - - - - - - -Total Northern AfricaBenin - - - - - - - -Burundi - 0 0 - 0 0 - 0Cameroon - - - - - - - -Cape Verde - - - - - - - -Central African Republic - - - - - - - -Congo 7 548 7 492 7 464 33.2 33.2 33.2 -5 647 -5 647Côte d’Ivoire 625 625 625 6.1 6.1 6.0 0 0Democratic Republic of the Congo - - - - - - - -
Annex 3: <strong>Global</strong> tables 233TABLE 9Change in extent of primary forest 1990–<strong>2005</strong>Country/area Area of primary forest % of total forest area Annual change rate(1 000 ha) (ha/year)1990 2000 <strong>2005</strong> 1990 2000 <strong>2005</strong> 1990–2000 2000–<strong>2005</strong>Equatorial Guinea - - - - - - - -Gabon - - - - - - - -Gambia - - - - - - - -Ghana 353 353 353 4.7 5.8 6.4 0 0Guinea 63 63 63 0.9 0.9 0.9 0 0Guinea-Bissau 940 940 940 42.4 44.3 45.4 0 0Liberia 129 129 129 3.2 3.7 4.1 0 0Nigeria 1 556 736 326 9.0 5.6 2.9 -82 000 -82 000Rwanda 0 0 0 0 0 0 0 0Saint Helena - - - - - - - -Sao Tome and Principe 12 12 12 43.8 43.8 43.8 0 0Senegal 1 759 1 653 1 598 18.8 18.6 18.4 -10 600 -11 000Sierra Leone - - - - - - - -Togo 0 0 0 0 0 0 0 0Total Western and Central AfricaTotal AfricaChina 11 632 11 632 11 632 7.4 6.6 5.9 0 0Democratic People’sRepublic of Korea1 129 939 852 13.8 13.8 13.8 -19 000 -17 400Japan 3 764 4 054 4 591 15.1 16.3 18.5 29 000 107 400Mongolia 5 540 4 923 4 733 48.2 46.2 46.2 -61 700 -38 000Republic of Korea - - - - - - - -Total East AsiaBangladesh - - - - - - - -Bhutan 413 413 413 13.6 13.1 12.9 0 0Brunei Darussalam 313 288 278 100 100 100 -2 500 -2 000Cambodia 766 456 322 5.9 4.0 3.1 -31 000 -26 800India - - - - - - - -Indonesia 70 419 55 941 48 702 60.4 57.2 55 -1 447 800 -1 447 800Lao People’s Democratic Republic 1 490 1 490 1 490 8.6 9.0 9.2 0 0Malaysia 3 820 3 820 3 820 17.1 17.7 18.3 0 0Maldives - - - - - - - -Myanmar - - - - - - - -Nepal 391 384 349 8.1 9.8 9.6 -700 -7 000Pakistan - - - - - - - -Philippines 829 829 829 7.8 10.4 11.6 0 0Singapore 2 2 2 100 100 100 0 0Sri Lanka 257 197 167 10.9 9.5 8.6 -6 000 -6 000Thailand 6 451 6 451 6 451 40.4 43.5 44.4 0 0Timor-Leste - - - - - - - -Viet Nam 384 187 85 4.1 1.6 0.7 -19 700 -20 400Total South and Southeast AsiaAfghanistan - - - - - - - -Armenia 17 15 14 4.9 4.9 4.9 -200 -200Azerbaijan 400 400 400 42.7 42.7 42.7 0 0
234<strong>Global</strong> <strong>Forest</strong> <strong>Resources</strong> <strong>Assessment</strong> <strong>2005</strong>TABLE 9Change in extent of primary forest 1990–<strong>2005</strong>Country/area Area of primary forest % of total forest area Annual change rate(1 000 ha) (ha/year)1990 2000 <strong>2005</strong> 1990 2000 <strong>2005</strong> 1990–2000 2000–<strong>2005</strong>Bahrain - - - - - - - -Cyprus 22 22 22 13.7 12.7 12.6 0 0Georgia 500 500 500 18.1 18.1 18.1 0 0Iran (Islamic Republic of) 200 200 200 1.8 1.8 1.8 0 0Iraq 0 0 0 0 0 0 0 0Israel - - - - - - - -Jordan 0 0 0 0 0 0 0 0Kazakhstan 0 0 0 0 0 0 0 0Kuwait - - - - - - - -Kyrgyzstan 237 240 241 28.4 27.9 27.7 250 260Lebanon - - 0 - - 0 - -Occupied Palestinian Territory - - - - - - - -Oman - - - - - - - -Qatar - - - - - - - -Saudi Arabia - - - - - - - -Syrian Arab Republic - - - - - - - -Tajikistan 297 297 297 72.8 72.4 72.4 0 0Turkey 739 897 975 7.6 8.9 9.6 15 800 15 600Turkmenistan 104 104 104 2.5 2.5 2.5 0 0United Arab Emirates 0 0 0 0 0 0 0 0Uzbekistan 57 57 57 1.9 1.8 1.7 0 0Yemen - - - - - - - -Total Western and Central AsiaTotal AsiaAlbania 85 85 85 10.7 11.0 10.7 0 0Andorra - - - - - - - -Austria 117 119 - 3.1 3.1 - 200 -Belarus 400 400 400 5.4 5.1 5.1 0 0Belgium 0 0 0 0 0 0 0 0Bosnia and Herzegovina - 2 2 - 0.1 0.1 - 0Bulgaria 267 396 - 8.0 11.7 - 12 900 -Channel Islands - - - - - - - -Croatia 10 10 10 0.5 0.5 0.5 0 0Czech Republic 0 0 0 0 0 0 0 0Denmark 0 0 0 0 0 0 0 0Estonia - 137 142 - 6.1 6.2 - 1 000Faeroe Islands - - - - - - - -Finland 1 491 1 418 1 419 6.7 6.3 6.3 -7 300 200France 30 30 30 0.2 0.2 0.2 0 0Germany 0 0 0 0 0 0 0 0Gibraltar - - - - - - - -Greece 0 0 0 0 0 0 0 0Holy See - - - - - - - -Hungary 0 0 0 0 0 0 0 0Iceland 0 0 0 0 0 0 0 0Ireland 1 0 0 0.2 0 0 -100 0Isle of Man - - - - - - - -
Annex 3: <strong>Global</strong> tables 235TABLE 9Change in extent of primary forest 1990–<strong>2005</strong>Country/area Area of primary forest % of total forest area Annual change rate(1 000 ha) (ha/year)1990 2000 <strong>2005</strong> 1990 2000 <strong>2005</strong> 1990–2000 2000–<strong>2005</strong>Italy 160 160 - 1.9 1.7 - 0 -Latvia - 15 14 - 0.5 0.5 - -280Liechtenstein 2 2 2 23.1 21.7 21.7 0 0Lithuania 20 21 26 1.0 1.0 1.2 100 1 000Luxembourg - - - - - - - -Malta 0 0 0 0 0 0 0 0Monaco - - - - - - - -Netherlands 0 0 0 0 0 0 0 0Norway 250 250 250 2.7 2.7 2.7 0 0Poland 30 51 53 0.3 0.6 0.6 2 100 400Portugal 55 55 55 1.8 1.5 1.5 0 0Republic of Moldova 0 0 0 0 0 0 0 0Romania 233 233 233 3.7 3.7 3.7 0 0Russian Federation 241 726 258 131 255 470 29.9 31.9 31.6 1 640 510 -532 200San Marino - - - - - - - -Serbia and Montenegro 4 4 4 0.2 0.2 0.1 0 0Slovakia 24 24 24 1.2 1.2 1.2 0 0Slovenia 63 95 119 5.3 7.7 9.4 3 200 4 800Spain 621 748 812 4.6 4.6 4.5 12 700 12 800Sweden 4 348 4 600 4 726 15.9 16.7 17.2 25 200 25 200Switzerland 3 6 14 0.3 0.5 1.1 300 1 600The former Yugoslav Republicof Macedonia0 0 0 0 0 0 0 0Ukraine 59 59 59 0.6 0.6 0.6 0 0United Kingdom 0 0 0 0 0 0 0 0Total EuropeAnguilla - - - - - - - -Antigua and Barbuda - - - - - - - -Aruba - - - - - - - -Bahamas - - - - - - - -Barbados - - - - - - - -Bermuda - - - - - - - -British Virgin Islands - - - - - - - -Cayman Islands - - - - - - - -Cuba - - - - - - - -Dominica 28 28 27 56.8 58.2 59.0 -86 -84Dominican Republic - - - - - - - -Grenada 1 1 1 24.1 18.7 16.0 -22 -23Guadeloupe 19 19 19 22.3 23.0 23.3 0 0Haiti - - - - - - - -Jamaica - - - - - - - -Martinique - - - - - - - -Montserrat - - - - - - - -Netherlands Antilles - - - - - - - -Puerto Rico - - - - - - - -Saint Kitts and Nevis - - - - - - - -Saint Lucia - - - - - - - -
236<strong>Global</strong> <strong>Forest</strong> <strong>Resources</strong> <strong>Assessment</strong> <strong>2005</strong>TABLE 9Change in extent of primary forest 1990–<strong>2005</strong>Country/area Area of primary forest % of total forest area Annual change rate(1 000 ha) (ha/year)1990 2000 <strong>2005</strong> 1990 2000 <strong>2005</strong> 1990–2000 2000–<strong>2005</strong>Saint Vincent and the Grenadines - - - - - - - -Trinidad and Tobago 14 14 14 6.0 6.1 6.2 0 0Turks and Caicos Islands - - - - - - - -United States Virgin Islands - - - - - - - -Total CaribbeanBelize 612 612 612 37.0 37.0 37.0 0 0Costa Rica 255 180 180 9.9 7.6 7.5 -7 500 0El Salvador 6 6 6 1.7 2.0 2.2 0 0Guatemala 2 359 2 091 1 957 49.7 49.7 49.7 -26 789 -26 834Honduras 1 512 1 512 1 512 20.5 27.8 32.5 0 0Nicaragua 1 849 1 849 1 849 28.3 33.4 35.6 0 0Panama 3 706 3 239 3 023 84.7 75.2 70.4 -46 700 -43 200Total Central AmericaCanada 165 424 165 424 165 424 53.3 53.3 53.3 0 0Greenland - - - - - - - -Mexico 38 775 34 825 32 850 56.2 53.1 51.1 -395 000 -395 000Saint Pierre and Miquelon - - - - - - - -United States of America 105 268 105 258 104 182 35.2 34.8 34.4 -1 000 -215 200Total North AmericaTotal North and Central AmericaAmerican Samoa - - - - - - - -Australia - 5 233 5 233 - 3.2 3.2 - 0Cook Islands - - - - - - - -Fiji 895 894 894 91.4 89.4 89.4 -100 0French Polynesia - - - - - - - -Guam - - - - - - - -Kiribati - - - - - - - -Marshall Islands - - - - - - - -Micronesia (Federated States of) - - - - - - - -Nauru - - - - - - - -New Caledonia 431 431 431 60.1 60.1 60.1 0 0New Zealand 3 506 3 506 3 506 45.4 42.6 42.2 0 0Niue - - - - - - - -Northern Mariana Islands - - - - - - - -Palau - - - - - - - -Papua New Guinea 29 210 26 462 25 211 92.7 87.8 85.6 -274 800 -250 200Pitcairn - - - - - - - -Samoa - n.s. n.s. - n.s. n.s. - 0Solomon Islands - - - - - - - -Tokelau - - - - - - - -Tonga - - - - - - - -Tuvalu - - - - - - - -Vanuatu - - - - - - - -Wallis and Futuna Islands 0 n.s. n.s. 8.5 8.8 9.1 -2 -6Total Oceania
Annex 3: <strong>Global</strong> tables 237TABLE 9Change in extent of primary forest 1990–<strong>2005</strong>Country/area Area of primary forest % of total forest area Annual change rate(1 000 ha) (ha/year)1990 2000 <strong>2005</strong> 1990 2000 <strong>2005</strong> 1990–2000 2000–<strong>2005</strong>Argentina - - - - - - - -Bolivia 31 388 30 036 29 360 50.0 50.0 50.0 -135 200 -135 200Brazil 460 513 433 220 415 890 88.6 87.8 87.1 -2 729 300 -3 466 000Chile 4 152 4 145 4 142 27.2 26.2 25.7 -700 -600Colombia 53 854 53 343 53 062 87.7 87.5 87.4 -51 050 -56 160Ecuador 4 794 4 794 4 794 34.7 40.5 44.2 20 -40Falkland Islands - - - - - - - -French Guiana 7 909 7 761 7 701 97.8 96.3 95.5 -14 800 -12 000Guyana - 9 314 9 314 - 61.7 61.7 - 0Paraguay 1 850 1 850 1 850 8.7 9.6 10.0 0 0Peru 62 910 62 188 61 065 89.7 89.9 88.8 -72 200 -224 600South Georgia andthe South Sandwich Islands- - - - - - - -Suriname 14 214 14 214 14 214 96.2 96.2 96.2 0 0Uruguay 239 296 296 26.4 21.0 19.7 5 700 0Venezuela (Bolivarian Republic of) - - - - - - - -Total South AmericaWORLD
238<strong>Global</strong> <strong>Forest</strong> <strong>Resources</strong> <strong>Assessment</strong> <strong>2005</strong>TABLE 10Change in extent of forest plantations a 1990–<strong>2005</strong>Country/area Area of forest plantations % of total forest area Annual change rate(1 000 ha) (ha/year)1990 2000 <strong>2005</strong> 1990 2000 <strong>2005</strong> 1990–2000 2000–<strong>2005</strong>Angola 140 134 131 0.2 0.2 0.2 -562 -564Botswana - - - - - - - -British Indian Ocean Territory - - - - - - - -Comoros 2 2 1 16.7 25.0 26.6 0 -110Kenya 238 212 202 6.4 5.9 5.7 -2 600 -2 000Lesotho 4 6 7 88.0 91.4 92.5 200 200Madagascar 293 293 293 2.1 2.2 2.3 0 0Malawi 132 180 204 3.4 5.0 6.0 4 800 4 800Mauritius 16 15 15 41 39.5 40.5 -100 0Mayotte n.s. n.s. n.s. 4.8 5.0 5.1 0 0Mozambique 38 38 38 0.2 0.2 0.2 0 0Namibia - - - - - - - -Réunion 5 5 5 6.0 6.0 6.0 0 -40Seychelles 5 5 5 12.5 12.5 12.5 0 0South Africa 1 204 1 352 1 426 13.1 14.7 15.5 14 800 14 800Swaziland 135 121 114 28.6 23.4 21.1 -1 400 -1 400Uganda 33 35 36 0.7 0.9 1.0 200 200United Republic of Tanzania 150 150 150 0.4 0.4 0.4 0 0Zambia 60 75 75 0.1 0.2 0.2 1 500 0Zimbabwe 154 154 154 0.7 0.8 0.9 0 0Total Eastern and Southern AfricaAlgeria 620 652 754 34.6 30.4 33.1 3 200 20 400Burkina Faso 33 63 76 0.5 0.9 1.1 3 000 2 600Chad 11 14 15 0.1 0.1 0.1 300 300Djibouti - - - - - - - -Egypt 44 59 67 100 100 100 1 500 1 600Eritrea 10 22 28 0.6 1.4 1.8 1 200 1 160Ethiopia 491 491 491 3.2 3.6 3.8 0 0Libyan Arab Jamahiriya 217 217 217 100 100 100 0 0Mali - 60 - - 0.5 - - -Mauritania - 10 - - 3.2 - - -Morocco 478 523 563 11.1 12.1 12.9 4 500 8 000Niger - 72 110 - 5.5 8.7 - 7 500Somalia 3 3 3 n.s. n.s. n.s. 0 0Sudan 6 111 5 639 5 404 8.0 8.0 8.0 -47 123 -47 123Tunisia 226 423 498 35.1 44.1 47.2 19 700 15 000Western Sahara - - - - - - - -Total Northern AfricaBenin 98 109 114 3.0 4.1 4.8 1 100 1 000Burundi - 86 86 - 43.2 56.2 - 0Cameroon - - - - - - - -Cape Verde 58 82 84 100 100 100 2 435 300Central African Republic 2 4 5 n.s. n.s. n.s. 230 200Congo 51 51 51 0.2 0.2 0.2 0 0Côte d’Ivoire 154 261 337 1.5 2.5 3.2 10 700 15 200Democratic Republic of the Congo - - - - - - - -
Annex 3: <strong>Global</strong> tables 239TABLE 10Change in extent of forest plantations a 1990–<strong>2005</strong>Country/area Area of forest plantations % of total forest area Annual change rate(1 000 ha) (ha/year)1990 2000 <strong>2005</strong> 1990 2000 <strong>2005</strong> 1990–2000 2000–<strong>2005</strong>Equatorial Guinea - - - - - - - -Gabon 36 36 36 0.2 0.2 0.2 0 0Gambia n.s. n.s. n.s. 0.1 0.1 0.1 0 0Ghana 50 60 160 0.7 1.0 2.9 1 000 20 000Guinea 17 22 33 0.2 0.3 0.5 546 2 040Guinea-Bissau n.s. n.s. 1 n.s. n.s. n.s. 15 34Liberia 8 8 8 0.2 0.2 0.3 0 0Nigeria 251 316 349 1.5 2.4 3.1 6 500 6 600Rwanda 248 282 419 78.0 82.1 87.2 3 450 27 220Saint Helena - - - - - - - -Sao Tome and Principe - - - - - - - -Senegal 205 306 365 2.2 3.4 4.2 10 100 11 800Sierra Leone 2 3 3 0.1 0.1 0.1 60 80Togo 24 34 38 3.5 7.0 9.8 1 000 800Total Western and Central AfricaTotal AfricaChina 18 466 23 924 31 369 11.8 13.5 15.9 545 800 1 489 000Democratic People’sRepublic of Korea- - - - - - - -Japan 10 287 10 331 10 321 41.2 41.5 41.5 4 400 -2 000Mongolia 30 75 112 0.3 0.7 1.1 4 500 7 400Republic of Korea 748 1 188 1 364 11.7 18.9 21.8 44 000 35 200Total East AsiaBangladesh 239 276 279 27.1 31.2 32.0 3 700 600Bhutan 1 1 2 n.s. n.s. 0.1 0 200Brunei Darussalam - - - - - - - -Cambodia 67 72 59 0.5 0.6 0.6 500 -2 600India 1 954 2 805 3 226 3.1 4.2 4.8 85 100 84 200Indonesia 2 209 3 002 3 399 1.9 3.1 3.8 79 300 79 400Lao People’s Democratic Republic 4 99 224 n.s. 0.6 1.4 9 500 25 000Malaysia 1 956 1 659 1 573 8.7 7.7 7.5 -29 700 -17 200Maldives - - - - - - - -Myanmar 394 696 849 1.0 2.0 2.6 30 200 30 600Nepal 49 52 53 1.0 1.3 1.5 300 200Pakistan 234 296 318 9.3 14.0 16.7 6 200 4 400Philippines 1 780 852 620 16.8 10.7 8.7 -92 800 -46 400Singapore 0 0 0 0 0 0 0 0Sri Lanka 242 221 195 10.3 10.6 10.1 -2 120 -5 141Thailand 2 640 3 077 3 099 16.5 20.8 21.3 43 700 4 400Timor-Leste 29 43 43 3.0 5.0 5.4 1 400 0Viet Nam 967 2 050 2 695 10.3 17.5 20.8 108 300 129 000Total South and Southeast AsiaAfghanistan - - - - - - - -Armenia 14 11 10 4.0 3.6 3.5 -300 -200Azerbaijan 20 20 20 2.1 2.1 2.1 0 0
240<strong>Global</strong> <strong>Forest</strong> <strong>Resources</strong> <strong>Assessment</strong> <strong>2005</strong>TABLE 10Change in extent of forest plantations a 1990–<strong>2005</strong>Country/area Area of forest plantations % of total forest area Annual change rate(1 000 ha) (ha/year)1990 2000 <strong>2005</strong> 1990 2000 <strong>2005</strong> 1990–2000 2000–<strong>2005</strong>Bahrain n.s. n.s. n.s. 100 100 100 16 15Cyprus 3 3 5 1.9 1.7 2.9 0 400Georgia 54 60 60 2.0 2.2 2.2 600 100Iran (Islamic Republic of) 616 616 616 5.6 5.6 5.6 0 0Iraq 15 15 13 1.9 1.8 1.6 0 -400Israel 84 94 101 54.5 57.3 59.1 1 000 1 400Jordan 40 40 40 47.6 47.6 47.6 0 0Kazakhstan 1 034 1 056 909 30.2 31.4 27.2 2 200 -29 400Kuwait 3 5 6 100 100 100 140 140Kyrgyzstan 46 59 66 5.4 6.9 7.6 1 380 1 380Lebanon - - 8 - - 5.7 - -Occupied Palestinian Territory - - - - - - - -Oman 2 2 2 100 100 100 0 0Qatar - - - - - - - -Saudi Arabia - - - - - - - -Syrian Arab Republic 175 234 264 47.0 54.2 57.3 5 950 5 960Tajikistan 76 66 66 18.6 16.1 16.1 -1 000 0Turkey 1 839 2 304 2 537 19.0 22.9 24.9 46 500 46 600Turkmenistan 0 0 0 0 0 0 0 0United Arab Emirates 245 310 312 100 100 100 6 500 400Uzbekistan 30 51 61 1.0 1.6 1.9 2 100 2 000Yemen - - - - - - - -Total Western and Central AsiaTotal AsiaAlbania 103 96 88 13.1 12.5 11.1 -690 -1 640Andorra - - - - - - - -Austria 988 1 003 - 26.2 26.1 - 1 500 -Belarus 2 2 2 n.s. n.s. n.s. 30 0Belgium 303 284 275 44.8 42.5 41.2 -1 970 -1 700Bosnia and Herzegovina - 142 142 - 6.5 6.5 - 0Bulgaria 40 48 - 1.2 1.4 - 720 -Channel Islands - - - - - - - -Croatia 56 60 61 2.6 2.8 2.9 400 200Czech Republic 0 0 0 0 0 0 0 0Denmark 291 305 315 65.4 62.8 63.0 1 400 2 000Estonia - 1 1 - n.s. n.s. - 0Faeroe Islands - - - - - - - -Finland 0 0 0 0 0 0 0 0France 1 842 1 936 1 968 12.7 12.6 12.7 9 400 6 400Germany 0 0 0 0 0 0 0 0Gibraltar - - - - - - - -Greece 118 129 134 3.6 3.6 3.6 1 100 1 000Holy See - - - - - - - -Hungary 431 528 545 23.9 27.7 27.6 9 670 3 480Iceland 8 21 29 30.4 56.1 62.2 1 370 1 460Ireland 350 519 579 79.4 85.2 86.5 16 900 12 000Isle of Man - - - - - - - -
Annex 3: <strong>Global</strong> tables 241TABLE 10Change in extent of forest plantations a 1990–<strong>2005</strong>Country/area Area of forest plantations % of total forest area Annual change rate(1 000 ha) (ha/year)1990 2000 <strong>2005</strong> 1990 2000 <strong>2005</strong> 1990–2000 2000–<strong>2005</strong>Italy 289 144 146 3.4 1.5 1.5 -14 500 400Latvia - n.s. 1 - n.s. n.s. - 238Liechtenstein n.s. n.s. n.s. 3.1 4.3 4.3 10 0Lithuania 124 137 141 6.4 6.8 6.7 1 300 800Luxembourg 28 28 28 33.0 32.6 32.6 0 0Malta n.s. n.s. n.s. 100 100 100 0 0Monaco - - - - - - - -Netherlands 4 4 4 1.2 1.1 1.1 0 0Norway 222 255 262 2.4 2.7 2.8 3 300 1 400Poland 32 32 32 0.4 0.4 0.3 0 0Portugal 550 1 034 1 234 17.7 28.9 32.6 48 400 40 000Republic of Moldova 1 1 1 0.3 0.3 0.3 0 0Romania 149 149 149 2.3 2.3 2.3 0 0Russian Federation 12 651 15 360 16 962 1.6 1.9 2.1 270 920 320 420San Marino - - - - - - - -Serbia and Montenegro 39 39 39 1.5 1.5 1.4 0 0Slovakia 23 20 19 1.2 1.0 1.0 -300 -200Slovenia 0 0 0 0 0 0 0 0Spain 1 126 1 356 1 471 8.4 8.3 8.2 23 000 23 000Sweden 523 619 667 1.9 2.3 2.4 9 600 9 600Switzerland 3 4 4 0.3 0.3 0.3 100 0The former Yugoslav Republicof Macedonia30 30 30 3.3 3.3 3.3 0 0Ukraine 325 367 388 3.5 3.9 4.1 4 200 4 200United Kingdom 1 877 1 934 1 924 71.9 69.2 67.6 5 700 -2 000Total EuropeAnguilla - - - - - - - -Antigua and Barbuda - - - - - - - -Aruba - - - - - - - -Bahamas 0 0 0 0 0 0 0 0Barbados - - - - - - - -Bermuda - - - - - - - -British Virgin Islands - - - - - - - -Cayman Islands - - - - - - - -Cuba 347 342 394 16.9 14.0 14.5 -500 10 400Dominica - n.s. n.s. - 0.2 0.2 - 0Dominican Republic - - - - - - - -Grenada n.s. n.s. n.s. 5.2 5.2 5.2 0 0Guadeloupe 3 1 1 3.6 1.2 1.3 -200 0Haiti 12 20 24 10.3 18.3 22.9 800 800Jamaica 15 14 14 4.3 4.2 4.3 -40 20Martinique 1 1 1 3.2 3.2 3.2 0 0Montserrat - - - - - - - -Netherlands Antilles - - - - - - - -Puerto Rico - - - - - - - -Saint Kitts and Nevis - - - - - - - -Saint Lucia - - - - - - - -
242<strong>Global</strong> <strong>Forest</strong> <strong>Resources</strong> <strong>Assessment</strong> <strong>2005</strong>TABLE 10Change in extent of forest plantations a 1990–<strong>2005</strong>Country/area Area of forest plantations % of total forest area Annual change rate(1 000 ha) (ha/year)1990 2000 <strong>2005</strong> 1990 2000 <strong>2005</strong> 1990–2000 2000–<strong>2005</strong>Saint Vincent and the Grenadines n.s. n.s. n.s. 1.3 2.4 3.0 13 14Trinidad and Tobago 15 15 15 6.4 6.6 6.6 0 0Turks and Caicos Islands - - - - - - - -United States Virgin Islands - - - - - - - -Total CaribbeanBelize - - - - - - - -Costa Rica - 3 4 - 0.1 0.2 - 200El Salvador 6 6 6 1.6 1.9 2.0 0 0Guatemala 32 88 122 0.7 2.1 3.1 5 600 6 800Honduras 31 26 30 0.4 0.5 0.6 -500 800Nicaragua 4 46 51 0.1 0.8 1.0 4 200 1 000Panama 10 42 61 0.2 1.0 1.4 3 200 3 800Total Central AmericaCanada - - - - - - - -Greenland - - - - - - - -Mexico - 1 058 1 058 - 1.6 1.6 - 0Saint Pierre and Miquelon - - - - - - - -United States of America 10 305 16 274 17 061 3.5 5.4 5.6 596 900 157 400Total North AmericaTotal North and Central AmericaAmerican Samoa - - - - - - - -Australia 1 023 1 485 1 766 0.6 0.9 1.1 46 200 56 200Cook Islands 0 1 1 3.4 7.1 7.1 60 0Fiji 80 101 101 8.2 10.1 10.1 2 100 0French Polynesia 10 10 10 9.5 9.5 9.5 0 0Guam - - - - - - - -Kiribati - - - - - - - -Marshall Islands - - - - - - - -Micronesia (Federated States of) - - - - - - - -Nauru - - - - - - - -New Caledonia 10 10 10 1.4 1.4 1.4 0 0New Zealand 1 261 1 769 1 852 16.3 21.5 22.3 50 800 16 600Niue n.s. n.s. n.s. 0.1 1.9 2.1 28 0Northern Mariana Islands - - - - - - - -Palau - - - - - - - -Papua New Guinea 63 82 92 0.2 0.3 0.3 1 960 1 980Pitcairn - - - - - - - -Samoa - 32 32 - 18.7 18.7 - 0Solomon Islands - - - - - - - -Tokelau - - - - - - - -Tonga n.s. n.s. n.s. 0.6 0.6 0.6 0 0Tuvalu - - - - - - - -Vanuatu - - - - - - - -Wallis and Futuna Islands n.s. 0 1 3.4 9.2 10.8 30 6Total Oceania
Annex 3: <strong>Global</strong> tables 243TABLE 10Change in extent of forest plantations a 1990–<strong>2005</strong>Country/area Area of forest plantations % of total forest area Annual change rate(1 000 ha) (ha/year)1990 2000 <strong>2005</strong> 1990 2000 <strong>2005</strong> 1990–2000 2000–<strong>2005</strong>Argentina 769 1 078 1 229 2.2 3.2 3.7 30 900 30 200Bolivia 20 20 20 n.s. n.s. n.s. 0 0Brazil 5 070 5 279 5 384 1.0 1.1 1.1 20 900 21 000Chile 1 741 2 354 2 661 11.4 14.9 16.5 61 300 61 400Colombia 136 254 328 0.2 0.4 0.5 11 750 14 880Ecuador - 162 164 - 1.4 1.5 - 560Falkland Islands - - - - - - - -French Guiana 1 1 1 n.s. n.s. n.s. 0 0Guyana - - - - - - - -Paraguay 23 36 43 0.1 0.2 0.2 1 300 1 400Peru 263 715 754 0.4 1.0 1.1 45 200 7 800South Georgia andthe South Sandwich Islands- - - - - - - -Suriname 7 7 7 n.s. n.s. n.s. 0 0Uruguay 201 669 766 22.2 47.5 50.9 46 800 19 400Venezuela (Bolivarian Republic of) - - - - - - - -Total South AmericaWORLDaProductive and protective forest plantations combined.
244<strong>Global</strong> <strong>Forest</strong> <strong>Resources</strong> <strong>Assessment</strong> <strong>2005</strong>TABLE 11Growing stock a in forest and other wooded land <strong>2005</strong>Country/area <strong>Forest</strong> Other wooded landArea Growing stock Area Total growing(1 000 ha) (1 000 ha) stockBy area Total Commercial (million m³)(m³/ha) (million m³) (%)Angola 59 104 39 2 291 1.1 - -Botswana b 11 943 16 197 - 34 791 573British Indian Ocean Territory 3 - - - 0 -Comoros 5 247 1 26.9 - -Kenya 3 522 80 281 10.8 34 920 -Lesotho 8 - - - 31 n.s.Madagascar 12 838 171 2 201 28.3 17 054 -Malawi 3 402 110 373 - - -Mauritius 37 82 3 68.0 15 n.s.Mayotte 5 - - - - -Mozambique 19 262 26 496 14.4 40 919 745Namibia 7 661 24 184 - 8 473 44Réunion 84 - - - 55 -Seychelles 40 75 3 12.0 - -South Africa 9 203 69 635 38.1 21 409 428Swaziland 541 35 19 - 289 3Uganda 3 627 43 156 15.0 1 150 8United Republic of Tanzania 35 257 36 1 264 73.3 4 756 48Zambia 42 452 31 1 307 7.1 3 161 44Zimbabwe 17 540 34 600 3.8 - -Total Eastern and Southern Africa 226 534 44Algeria 2 277 76 174 22.0 1 595 -Burkina Faso 6 794 35 238 4.6 7 427 10Chad 11 921 18 218 38.1 9 152 67Djibouti 6 32 n.s. - 220 -Egypt 67 120 8 - 20 n.s.Eritrea 1 554 - - - 7 257 -Ethiopia 13 000 22 285 25.0 44 650 103Libyan Arab Jamahiriya 217 36 8 - 330 4Mali b 12 572 15 191 - 16 532 252Mauritania 267 20 5 - 3 110 -Morocco 4 364 44 191 100 406 1Niger 1 266 10 13 8.1 3 740 12Somalia 7 131 22 157 n.s. - -Sudan 67 546 14 939 - - -Tunisia 1 056 26 27 2.3 170 1Western Sahara 1 011 38 38 - - -Total Northern Africa 131 048 19Benin 2 351 - - - 3 959 -Burundi 152 - - - 722 -Cameroon 21 245 62 1 313 10.1 14 758 -Cape Verde 84 144 12 80.0 - -Central African Republic 22 755 167 3 801 - 10 122 -Congo 22 471 203 4 551 30.0 10 547 480Côte d’Ivoire 10 405 258 2 683 19.9 2 626 -
Annex 3: <strong>Global</strong> tables 245TABLE 11Growing stock a in forest and other wooded land <strong>2005</strong>Country/area <strong>Forest</strong> Other wooded landArea Growing stock Area Total growing(1 000 ha) (1 000 ha) stockBy area Total Commercial (million m³)(m³/ha) (million m³) (%)Democratic Republic of the Congo 133 610 231 30 833 - 83 277 -Equatorial Guinea 1 632 66 107 - 31 -Gabon 21 775 223 4 845 - - -Gambia 471 37 18 - 125 2Ghana 5 517 58 321 53.3 0 -Guinea 6 724 77 520 - 5 850 -Guinea-Bissau 2 072 24 50 20.0 236 1Liberia 3 154 158 498 41.5 0 -Nigeria 11 089 125 1 386 10.9 5 495 -Rwanda 480 183 88 95.1 61 2Saint Helena 2 - - - 0 -Sao Tome and Principe 27 164 4 100 29 -Senegal 8 673 37 324 63.3 5 001 23Sierra Leone 2 754 - - - 384 -Togo 386 - - - 1 246 -Total Western and Central Africa 277 829 189Total Africa 635 412 102China 197 290 67 13 255 91.8 87 615 993Democratic People’sRepublic of Korea6 187 64 395 - - -Japan 24 868 171 4 249 - - -Mongolia 10 252 131 1 342 46.1 2 388 2Republic of Korea 6 265 80 502 53.6 - -Total East Asia 244 862 81Bangladesh 871 34 30 75.0 58 -Bhutan 3 195 194 621 40.1 611 -Brunei Darussalam 278 219 61 40.0 160 -Cambodia 10 447 96 998 40.0 270 -India 67 701 69 4 698 40.0 4 110 -Indonesia 88 495 59 5 216 - - -Lao People’s Democratic Republic 16 142 59 957 74.0 4 643 32Malaysia 20 890 251 5 242 - - -Maldives 1 - - - 0 -Myanmar 32 222 85 2 740 17.8 10 834 -Nepal 3 636 178 647 40.0 1 897 67Pakistan 1 902 97 185 43.2 1 389 -Philippines 7 162 174 1 248 4.3 3 611 -Singapore 2 - - - 0 -Sri Lanka 1 933 22 42 40.0 0 -Thailand 14 520 41 599 59.9 - -Timor-Leste 798 - - - - -Viet Nam 12 931 66 850 8.5 2 259 -Total South and Southeast Asia 283 127 85Afghanistan 867 16 14 40.0 - -
246<strong>Global</strong> <strong>Forest</strong> <strong>Resources</strong> <strong>Assessment</strong> <strong>2005</strong>TABLE 11Growing stock a in forest and other wooded land <strong>2005</strong>Country/area <strong>Forest</strong> Other wooded landArea Growing stock Area Total growing(1 000 ha) (1 000 ha) stockBy area Total Commercial (million m³)(m³/ha) (million m³) (%)Armenia 283 125 36 - 45 1Azerbaijan 936 136 127 20.4 54 -Bahrain n.s. - - - 0 -Cyprus 174 46 8 39.0 214 -Georgia 2 760 167 461 26.2 50 1Iran (Islamic Republic of) 11 075 48 527 78.9 5 340 -Iraq 822 - - - 927 -Israel 171 37 6 70.0 85 -Jordan 83 30 2 - 52 -Kazakhstan 3 337 109 364 0 15 622 17Kuwait 6 - - - 0 -Kyrgyzstan 869 34 30 0 313 -Lebanon 136 36 5 - 106 1Occupied Palestinian Territory 9 - - - - -Oman 2 - - - 1 303 -Qatar n.s. - - - n.s. -Saudi Arabia 2 728 8 23 0 34 155 171Syrian Arab Republic 461 - - - 35 -Tajikistan 410 12 5 0 142 0Turkey 10 175 138 1 400 86.6 10 689 -Turkmenistan 4 127 4 14 0 0 0United Arab Emirates 312 49 15 0 4 n.s.Uzbekistan 3 295 7 24 0.1 904 -Yemen b 549 9 5 - 1 406 12Total Western and Central Asia 43 588 73Total Asia 571 577 82Albania 794 99 78 81.0 261 11Andorra 16 - - - - -Austria 3 862 300 1 159 97.7 118 -Belarus 7 894 179 1 411 82.8 914 -Belgium 667 258 172 100 27 -Bosnia and Herzegovina 2 185 179 391 80.1 549 -Bulgaria 3 625 157 568 61.1 27 -Channel Islands 1 - - - 0 -Croatia 2 135 165 352 83.0 346 -Czech Republic 2 648 278 736 96.7 0 0Denmark 500 153 76 76.1 136 -Estonia 2 284 196 447 93.7 82 4Faeroe Islands n.s. - - - - -Finland 22 500 96 2 158 84.1 802 5France 15 554 158 2 465 93.5 1 708 -Germany 11 076 - - - - -Gibraltar 0 - - - 0 -Greece 3 752 47 177 88.1 2 780 0Holy See 0 - - - 0 -Hungary 1 976 171 337 97.6 0 0
Annex 3: <strong>Global</strong> tables 247TABLE 11Growing stock a in forest and other wooded land <strong>2005</strong>Country/area <strong>Forest</strong> Other wooded landArea Growing stock Area Total growing(1 000 ha) (1 000 ha) stockBy area Total Commercial (million m³)(m³/ha) (million m³) (%)Iceland 46 65 3 - 104 n.s.Ireland 669 98 65 - 41 -Isle of Man 3 - - - 0 -Italy 9 979 145 1 447 70.1 1 047 97Latvia 2 941 204 599 85.3 115 -Liechtenstein 7 254 2 80.0 0 -Lithuania 2 099 190 400 86.0 77 2Luxembourg 87 299 26 100 1 -Malta n.s. 231 n.s. 0 0 -Monaco 0 - - - 0 -Netherlands 365 178 65 80.0 0 0Norway 9 387 92 863 78.2 2 613 47Poland 9 192 203 1 864 94.4 - -Portugal 3 783 93 350 66.3 84 16Republic of Moldova 329 141 47 62.3 31 2Romania 6 370 212 1 347 98.0 258 -Russian Federation 808 790 100 80 479 49.2 74 185 1 651San Marino n.s. - - - 0 -Serbia and Montenegro 2 694 121 327 - 808 3Slovakia 1 929 256 494 84.7 - -Slovenia 1 264 283 357 91.3 44 3Spain 17 915 50 888 77.6 10 299 1Sweden 27 528 115 3 155 76.8 3 257 36Switzerland 1 221 368 449 82.4 67 -The former Yugoslav Republicof Macedonia906 70 63 - 82 -Ukraine 9 575 221 2 119 63.8 41 1United Kingdom 2 845 120 340 88.2 20 1Total Europe 1 001 394 107Anguilla 6 - - - - -Antigua and Barbuda 9 - - - 16 -Aruba n.s. - - - 0 -Bahamas 515 13 7 - 36 -Barbados 2 - - - - -Bermuda 1 - - - 0 -British Virgin Islands 4 - - - 2 -Cayman Islands 12 - - - 4 -Cuba 2 713 90 243 78.6 260 -Dominica 46 - - - n.s. -Dominican Republic 1 376 47 64 - 678 -Grenada 4 - - - 5 -Guadeloupe 80 - - - 2 -Haiti 105 65 7 - - -Jamaica 339 156 53 2.1 188 24Martinique 46 - - - - -Montserrat 4 - - - - -
248<strong>Global</strong> <strong>Forest</strong> <strong>Resources</strong> <strong>Assessment</strong> <strong>2005</strong>TABLE 11Growing stock a in forest and other wooded land <strong>2005</strong>Country/area <strong>Forest</strong> Other wooded landArea Growing stock Area Total growing(1 000 ha) (1 000 ha) stockBy area Total Commercial (million m³)(m³/ha) (million m³) (%)Netherlands Antilles 1 - - - 33 -Puerto Rico 408 65 26 - - -Saint Kitts and Nevis 5 - - - 6 -Saint Lucia 17 - - - 5 -Saint Vincent and the Grenadines 11 - - - 2 -Trinidad and Tobago 226 88 20 55.0 74 -Turks and Caicos Islands 34 - - - - -United States Virgin Islands 10 15 n.s. - - -Total Caribbean 5 974 74Belize 1 653 96 159 - 115 2Costa Rica 2 391 104 249 66.3 10 -El Salvador 298 - - - 201 -Guatemala 3 938 163 642 15.5 1 672 -Honduras 4 648 116 540 - 710 -Nicaragua 5 189 114 591 24.9 1 022 -Panama 4 294 160 686 1.3 1 288 n.s.Total Central America 22 411 130Canada 310 134 106 32 983 100 91 951 -Greenland n.s. - - - 8 -Mexico 64 238 - - - 19 908 -Saint Pierre and Miquelon 3 - - - - -United States of America 303 089 116 35 118 78.7 - -Total North America 677 464 111Total North and Central America 705 849 111American Samoa 18 104 2 - - -Australia 163 678 - - - 421 590 -Cook Islands 16 - - - - -Fiji 1 000 - - - - -French Polynesia 105 - - - - -Guam 26 - - - 0 -Kiribati 2 - - - - -Marshall Islands - - - - - -Micronesia (Federated States of) 63 - - - - -Nauru 0 - - - 0 -New Caledonia 717 55 40 58.2 787 -New Zealand 8 309 - - - 2 557 -Niue 14 - - - - -Northern Mariana Islands 33 - - - - -Palau 40 - - - - -Papua New Guinea 29 437 35 1 035 50.7 4 474 -Pitcairn 4 - - - 0 -Samoa 171 - - - 22 -Solomon Islands 2 172 - - - - -Tokelau 0 - - - 0 -
Annex 3: <strong>Global</strong> tables 249TABLE 11Growing stock a in forest and other wooded land <strong>2005</strong>Country/area <strong>Forest</strong> Other wooded landArea Growing stock Area Total growing(1 000 ha) (1 000 ha) stockBy area Total Commercial (million m³)(m³/ha) (million m³) (%)Tonga 4 - - - 1 -Tuvalu 1 - - - 0 -Vanuatu 440 - - - 476 -Wallis and Futuna Islands 5 - - - 1 -Total Oceania 206 254 36Argentina 33 021 55 1 826 67.1 60 961 -Bolivia 58 740 74 4 360 15.5 2 473 -Brazil 477 698 170 81 239 18.1 - -Chile 16 121 117 1 882 64.3 13 241 -Colombia 60 728 - - - 18 202 -Ecuador 10 853 - - - 1 448 -Falkland Islands 0 - - - 0 -French Guiana 8 063 350 2 822 0.3 0 0Guyana 15 104 - - - 3 580 -Paraguay 18 475 - - - - -Peru 68 742 - - - 22 132 -South Georgia andthe South Sandwich Islands0 - - - 0 -Suriname 14 776 150 2 216 - - -Uruguay 1 506 79 118 6.2 4 -Venezuela (Bolivarian Republic of) 47 713 - - - 7 369 -Total South America 831 540 155WORLD 3 952 025 110aGrowing stock refers to volume over bark of all living trees.bThe country provided information for this table for forest and other wooded land combined. For the purposes of data display and analysis, <strong>FAO</strong>has distributed these values to the categories forest and other wooded land respectively.
250<strong>Global</strong> <strong>Forest</strong> <strong>Resources</strong> <strong>Assessment</strong> <strong>2005</strong>TABLE 12Annual change in growing stock 1990–<strong>2005</strong>Country/area Growing stock Growing stock per hectare(1 000 m³/year) (m³/ha/year)1990–2000 2000–<strong>2005</strong> 1990–2000 2000–<strong>2005</strong>Angola -4 870 -4 860 n.s. n.s.Botswana a -1 936 -1 964 n.s. n.s.British Indian Ocean Territory - - - -Comoros -87 -153 1.54 -3.32Kenya -1 346 -1 256 -0.09 -0.08Lesotho - - - -Madagascar -11 400 -6 400 n.s. n.s.Malawi -3 600 -3 600 n.s. 0.01Mauritius -6 -18 0.06 -0.04Mayotte - - - -Mozambique -1 270 -1 280 n.s. n.s.Namibia -1 800 -1 800 -0.01 n.s.Réunion - - - -Seychelles 0 0 0 0South Africa 0 0 0 0Swaziland -30 -40 -0.43 -0.40Uganda -3 730 -3 800 n.s. -0.02United Republic of Tanzania -14 700 -16 400 n.s. -0.04Zambia -13 700 -13 880 n.s. n.s.Zimbabwe -10 500 -10 600 0.01 0.01Total Eastern and Southern AfricaAlgeria 2 708 2 031 n.s. n.s.Burkina Faso -4 100 -4 200 -0.45 -0.49Chad -1 500 -1 400 n.s. n.s.Djibouti 0 0 0 0Egypt 180 192 n.s. n.s.Eritrea - - - -Ethiopia -4 210 -4 220 -0.07 -0.08Libyan Arab Jamahiriya 0 0 0 0Mali a -1 513 -1 557 n.s. n.s.Mauritania -196 -200 0 0Morocco 2 000 2 000 0.43 0.39Niger -629 -109 n.s. 0.01Somalia -1 688 -1 666 n.s. n.s.Sudan -8 200 -8 200 n.s. n.s.Tunisia 800 400 -0.04 -0.10Western Sahara 0 0 0 0Total Northern AfricaBenin - - - -Burundi - - - -Cameroon -13 600 -13 600 n.s. n.s.Cape Verde 350 40 n.s. -0.04Central African Republic -5 000 -4 800 n.s. 0.01Congo -3 500 -3 400 n.s. n.s.Côte d’Ivoire 3 000 13 000 0.03 0.87Democratic Republic of the Congo -122 800 -73 800 n.s. n.s.
Annex 3: <strong>Global</strong> tables 251TABLE 12Annual change in growing stock 1990–<strong>2005</strong>Country/area Growing stock Growing stock per hectare(1 000 m³/year) (m³/ha/year)1990–2000 2000–<strong>2005</strong> 1990–2000 2000–<strong>2005</strong>Equatorial Guinea -1 000 -1 000 n.s. n.s.Gabon -2 200 -2 200 n.s. n.s.Gambia 70 70 n.s. -0.01Ghana -7 100 -6 200 0.10 0.08Guinea -3 900 -2 800 n.s. n.s.Guinea-Bissau 0 -200 0.10 0.02Liberia -9 525 -9 526 n.s. n.s.Nigeria -45 000 -45 000 0.30 0.47Rwanda -3 519 10 630 -11.89 16.42Saint Helena - - - -Sao Tome and Principe 0 0 0 0Senegal -1 700 -1 600 n.s. 0.01Sierra Leone - - - -Togo - - - -Total Western and Central AfricaTotal AfricaChina 186 560 181 400 0.31 -0.52Democratic People’sRepublic of Korea-7 523 -6 872 0.14 0.18Japan 74 200 79 200 3.02 3.19Mongolia -10 800 -10 800 n.s. n.s.Republic of Korea 15 900 19 000 2.57 3.10Total East AsiaBangladesh -330 -240 -0.38 -0.18Bhutan 5 700 5 800 1.22 1.18Brunei Darussalam -547 -438 n.s. n.s.Cambodia -14 900 -22 200 -0.11 -0.11India 29 900 7 200 0.08 0.08Indonesia -542 000 -561 200 -3.33 -4.61Lao People’s Democratic Republic -4 600 -4 600 n.s. n.s.Malaysia 24 500 6 800 1.94 1.94Maldives - - - -Myanmar -9 200 -14 200 0.73 0.74Nepal 23 000 -9 400 8.16 n.s.Pakistan -5 000 -5 200 -0.36 -0.49Philippines -44 300 -26 800 0.13 0.08Singapore - - - -Sri Lanka -981 -1 038 -0.16 -0.19Thailand -4 800 -2 400 n.s. n.s.Timor-Leste - - - -Viet Nam 13 570 11 183 -0.26 -0.40Total South and Southeast AsiaAfghanistan -461 -464 n.s. 0Armenia -93 -520 1.21 0.10Azerbaijan 0 0 0 0
252<strong>Global</strong> <strong>Forest</strong> <strong>Resources</strong> <strong>Assessment</strong> <strong>2005</strong>TABLE 12Annual change in growing stock 1990–<strong>2005</strong>Country/area Growing stock Growing stock per hectare(1 000 m³/year) (m³/ha/year)1990–2000 2000–<strong>2005</strong> 1990–2000 2000–<strong>2005</strong>Bahrain - - - -Cyprus 52 15 -0.01 n.s.Georgia 2 740 2 740 0.99 0.99Iran (Islamic Republic of) 100 2 000 0.01 0.18Iraq - - - -Israel 39 50 0.01 -0.01Jordan 0 0 0 0Kazakhstan -215 38 0.12 0.19Kuwait - - - -Kyrgyzstan 537 536 0.56 0.54Lebanon - - - -Occupied Palestinian Territory - - - -Oman - - - -Qatar - - - -Saudi Arabia 0 0 0 0Syrian Arab Republic - - - -Tajikistan -40 -40 -0.10 -0.10Turkey 9 890 5 679 0.50 0.23Turkmenistan 10 100 n.s. 0.02United Arab Emirates 319 13 n.s. -0.02Uzbekistan 817 1 130 0.24 0.31Yemen a 0 0 0 0Total Western and Central AsiaTotal AsiaAlbania 60 540 0.33 0.06Andorra - - - -Austria 14 100 14 200 3.27 3.32Belarus 14 400 14 400 0.86 1.63Belgium 2 940 2 980 4.69 4.47Bosnia and Herzegovina 6 700 6 600 3.22 3.02Bulgaria 12 100 8 400 3.41 0.17Channel Islands - - - -Croatia 2 700 2 800 1.18 1.22Czech Republic 7 370 7 360 2.73 2.56Denmark 940 440 0.70 0.02Estonia - -2 120 - -1.66Faeroe Islands - - - -Finland 16 260 17 600 0.62 0.76France 17 500 42 200 0.38 2.33Germany 62 200 - 4.84 -Gibraltar - - - -Greece 1 400 1 400 -0.01 -0.01Holy See - - - -Hungary 3 716 2 367 1.06 0.01Iceland 40 60 -2.09 -1.17Ireland 740 1 120 -2.06 -0.09Isle of Man - - - -
Annex 3: <strong>Global</strong> tables 253TABLE 12Annual change in growing stock 1990–<strong>2005</strong>Country/area Growing stock Growing stock per hectare(1 000 m³/year) (m³/ha/year)1990–2000 2000–<strong>2005</strong> 1990–2000 2000–<strong>2005</strong>Italy 23 800 31 560 1.11 1.71Latvia 9 500 10 600 2.67 2.88Liechtenstein 10 0 -0.02 0Lithuania 5 270 5 400 2.00 1.18Luxembourg 557 0 6.16 0Malta 0 0 0 0Monaco - - - -Netherlands 900 800 1.87 1.73Norway 10 800 10 800 1.02 0.99Poland 25 120 25 660 2.44 2.24Portugal 7 500 7 400 1.06 1.03Republic of Moldova 631 701 1.69 1.89Romania -110 180 n.s. n.s.Russian Federation 23 075 41 732 0.02 0.06San Marino - - - -Serbia and Montenegro 3 600 3 800 1.00 1.02Slovakia 6 160 6 240 3.22 3.03Slovenia 6 122 4 532 4.00 2.50Spain 19 800 19 600 0.41 0.30Sweden 24 240 24 240 0.84 0.84Switzerland 4 400 4 000 2.45 1.99The former YugoslavRepublic of Macedonia0 0 0 0Ukraine 47 000 47 000 4.56 4.64United Kingdom 4 200 6 400 0.84 1.85Total EuropeAnguilla - - - -Antigua and Barbuda - - - -Aruba - - - -Bahamas 0 0 0 0Barbados - - - -Bermuda - - - -British Virgin Islands - - - -Cayman Islands - - - -Cuba 7 500 7 600 2.10 1.08Dominica - - - -Dominican Republic 0 0 0 0Grenada - - - -Guadeloupe - - - -Haiti -44 -44 0.01 0.08Jamaica -100 0 -0.11 0.18Martinique - - - -Montserrat - - - -Netherlands Antilles - - - -Puerto Rico -57 -58 -0.19 -0.17Saint Kitts and Nevis - - - -Saint Lucia - - - -
254<strong>Global</strong> <strong>Forest</strong> <strong>Resources</strong> <strong>Assessment</strong> <strong>2005</strong>TABLE 12Annual change in growing stock 1990–<strong>2005</strong>Country/area Growing stock Growing stock per hectare(1 000 m³/year) (m³/ha/year)1990–2000 2000–<strong>2005</strong> 1990–2000 2000–<strong>2005</strong>Saint Vincent and the Grenadines - - - -Trinidad and Tobago -100 0 -0.16 0.16Turks and Caicos Islands - - - -United States Virgin Islands -1 -2 0.09 0.02Total CaribbeanBelize 0 0 0 0Costa Rica -1 940 200 0.01 -0.05El Salvador - - - -Guatemala -8 806 -8 806 n.s. n.s.Honduras -16 800 -12 800 0.67 0.99Nicaragua -11 400 -8 000 n.s. n.s.Panama -9 200 -8 200 -1.84 -1.81Total Central AmericaCanada 0 0 0 0Greenland - - - -Mexico - - - -Saint Pierre and Miquelon - - - -United States of America 189 600 210 000 0.50 0.63Total North AmericaTotal North and Central AmericaAmerican Samoa -4 -4 n.s. n.s.Australia - - - -Cook Islands - - - -Fiji - - - -French Polynesia - - - -Guam - - - -Kiribati - - - -Marshall Islands - - - -Micronesia (Federated States of) - - - -Nauru - - - -New Caledonia 0 0 0 0New Zealand - - - -Niue - - - -Northern Mariana Islands - - - -Palau - - - -Papua New Guinea -5 050 -5 060 n.s. -0.01Pitcairn - - - -Samoa - - - -Solomon Islands - - - -Tokelau - - - -Tonga - - - -Tuvalu - - - -Vanuatu - - - -Wallis and Futuna Islands - - - -Total Oceania
Annex 3: <strong>Global</strong> tables 255TABLE 12Annual change in growing stock 1990–<strong>2005</strong>Country/area Growing stock Growing stock per hectare(1 000 m³/year) (m³/ha/year)1990–2000 2000–<strong>2005</strong> 1990–2000 2000–<strong>2005</strong>Argentina -20 100 -21 200 -0.33 -0.38Bolivia -20 100 -20 000 n.s. n.s.Brazil -376 499 -698 892 0.16 -0.35Chile 22 420 22 640 1.05 1.01Colombia - - - -Ecuador - - - -Falkland Islands - - - -French Guiana -1 000 0 n.s. 0Guyana - - - -Paraguay - - - -Peru - - - -South Georgia andthe South Sandwich Islands- - - -Suriname 0 0 0 0Uruguay - - - -Venezuela (Bolivarian Republic of) - - - -Total South AmericaWORLDaThe country provided information for this table for forest and other wooded land combined. For the purposes of data display and analysis, <strong>FAO</strong>has distributed these values to the categories forest and other wooded land respectively.
256<strong>Global</strong> <strong>Forest</strong> <strong>Resources</strong> <strong>Assessment</strong> <strong>2005</strong>TABLE 13Biomass stock in forest and other wooded land <strong>2005</strong> (million tonnes)Country/area <strong>Forest</strong> Other wooded landAbove-ground Below-ground Dead Total Above-ground Below-ground Dead Totalbiomass biomass wood biomass biomass woodAngola 7 605 2 053 1 076 10 734 - - - -Botswana a 228 55 - - 665 159 - -British Indian Ocean Territory - - - - - - - -Comoros 1 n.s. n.s. 2 - - - -Kenya 536 133 74 743 - - - -Lesotho - - - - n.s. n.s. n.s. 1Madagascar 4 778 1 481 382 6 641 - - - -Malawi 260 62 - - - - - -Mauritius 6 2 1 9 2 n.s. n.s. 2Mayotte - - - - - - - -Mozambique 978 235 170 1 382 1 728 829 358 2 915Namibia 364 98 65 527 231 62 41 335Réunion - - - - - - - -Seychelles 6 1 - - - - - -South Africa 1 302 346 231 1 878 1 242 596 257 2 095Swaziland 38 9 - - 7 2 - -Uganda 218 59 39 315 12 6 2 19United Republic of Tanzania 3 636 873 631 5 140 248 119 51 418Zambia 1 821 492 324 2 636 61 16 11 88Zimbabwe 843 226 150 1 219 - - - -Total Eastern and Southern AfricaAlgeria 183 44 - - - - - -Burkina Faso 469 127 108 704 - - - -Chad 371 100 - - 114 55 - -Djibouti 1 n.s. - - - - - -Egypt 11 3 2 16 n.s. n.s. n.s. 1Eritrea - - - - - - - -Ethiopia 396 107 70 573 365 175 76 616Libyan Arab Jamahiriya 11 2 2 15 3 1 1 4Mali a 390 94 - - 514 123 - -Mauritania 10 3 - - - - - -Morocco 368 112 - - n.s. n.s. - -Niger 20 5 - - 19 5 - -Somalia 624 150 108 881 - - - -Sudan 2 235 827 337 3 398 - - - -Tunisia 15 5 - - 0 n.s. - -Western Sahara 29 22 - - - - - -Total Northern AfricaBenin - - - - - - - -Burundi - - - - - - - -Cameroon 2 679 1 125 387 4 191 - - - -Cape Verde 12 4 - - - - - -Central African Republic 4 519 1 085 414 6 018 - - - -Congo 8 356 2 005 - - 882 212 - -Côte d’Ivoire 3 649 365 442 4 456 - - - -Democratic Republic of the Congo 37 376 8 970 2 432 48 778 - - - -
Annex 3: <strong>Global</strong> tables 257TABLE 13Biomass stock in forest and other wooded land <strong>2005</strong> (million tonnes)Country/area <strong>Forest</strong> Other wooded landAbove-ground Below-ground Dead Total Above-ground Below-ground Dead Totalbiomass biomass wood biomass biomass woodEquatorial Guinea 186 45 30 261 - - - -Gabon 5 971 1 314 392 7 677 - - - -Gambia 53 13 9 76 10 5 2 17Ghana 726 267 139 1 132 - - - -Guinea 1 026 246 122 1 394 - - - -Guinea-Bissau 98 24 38 160 - - - -Liberia 731 175 127 1 033 - - - -Nigeria 2 261 543 392 3 195 - - - -Rwanda 75 13 n.s. 88 17 3 1 21Saint Helena - - - - - - - -Sao Tome and Principe 6 3 0 10 - - - -Senegal 566 175 28 769 38 12 2 52Sierra Leone - - - - - - - -Togo - - - - - - - -Total Western and Central AfricaTotal AfricaChina 9 271 2 920 1 836 14 027 577 219 138 934Democratic People’sRepublic of Korea340 125 68 532 - - - -Japan 3 052 733 - - - - - -Mongolia 870 278 230 1 378 1 n.s. n.s. 1Republic of Korea 383 132 57 572 - - - -Total East AsiaBangladesh 51 12 7 70 - - - -Bhutan 503 187 76 766 - - - -Brunei Darussalam 63 15 9 87 - - - -Cambodia 1 904 628 279 2 811 - - - -India 4 093 1 085 570 5 748 - - - -Indonesia 8 867 2 926 1 297 13 090 - - - -Lao People’s Democratic Republic 2 342 632 327 3 301 78 21 11 110Malaysia 5 661 1 359 1 053 8 073 - - - -Maldives - - - - - - - -Myanmar 5 109 1 226 697 7 032 - - - -Nepal 718 251 145 1 114 63 22 13 98Pakistan 381 135 57 573 - - - -Philippines 1 566 376 214 2 156 - - - -Singapore - - - - - - - -Sri Lanka 64 15 9 88 - - - -Thailand 1 129 305 158 1 592 - - - -Timor-Leste - - - - - - - -Viet Nam 1 893 455 258 2 606 - - - -Total South and Southeast AsiaAfghanistan 9 4 1 14 - - - -Armenia 27 9 5 41 1 n.s. n.s. 1Azerbaijan 99 17 - - - - - -
258<strong>Global</strong> <strong>Forest</strong> <strong>Resources</strong> <strong>Assessment</strong> <strong>2005</strong>TABLE 13Biomass stock in forest and other wooded land <strong>2005</strong> (million tonnes)Country/area <strong>Forest</strong> Other wooded landAbove-ground Below-ground Dead Total Above-ground Below-ground Dead Totalbiomass biomass wood biomass biomass woodBahrain - - - - - - - -Cyprus 4 1 - - - - - -Georgia 334 86 59 479 - - - -Iran (Islamic Republic of) 516 153 94 763 - - - -Iraq - - - - - - - -Israel - - - - - - - -Jordan 3 1 1 5 - - - -Kazakhstan 211 63 38 312 10 3 2 14Kuwait - - - - - - - -Kyrgyzstan 17 8 - - - - - -Lebanon 3 1 - - n.s. n.s. - -Occupied Palestinian Territory - - - - - - - -Oman - - - - - - - -Qatar - - - - - - - -Saudi Arabia 28 7 5 40 205 55 36 297Syrian Arab Republic - - - - - - - -Tajikistan 4 2 n.s. 6 1 n.s. - -Turkey 1 400 233 - - - - - -Turkmenistan 17 17 5 40 - - - -United Arab Emirates 23 10 5 38 n.s. n.s. n.s. n.s.Uzbekistan 17 7 4 28 - - - -Yemen a 7 3 1 12 18 8 4 30Total Western and Central AsiaTotal AsiaAlbania 78 25 29 132 8 23 10 41Andorra - - - - - - - -Austria 773 - - - - - - -Belarus 828 251 216 1 295 - - - -Belgium 104 26 3 133 - - - -Bosnia and Herzegovina 275 76 - - - - - -Bulgaria 395 132 - - - - - -Channel Islands - - - - - - - -Croatia 304 80 54 439 - - - -Czech Republic 612 113 36 761 0 0 0 0Denmark 40 12 - - - - - -Estonia 259 75 16 351 3 1 n.s. 4Faeroe Islands - - - - - - - -Finland 1 351 281 35 1 666 3 1 n.s. 4France 1 850 602 - - - - - -Germany 2 020 585 54 2 659 - - - -Gibraltar - - - - - - - -Greece 98 19 - - - - - -Holy See - - - - - - - -Hungary 257 83 n.s. 340 - - - -Iceland 3 n.s. n.s. 3 1 n.s. n.s. 2Ireland 33 7 n.s. 40 - - - -Isle of Man - - - - - - - -
Annex 3: <strong>Global</strong> tables 259TABLE 13Biomass stock in forest and other wooded land <strong>2005</strong> (million tonnes)Country/area <strong>Forest</strong> Other wooded landAbove-ground Below-ground Dead Total Above-ground Below-ground Dead Totalbiomass biomass wood biomass biomass woodItaly 1 043 230 159 1 431 88 37 12 137Latvia 357 105 9 471 - - - -Liechtenstein 1 n.s. - - - - - -Lithuania 210 48 21 279 1 n.s. n.s. 2Luxembourg 17 2 - - - - - -Malta n.s. n.s. - - - - - -Monaco - - - - - - - -Netherlands 43 9 2 54 0 0 0 0Norway 587 103 37 727 37 4 5 46Poland 1 379 412 13 1 804 - - - -Portugal 146 82 - - 8 5 - -Republic of Moldova 24 2 - - 1 1 - -Romania 904 229 181 1 314 - - - -Russian Federation 51 574 12 846 24 396 88 815 450 300 750 1 500San Marino - - - - - - - -Serbia and Montenegro 242 70 44 356 - - - -Slovakia 334 73 32 438 - - - -Slovenia 229 65 48 342 2 n.s. n.s. 3Spain 661 210 - - 1 n.s. - -Sweden 1 810 530 670 3 010 32 9 14 55Switzerland 248 60 8 316 - - - -The former Yugoslav Republicof Macedonia33 8 - - - - - -Ukraine 1 199 290 208 1 698 - - - -United Kingdom 190 34 3 227 1 0 0 1Total EuropeAnguilla - - - - - - - -Antigua and Barbuda - - - - - - - -Aruba - - - - - - - -Bahamas - - - - - - - -Barbados - - - - - - - -Bermuda - - - - - - - -British Virgin Islands - - - - - - - -Cayman Islands - - - - - - - -Cuba 569 171 49 789 - - - -Dominica - - - - - - - -Dominican Republic 132 32 24 188 - - - -Grenada - - - - - - - -Guadeloupe - - - - - - - -Haiti 12 5 2 19 - - - -Jamaica 55 13 8 76 34 8 5 47Martinique - - - - - - - -Montserrat - - - - - - - -Netherlands Antilles - - - - - - - -Puerto Rico 35 7 - - - - - -Saint Kitts and Nevis - - - - - - - -Saint Lucia - - - - - - - -
260<strong>Global</strong> <strong>Forest</strong> <strong>Resources</strong> <strong>Assessment</strong> <strong>2005</strong>TABLE 13Biomass stock in forest and other wooded land <strong>2005</strong> (million tonnes)Country/area <strong>Forest</strong> Other wooded landAbove-ground Below-ground Dead Total Above-ground Below-ground Dead Totalbiomass biomass wood biomass biomass woodSaint Vincent and the Grenadines - - - - - - - -Trinidad and Tobago 38 9 4 51 - - - -Turks and Caicos Islands - - - - - - - -United States Virgin Islands n.s. n.s. - - - - - -Total CaribbeanBelize 94 24 18 137 1 n.s. n.s. 1Costa Rica 224 161 42 427 - - - -El Salvador - - - - - - - -Guatemala 755 241 149 1 145 - - - -Honduras - - - - - - - -Nicaragua 1 154 278 158 1 590 - - - -Panama 980 258 136 1 374 91 38 14 144Total Central AmericaCanada - - - - - - - -Greenland - - - - - - - -Mexico - - - - - - - -Saint Pierre and Miquelon - - - - - - - -United States of America 31 653 6 276 5 350 43 279 - - - -Total North AmericaTotal North and Central AmericaAmerican Samoa 3 1 - - - - - -Australia 12 929 5 581 4 909 23 419 - - - -Cook Islands - - - - - - - -Fiji - - - - - - - -French Polynesia - - - - - - - -Guam - - - - - - - -Kiribati - - - - - - - -Marshall Islands - - - - - - - -Micronesia (Federated States of) - - - - - - - -Nauru - - - - - - - -New Caledonia 118 28 13 160 - - - -New Zealand - - - - - - - -Niue - - - - - - - -Northern Mariana Islands - - - - - - - -Palau - - - - - - - -Papua New Guinea - - - - - - - -Pitcairn - - - - - - - -Samoa - - - - - - - -Solomon Islands - - - - - - - -Tokelau - - - - - - - -Tonga - - - - - - - -Tuvalu - - - - - - - -Vanuatu - - - - - - - -Wallis and Futuna Islands - - - - - - - -Total Oceania
Annex 3: <strong>Global</strong> tables 261TABLE 13Biomass stock in forest and other wooded land <strong>2005</strong> (million tonnes)Country/area <strong>Forest</strong> Other wooded landAbove-ground Below-ground Dead Total Above-ground Below-ground Dead Totalbiomass biomass wood biomass biomass woodArgentina 3 824 993 516 5 333 - - - -Bolivia 7 828 2 740 1 163 11 731 - - - -Brazil 79 219 22 017 6 359 107 595 - - - -Chile 3 243 649 739 4 631 - - - -Colombia 11 945 4 180 2 419 18 544 3 453 1 209 699 5 361Ecuador - - - - - - - -Falkland Islands - - - - - - - -French Guiana - - - - 0 0 0 0Guyana 2 824 619 378 3 821 - - - -Paraguay - - - - - - - -Peru - - - - - - - -South Georgia andthe South Sandwich Islands- - - - - - - -Suriname 8 016 3 367 1 252 12 635 - - - -Uruguay - - - - - - - -Venezuela (Bolivarian Republic of) - - - - - - - -Total South AmericaWORLDaThe country provided information for this table for forest and other wooded land combined. For the purposes of data display and analysis, <strong>FAO</strong>has distributed these values to the categories forest and other wooded land respectively.
262<strong>Global</strong> <strong>Forest</strong> <strong>Resources</strong> <strong>Assessment</strong> <strong>2005</strong>TABLE 14Carbon stock in forest and other wooded land <strong>2005</strong> (million tonnes)Country/area Carbon in forest Carbon in other wooded landIn above- In below- In dead In litter In soil In above- In below- In dead In litter In soilground ground wood ground ground woodbiomass biomass biomass biomassAngola 3 803 1 027 538 124 - - - - - -Botswana a 114 27 - - - 332 80 - - -British Indian Ocean Territory - - - - - - - - - -Comoros 1 n.s. n.s. n.s. n.s. - - - - -Kenya 268 66 37 - - - - - - -Lesotho - - - - - n.s. n.s. n.s. - -Madagascar 2 389 741 191 - - - - - - -Malawi 130 31 - - - - - - - -Mauritius 3 1 1 - - 1 n.s. n.s. - -Mayotte - - - - - - - - - -Mozambique 489 117 85 - - 864 415 179 - -Namibia 182 49 32 - - 116 31 21 - -Réunion - - - - - - - - - -Seychelles 3 1 - - - - - - - -South Africa 651 173 115 - - 621 298 129 - -Swaziland 19 4 - - - 3 1 - - -Uganda 109 29 19 - - 6 3 1 - -United Republic of Tanzania 1 818 436 316 - - 124 60 26 - -Zambia 910 246 162 - - 30 8 5 - -Zimbabwe 422 113 75 - - - - - - -Total Eastern and Southern AfricaAlgeria 92 22 - - 86 - - - - -Burkina Faso 235 63 54 - - - - - - -Chad 186 50 - 25 - 57 28 - - -Djibouti n.s. n.s. - - - - - - - -Egypt 6 1 1 n.s. 3 n.s. n.s. n.s. n.s. 1Eritrea - - - - - - - - - -Ethiopia 198 54 35 - - 182 88 38 - -Libyan Arab Jamahiriya 5 1 1 n.s. - 1 n.s. n.s. 2 -Mali a 195 47 - 26 - 257 61 - 35 -Mauritania 5 2 - - - - - - - -Morocco 184 56 - - - n.s. n.s. - - -Niger 10 2 - 3 47 10 3 - 8 48Somalia 312 75 54 - - - - - - -Sudan 1 117 413 168 - - - - - - -Tunisia 7 3 - 1 38 n.s. n.s. - - 6Western Sahara 14 11 - - - - - - - -Total Northern AfricaBenin - - - - - - - - - -Burundi - - - - - - - - - -Cameroon 1 339 563 193 - - - - - - -Cape Verde 6 2 - - - - - - - -Central African Republic 2 259 542 207 - - - - - - -Congo 4 178 1 003 - - - 441 106 - - -Côte d’Ivoire 1 679 185 203 22 584 - - - - -Democratic Republic of the Congo 18 688 4 485 1 216 281 7 482 - - - - -
Annex 3: <strong>Global</strong> tables 263TABLE 14Carbon stock in forest and other wooded land <strong>2005</strong> (million tonnes)Country/area Carbon in forest Carbon in other wooded landIn above- In below- In dead In litter In soil In above- In below- In dead In litter In soilground ground wood ground ground woodbiomass biomass biomass biomassEquatorial Guinea 93 22 15 - - - - - - -Gabon 2 986 657 196 - - - - - - -Gambia 27 6 5 - - 5 2 1 - -Ghana 363 133 70 - - - - - - -Guinea 513 123 61 - - - - - - -Guinea-Bissau 49 12 19 - - - - - - -Liberia 365 88 63 - - - - - - -Nigeria 1 130 271 196 - - - - - - -Rwanda 38 6 n.s. 2 23 9 1 1 n.s. 3Saint Helena - - - - - - - - - -Sao Tome and Principe 3 1 n.s. - - - - - - -Senegal 283 88 14 - - 19 6 1 - -Sierra Leone - - - - - - - - - -Togo - - - - - - - - - -Total Western and Central AfricaTotal AfricaChina 4 636 1 460 918 - - 289 109 69 - -Democratic People’sRepublic of Korea170 62 34 - - - - - - -Japan 1 526 366 - - - - - - - -Mongolia 435 139 115 - - n.s. n.s. n.s. - -Republic of Korea 192 66 28 - - - - - - -Total East AsiaBangladesh 25 6 3 1 - - - - - -Bhutan 251 94 38 70 223 - - - - -Brunei Darussalam 32 8 4 6 - - - - - -Cambodia 952 314 139 21 - - - - - -India 1 852 491 258 222 7 181 - - - - -Indonesia 4 434 1 463 649 179 - - - - - -Lao People’s Democratic Republic 1 171 316 164 34 - 39 11 5 10 -Malaysia 2 831 679 526 - - - - - - -Maldives - - - - - - - - - -Myanmar 2 555 613 348 68 - - - - - -Nepal 359 126 73 13 326 32 11 6 7 170Pakistan 191 68 28 4 - - - - - -Philippines 783 188 107 15 - - - - - -Singapore - - - - - - - - - -Sri Lanka 32 8 4 4 - - - - - -Thailand 564 152 79 - - - - - - -Timor-Leste - - - - - - - - - -Viet Nam 947 227 129 27 623 - - - - -Total South and Southeast AsiaAfghanistan 4 2 1 - - - - - - -Armenia 13 5 3 10 13 - - - - -Azerbaijan 49 9 - - - - - - - -
264<strong>Global</strong> <strong>Forest</strong> <strong>Resources</strong> <strong>Assessment</strong> <strong>2005</strong>TABLE 14Carbon stock in forest and other wooded land <strong>2005</strong> (million tonnes)Country/area Carbon in forest Carbon in other wooded landIn above- In below- In dead In litter In soil In above- In below- In dead In litter In soilground ground wood ground ground woodbiomass biomass biomass biomassBahrain - - - - - - - - - -Cyprus 2 1 - - 4 - - - - 5Georgia 167 43 29 54 196 - - - - -Iran (Islamic Republic of) 258 76 47 - - - - - - -Iraq - - - - - - - - - -Israel - - - - - - - - - -Jordan 2 1 n.s. n.s. - - - - - -Kazakhstan 105 31 19 - - 5 1 1 - -Kuwait - - - - - - - - - -Kyrgyzstan 8 4 - - - - - - - -Lebanon 1 n.s. - - - n.s. n.s. - - -Occupied Palestinian Territory- - - - - - - - - -Oman - - - - - - - - - -Qatar - - - - - - - - - -Saudi Arabia 14 4 2 6 - 102 28 18 72 -Syrian Arab Republic - - - - - - - - - -Tajikistan 2 1 n.s. - 28 n.s. n.s. - - 3Turkey 700 117 - - - - - - - -Turkmenistan 9 9 2 - 79 - - - - -United Arab Emirates 12 5 2 1 - n.s. n.s. n.s. n.s. -Uzbekistan 9 4 2 - - - - - - -Yemen a 4 2 1 - - 9 4 2 - -Total Western and Central AsiaTotal AsiaAlbania 39 13 15 12 70 4 11 5 4 24Andorra - - - - - - - - - -Austria 379 - - - 474 - - - - -Belarus 414 125 108 227 468 - - - - -Belgium 52 13 1 14 47 - - - - -Bosnia and Herzegovina 138 38 - - - - - - - -Bulgaria 197 66 - - - - - - - -Channel Islands - - - - - - - - - -Croatia 152 40 27 - - - - - - -Czech Republic 276 51 16 39 190 0 0 0 0 0Denmark 20 6 - - - - - - - -Estonia 130 38 8 - 356 1 n.s. n.s. - 13Faeroe Islands - - - - - - - - - -Finland 675 140 15 - - 2 n.s. n.s. - -France 879 286 - 125 1 015 - - - - -Germany 1 010 293 27 - 858 - - - - -Gibraltar - - - - - - - - - -Greece 49 10 - - - - - - - -Holy See - - - - - - - - - -Hungary 131 42 n.s. 56 73 - - - - -Iceland 1 n.s. n.s. n.s. 4 1 n.s. n.s. n.s. 8Ireland 16 3 n.s. - - - - - - -Isle of Man - - - - - - - - - -
Annex 3: <strong>Global</strong> tables 265TABLE 14Carbon stock in forest and other wooded land <strong>2005</strong> (million tonnes)Country/area Carbon in forest Carbon in other wooded landIn above- In below- In dead In litter In soil In above- In below- In dead In litter In soilground ground wood ground ground woodbiomass biomass biomass biomassItaly 521 115 80 67 825 44 18 6 8 128Latvia 178 52 5 64 284 - - - - -Liechtenstein n.s. n.s. - - - - - - - -Lithuania 105 24 10 50 151 1 n.s. n.s. 2 6Luxembourg 8 1 - - - - - - - -Malta n.s. n.s. - - - - - - - -Monaco - - - - - - - - - -Netherlands 21 4 1 9 40 0 0 0 0 0Norway 293 51 19 - - 19 2 2 - -Poland 690 206 7 - - - - - - -Portugal 73 41 - - - 4 2 - - -Republic of Moldova 12 1 - - - n.s. 0 - - -Romania 452 115 91 59 723 - - - - -Russian Federation 25 787 6 423 12 198 4 500 137 000 225 150 375 - 2 000San Marino - - - - - - - - - -Serbia and Montenegro 121 35 22 - - - - - - -Slovakia 167 36 16 21 270 - - - - -Slovenia 115 32 24 - 89 1 n.s. n.s. - 3Spain 297 95 - - - n.s. n.s. - - -Sweden 905 265 335 - - 16 5 7 - -Switzerland 124 30 4 16 93 - - - - -The former YugoslavRepublic of Macedonia16 4 - - - - - - - -Ukraine 600 145 104 - - - - - - -United Kingdom 95 17 2 25 719 0 0 0 0 3Total EuropeAnguilla - - - - - - - - - -Antigua and Barbuda - - - - - - - - - -Aruba - - - - - - - - - -Bahamas - - - - - - - - - -Barbados - - - - - - - - - -Bermuda - - - - - - - - - -British Virgin Islands - - - - - - - - - -Cayman Islands - - - - - - - - - -Cuba 267 80 23 - 187 - - - - -Dominica - - - - - - - - - -Dominican Republic 66 16 12 - - - - - - -Grenada - - - - - - - - - -Guadeloupe - - - - - - - - - -Haiti 6 2 1 - - - - - - -Jamaica 27 7 4 1 28 19 5 3 n.s. 13Martinique - - - - - - - - - -Montserrat - - - - - - - - - -Netherlands Antilles - - - - - - - - - -Puerto Rico 18 3 - - - - - - - -Saint Kitts and Nevis - - - - - - - - - -Saint Lucia - - - - - - - - - -
266<strong>Global</strong> <strong>Forest</strong> <strong>Resources</strong> <strong>Assessment</strong> <strong>2005</strong>TABLE 14Carbon stock in forest and other wooded land <strong>2005</strong> (million tonnes)Country/area Carbon in forest Carbon in other wooded landIn above- In below- In dead In litter In soil In above- In below- In dead In litter In soilground ground wood ground ground woodbiomass biomass biomass biomassSaint Vincent and the Grenadines - - - - - - - - - -Trinidad and Tobago 19 5 2 - - - - - - -Turks and Caicos Islands - - - - - - - - - -United States Virgin Islands n.s. n.s. - - - - - - - -Total CaribbeanBelize 47 12 9 - - n.s. 1 n.s. - -Costa Rica 112 81 21 - - - - - - -El Salvador - - - - - - - - - -Guatemala 377 121 74 - - - - - - -Honduras - - - - - - - - - -Nicaragua 577 139 79 - - - - - - -Panama 490 130 68 9 186 46 19 7 1 62Total Central AmericaCanada - - - - - - - - - -Greenland - - - - - - - - - -Mexico - - - - - - - - - -Saint Pierre and Miquelon - - - - - - - - - -United States of America 15 826 3 138 2 675 4 657 15 732 - - - - -Total North AmericaTotal North and Central AmericaAmerican Samoa 2 n.s. - - - - - - - -Australia 5 824 2 515 2 209 - - - - - - -Cook Islands - - - - - - - - - -Fiji - - - - - - - - - -French Polynesia - - - - - - - - - -Guam - - - - - - - - - -Kiribati - - - - - - - - - -Marshall Islands - - - - - - - - - -Micronesia (Federated States of) - - - - - - - - - -Nauru - - - - - - - - - -New Caledonia 59 14 7 2 - - - - - -New Zealand - - - - - - - - - -Niue - - - - - - - - - -Northern Mariana Islands - - - - - - - - - -Palau - - - - - - - - - -Papua New Guinea - - - - - - - - - -Pitcairn - - - - - - - - - -Samoa - - - - - - - - - -Solomon Islands - - - - - - - - - -Tokelau - - - - - - - - - -Tonga - - - - - - - - - -Tuvalu - - - - - - - - - -Vanuatu - - - - - - - - - -Wallis and Futuna Islands - - - - - - - - - -Total Oceania
Annex 3: <strong>Global</strong> tables 267TABLE 14Carbon stock in forest and other wooded land <strong>2005</strong> (million tonnes)Country/area Carbon in forest Carbon in other wooded landIn above- In below- In dead In litter In soil In above- In below- In dead In litter In soilground ground wood ground ground woodbiomass biomass biomass biomassArgentina 1 912 499 260 124 1 264 - - - - -Bolivia 3 926 1 370 581 - - - - - - -Brazil 38 480 10 855 3 056 1 958 50 289 - - - - -Chile 1 622 324 370 136 780 - - - - -Colombia 5 972 2 090 1 209 - - 1 726 604 350 - -Ecuador - - - - - - - - - -Falkland Islands - - - - - - - - - -French Guiana - - - - - 0 0 0 0 0Guyana 1 412 310 190 121 - - - - - -Paraguay - - - - - - - - - -Peru - - - - - - - - - -South Georgia andthe South Sandwich Islands- - - - - - - - - -Suriname 4 008 1 684 626 - - - - - - -Uruguay - - - - - - - - - -Venezuela (Bolivarian Republic of) - - - - - - - - - -Total South AmericaWORLDaThe country provided information for this table for forest and other wooded land combined. For the purposes of data display and analysis, <strong>FAO</strong> hasdistributed these values to the categories forest and other wooded land respectively.
268<strong>Global</strong> <strong>Forest</strong> <strong>Resources</strong> <strong>Assessment</strong> <strong>2005</strong>TABLE 15Disturbances affecting forest and other wooded land 2000 (1 000 ha)Country/area <strong>Forest</strong> Other wooded landTotal area Area affected annually by: Total area Area affected annually by:Fire Insects Diseases Other Fire Insects Diseases OtherAngola 59 728 - - - - - - - - -Botswana 12 535 - - - - 34 791 - - - -British Indian Ocean Territory 3 - - - - 0 - - - -Comoros 8 0 0 0 0 - - - - -Kenya 3 582 3 - - - 35 120 - - - -Lesotho 7 - - - - 55 - - - -Madagascar 13 023 33 - - - 18 453 839 - - -Malawi 3 567 - - - - - - - - -Mauritius 38 n.s. - - n.s. 17 - - - -Mayotte 6 - - - - - - - - -Mozambique 19 512 - - - - 41 419 - - - -Namibia 8 033 438 - - 4 8 656 - - - -Réunion 87 n.s. - - - 54 - - - -Seychelles 40 n.s. n.s. n.s. - - - - - -South Africa 9 203 - - - - 21 409 - - - -Swaziland 518 - - - - 276 - - - -Uganda 4 059 - - - - 1 235 - - - -United Republic of Tanzania 37 318 9 - - - 10 629 - - - -Zambia 44 676 - - - - 3 468 - - - -Zimbabwe 19 105 - - - - - - - - -Total Eastern and Southern Africa 235 047Algeria 2 144 14 - 130 - 1 662 6 - - -Burkina Faso 6 914 - - - - 7 427 - - - -Chad 12 317 6 159 - - - 9 458 1 892 - - -Djibouti 6 - - - - 220 - - - -Egypt 59 - 0 n.s. - 20 - - - n.s.Eritrea 1 576 - - - - 7 361 - - - -Ethiopia 13 705 - - - - 44 650 100 - - -Libyan Arab Jamahiriya 217 - - - - 330 - - - -Mali a 13 072 - - - - 16 532 - - - -Mauritania 317 - - - - 3 110 - - - -Morocco 4 328 2 37 - 3 407 - - - -Niger 1 328 0 - - - 4 040 599 - - -Somalia 7 515 - - - - - - - - -Sudan 70 491 - - - - 54 153 - - - -Tunisia 959 1 45 - n.s. 177 n.s. - - -Western Sahara 1 011 - - - - - - - - -Total Northern Africa 135 958Benin 2 675 - - - - 3 836 - - - -Burundi 198 - - - - 722 - - - -Cameroon 22 345 - - - - 14 758 - - - -Cape Verde 82 - - - - - - - - -Central African Republic 22 903 - - - - 10 122 - - - -Congo 22 556 17 - - - 10 581 216 - - -Côte d’Ivoire 10 328 21 - - - 2 662 - - - -Democratic Republic of the Congo 135 207 - - - - 83 277 - - - -
Annex 3: <strong>Global</strong> tables 269TABLE 15Disturbances affecting forest and other wooded land 2000 (1 000 ha)Country/area <strong>Forest</strong> Other wooded landTotal area Area affected annually by: Total area Area affected annually by:Fire Insects Diseases Other Fire Insects Diseases OtherEquatorial Guinea 1 708 - - - - 22 - - - -Gabon 21 826 - - - - - - - - -Gambia 461 150 - 100 - 140 - - - -Ghana 6 094 - - - - 0 - - - -Guinea 6 904 - - - - 5 850 - - - -Guinea-Bissau 2 120 30 - - - 241 - - - -Liberia 3 455 - - - - 0 - - - -Nigeria 13 137 - - - - 6 902 - - - -Rwanda 344 4 - - - 61 - - - -Saint Helena 2 - - - - 0 - - - -Sao Tome and Principe 27 - - - - 29 - - - -Senegal 8 898 97 - - - 5 101 145 - - -Sierra Leone 2 851 200 - - - 511 - - - -Togo 486 - - - - 1 246 - - - -Total Western and Central Africa 284 608Total Africa 655 613China 177 001 51 6 191 883 820 97 683 - - - -Democratic People’sRepublic of Korea6 821 46 - - - - - - - -Japan 24 876 2 0 0 27 - - - - -Mongolia 10 665 418 2 798 - - 3 034 - - - -Republic of Korea 6 300 7 340 - - - - - - -Total East Asia 225 663Bangladesh 884 - n.s. n.s. - 53 - - - -Bhutan 3 141 8 n.s. n.s. - 609 - - - -Brunei Darussalam 288 - - - - 155 - - - -Cambodia 11 541 - - - - 298 - - - -India 67 554 3 700 1 000 8 400 - 4 732 - - - -Indonesia 97 852 122 0 0 0 - - - - -Lao People’s Democratic Republic 16 532 100 - - - 4 053 - - - -Malaysia 21 591 1 - - - - - - - -Maldives 1 - - - - 0 - - - -Myanmar 34 554 6 500 - - - 10 629 - - - -Nepal 3 900 400 - n.s. - 1 753 - - - -Pakistan 2 116 41 10 70 - 1 323 - - - -Philippines 7 949 6 n.s. 1 3 3 292 - - - -Singapore 2 0 0 0 0 0 0 0 0 0Sri Lanka 2 082 n.s. - - n.s. 0 - - - n.s.Thailand 14 814 150 - - - - - - - -Timor-Leste 854 - - - - - - - - -Viet Nam 11 725 - - - - 1 816 - - - -Total South and Southeast Asia 297 380Afghanistan 1 015 - - - - - - - - -Armenia 305 n.s. 28 - - 45 - - - -Azerbaijan 936 n.s. 6 6 - 54 - - - -
270<strong>Global</strong> <strong>Forest</strong> <strong>Resources</strong> <strong>Assessment</strong> <strong>2005</strong>TABLE 15Disturbances affecting forest and other wooded land 2000 (1 000 ha)Country/area <strong>Forest</strong> Other wooded landTotal area Area affected annually by: Total area Area affected annually by:Fire Insects Diseases Other Fire Insects Diseases OtherBahrain n.s. - - - - 0 - - - -Cyprus 173 1 - - - 214 2 - - -Georgia 2 760 n.s. 1 - - 51 - - - -Iran (Islamic Republic of) 11 075 6 220 - - 5 340 - - - -Iraq 818 - - - - 1 033 - - - -Israel 164 2 23 n.s. - 62 - - - -Jordan 83 1 0 0 1 54 0 0 0 0Kazakhstan 3 365 180 - - - 14 765 - - - -Kuwait 5 - - - - 0 - - - -Kyrgyzstan 858 n.s. 60 10 - 303 - - - -Lebanon 131 19 - - - 117 - - - -Occupied Palestinian Territory9 - - - - - - - - -Oman 2 - - - - 1 303 - 45 20 240Qatar n.s. - - - - n.s. - - - -Saudi Arabia 2 728 n.s. 4 2 3 34 155 n.s. 30 15 20Syrian Arab Republic 432 n.s. - - - 35 - - - -Tajikistan 410 1 103 6 - 142 3 13 0 -Turkey a 10 052 8 - - - 10 728 3 - - -Turkmenistan 4 127 - - - - 0 - - - -United Arab Emirates 310 0 0 0 0 4 0 0 0 0Uzbekistan 3 212 n.s. 19 7 - - - - - -Yemen 549 - - - - 1 406 - - - -Total Western and Central Asia 43 519Total Asia 566 562Albania 769 3 70 97 23 255 4 23 32 8Andorra 16 - - - - - - - - -Austria a 3 838 n.s. 13 25 22 117 - - - -Belarus a 7 848 6 51 193 1 915 - - - -Belgium 667 n.s. 20 25 40 27 0 - - -Bosnia and Herzegovina 2 185 12 10 1 1 549 3 - - -Bulgaria 3 375 14 186 36 23 105 5 - - -Channel Islands 1 - - - - 0 - - - -Croatia 2 129 6 12 9 4 338 11 - - -Czech Republic 2 637 1 1 18 9 0 0 0 0 0Denmark 486 n.s. - - 4 136 0 - - -Estonia 2 243 1 1 3 13 94 - - - -Faeroe Islands n.s. - - - - - - - - -Finland 22 475 n.s. 46 1 042 3 883 830 - - - -France a 15 351 22 - - 230 1 814 - - - -Germany 11 076 0 - - - - - - - -Gibraltar 0 - - - - 0 - - - -Greece 3 601 13 - - - 2 924 17 - - -Holy See 0 - - - - 0 - - - -Hungary 1 907 8 84 59 467 0 - - - -Iceland 38 0 0 0 0 104 0 0 0 0Ireland 609 n.s. - - 2 41 - - - -Isle of Man 3 - - - - 0 - - - -
Annex 3: <strong>Global</strong> tables 271TABLE 15Disturbances affecting forest and other wooded land 2000 (1 000 ha)Country/area <strong>Forest</strong> Other wooded landTotal area Area affected annually by: Total area Area affected annually by:Fire Insects Diseases Other Fire Insects Diseases OtherItaly 9 447 46 66 - 24 992 - - - -Latvia 2 885 n.s. n.s. n.s. 2 120 - - - -Liechtenstein a 7 0 n.s. - 1 0 - - - -Lithuania 2 020 n.s. 31 14 76 83 - - - -Luxembourg 87 - - - - 1 - - - -Malta n.s. n.s. 0 0 0 0 0 0 0 0Monaco 0 - - - - 0 - - - -Netherlands 360 n.s. - - - 0 0 0 0 0Norway 9 301 n.s. 19 - 140 2 699 n.s. - - -Poland 9 059 6 120 74 20 - - - - -Portugal 3 583 125 189 189 90 84 - - - -Republic of Moldova 326 - 96 - - 31 - - - -Romania 6 366 2 - - 26 234 - - - -Russian Federation 809 268 1 268 4 953 957 508 72 706 - - - -San Marino n.s. - - - - 0 - - - -Serbia and Montenegro a 2 649 8 30 - 1 812 - - - -Slovakia 1 921 0 8 7 17 - - - - -Slovenia 1 239 n.s. n.s. n.s. 1 44 n.s. - - -Spain 16 436 45 217 189 1 775 11 016 76 4 4 35Sweden 27 474 1 - 78 88 3 246 n.s. - - -Switzerland 1 199 n.s. - - 4 64 - - - 0The former YugoslavRepublic of Macedonia906 3 - - - 82 n.s. - - -Ukraine 9 510 4 129 119 45 41 - - - -United Kingdom 2 793 1 1 0 6 20 0 0 0 0Total Europe 998 091Anguilla 6 - - - - - - - - -Antigua and Barbuda 9 - - - - 16 - - - -Aruba n.s. - - - - 0 - - - -Bahamas 515 - - - - 36 - - - -Barbados 2 - - - - - - - - -Bermuda 1 - - - - 0 - - - -British Virgin Islands 4 - - - - 2 - - - -Cayman Islands 12 - - - - 4 - - - -Cuba 2 435 9 - - - 264 - - - -Dominica 47 - - - - n.s. - - - -Dominican Republic 1 376 - - - - 678 - - - -Grenada 4 - - - - 5 - - - -Guadeloupe 81 - - - - 2 - - - -Haiti 109 - - - - - - - - -Jamaica 341 0 0 0 0 189 0 0 0 0Martinique 46 - - - - - - - - -Montserrat 4 - - - - - - - - -Netherlands Antilles 1 - - - - 33 - - - -Puerto Rico 407 - - - - - - - - -Saint Kitts and Nevis 5 - - - - 6 - - - -Saint Lucia 17 - - - - 5 - - - -
272<strong>Global</strong> <strong>Forest</strong> <strong>Resources</strong> <strong>Assessment</strong> <strong>2005</strong>TABLE 15Disturbances affecting forest and other wooded land 2000 (1 000 ha)Country/area <strong>Forest</strong> Other wooded landTotal area Area affected annually by: Total area Area affected annually by:Fire Insects Diseases Other Fire Insects Diseases OtherSaint Vincent and the Grenadines 10 - - - - 2 - - - -Trinidad and Tobago 228 4 - - - 72 - - - -Turks and Caicos Islands 34 - - - - - - - - -United States Virgin Islands 10 - - - - - - - - -Total Caribbean 5 706Belize 1 653 - - - - 115 - - - -Costa Rica 2 376 6 - - - 10 - - - -El Salvador 324 1 - - - 201 - - - -Guatemala 4 208 68 1 n.s. - 1 672 - - - -Honduras 5 430 55 1 - - 559 - - - -Nicaragua 5 539 - - 33 - 973 - - - -Panama 4 307 - - - - 1 143 5 - - -Total Central America 23 837Canada a 310 134 2 054 14 238 - - 91 951 - - - -Greenland n.s. - - - - 8 - - - -Mexico a 65 540 194 8 2 1 20 174 - - - -Saint Pierre and Miquelon 3 - - - 2 - - - - -United States of America 302 294 2 085 5 086 17 380 - - - - - -Total North America 677 971Total North and Central America 707 514American Samoa 18 0 n.s. 0 3 - - - - -Australia 164 645 - - - - 421 590 - - - -Cook Islands 16 - - - - - - - - -Fiji 1 000 - - - - - - - - -French Polynesia 105 - - - - - - - - -Guam 26 - - - 2 0 - - - -Kiribati 2 - - - - - - - - -Marshall Islands - - - - - - - - - -Micronesia (Federated States of) 63 - - - - - - - - -Nauru 0 - - - - 0 - - - -New Caledonia 717 - - - - 787 - - - -New Zealand 8 226 n.s. - - 7 2 557 3 - - -Niue 15 - - - - - - - - -Northern Mariana Islands 34 - - - - - - - - -Palau 40 - - - - - - - - -Papua New Guinea 30 132 - - - - 4 474 - - - -Pitcairn 4 - - - - 0 - - - -Samoa 171 - - - - 22 - - - -Solomon Islands 2 371 - - - - - - - - -Tokelau 0 - - - - 0 - - - -Tonga 4 - - - - 1 - - - -Tuvalu 1 - - - - 0 - - - -Vanuatu 440 - - - - 476 - - - -Wallis and Futuna Islands 5 - - - - 1 - - - -Total Oceania 208 034
Annex 3: <strong>Global</strong> tables 273TABLE 15Disturbances affecting forest and other wooded land 2000 (1 000 ha)Country/area <strong>Forest</strong> Other wooded landTotal area Area affected annually by: Total area Area affected annually by:Fire Insects Diseases Other Fire Insects Diseases OtherArgentina 33 770 644 - - - 60 734 1 146 - - -Bolivia 60 091 1 907 - - - 2 473 - - - -Brazil 493 213 68 30 20 - - - - - -Chile 15 834 28 531 810 - 13 806 12 - - -Colombia 60 963 23 - - - 18 158 22 - - -Ecuador 11 841 - - - - 1 360 - - - -Falkland Islands 0 - - - - 0 - - - -French Guiana 8 063 0 0 0 0 0 0 0 0 0Guyana 15 104 - - - - 3 580 - - - -Paraguay 19 368 - - - - - - - - -Peru 69 213 35 - - - 22 132 - - - -South Georgia andthe South Sandwich Islands0 - - - - 0 - - - -Suriname 14 776 n.s. n.s. n.s. n.s. - - - - -Uruguay 1 409 1 - - - 4 - - - -Venezuela (Bolivarian Republic of) 49 151 14 - - - 7 421 - - - -Total South America 852 796WORLD 3 988 610aThe country provided information for this table for forest and other wooded land combined. For the purposes of data display and analysis, <strong>FAO</strong> hasassigned these values to the forest category.
274<strong>Global</strong> <strong>Forest</strong> <strong>Resources</strong> <strong>Assessment</strong> <strong>2005</strong>TABLE 16Composition of growing stock and diversity of tree species 2000Country/area Growing stock composition No. of native No. of tree species(% of total growing stock) tree species in IUCN red list a3 most 10 most Critically Endangered Vulnerablecommon species common species endangeredAngola - - - 0 2 19Botswana - - - 0 0 0British Indian Ocean Territory - - - - - -Comoros 60.7 100 62 2 2 1Kenya - - - 3 14 50Lesotho - - 60 0 0 1Madagascar 11.6 23.1 5 000 34 65 63Malawi - - - 0 2 6Mauritius 58.3 62.8 194 41 14 9Mayotte - - - - - -Mozambique - - - 4 2 40Namibia 47.7 81.5 200 2 2 7Réunion 100 100 129 8 5 1Seychelles - - 93 7 4 23South Africa - - 649 1 13 40Swaziland - - - 2 2 7Uganda - - - 3 b 4 b 33 bUnited Republic of Tanzania - - - 8 b 35 b 49 bZambia - - 665 0 11 14Zimbabwe 44.5 48.2 1 747 0 b 2 b 12 bTotal Eastern and Southern AfricaAlgeria 55.2 65.6 20 0 1 1Burkina Faso - - 90 0 0 3Chad - - 109 0 0 2Djibouti - - - 0 1 1Egypt 88.2 95.5 60 0 0 0Eritrea - - - 0 0 3Ethiopia - - 1 027 c 0 1 21Libyan Arab Jamahiriya - - 12 0 0 1Mali - - 1 739 c 0 2 4Mauritania - - 52 0 0 0Morocco 69.1 90.1 47 1 0 0Niger - - 227 0 0 2Somalia - - - 0 3 14Sudan 23.1 31.2 533 1 1 15Tunisia 83.2 100 20 0 0 0Western Sahara - - - - - -Total Northern AfricaBenin - - - 0 b 0 b 14 bBurundi - - - 0 0 1Cameroon - - 600 50 b 27 b 106 bCape Verde - - 240 0 0 2Central African Republic - - - 0 1 8Congo 9.8 18.1 334 - - -Côte d’Ivoire - - - 1 4 49Democratic Republic of the Congo - - 870 0 8 43
Annex 3: <strong>Global</strong> tables 275TABLE 16Composition of growing stock and diversity of tree species 2000Country/area Growing stock composition No. of native No. of tree species(% of total growing stock) tree species in IUCN red list a3 most 10 most Critically Endangered Vulnerablecommon species common species endangeredEquatorial Guinea - - - 1 4 11Gabon - - - 3 6 59Gambia 43.8 71.4 140 0 0 0Ghana 12.3 21.8 680 3 19 94Guinea - - - 0 0 21Guinea-Bissau 25.3 47.8 2 243 0 0 4Liberia - - - 0 c 4 c 42 cNigeria - - 560 16b 18 b 138 bRwanda - - 300 0 0 3Saint Helena - - - - - -Sao Tome and Principe - - - 0 1 26Senegal 29.2 54.8 315 0 0 4Sierra Leone - - 213 0 4 42Togo - - 1 451 0 0 10Total Western and Central AfricaTotal AfricaChina 29.0 64.0 2 500 34 45 96Democratic People’sRepublic of Korea- - - 0 0 1Japan 54.7 67.6 1 327 67 d 43 d 87 dMongolia 93.4 100 - 0 0 0Republic of Korea 52.2 85.5 1 049 0 0 0Total East AsiaBangladesh - - 1 074 4 2 6Bhutan 44.4 63.5 105 1 2 4Brunei Darussalam - - 2 000 37 24 31Cambodia - - 862 10 13 9India 21.9 27.2 - 50 b 98 b 98 bIndonesia 19.9 26.8 - 122 57 76Lao People’s Democratic Republic 30.4 39.3 1 457 e 5 b 7 b 8 bMalaysia 29.6 63.3 2 650 50 b 99 b 403 bMaldives - - - - - -Myanmar 11.2 19.5 2 000 13 12 12Nepal 45.1 68.7 225 f0 0 3Pakistan 67.3 87.2 1 104 0 0 2Philippines 28.8 53.0 3 000 46 b 35 b 134 bSingapore - - 2 013 b,c 11 b 11 b 27 bSri Lanka - - 932 78 b 73 b 129 bThailand - - - 30 b 21 b 37 bTimor-Leste - - 251 - - -Viet Nam 7.2 18.5 800 25 b 36 b 85 bTotal South and Southeast AsiaAfghanistan - - - 0 0 1Armenia 93.9 98.7 125 0 0 0Azerbaijan - - 109 0 0 0
276<strong>Global</strong> <strong>Forest</strong> <strong>Resources</strong> <strong>Assessment</strong> <strong>2005</strong>TABLE 16Composition of growing stock and diversity of tree species 2000Country/area Growing stock composition No. of native No. of tree species(% of total growing stock) tree species in IUCN red list a3 most 10 most Critically Endangered Vulnerablecommon species common species endangeredBahrain - - - - - -Cyprus - - 36 0 0 1Georgia 76.4 98.2 153 0 0 0Iran (Islamic Republic of) 69.9 96.2 503 0 0 1Iraq - - 20 0 0 0Israel - - 70 0 0 0Jordan - - 25 0 0 0Kazakhstan 67.0 99.3 - 0 0 1Kuwait - - - - - -Kyrgyzstan 76.3 91.0 - 0 0 1Lebanon 76.8 98.8 41 0 0 0Occupied Palestinian Territory - - - - - -Oman - - 155 c 0 c 1 c 5 cQatar - - - - - -Saudi Arabia 60.4 90.2 52 0 2 1Syrian Arab Republic - - - 0 0 0Tajikistan 76.2 90.2 268 1 0 0Turkey 79.7 97.3 116 0 0 2Turkmenistan 77.1 79.7 47 0 0 0United Arab Emirates - - - 0 0 0Uzbekistan 88.6 91.3 75 0 0 1Yemen - - 534 c - - -Total Western and Central AsiaTotal AsiaAlbania - - 280 c 0 0 0Andorra - - - - - -Austria 77.8 96.0 51 0 0 0Belarus 85.0 99.8 28 0 0 0Belgium 63.9 88.8 58 0 0 0Bosnia and Herzegovina 82.1 91.9 97 0 0 1Bulgaria 61.1 93.4 128 0 0 0Channel Islands - - - - - -Croatia 60.3 85.4 59 0 0 0Czech Republic 84.5 97.2 70 0 0 1Denmark 63.8 91.1 38 0 0 0Estonia 75.2 99.2 27 0 0 0Faeroe Islands - - - - - -Finland 92.9 99.9 32 0 0 0France 44.4 80.8 73 0 0 0Germany 74.5 90.1 62 2 1 5Gibraltar - - - - - -Greece - - - 0 0 0Holy See - - - - - -Hungary 39.5 87.1 47 1 2 3Iceland 87.4 95.4 3 0 0 0Ireland - - 25 0 0 1Isle of Man - - - - - -
Annex 3: <strong>Global</strong> tables 277TABLE 16Composition of growing stock and diversity of tree species 2000Country/area Growing stock composition No. of native No. of tree species(% of total growing stock) tree species in IUCN red list a3 most 10 most Critically Endangered Vulnerablecommon species common species endangeredItaly 34.4 66.6 117 2 0 0Latvia 86.5 99.8 26 0 0 0Liechtenstein - - 39 0 0 0Lithuania 82.6 99.7 24 0 0 0Luxembourg 86.9 98.6 - 0 0 0Malta - - 3 0 0 0Monaco - - - - - -Netherlands 55.1 91.3 28 c 0 0 0Norway 91.3 98.5 32 0 0 0Poland - - 57 0 0 1Portugal - - 51 1 3 2Republic of Moldova - - 35 0 0 0Romania 73.2 86.8 58 0 0 1Russian Federation 65.6 99.1 181 f 4 8 7San Marino - - - - - -Serbia and Montenegro 50.4 65.4 48 0 0 0Slovakia 76.8 97.8 59 0 0 1Slovenia 71.7 92.2 73 0 0 0Spain 40.1 81.6 123 f 2 1 6Sweden 91.4 99.0 32 0 0 1Switzerland 78.9 95.4 52 0 0 0The former YugoslavRepublic of Macedonia- - - 0 0 0Ukraine 71.5 97.7 85 0 0 1United Kingdom 52.4 84.1 66 3 1 6Total EuropeAnguilla - - - - - -Antigua and Barbuda - - - 0 3 1Aruba - - - - - -Bahamas - - - 0 3 2Barbados - - - 0 1 1Bermuda - - - - - -British Virgin Islands - - - - - -Cayman Islands - - - - - -Cuba - - 625 23 50 50Dominica - - - 0 4 5Dominican Republic - - - 2 b 8 b 20 bGrenada - - - 0 2 1Guadeloupe - - 355 0 4 4Haiti - - 76 5 6 17Jamaica - - 722 15 27 62Martinique - - - 0 4 5Montserrat - - - 0 2 2Netherlands Antilles - - - 0 2 0Puerto Rico - - - 22 b 16 b 16 bSaint Kitts and Nevis - - - 0 1 1Saint Lucia - - - 0 2 4
278<strong>Global</strong> <strong>Forest</strong> <strong>Resources</strong> <strong>Assessment</strong> <strong>2005</strong>TABLE 16Composition of growing stock and diversity of tree species 2000Country/area Growing stock composition No. of native No. of tree species(% of total growing stock) tree species in IUCN red list a3 most 10 most Critically Endangered Vulnerablecommon species common species endangeredSaint Vincent and the Grenadines - - - 0 2 3Trinidad and Tobago 33.2 62.8 267 - 1 -Turks and Caicos Islands - - - 0 0 2United States Virgin Islands 39.3 75.9 - 2 4 1Total CaribbeanBelize - - 4 000 0 b 11 b 18 bCosta Rica - - 117 f b 433 b 74 bEl Salvador - - - 1 6 19Guatemala - - 700 2 30 51Honduras - - 400 43 b 38 b 30 bNicaragua - - 1 000 3 16 20Panama 10.5 21.7 1 415 19 b 71 b 106 bTotal Central AmericaCanada 32.6 70.3 180 0 0 0Greenland - - - - - -Mexico - - 1 130 0 7 23Saint Pierre and Miquelon - - 21 0 0 0United States of America 25.2 48.3 1 051 55 69 60Total North AmericaTotal North and Central AmericaAmerican Samoa 38.2 72.4 - 0 0 1Australia - - 2 100 2 8 27Cook Islands - - - 0 0 1Fiji - - - - - -French Polynesia - - - 26 b 4 b 17 bGuam 44.1 81.3 - 1 0 2Kiribati - - - - - -Marshall Islands - - - - - -Micronesia (Federated States of) - - - 0 0 4Nauru - - - - - -New Caledonia - - - 12 18 37New Zealand - - 121 1 2 4Niue - - - 0 0 1Northern Mariana Islands - - - 2 0 2Palau - - - 0 0 3Papua New Guinea - - - - - -Pitcairn - - - - - -Samoa - - - - - -Solomon Islands - - - 0 1 14Tokelau - - - - - -Tonga - - - 1 0 2Tuvalu - - - - - -Vanuatu - - - 1 2 5Wallis and Futuna Islands - - 292 b 0 0 0Total Oceania
Annex 3: <strong>Global</strong> tables 279TABLE 16Composition of growing stock and diversity of tree species 2000Country/area Growing stock composition No. of native No. of tree species(% of total growing stock) tree species in IUCN red list a3 most 10 most Critically Endangered Vulnerablecommon species common species endangeredArgentina 50.5 63.6 236 0 10 34Bolivia 27.6 48.8 2 700 4 b 9 b 57 bBrazil - - 7 880 34 100 187Chile 40.5 78.6 123 0 6 23Colombia - - 5 000 f,g 31 b 50 b 108 bEcuador - - 1 000 g 240 b 669 b 923 bFalkland Islands - - - - - -French Guiana 30.9 48.4 1 200 3 2 11Guyana - - 1 182 1 3 18Paraguay - - - 0 b 5 b 7 bPeru - - 2 500 33 14 54South Georgia andthe South Sandwich Islands- - - - - -Suriname - - 600 1 2 24Uruguay - - 147 0 0 0Venezuela (Bolivarian Republic of) - - 1 360 3 b 6 b 50 bTotal South AmericaWORLDaIUCN (2004).bIncludes all plant species.cIncludes shrubs.dIncludes bamboo and palm species.eRefers to the number of endemic plants in the country.fLimited to inventoried tree species.gAn approximate estimate of at least this amount.
280<strong>Global</strong> <strong>Forest</strong> <strong>Resources</strong> <strong>Assessment</strong> <strong>2005</strong>TABLE 17Removals of wood products 1990–<strong>2005</strong> (1 000 m³ o.b.)Country/area 1990 2000 <strong>2005</strong> % of growingTotal Total stock <strong>2005</strong>Total Industrial FuelwoodroundwoodAngola 3 668 4 905 5 196 1 283 3 913 0.2Botswana 792 851 881 132 749 0.4British Indian Ocean Territory - - - - - -Comoros 168 193 206 9 197 15.3Kenya 21 385 24 900 26 658 2 402 24 256 9.5Lesotho 1 771 2 227 2 455 - 2 455 -Madagascar 7 246 9 973 7 031 598 6 433 0.3Malawi a 6 348 6 297 6 272 655 5 617 1.7Mauritius 27 18 14 8 6 0.5Mayotte - - - - - -Mozambique 18 174 20 744 22 029 1 732 20 297 4.4Namibia a - - - - - -Réunion - - 8 6 2 -Seychelles 10 12 13 10 3 0.4South Africa 15 521 17 000 17 741 17 491 250 2.8Swaziland 1 814 1 024 1 024 380 644 5.3Uganda 35 909 42 936 46 449 4 408 42 041 29.8United Republic of Tanzania 23 846 26 637 28 033 2 833 25 200 2.2Zambia 8 073 9 259 9 851 1 053 8 798 0.8Zimbabwe 8 552 10 519 11 566 1 185 10 381 1.9Total Eastern and Southern AfricaAlgeria a 165 184 195 150 45 0.1Burkina Faso a 6 339 7 248 7 338 5 7 333 3.1Chad 3 931 4 168 4 292 204 4 088 2.0Djibouti - - - - - -Egypt - - 240 120 120 3.0Eritrea - 2 551 2 551 2 2 549 -Ethiopia 85 841 103 188 111 861 2 982 108 879 39.3Libyan Arab Jamahiriya - - - - - -Mali 4 961 5 911 6 386 507 5 879 3.3Mauritania 1 097 1 651 - - - -Morocco 1 012 897 949 491 458 0.5Niger a 9 544 12 151 12 473 594 11 879 95.9Somalia 7 437 10 703 12 334 132 12 202 7.9Sudan 20 684 21 715 22 230 2 716 19 514 2.4Tunisia 208 236 274 223 51 1.0Western Sahara 14 23 23 12 10 0.1Total Northern AfricaBenin - - - - - -Burundi 6 721 8 217 9 693 383 9 310 -Cameroon 14 861 17 989 19 772 3 211 16 561 1.5Cape Verde - - - - - -Central African Republic 4 054 3 566 3 566 1 108 2 458 0.1Congo 2 059 2 424 2 767 1 450 1 317 0.1Côte d’Ivoire 8 826 12 137 12 545 2 175 10 370 0.5Democratic Republic of the Congo 54 922 78 791 82 994 4 199 78 795 0.3
Annex 3: <strong>Global</strong> tables 281TABLE 17Removals of wood products 1990–<strong>2005</strong> (1 000 m³ o.b.)Country/area 1990 2000 <strong>2005</strong> % of growingTotal Total stock <strong>2005</strong>Total Industrial FuelwoodroundwoodEquatorial Guinea 714 933 933 419 514 0.9Gabon 2 198 3 550 4 227 3 600 627 0.1Gambia 602 783 873 154 718 5.0Ghana 16 078 24 999 29 458 1 205 28 253 9.2Guinea 11 412 13 179 14 001 748 13 253 2.7Guinea-Bissau 1 110 1 309 1 417 32 1 385 2.8Liberia 5 048 5 610 5 918 - 5 918 1.2Nigeria 63 756 79 002 86 627 13 916 72 711 6.3Rwanda 3 114 7 789 10 429 226 10 203 11.9Saint Helena - - - - - -Sao Tome and Principe 10 10 10 10 - 0.2Senegal 4 696 5 131 5 110 10 5 100 1.6Sierra Leone 5 534 6 212 6 551 137 6 414 -Togo - 7 054 6 332 3 320 3 012 -Total Western and Central AfricaTotal AfricaChina 159 081 144 775 135 435 88 808 46 628 1.0Democratic People’sRepublic of Korea5 745 8 043 8 692 1 725 6 967 2.2Japan 31 130 18 843 22 334 22 334 - 0.5Mongolia 1 084 448 448 37 411 n.s.Republic of Korea 3 911 4 019 4 074 1 754 2 320 0.8Total East AsiaBangladesh 802 1 114 1 269 253 1 016 4.2Bhutan 313 290 277 207 70 n.s.Brunei Darussalam 100 100 100 100 n.s. 0.2Cambodia 3 250 3 192 - - - -India 9 001 5 735 4 724 1 252 3 472 0.1Indonesia 26 560 24 409 11 257 11 178 79 0.2Lao People’s Democratic Republic 6 965 7 424 7 424 682 6 742 0.8Malaysia 53 739 28 289 24 014 20 600 3 414 0.5Maldives - - - - - -Myanmar 39 084 40 708 43 060 3 880 39 180 1.6Nepal 138 110 119 67 52 n.s.Pakistan 27 174 31 660 33 904 2 301 31 603 18.3Philippines 2 721 759 541 403 138 n.s.Singapore - - - - - -Sri Lanka 9 355 7 546 6 642 763 5 879 15.9Thailand 710 54 49 41 8 n.s.Timor-Leste - - - - - -Viet Nam 35 505 27 219 23 735 2 500 21 235 2.8Total South and Southeast AsiaAfghanistan 2 391 1 033 863 170 693 6.4Armenia - 79 91 11 80 0.3Azerbaijan - 15 16 8 7 n.s.
282<strong>Global</strong> <strong>Forest</strong> <strong>Resources</strong> <strong>Assessment</strong> <strong>2005</strong>TABLE 17Removals of wood products 1990–<strong>2005</strong> (1 000 m³ o.b.)Country/area 1990 2000 <strong>2005</strong> % of growingTotal Total stock <strong>2005</strong>Total Industrial FuelwoodroundwoodBahrain - - - - - -Cyprus 56 28 13 9 4 0.2Georgia 351 389 619 140 478 0.1Iran (Islamic Republic of) 1 681 2 105 2 468 2 448 20 0.5Iraq 0 9 0 0 0 -Israel 61 65 20 20 - -Jordan a 6 10 12 3 9 0.5Kazakhstan - - - - - -Kuwait - - - - - -Kyrgyzstan - 45 37 13 25 0.1Lebanon 0 0 0 0 - -Occupied Palestinian Territory - - - - - -Oman - - - - - -Qatar - - - - - -Saudi Arabia 35 46 0 0 0 0Syrian Arab Republic 6 5 - - - -Tajikistan 6 6 6 0 6 0.1Turkey 36 104 32 024 29 983 11 836 18 147 2.1Turkmenistan 10 10 10 0 10 0.1United Arab Emirates 0 0 0 0 0 0Uzbekistan 49 29 30 9 21 0.1Yemen - - - - - -Total Western and Central AsiaTotal AsiaAlbania 626 157 168 24 144 0.2Andorra - - - - - -Austria a 17 318 16 834 20 127 15 858 4 269 1.7Belarus - 7 367 8 568 7 323 1 245 0.6Belgium 4 352 3 526 4 368 3 768 600 2.5Bosnia and Herzegovina 4 773 4 326 4 139 2 993 1 146 1.1Bulgaria 3 400 3 778 4 200 3 075 1 125 0.7Channel Islands - - - - - -Croatia 2 287 4 062 4 950 3 662 1 288 1.4Czech Republic 13 030 15 860 17 274 16 317 957 2.3Denmark 2 023 2 099 1 807 900 907 2.4Estonia 3 206 11 164 9 602 7 502 2 100 2.1Faeroe Islands - - - - - -Finland 47 203 60 603 64 295 59 095 5 200 3.0France 55 621 58 330 51 475 33 443 18 032 2.1Germany 42 177 48 818 60 770 54 497 6 273 -Gibraltar - - - - - -Greece 2 979 2 221 1 842 438 1 404 1.0Holy See - - - - - -Hungary 5 945 5 902 5 528 3 421 2 107 1.6Iceland n.s. n.s. n.s. n.s. n.s. n.s.Ireland 1 789 2 778 2 819 2 797 22 4.3Isle of Man - - - - - -
Annex 3: <strong>Global</strong> tables 283TABLE 17Removals of wood products 1990–<strong>2005</strong> (1 000 m³ o.b.)Country/area 1990 2000 <strong>2005</strong> % of growingTotal Total stock <strong>2005</strong>Total Industrial FuelwoodroundwoodItaly 9 877 10 031 9 600 3 800 5 800 0.7Latvia 4 820 11 574 11 500 10 580 920 1.9Liechtenstein 21 21 21 16 5 1.2Lithuania 3 651 6 171 7 727 5 881 1 846 1.9Luxembourg - 230 139 135 4 0.5Malta 0 0 0 0 0 0Monaco - - - - - -Netherlands 1 518 1 147 1 200 860 340 1.8Norway 12 475 10 304 9 219 7 631 1 588 1.1Poland 23 617 29 882 33 015 31 692 1 323 1.8Portugal 11 922 10 590 11 123 10 433 690 3.2Republic of Moldova - 62 65 31 34 0.1Romania 17 218 14 285 17 300 11 418 5 882 1.3Russian Federation 336 527 152 316 180 000 129 400 50 600 0.2San Marino - - - - - -Serbia and Montenegro 3 806 3 002 2 600 1 301 1 299 0.8Slovakia 5 545 6 150 6 732 6 372 360 1.4Slovenia 2 978 2 547 3 153 2 622 531 0.9Spain 18 517 17 965 17 689 15 741 1 948 2.0Sweden 58 140 70 570 76 780 68 740 8 040 2.4Switzerland 5 345 6 421 6 958 5 664 1 294 1.5The former YugoslavRepublic of Macedonia- 927 927 162 765 1.5Ukraine 13 590 12 231 14 820 6 660 8 160 0.7United Kingdom 7 152 8 471 8 895 8 630 265 2.6Total EuropeAnguilla - - - - - -Antigua and Barbuda - - - - - -Aruba - - - - - -Bahamas 132 20 20 20 - 0.3Barbados 0 6 6 6 - -Bermuda - - - - - -British Virgin Islands - - - - - -Cayman Islands - - - - - -Cuba 3 089 2 433 2 195 833 1 362 0.9Dominica - - - - - -Dominican Republic 646 646 646 7 639 1.0Grenada - - - - - -Guadeloupe 21 18 18 n.s. 17 -Haiti 2 165 2 532 2 550 275 2 275 37.2Jamaica a - 1 1 1 - n.s.Martinique 14 191 13 800 13 800 2 300 11 500 -Montserrat - - - - - -Netherlands Antilles - - - - - -Puerto Rico - - - - - -Saint Kitts and Nevis - - - - - -Saint Lucia - - - - - -
284<strong>Global</strong> <strong>Forest</strong> <strong>Resources</strong> <strong>Assessment</strong> <strong>2005</strong>TABLE 17Removals of wood products 1990–<strong>2005</strong> (1 000 m³ o.b.)Country/area 1990 2000 <strong>2005</strong> % of growingTotal Total stock <strong>2005</strong>Total Industrial FuelwoodroundwoodSaint Vincent and the Grenadines - - - - - -Trinidad and Tobago 60 67 75 75 - 0.4Turks and Caicos Islands - - - - - -United States Virgin Islands - - - - - -Total CaribbeanBelize 216 216 216 71 145 0.1Costa Rica 1 198 2 398 2 400 1 932 468 1.0El Salvador 4 275 5 957 5 201 682 4 519 -Guatemala 13 143 17 211 19 245 623 18 622 3.0Honduras 10 916 14 022 15 576 1 009 14 567 2.9Nicaragua 1 908 1 454 1 846 106 1 740 0.3Panama 813 573 464 53 410 0.1Total Central AmericaCanada a 195 869 214 788 223 500 219 500 4 000 0.7Greenland - - - - - -Mexico 9 399 8 740 8 351 7 667 684 -Saint Pierre and Miquelon - - n.s. 0 n.s. -United States of America 596 920 548 065 540 838 489 586 51 252 1.5Total North AmericaTotal North and Central AmericaAmerican Samoa - - - - - -Australia 20 331 28 200 29 826 26 734 3 092 -Cook Islands 0 6 6 6 - -Fiji 291 250 254 253 1 -French Polynesia - - - - - -Guam - - - - - -Kiribati - - - - - -Marshall Islands - - - - - -Micronesia (Federated States of) - - - - - -Nauru - - - - - -New Caledonia 11 6 6 6 - n.s.New Zealand 13 841 21 280 24 687 24 687 - -Niue 0 6 6 6 - -Northern Mariana Islands - - - - - -Palau - - - - - -Papua New Guinea 8 795 8 347 8 364 2 001 6 363 0.8Pitcairn - - - - - -Samoa 8 15 11 11 - -Solomon Islands 529 920 796 637 159 -Tokelau - - - - - -Tonga 5 3 2 2 - -Tuvalu - - - - - -Vanuatu 73 135 152 47 105 -Wallis and Futuna Islands - - - - - -Total Oceania
Annex 3: <strong>Global</strong> tables 285TABLE 17Removals of wood products 1990–<strong>2005</strong> (1 000 m³ o.b.)Country/area 1990 2000 <strong>2005</strong> % of growingTotal Total stock <strong>2005</strong>Total Industrial FuelwoodroundwoodArgentina 10 954 11 002 11 026 7 536 3 490 06Bolivia - 609 620 582 38 n.s.Brazil 368 706 293 219 290 476 168 091 122 385 0.4Chile 26 092 41 276 48 867 32 964 15 903 2.6Colombia 11 819 10 809 10 275 3 246 7 029 -Ecuador 7 250 7 976 8 339 1 360 6 979 -Falkland Islands - - - - - -French Guiana 91 52 70 70 - n.s.Guyana - 412 - - - -Paraguay 9 528 11 058 11 823 4 976 6 847 -Peru 7 676 9 752 10 789 1 891 8 898 -South Georgia andthe South Sandwich Islands- - - - - -Suriname 116 176 205 200 5 n.s.Uruguay 2 897 3 333 4 900 3 160 1 740 4.1Venezuela (Bolivarian Republic of) 664 1 138 813 812 2 -Total South AmericaWORLDaThe country provided information for this table for forest and other wooded land combined. For the purposes of data display and analysis,<strong>FAO</strong> has assigned these values to the forest category.
286<strong>Global</strong> <strong>Forest</strong> <strong>Resources</strong> <strong>Assessment</strong> <strong>2005</strong>TABLE 18Removals of non-wood forest products <strong>2005</strong>Country/areaPlant productsFood Fodder Raw Raw Raw Ornamental Exudates Other(tonnes) (tonnes) material material material plants(tonnes) plantfor medicine for colourants for utensils, (tonnes)productsand aromatic and dyes crafts & (tonnes)products (tonnes) construction(tonnes)(tonnes)Angola - - - - - - - -Botswana - - - - - - - -British Indian Ocean Territory - - - - - - - -Comoros 151 - - - - 14 - -Kenya - - - - - - - -Lesotho - - - - - - - -Madagascar - - - - - - - -Malawi - - - - - - - -Mauritius 11 000 308 000 - - 96 - - 160Mayotte - - - - - - - -Mozambique - - - - - - - -Namibia - - - - - - - -Réunion - - - - - - - -Seychelles - - - 444 - - - -South Africa - - - - - - - -Swaziland - - - - - - - -Uganda - - - - - - - -United Republic of Tanzania - - - - - - - -Zambia - - - - - - - -Zimbabwe - - - - - - - -Total Eastern and Southern AfricaAlgeria - - - - - - - -Burkina Faso - - - - - - - -Chad - - - - - - - -Djibouti - - - - - - - -Egypt 50 000 10 200 - - - - - -Eritrea - - - - - - - -Ethiopia - - - - - - 6 557 -Libyan Arab Jamahiriya - - - - - - - -Mali - - - - - - - -Mauritania - - - - - - - -Morocco - - - - - - - -Niger - - - - 4 079 - 5 000 -Somalia - - - - - - - -Sudan - - - - - - - -Tunisia - 420 000 20 000 - - - - 11 015Western Sahara - - - - - - - -Total Northern AfricaBenin - - - - - - - -Burundi - - - - - - - -Cameroon 21 246 - - - - - - -Cape Verde - - - - - - - -Central African Republic - - - - - - - -Congo 1 426 - - - 95 340 - - -
Annex 3: <strong>Global</strong> tables 287TABLE 18Removals of non-wood forest products <strong>2005</strong>Animal productsCountry/areaLiving Hides, skins Wild honey Bushmeat Raw Raw Other Otheranimals and trophies and beeswax (tonnes) material material edible non-edible(units) (units) (tonnes)for medicine for colourants animal animaland aromatic and dyes products productsproducts (tonnes) (tonnes) (tonnes)(tonnes)- - - - - - - - Angola- - - - - - - - Botswana- - - - - - - - British Indian Ocean Territory- - 6 - - - - - Comoros- - - - - - - - Kenya- - - - - - - - Lesotho- - - - - - - - Madagascar- - - - - - - - Malawi8 000 350 93 - - - 400 - Mauritius- - - - - - - - Mayotte- - - - - - - - Mozambique- - - - - - - - Namibia- - - - - - - - Réunion- - - - - - - - Seychelles- - - - - - - - South Africa- - - - - - - - Swaziland- - - - - - - - Uganda- - - - - - - - United Republic of Tanzania- - - - - - - - Zambia- - - - - - - - ZimbabweTotal Eastern and Southern Africa- - 2 000 - - - - - Algeria- - - - - - - - Burkina Faso- - - - - - - - Chad- - - - - - - - Djibouti- - - - - - - - Egypt- - - - - - - - Eritrea- - - - - - - - Ethiopia- - - - - - - - Libyan Arab Jamahiriya- - - - - - - - Mali- - - - - - - - Mauritania- - - - - - - - Morocco- - - - - - - - Niger- - - - - - - - Somalia663 712 1 388 515 - 664 - - - - Sudan- - 80 200 - - 399 - Tunisia- - - - - - - - Western SaharaTotal Northern Africa- - - - - - - - Benin- - - - - - - - Burundi- - - - - - - - Cameroon- - - - - - - - Cape Verde- - - - - - - - Central African Republic8 000 - 12 500 750 - - - - Congo
288<strong>Global</strong> <strong>Forest</strong> <strong>Resources</strong> <strong>Assessment</strong> <strong>2005</strong>TABLE 18Removals of non-wood forest products <strong>2005</strong>Country/areaPlant productsFood Fodder Raw Raw Raw Ornamental Exudates Other(tonnes) (tonnes) material material material plants(tonnes) plantfor medicine for colourants for utensils, (tonnes)productsand aromatic and dyes crafts & (tonnes)products (tonnes) construction(tonnes)(tonnes)Côte d’Ivoire - - - - - - - -Democratic Republic of the Congo - - - - - - - -Equatorial Guinea - - - - - - - -Gabon - - - - - - - -Gambia - - - - - - - -Ghana - - - - - - - -Guinea - - - - - - - -Guinea-Bissau - - - - - - - -Liberia - - - - - - - -Nigeria - - - - - - - -Rwanda - - - - - - - -Saint Helena - - - - - - - -Sao Tome and Principe - - - - - - - -Senegal 5 000 - 400 10 205 - 1 200 -Sierra Leone - - - - - - - -Togo - - - - - - - -Total Western and Central AfricaTotal AfricaChina 3 174 800 - 11 000 - - - 1 131 100 49 200Democratic People’sRepublic of Korea- - - - - - - -Japan 4 615 - - - 44 394 - - -Mongolia - - - - - - - -Republic of Korea 231 199 - 1 233 - - - - -Total East AsiaBangladesh 21 412 - - - 12 947 - - 2 237Bhutan 303 166 361 107 19 9 894 - 48 98Brunei Darussalam - - - - - - - -Cambodia - - - - - - 39 661 -India 61 060 45 780 62 700 4 930 1 315 250 - 3 380 547 470Indonesia - - - - - - - -Lao People’s Democratic Republic - - - - - - - -Malaysia - - - - - - - -Maldives - - - - - - - -Myanmar - - 0 3 000 1 496 000 - 0 -Nepal - - - - - - - -Pakistan 47 842 3 900 000 616 43 000 34 450 - 3 184 235Philippines - - - - - - - -Singapore - - - - - - - -Sri Lanka - - - - - - - -Thailand - - - - - - - -Timor-Leste - - - - - - - -Viet Nam 1 337 - 4 343 - 23 - 318 000 -Total South and Southeast Asia
Annex 3: <strong>Global</strong> tables 289TABLE 18Removals of non-wood forest products <strong>2005</strong>Animal productsCountry/areaLiving Hides, skins Wild honey Bushmeat Raw Raw Other Otheranimals and trophies and beeswax (tonnes) material material edible non-edible(units) (units) (tonnes)for medicine for colourants animal animaland aromatic and dyes products productsproducts (tonnes) (tonnes) (tonnes)(tonnes)- - - - - - - - Côte d’Ivoire- - - - - - - - Democratic Republic of the Congo- - - - - - - - Equatorial Guinea- - - - - - - - Gabon- - - - - - - - Gambia- - - - - - - - Ghana- - - - - - - - Guinea- - - - - - - - Guinea-Bissau- - - - - - - - Liberia- - - - - - - - Nigeria- - - - - - - - Rwanda- - - - - - - - Saint Helena- - - - - - - - Sao Tome and Principe725 000 - 900 90 - - - - Senegal- - - - - - - - Sierra Leone- - - - - - - - TogoTotal Western and Central AfricaTotal Africa- - - - - - - - China- - - - - - - -Democratic People’sRepublic of Korea- - - - - - - - Japan- - - - - - - - Mongolia- - - - - - - - Republic of KoreaTotal East Asia- 1 213 90 - - - 23 686 - Bangladesh0 1 - - - - - - Bhutan- - - - - - - - Brunei Darussalam- - - - - - - - Cambodia- - - - - - - - India- - - - - - - - Indonesia- - - - - - - - Lao People’s Democratic Republic- - - - - - - - Malaysia- - - - - - - - Maldives- - - - - - - 1 000 Myanmar- - - - - - - - Nepal- - 50 - - - - 238 Pakistan- - - - - - - - Philippines- - - - - - - - Singapore- - - - - - - - Sri Lanka- - - - - - - - Thailand- - - - - - - - Timor-Leste- - 56 - - - - - Viet NamTotal South and Southeast Asia
290<strong>Global</strong> <strong>Forest</strong> <strong>Resources</strong> <strong>Assessment</strong> <strong>2005</strong>TABLE 18Removals of non-wood forest products <strong>2005</strong>Country/areaPlant productsFood Fodder Raw Raw Raw Ornamental Exudates Other(tonnes) (tonnes) material material material plants(tonnes) plantfor medicine for colourants for utensils, (tonnes)productsand aromatic and dyes crafts & (tonnes)products (tonnes) construction(tonnes)(tonnes)Afghanistan 5 380 - - - - - - -Armenia - - - - - - - -Azerbaijan - - - - - - - -Bahrain - - - - - - - -Cyprus - - - - - - - -Georgia - - - - - - - -Iran (Islamic Republic of) 1 - 7 - - - 85 -Iraq - - - - - - - -Israel - - - - - - - -Jordan - - - - - - - -Kazakhstan - - - - - - - -Kuwait - - - - - - - -Kyrgyzstan - - 286 - - - - 140Lebanon - - - - - - - -Occupied Palestinian Territory - - - - - - - -Oman - - - - - - - -Qatar - - - - - - - -Saudi Arabia - - - - - - - -Syrian Arab Republic - - - - - - - -Tajikistan 413 - 5 0 0 0 0 0Turkey 9 979 - 9 599 7 0 152 205 7 402Turkmenistan - - - - - - - -United Arab Emirates 0 0 0 0 0 0 0 0Uzbekistan 4 650 11 000 285 55 - - - -Yemen - - - - - - - -Total Western and Central AsiaTotal AsiaAlbania 72 - 2 208 358 711 - - -Andorra - - - - - - - -Austria - - - - - - - -Belarus 15 000 23 000 400 300 - - - 3 300Belgium - - - - - - - -Bosnia and Herzegovina - - - - - - - -Bulgaria - - - - - - - -Channel Islands - - - - - - - -Croatia 400 - 40 - - - - 1 200Czech Republic 40 960 0 2 800 0 0 - 0 0Denmark - - - - - 71 000 - -Estonia - - - - - 2 000 - -Faeroe Islands - - - - - - - -Finland 47 000 - - - - 309 - 12 000France - - - - 5 200 - - -Germany - - - - - - - -Gibraltar - - - - - - - -Greece - - - - - - - -
Annex 3: <strong>Global</strong> tables 291TABLE 18Removals of non-wood forest products <strong>2005</strong>Animal productsCountry/areaLiving Hides, skins Wild honey Bushmeat Raw Raw Other Otheranimals and trophies and beeswax (tonnes) material material edible non-edible(units) (units) (tonnes)for medicine for colourants animal animaland aromatic and dyes products productsproducts (tonnes) (tonnes) (tonnes)(tonnes)- - - - - - - - Afghanistan- - - - - - - - Armenia- - - - - - - - Azerbaijan- - - - - - - - Bahrain- - 811 - - - - - Cyprus- - - - - - - - Georgia- - - - - - - - Iran (Islamic Republic of)- - - - - - - - Iraq- - - - - - - - Israel- - - - - - - - Jordan- - - - - - - - Kazakhstan- - - - - - - - Kuwait497 2 632 - - 6 - n.s. - Kyrgyzstan- - - - - - - - Lebanon- - - - - - - - Occupied Palestinian Territory- - 100 - - - - - Oman- - - - - - - - Qatar- - 60 - - - - - Saudi Arabia- - - - - - - - Syrian Arab Republic0 0 0 0 0 0 0 0 Tajikistan- - - - - - - - Turkey- - - - - - - - Turkmenistan0 0 0 0 0 0 0 0 United Arab Emirates- 2 854 n.s. 2 - - - n.s. Uzbekistan- - - - - - - - YemenTotal Western and Central AsiaTotal Asia- - - - - - 157 - Albania- - - - - - - - Andorra- - - - - - - - Austria260 000 5 500 - 3 200 - - - - Belarus- - - - - - - - Belgium- - - - - - - - Bosnia and Herzegovina- - - - - - - - Bulgaria- - - - - - - - Channel Islands- - - - - - 300 - Croatia500 216 570 0 9 578 0 0 0 0 Czech Republic- - - - - - - - Denmark- 37 500 - 913 - - - - Estonia- - - - - - - - Faeroe Islands- 355 000 - 9 279 - - 2 260 - Finland- - 6 300 - - - - - France- - - 34 000 - - - - Germany- - - - - - - - Gibraltar- - - - - - - - Greece
292<strong>Global</strong> <strong>Forest</strong> <strong>Resources</strong> <strong>Assessment</strong> <strong>2005</strong>TABLE 18Removals of non-wood forest products <strong>2005</strong>Country/areaPlant productsFood Fodder Raw Raw Raw Ornamental Exudates Other(tonnes) (tonnes) material material material plants(tonnes) plantfor medicine for colourants for utensils, (tonnes)productsand aromatic and dyes crafts & (tonnes)products (tonnes) construction(tonnes)(tonnes)Holy See - - - - - - - -Hungary - - - - - - - -Iceland - 0 - - - 92 0 0Ireland - - - - - - - -Isle of Man - - - - - - - -Italy 79 155 2 306 - - 9 703 - - -Latvia - - - - - - - -Liechtenstein - - - - - - - -Lithuania 3 800 - 50 - - 3 000 0 -Luxembourg - - - - - - - -Malta - - - - - - - -Monaco - - - - - - - -Netherlands - - - - - 6 000 - -Norway 19 000 - - - - 5 517 - -Poland 15 088 - - - - 843 - 1 000Portugal - - - - - - - -Republic of Moldova - - - - - 150 - -Romania - 0 - 0 - - 0 -Russian Federation 800 - 700 - - - n.s. 500San Marino - - - - - - - -Serbia and Montenegro - - - - - 0 - -Slovakia 1 155 140 160 - 10 255 - -Slovenia 550 - - - - 1 200 - -Spain 12 018 - - - 0 - 959 70 050Sweden 35 860 - - - - 14 - -Switzerland 462 - - - - - - 2The former YugoslavRepublic of Macedonia- - - - - - - -Ukraine 936 3 963 157 - - - 1 257 143 700United Kingdom 162 - 15 14 - 162 545 - 13Total EuropeAnguilla - - - - - - - -Antigua and Barbuda - - - - - - - -Aruba - - - - - - - -Bahamas - - - - - - - -Barbados - - - - - - - -Bermuda - - - - - - - -British Virgin Islands - - - - - - - -Cayman Islands - - - - - - - -Cuba - - 1 474 68 - - - -Dominica - - - - - - - -Dominican Republic - - - - - - - -Grenada - - - - - - - -Guadeloupe - - - - - - - -Haiti - - - - - - - -
Annex 3: <strong>Global</strong> tables 293TABLE 18Removals of non-wood forest products <strong>2005</strong>Animal productsCountry/areaLiving Hides, skins Wild honey Bushmeat Raw Raw Other Otheranimals and trophies and beeswax (tonnes) material material edible non-edible(units) (units) (tonnes)for medicine for colourants animal animaland aromatic and dyes products productsproducts (tonnes) (tonnes) (tonnes)(tonnes)- - - - - - - - Holy See- - - - - - - - Hungary0 0 0 0 0 0 0 0 Iceland- - - - - - - - Ireland- - - - - - - - Isle of Man- - - - - - - - Italy- 37 800 - 1 500 - - - - Latvia- - - - - - - - Liechtenstein- 30 000 - 1 250 - - - - Lithuania- - - - - - - - Luxembourg- - - - - - - - Malta- - - - - - - - Monaco- - - 362 - - - - Netherlands- 33 110 - 7 586 - - - - Norway3 469 - - 10 456 - - - - Poland- - - - - - - - Portugal- - - - - - - - Republic of Moldova- - - - - - - - Romania- - 30 - - - - - Russian Federation- - - - - - - - San Marino- - - - - 0 - - Serbia and Montenegro10 200 22 470 - 1 688 - - - - Slovakia- 20 000 2 300 1 000 - - - - Slovenia- 3 040 39 114 21 723 - - - - Spain- 177 200 - 16 790 - - - - Sweden- - 550 1 700 - - - - Switzerland- - - - - - - -The former YugoslavRepublic of Macedonia1 200 400 000 - 550 - - - - Ukraine0 - 183 3 500 - - - - United KingdomTotal Europe- - - - - - - - Anguilla- - - - - - - - Antigua and Barbuda- - - - - - - - Aruba- - - - - - - - Bahamas- - - - - - - - Barbados- - - - - - - - Bermuda- - - - - - - - British Virgin Islands- - - - - - - - Cayman Islands- - - - - - - 18 400 Cuba- - - - - - - - Dominica- - - - - - - - Dominican Republic- - - - - - - - Grenada- - - - - - - - Guadeloupe- - - - - - - - Haiti
294<strong>Global</strong> <strong>Forest</strong> <strong>Resources</strong> <strong>Assessment</strong> <strong>2005</strong>TABLE 18Removals of non-wood forest products <strong>2005</strong>Country/areaPlant productsFood Fodder Raw Raw Raw Ornamental Exudates Other(tonnes) (tonnes) material material material plants(tonnes) plantfor medicine for colourants for utensils, (tonnes)productsand aromatic and dyes crafts & (tonnes)products (tonnes) construction(tonnes)(tonnes)Jamaica - - - - - - - -Martinique - - - - - - - -Montserrat - - - - - - - -Netherlands Antilles - - - - - - - -Puerto Rico - - - - - - - -Saint Kitts and Nevis - - - - - - - -Saint Lucia - - - - - - - -Saint Vincent and the Grenadines - - - - - - - -Trinidad and Tobago - - - - - - - 60Turks and Caicos Islands - - - - - - - -United States Virgin Islands - - - - - - - -Total CaribbeanBelize - - - - - - - -Costa Rica - - - - - - - -El Salvador - - - - - - - -Guatemala - - - - - - - -Honduras - - - 2 - 100 4 000 2Nicaragua - - - - - - - -Panama - - - - - - - -Total Central AmericaCanada - - - - - - - -Greenland - - - - - - - -Mexico - - 1 393 - 0 - 34 733 149 169Saint Pierre and Miquelon - - - - - - - -United States of America 6 443 - - - - - - -Total North AmericaTotal North and Central AmericaAmerican Samoa - - - - - - - -Australia - - - - - - - -Cook Islands - - 38 - - - - -Fiji - - - - - - - -French Polynesia - - - - - - - -Guam - - - - - - - -Kiribati - - - - - - - -Marshall Islands - - - - - - - -Micronesia (Federated States of) - - - - - - - -Nauru - - - - - - - -New Caledonia - - - - - - - -New Zealand - 0 - - - 0 0 5 900Niue - - - - - - - -Northern Mariana Islands - - - - - - - -Palau - - - - - - - -Papua New Guinea - - - - - - - -Pitcairn - - - - - - - -
Annex 3: <strong>Global</strong> tables 295TABLE 18Removals of non-wood forest products <strong>2005</strong>Animal productsCountry/areaLiving Hides, skins Wild honey Bushmeat Raw Raw Other Otheranimals and trophies and beeswax (tonnes) material material edible non-edible(units) (units) (tonnes)for medicine for colourants animal animaland aromatic and dyes products productsproducts (tonnes) (tonnes) (tonnes)(tonnes)- - - - - - - - Jamaica- - - - - - - - Martinique- - - - - - - - Montserrat- - - - - - - - Netherlands Antilles- - - - - - - - Puerto Rico- - - - - - - - Saint Kitts and Nevis- - - - - - - - Saint Lucia- - - - - - - - Saint Vincent and the Grenadines- - - 120 - - - - Trinidad and Tobago- - - - - - - - Turks and Caicos Islands- - - - - - - - United States Virgin IslandsTotal Caribbean- - - - - - - - Belize- - - - - - - - Costa Rica- - - - - - - - El Salvador- - - - - - - - Guatemala- - - - - - - - Honduras- - - - - - - - Nicaragua- - - - - - - - PanamaTotal Central America- - - - - - - - Canada- - - - - - - - Greenland- - - - - - - - Mexico- - - 18 - - - - Saint Pierre and Miquelon- - - - - - - - United States of AmericaTotal North AmericaTotal North and Central America- - - - - - - - American Samoa- - - - - - - - Australia- - - - - - - - Cook Islands- - - - - - - - Fiji- - - - - - - - French Polynesia- - - - - - - - Guam- - - - - - - - Kiribati- - - - - - - - Marshall Islands- - - - - - - - Micronesia (Federated States of)- - - - - - - - Nauru- - - - - - - - New Caledonia- 24 000 2 900 90 0 0 11 - New Zealand- - - - - - - - Niue- - - - - - - - Northern Mariana Islands- - - - - - - - Palau- - - - - - - - Papua New Guinea- - - - - - - - Pitcairn
296<strong>Global</strong> <strong>Forest</strong> <strong>Resources</strong> <strong>Assessment</strong> <strong>2005</strong>TABLE 18Removals of non-wood forest products <strong>2005</strong>Country/areaPlant productsFood Fodder Raw Raw Raw Ornamental Exudates Other(tonnes) (tonnes) material material material plants(tonnes) plantfor medicine for colourants for utensils, (tonnes)productsand aromatic and dyes crafts & (tonnes)products (tonnes) construction(tonnes)(tonnes)Samoa - - - - - - - -Solomon Islands - - - - - - - -Tokelau - - - - - - - -Tonga - - - - - - - -Tuvalu - - - - - - - -Vanuatu - - - - - - - -Wallis and Futuna Islands - - - - - - - -Total OceaniaArgentina - - - - - - 14 850 61Bolivia - - - - - - - -Brazil 348 249 - 1 194 3 221 111 663 - 2 460 289 928Chile - - - - - - - -Colombia - - - - - - - -Ecuador - - - - - - - -Falkland Islands - - - - - - - -French Guiana - - - - - - - -Guyana - - - - - - - -Paraguay - - - - - - - -Peru 10 - 296 10 074 155 - 5 1 977South Georgia andthe South Sandwich Islands- - - - - - - -Suriname - - - - - - - -Uruguay - - - - - - - -Venezuela (Bolivarian Republic of) - - - - - - - -Total South AmericaWORLD
Annex 3: <strong>Global</strong> tables 297TABLE 18Removals of non-wood forest products <strong>2005</strong>Animal productsCountry/areaLiving Hides, skins Wild honey Bushmeat Raw Raw Other Otheranimals and trophies and beeswax (tonnes) material material edible non-edible(units) (units) (tonnes)for medicine for colourants animal animaland aromatic and dyes products productsproducts (tonnes) (tonnes) (tonnes)(tonnes)- - - - - - - - Samoa- - - - - - - - Solomon Islands- - - - - - - - Tokelau- - - - - - - - Tonga- - - - - - - - Tuvalu- - - - - - - - Vanuatu- - - - - - - - Wallis and Futuna IslandsTotal Oceania- - - - - - - - Argentina- - - - - - - - Bolivia- - - - - - - - Brazil- - - - - - - - Chile- - - - - - - - Colombia- - - - - - - - Ecuador- - - - - - - - Falkland Islands- - - 400 - - - - French Guiana- - - - - - - - Guyana- - - - - - - - Paraguay- - - - - - - - Peru- - - - - - - -South Georgia andthe South Sandwich Islands- - - - - - - - Suriname- - - - - - - - Uruguay- - - - - - - - Venezuela (Bolivarian Republic of)Total South AmericaWORLD
298<strong>Global</strong> <strong>Forest</strong> <strong>Resources</strong> <strong>Assessment</strong> <strong>2005</strong>TABLE 19Value of wood and non-wood forest products removals <strong>2005</strong>Country/area Value Total value per ha(1 000 US$) (US$)Industrial roundwood Fuelwood NWFPs TotalAngola - - - - -Botswana - - - - -British Indian Ocean Territory - - - - -Comoros 1 600 2 338 366 4 304 790Kenya - - - - -Lesotho - 9 244 - 9 244 1 156Madagascar 66 976 8 363 - 75 339 6Malawi - - - - -Mauritius 137 7 26 149 26 293 711Mayotte - - - - -Mozambique - - - - -Namibia a - - - - -Réunion 431 102 - 533 6Seychelles - - - - -South Africa 338 500 1 500 - 340 000 37Swaziland - - - - -Uganda - 70 - 70 n.s.United Republic of Tanzania - - - - -Zambia - - - - -Zimbabwe 59 047 - - 59 047 3Total Eastern and Southern AfricaAlgeria a 4 400 184 13 333 17 917 8Burkina Faso a - 94 033 - 94 033 14Chad - 47 229 - 47 229 4Djibouti - - - - -Egypt 5 854 5 190 - 11 044 165Eritrea - - - - -Ethiopia 74 552 641 734 36 583 752 869 58Libyan Arab Jamahiriya - - - - -Mali - - - - -Mauritania - - - - -Morocco 22 694 2 830 - 25 524 6Niger a - 92 334 5 295 97 629 77Somalia - - - - -Sudan 82 611 379 143 692 041 1 153 795 17Tunisia 7 200 380 120 232 127 812 121Western Sahara 583 - - 583 1Total Northern AfricaBenin - - - - -Burundi - - - - -Cameroon - - - - -Cape Verde - - - - -Central African Republic - - - - -Congo 222 545 20 091 - 242 636 11Côte d’Ivoire 298 577 - - 298 577 29Democratic Republic of the Congo - - - - -
Annex 3: <strong>Global</strong> tables 299TABLE 19Value of wood and non-wood forest products removals <strong>2005</strong>Country/area Value Total value per ha(1 000 US$) (US$)Industrial roundwood Fuelwood NWFPs TotalEquatorial Guinea - - - - -Gabon - - - - -Gambia - - - - -Ghana 31 265 - - 31 265 6Guinea - - - - -Guinea-Bissau 2 000 15 000 - 17 000 8Liberia - - - - -Nigeria 1 527 288 475 429 - 2 002 718 181Rwanda 1 318 33 977 - 35 295 74Saint Helena - - - - -Sao Tome and Principe - - - - -Senegal 601 16 320 3 199 20 120 2Sierra Leone - - - - -Togo - - - - -Total Western and Central AfricaTotal AfricaChina 4 946 290 - - 4 946 290 25Democratic People’sRepublic of Korea81 525 32 925 - 114 450 18Japan 2 864 500 - 34 506 2 899 006 117Mongolia 67 247 - 314 n.s.Republic of Korea 202 667 13 404 937 990 1 154 061 184Total East AsiaBangladesh 21 253 2 321 199 757 223 331 256Bhutan 6 383 21 27 6 431 2Brunei Darussalam 3 160 2 - 3 162 11Cambodia - - 21 586 21 586 2India 208 644 8 023 179 132 395 799 6Indonesia 2 159 679 - - 2 159 679 24Lao People’s Democratic Republic 40 931 20 226 - 61 157 4Malaysia 2 081 000 69 000 - 2 150 000 103Maldives - - - - -Myanmar 838 479 51 415 11 761 901 655 28Nepal 5 610 - - 5 610 2Pakistan 113 116 1 380 971 33 807 1 527 894 803Philippines 60 272 722 - 60 994 9Singapore - - - - -Sri Lanka 45 796 35 484 - 81 280 42Thailand 46 13 - 59 n.s.Timor-Leste - - - - -Viet Nam 91 579 77 788 289 507 458 874 35Total South and Southeast AsiaAfghanistan 53 720 98 406 15 483 167 609 193Armenia 640 1 165 - 1 805 6Azerbaijan - - - - -
300<strong>Global</strong> <strong>Forest</strong> <strong>Resources</strong> <strong>Assessment</strong> <strong>2005</strong>TABLE 19Value of wood and non-wood forest products removals <strong>2005</strong>Country/area Value Total value per ha(1 000 US$) (US$)Industrial roundwood Fuelwood NWFPs TotalBahrain - - - - -Cyprus 379 72 - 451 3Georgia - - - - -Iran (Islamic Republic of) 117 482 184 551 118 217 11Iraq - - - - -Israel - - - - -Jordan a 181 649 - 830 10Kazakhstan - - - - -Kuwait - - - - -Kyrgyzstan 540 161 - 701 1Lebanon 0 - 1 750 1 750 13Occupied Palestinian Territory - - - - -Oman - - 2 600 2 600 1 300Qatar - - - - -Saudi Arabia 0 0 1 960 1 960 1Syrian Arab Republic - - - - -Tajikistan 0 32 70 102 n.s.Turkey 421 651 326 443 550 748 644 74Turkmenistan 0 12 - 12 n.s.United Arab Emirates 0 0 0 0 0Uzbekistan 211 57 74 342 n.s.Yemen - - - - -Total Western and Central AsiaTotal AsiaAlbania 662 237 110 016 110 915 140Andorra - - - - -Austria a 950 000 225 000 - 1 175 000 304Belarus 22 700 4 000 29 605 56 305 7Belgium 132 766 9 091 - 141 857 213Bosnia and Herzegovina - - - - -Bulgaria 44 637 10 887 - 55 524 15Channel Islands - - - - -Croatia 244 502 18 304 874 263 681 124Czech Republic 1 191 268 14 672 202 370 1 408 310 532Denmark 45 989 28 869 184 626 259 484 519Estonia 268 576 19 601 4 802 292 979 128Faeroe Islands - - - - -Finland 2 614 351 151 450 154 656 2 920 457 130France - - 33 000 33 000 2Germany - - 191 650 191 650 17Gibraltar - - - - -Greece - - - - -Holy See - - - - -Hungary 213 061 150 141 - 363 202 184Iceland 101 53 300 454 10Ireland 82 677 277 - 82 954 124Isle of Man - - - - -
Annex 3: <strong>Global</strong> tables 301TABLE 19Value of wood and non-wood forest products removals <strong>2005</strong>Country/area Value Total value per ha(1 000 US$) (US$)Industrial roundwood Fuelwood NWFPs TotalItaly - - - - -Latvia - - - - -Liechtenstein - - - - -Lithuania 191 633 17 377 2 059 211 069 101Luxembourg - - - - -Malta - - - - -Monaco - - - - -Netherlands 29 460 6 873 15 180 51 513 141Norway 316 882 40 930 144 201 502 013 53Poland 833 344 29 957 21 739 885 040 96Portugal - - - - -Republic of Moldova - - - - -Romania 422 120 - - 422 120 66Russian Federation 1 811 600 166 980 4 820 1 983 400 2San Marino - - - - -Serbia and Montenegro 50 739 19 485 - 70 224 26Slovakia 308 304 5 341 11 611 325 256 169Slovenia 93 947 9 660 41 870 145 477 115Spain 533 200 33 195 307 952 874 347 49Sweden 2 824 280 149 480 203 800 3 177 560 115Switzerland 287 809 39 762 37 375 364 946 299The former YugoslavRepublic of Macedonia- - - - -Ukraine - - 380 380 n.s.United Kingdom 343 000 7 000 101 733 451 733 159Total EuropeAnguilla - - - - -Antigua and Barbuda - - - - -Aruba - - - - -Bahamas - - - - -Barbados - - - - -Bermuda - - - - -British Virgin Islands - - - - -Cayman Islands - - - - -Cuba 233 240 13 350 1 244 247 834 91Dominica - - - - -Dominican Republic - - - - -Grenada - - - - -Guadeloupe - - - - -Haiti - - - - -Jamaica a 55 - - 55 n.s.Martinique - - - - -Montserrat - - - - -Netherlands Antilles - - - - -Puerto Rico - - - - -Saint Kitts and Nevis - - - - -Saint Lucia - - - - -
302<strong>Global</strong> <strong>Forest</strong> <strong>Resources</strong> <strong>Assessment</strong> <strong>2005</strong>TABLE 19Value of wood and non-wood forest products removals <strong>2005</strong>Country/area Value Total value per ha(1 000 US$) (US$)Industrial roundwood Fuelwood NWFPs TotalSaint Vincent and the Grenadines - - - - -Trinidad and Tobago 6 872 - - 6 872 30Turks and Caicos Islands - - - - -United States Virgin Islands - - - - -Total CaribbeanBelize - - - - -Costa Rica 122 122 - - 122 122 51El Salvador - - - - -Guatemala 37 709 159 110 - 196 819 50Honduras 18 132 40 642 4 117 62 891 14Nicaragua 8 480 34 800 - 43 280 8Panama 3 862 2 729 - 6 591 2Total Central AmericaCanada a - - - - -Greenland - - - - -Mexico 545 479 19 216 32 134 596 829 9Saint Pierre and Miquelon - - - - -United States of America 18 682 708 309 226 34 200 19 026 134 63Total North AmericaTotal North and Central AmericaAmerican Samoa - - - - -Australia 1 178 600 - - 1 178 600 7Cook Islands - - 350 350 23Fiji 6 655 5 - 6 661 7French Polynesia - - - - -Guam - - - - -Kiribati - - - - -Marshall Islands - - - - -Micronesia (Federated States of) - - - - -Nauru - - - - -New Caledonia - - - - -New Zealand 647 179 - 18 240 665 419 80Niue - - - - -Northern Mariana Islands - - - - -Palau - - - - -Papua New Guinea 6 330 - - 6 330 n.s.Pitcairn - - - - -Samoa 32 - - 32 n.s.Solomon Islands - - - - -Tokelau - - - - -Tonga - - - - -Tuvalu - - - - -Vanuatu - - - - -Wallis and Futuna Islands - - - - -Total Oceania
Annex 3: <strong>Global</strong> tables 303TABLE 19Value of wood and non-wood forest products removals <strong>2005</strong>Country/area Value Total value per ha(1 000 US$) (US$)Industrial roundwood Fuelwood NWFPs TotalArgentina 117 616 26 115 - 143 731 4Bolivia 49 220 321 - 49 541 1Brazil 2 897 019 942 020 193 131 4 032 170 8Chile 758 289 92 874 - 851 163 53Colombia - - - - -Ecuador 93 193 45 785 - 138 978 13Falkland Islands - - - - -French Guiana 2 716 - 4 099 6 815 1Guyana - - - - -Paraguay 252 680 225 746 - 478 426 26Peru 4 409 - - 4 409 n.s.South Georgia andthe South Sandwich Islands- - - - -Suriname 15 000 60 - 15 060 1Uruguay 47 400 13 920 - 61 320 41Venezuela (Bolivarian Republic of) 43 856 - - 43 856 1Total South AmericaWORLDaThe country provided information for this table for forest and other wooded land combined. For the purposes of data display and analysis,<strong>FAO</strong> has assigned these values to the forest category.
304<strong>Global</strong> <strong>Forest</strong> <strong>Resources</strong> <strong>Assessment</strong> <strong>2005</strong>TABLE 20Employment in forestry a 1990 and 2000 (1 000 person-years)Country/area 1990 2000Total Total Production Provision Unspecifiedof servicesAngola 1 - - - -Botswana - - - - -British Indian Ocean Territory - - - - -Comoros 14 17 17 - -Kenya 2 2 2 - -Lesotho n.s. n.s. n.s. - -Madagascar - 47 47 - -Malawi 1 1 1 - -Mauritius 3 3 2 1 -Mayotte - - - - -Mozambique 8 12 12 - -Namibia - - - - -Réunion - 1 n.s. 1 -Seychelles - - - - -South Africa - 321 66 255 -Swaziland - - - - -Uganda 1 2 2 - -United Republic of Tanzania 4 4 4 - -Zambia - - - - -Zimbabwe 14 16 16 - -Total Eastern and Southern AfricaAlgeria - 29 22 7 -Burkina Faso - 6 2 4 -Chad 1 1 n.s. 1 -Djibouti - - - - -Egypt - 10 - - 10Eritrea - - - - -Ethiopia - - - - -Libyan Arab Jamahiriya - - - - -Mali - - - - -Mauritania - - - - -Morocco 12 12 12 - -Niger 2 8 4 4 -Somalia n.s. n.s. - - n.s.Sudan 5 5 5 - -Tunisia 30 40 36 3 -Western Sahara - - - - -Total Northern AfricaBenin - - - - -Burundi - - - - -Cameroon 23 20 - - 20Cape Verde - n.s. - n.s. -Central African Republic - - - - -Congo 7 10 10 n.s. -Côte d’Ivoire - 34 32 2 -Democratic Republic of the Congo - - - - -
Annex 3: <strong>Global</strong> tables 305TABLE 20Employment in forestry a 1990 and 2000 (1 000 person-years)Country/area 1990 2000Total Total Production Provision Unspecifiedof servicesEquatorial Guinea 1 2 2 - -Gabon 4 4 4 - -Gambia n.s. n.s. n.s. - -Ghana 10 7 7 - -Guinea - - - - -Guinea-Bissau 29 56 1 25 30Liberia 5 2 2 - -Nigeria 10 11 10 1 -Rwanda - 1 n.s. 1 0Saint Helena - - - - -Sao Tome and Principe - - - - -Senegal 10 13 12 n.s. -Sierra Leone - n.s. n.s. n.s. -Togo 106 176 135 1 40Total Western and Central AfricaTotal AfricaChina 2 515 2 017 1 499 26 492Democratic People’sRepublic of Korea4 22 19 3 0Japan 108 63 63 - -Mongolia - - - - -Republic of Korea 20 20 12 1 8Total East AsiaBangladesh 98 98 78 20 -Bhutan 2 4 4 n.s. 0Brunei Darussalam 1 1 1 n.s. -Cambodia 19 17 16 n.s. -India 5 465 4 855 1 976 2 879 -Indonesia - 162 159 3 -Lao People’s Democratic Republic 3 4 4 n.s. -Malaysia 78 67 66 2 -Maldives - - - - -Myanmar 111 101 101 n.s. -Nepal 145 110 96 14 -Pakistan 33 30 27 3 -Philippines - - - - -Singapore n.s. n.s. 0 n.s. 0Sri Lanka 4 6 5 1 -Thailand 16 16 7 9 -Timor-Leste n.s. n.s. n.s. - -Viet Nam 16 210 194 16 -Total South and Southeast AsiaAfghanistan - - - - -Armenia 2 2 n.s. 1 n.s.Azerbaijan 5 3 - - 3
306<strong>Global</strong> <strong>Forest</strong> <strong>Resources</strong> <strong>Assessment</strong> <strong>2005</strong>TABLE 20Employment in forestry a 1990 and 2000 (1 000 person-years)Country/area 1990 2000Total Total Production Provision Unspecifiedof servicesBahrain - - - - -Cyprus 1 1 n.s. 0 1Georgia 12 7 - - 7Iran (Islamic Republic of) 84 107 86 9 12Iraq - - - - -Israel 2 4 3 1 -Jordan 1 2 - - 2Kazakhstan - - - - -Kuwait - - - - -Kyrgyzstan 6 4 - - 4Lebanon - n.s. - n.s. -Occupied Palestinian Territory - - - - -Oman - - - - -Qatar - - - - -Saudi Arabia 1 1 0 1 0Syrian Arab Republic 12 16 1 13 2Tajikistan 5 5 0 3 2Turkey 367 343 - - 343Turkmenistan - 2 2 0 0United Arab Emirates - - - - -Uzbekistan 5 7 7 0 0Yemen - - - - -Total Western and Central AsiaTotal AsiaAlbania 8 2 n.s. 1 n.s.Andorra - - - - -Austria 10 8 6 1 -Belarus - 44 44 0 0Belgium 4 4 3 - 1Bosnia and Herzegovina 22 12 10 2 0Bulgaria - 69 33 1 34Channel Islands - - - - -Croatia 14 10 10 - -Czech Republic 52 31 19 12 0Denmark 4 4 4 1 0Estonia 11 9 - - 9Faeroe Islands - - - - -Finland 39 24 - - 24France 33 35 - - 35Germany - 70 - - 70Gibraltar - - - - -Greece - - - - -Holy See - - - - -Hungary 46 12 - - 12Iceland n.s. n.s. - - n.s.Ireland 3 4 4 - -Isle of Man - - - - -
Annex 3: <strong>Global</strong> tables 307TABLE 20Employment in forestry a 1990 and 2000 (1 000 person-years)Country/area 1990 2000Total Total Production Provision Unspecifiedof servicesItaly 56 36 36 - -Latvia 15 19 - - 19Liechtenstein - - - - -Lithuania 15 14 - - 14Luxembourg - - - - -Malta - - - - -Monaco - - - - -Netherlands 2 2 2 - 1Norway 7 5 - - 5Poland 134 60 - - 60Portugal 16 11 11 - -Republic of Moldova 5 3 3 - -Romania 89 47 - - 47Russian Federation 187 196 155 42 -San Marino - - - - -Serbia and Montenegro 15 10 8 - 2Slovakia 36 27 24 2 1Slovenia 6 3 - - 3Spain 36 29 29 - -Sweden 34 17 - - 17Switzerland 9 7 7 - -The former Yugoslav Republicof Macedonia4 3 - - 3Ukraine 62 105 - - 105United Kingdom 19 12 4 1 7Total EuropeAnguilla - - - - -Antigua and Barbuda - - - - -Aruba - - - - -Bahamas - - - - -Barbados - n.s. n.s. - -Bermuda - - - - -British Virgin Islands - - - - -Cayman Islands - - - - -Cuba 29 37 - - 37Dominica - - - - -Dominican Republic n.s. n.s. n.s. - -Grenada n.s. n.s. - - n.s.Guadeloupe - - - - -Haiti - - - - -Jamaica n.s. 1 1 n.s. -Martinique n.s. n.s. - - n.s.Montserrat - - - - -Netherlands Antilles - - - - -Puerto Rico - - - - -Saint Kitts and Nevis - - - - -Saint Lucia - - - - -
308<strong>Global</strong> <strong>Forest</strong> <strong>Resources</strong> <strong>Assessment</strong> <strong>2005</strong>TABLE 20Employment in forestry a 1990 and 2000 (1 000 person-years)Country/area 1990 2000Total Total Production Provision Unspecifiedof servicesSaint Vincent and the Grenadines - - - - -Trinidad and Tobago 1 1 1 - -Turks and Caicos Islands - - - - -United States Virgin Islands - - - - -Total CaribbeanBelize 1 n.s. - n.s. -Costa Rica - 7 7 - n.s.El Salvador - - - - -Guatemala - 82 - - 82Honduras 32 63 57 - 6Nicaragua 17 35 30 5 -Panama 3 8 8 - -Total Central AmericaCanada 74 89 89 - -Greenland - - - - -Mexico - - - - -Saint Pierre and Miquelon 0 0 0 0 0United States of America 311 281 221 50 10Total North AmericaTotal North and Central AmericaAmerican Samoa - - - - -Australia 15 17 13 4 -Cook Islands - - - - -Fiji n.s. n.s. n.s. - -French Polynesia - - - - -Guam - - - - -Kiribati - - - - -Marshall Islands - - - - -Micronesia (Federated States of) - - - - -Nauru - - - - -New Caledonia n.s. n.s. n.s. - n.s.New Zealand 6 9 6 - 3Niue - - - - -Northern Mariana Islands - - - - -Palau - - - - -Papua New Guinea 13 11 8 1 2Pitcairn - - - - -Samoa 1 n.s. n.s. n.s. -Solomon Islands - - - - -Tokelau - - - - -Tonga - - - - -Tuvalu - - - - -Vanuatu - - - - -Wallis and Futuna Islands - - - - -Total Oceania
Annex 3: <strong>Global</strong> tables 309TABLE 20Employment in forestry a 1990 and 2000 (1 000 person-years)Country/area 1990 2000Total Total Production Provision Unspecifiedof servicesArgentina 1 33 32 1 -Bolivia - 23 14 - 9Brazil - - - - -Chile 52 54 40 13 -Colombia - - - - -Ecuador - n.s. n.s. - n.s.Falkland Islands - - - - -French Guiana n.s. n.s. n.s. n.s. n.s.Guyana - - - - -Paraguay 11 7 4 3 -Peru - 120 117 3 -South Georgia andthe South Sandwich Islands- - - - -Suriname 1 n.s. n.s. n.s. -Uruguay 1 6 6 - -Venezuela (Bolivarian Republic of) - 2 2 - -Total South AmericaWORLDaRefers to employment related to the primary production of goods, provision of services and unspecified forestry activities (excluding thewood processing industry). Employment is defined as “any type of work performed or services rendered under a contract of hire, written ororal, in exchange for wage or salary, in cash or in kind”, and thus excludes informal employment.
310<strong>Global</strong> <strong>Forest</strong> <strong>Resources</strong> <strong>Assessment</strong> <strong>2005</strong>
311Annex 4FRA <strong>2005</strong> working papersThe key findings of FRA <strong>2005</strong>, the country reports and all relevant background documents areavailable on the <strong>FAO</strong> Web site at www.fao.org/forestry/fra<strong>2005</strong>.A complete list of all working papers prepared by the FRA programme can be found at www.fao.org/forestry/site/2560/en.This annex lists those FRA working papers directly related to FRA <strong>2005</strong> excluding the list ofcountry reports. Paper copies can be requested by e-mail to fra@fao.org, or by ordinary mail to<strong>FAO</strong>, <strong>Forest</strong>ry Department, FRA Programme, Viale delle Terme di Caracalla, 00100 Rome, Italy.E, F, S, A and R refer to the languages English, French, Spanish, Arabic and Russian.NumberTitle80 Proc. training of national correspondents on assessing and monitoring of forest landuse and changes, 17–21 November 2003, Rome, Italy (E, F, S)81 Specification of national reporting tables for FRA <strong>2005</strong> (E, F, S, A, R)82 Guidelines for country reporting to FRA <strong>2005</strong> (E, F, S, A, R)83 Terms and definitions (final version) (E, F, S, A, R)84 Proc. regional training of national correspondents on country reporting toFRA <strong>2005</strong>, 26–28 May 2004, Yokohama, Japan (E)85 Compte-rendu atelier révision au niveau régional des rapports nationaux des paysd’Afrique francophone, 20–23 juillet 2004, Dakar, Sénégal (F)86 Proc. subregional workshop for national correspondents from anglophone Africancountries, 27–30 July 2004, Accra, Ghana (E)87 Acta reunión regional de corresponsales nacionales de habla hispana de AméricaLatina y el Caribe, 2–11 de septiembre 2004, Ciudad de Guatemala, Guatemala (S)88 Proc. subregional workshop for national correspondents from south andsoutheastern Europe, 27–29 October 2004, Budapest, Hungary (E)89 Proc. regional review of national reports for Asian and Pacific countries,23–26 November 2004, Bangkok, Thailand (E)90 Proc. subregional workshop for Russian-speaking national correspondents to FRA,7–11 December 2004, Wyszków, Poland (E)91 Proc. regional review of national reports for English-speaking Caribbean countries,24–28 February <strong>2005</strong>, Kingston, Jamaica (E)102 FRA 2000 and FRA <strong>2005</strong>: comparing estimates of forest area and forest area change (E)103 Methodology of information generation and management for FRA <strong>2005</strong> (E)104 Documentation of calculations to determine progress towards sustainable forestmanagement in the FRA <strong>2005</strong> main report (E)105 FRA <strong>2005</strong>: lessons learned and suggestions for future assessments (E)106 FRA <strong>2005</strong>: global assessments of growing stock, biomass and carbon stock (E)
312<strong>Global</strong> <strong>Forest</strong> <strong>Resources</strong> <strong>Assessment</strong> <strong>2005</strong>
313ANNEX 5FRA <strong>2005</strong> meetings and workshopsVenue and dateKotka, Finland1–5 July 2002Nairobi, Kenya16–18 October 2002Rome, Italy13–15 March 2003Rome, Italy17–21 November2003Rome, Italy22 November 2003Beirut, Lebanon21–22 May 2004Yokohama, Japan26–28 May 2004Dakar, Senegal20–23 July 2004Accra, Ghana27–30 July 2004Ciudad de Guatemala,Guatemala2–11 September 2004Washington, DC,USA15–17 September 2004Budapest, Hungary27–29 October 2004Name of meetingKotka IV: expert consultation on global forest resources assessment– linking national and international efforts. Organized by <strong>FAO</strong>, UNEPand UNECE.www.fao.org/forestry/site/2421/enFirst meeting of the advisory group on global forest resources assessmentwww.fao.org/forestry/site/5768/enSecond meeting of the advisory group on global forest resourcesassessmentwww.fao.org/forestry/site/11827/en<strong>Global</strong> training of national correspondents on assessing and monitoring offorest land use and changeswww.fao.org/forestry/site/12708/enThird meeting of the advisory group on global forest resourcesassessmentwww.fao.org/forestry/site/21310/enNear East regional workshop on global forest resources assessment– FRA <strong>2005</strong>www.fao.org/forestry/site/19480/enRegional training of national correspondents in East Asia on countryreporting to FRA <strong>2005</strong>ww.fao.org/forestry/site/19476/enRévision au niveau régional des rapports nationaux des pays d’Afriquefrancophonewww.fao.org/forestry/site/19475/fr (French only)Subregional workshop for national correspondents from anglophoneAfrican countrieswww.fao.org/forestry/site/24408/enReunión regional de corresponsales nacionales de habla hispana deAmérica Latina y el Caribewww.fao.org/forestry/site/19479/sp (Spanish only)Tenth meeting of the UNECE team of specialists on forest resourcesassessmentwww.unece.org/trade/timber/docs/fra-tos/2004/tos-fra-04.htmSubregional workshop for national correspondents from south andsoutheastern Europewww.fao.org/forestry/site/33107/en
314<strong>Global</strong> <strong>Forest</strong> <strong>Resources</strong> <strong>Assessment</strong> <strong>2005</strong>Bangkok, Thailand23–26 November2004Wyszków, Poland7–11 December 2004Rome, Italy14–15 January <strong>2005</strong>Kingston, Jamaica24–28 January <strong>2005</strong>Rome, Italy17–18 January 2006Regional workshop for national correspondents from Asia and thePacificwww.fao.org/forestry/site/33207/enSubregional workshop for Russian-speaking FRA nationalcorrespondentswww.fao.org/forestry/site/33108/enFourth meeting of the advisory group on global forest resourcesassessmentww.fao.org/forestry/site/33048/enRegional review of national reports for English-speaking Caribbeancountrieswww.fao.org/forestry/site/19477/enFifth meeting of the advisory group on global forest resourcesassessmentwww.fao.org/forestry/site/33148/en
315Annex 6Earlier global assessments<strong>FAO</strong> was founded on 16 October 1945. At the first session of the Conference of<strong>FAO</strong>, the need for up-to-date information on the forest resources of the world washighlighted. This reflected concern for a possible future lack of timber, not leastdue to the needs for reconstruction after the Second World War and for supportto development in tropical countries. It was recommended, therefore, that a globalforest resources inventory should be undertaken as soon as possible. In May 1946,the <strong>Forest</strong>ry and <strong>Forest</strong> Products Division was founded and work initiated on <strong>FAO</strong>’sfirst worldwide assessment of forests, published two years later (<strong>FAO</strong>, 1948). Afterreviewing the results of this assessment, the sixth session of the <strong>FAO</strong> Conferencerecommended that the Organization “maintain a permanent capability to provideinformation on the state of forest resources worldwide on a continuing basis” (<strong>FAO</strong>,1951). Since that time, regional and global surveys have been conducted every five toten years. Each has taken a somewhat different form.Statistics released by <strong>FAO</strong> on world forest area from 1948 through 1963 were largelycollected through questionnaires sent to the countries. The assessments since 1980have taken a more solid technical form, being based on analysis of country referencessupported by expert judgements, remote sensing and statistical modelling.FRA 2000 was the most comprehensive past assessment in terms of the numberof references used and information analysed on forest area, the condition of forestsand their management, forest services and NWFPs. FRA 2000 was also notable forapplying, for the first time, a single definition of forest at the global level with commonminimum thresholds, including a 10 percent crown cover density.Statistics from the different assessments do not lend themselves to comparativeanalysis, owing to changes in baseline information, methods and definitions. However,better correlations can be achieved for time series in many countries for certainassessments, especially with information generated since 1980. Consistent definitionsof forests were applied for developing countries for subsequent assessments – and forall countries as of FRA 2000.<strong>FAO</strong>’S GLOBAL AND REGIONAL ASSESSMENTS 1946–2001<strong>Forest</strong> resources of the world (1948)For the first global survey, <strong>Forest</strong> resources of the world(<strong>FAO</strong>, 1948), a questionnairewas sent to all countries, with 101 responding, which represented about 66 percent ofthe world’s forests. Parameters included were forest area (total and productive), typesof forest by accessibility of wood resources, growth and fellings.One of the noteworthy conclusions of the first report was that:“All these investigations made valuable additions to our knowledge, but all sufferedfrom certain fundamental difficulties. Most important of these were the lack of reliableforest inventory information … and the lack of commonly accepted definitions ofsome of the more important forestry terms. Hence, to the weakness of some of thequantitative estimates, there was added doubt as to the real meanings of some of thequalitative descriptions”.This statement remains largely true today, almost 60 years later. While technicaland scientific advances have greatly increased the potential to improve the informationbase in countries, many still lack the training, institutional and financial resources toconduct periodic assessments.
316<strong>Global</strong> <strong>Forest</strong> <strong>Resources</strong> <strong>Assessment</strong> <strong>2005</strong>Major findings on forest area and forest area change• Total forest area (global): 4.0 billion hectares• Net forest change (global): not reportedWorld forest inventories (1953, 1958 and 1963)World forest inventories were carried out on three occasions during the 1950s and1960s. Lanly (1983) describes these various inventories:... 126 countries and territories replied to the 1953 questionnaire representing about73 percent of the world forest area. The picture was completed by information fromthe replies to the 1947 questionnaire for 10 other countries (representing 3 percent ofthe total world forested area) and official statistics for the remaining 57 countries,representing 24 percent of the world forest area. The results were published by <strong>FAO</strong>in 1955 under the title World forest resources – results of the inventory undertakenin 1953 by the <strong>Forest</strong>ry Division of <strong>FAO</strong>.The 1958 inventory … (World <strong>Forest</strong> Inventory 1958 – the third in the quinquennialseries compiled by the <strong>Forest</strong>ry and <strong>Forest</strong> Products Division of <strong>FAO</strong>) [<strong>FAO</strong>, 1960]utilized the replies of the 143 countries or territories, representing 88 percent ofthe world forest area, complemented by the replies to the 1953 questionnaire for13 countries (2 percent) and to the 1947 questionnaire for 5 countries (3 percent).Necessary changes and precisions introduced in the definition of some concepts,more precise definitions of forests and changes in such concepts as forest-in-use andaccessible forests affected comparability with the previous inventories. However,changes in area and other forest characteristics during the 1953-58 period were,for several countries, either reported directly from them or could be derived bycomparison of the replies to both questionnaires (changes in area of permanentforests, in management status ... increase in accessible areas and in forest-in-use,afforested area between 1953 and 1957, etc.).The World <strong>Forest</strong> Inventory 1963 published by <strong>FAO</strong> in 1965 witnessed a slightlylower rate of response (105 compared to 130), “at least partly accounted for bytemporary strains on administration in countries gaining their independence” aswas reported in the document. Again comparability with the former enquiries waslimited, and, as pointed out by the authors of the report, “large differences for somecountries (between the results of the 1958 and 1963 enquiries) resulted more frombetter knowledge about the forests, or stricter application of definitions, than fromeffective changes in the forest resources”.The main parameters assessed during the World forest inventory 1963 were forestarea (total, productive and protected), ownership, management status, composition(softwoods and hardwoods), growing stock and removals (<strong>FAO</strong>, 1966).Major findings on forest area and forest area change (1963)• Total forest area (global): 3.8 billion hectares• Net forest change: not reportedRegional forest resources assessments (1970s)During the 1970s, <strong>FAO</strong> did not carry out global surveys. Instead, a series of regionalassessments were conducted, with the intention that each would be more appropriateand specific to the regions. Beginning in the late 1960s, <strong>FAO</strong> sent out questionnairesto all industrialized countries. The results were published in 1976 as <strong>Forest</strong> resources inthe European Region (<strong>FAO</strong>, 1976b). Questionnaires were also sent to Asia and LatinAmerica, and the results were published in <strong>Forest</strong> resources in the Asia and Far EastRegion (<strong>FAO</strong>, 1976c) and Appraisal of forest resources of the Latin American Region(<strong>FAO</strong>, 1976a). A similar questionnaire was sent to African countries by the Departmentof <strong>Forest</strong> Survey of the Swedish Royal College of <strong>Forest</strong>ry and the results published in
Annex 6: Earlier global assessments 317<strong>Forest</strong> resources of Africa – an approach to international forest resources appraisal, Part I:country descriptions (Persson, 1975) and Part II: Regional analyses (Persson, 1977).According to Lanly (1983), the regional assessments of the developing countries hadthe following main features in common:• they were based only in part upon questionnaires, the rest of the informationhaving been collected in another form, in particular through travel to countries ofthe region concerned;• they included more qualitative information (description of forest types, indicationof species planted, quotation of figures on volumes and other stand characteristicsextracted from inventory reports, etc.), while the World <strong>Forest</strong> Inventoryassessments were essentially statistical;• in addition to regional statistical tables, country notes were prepared regroupingthe quantitative information selected for each country;• since the information provided was not limited to the replies to the questionnaires,the draft country notes were sent back to the national forest institutions for theircomments and suggested amendments.Although <strong>FAO</strong> did not compile the regional findings into a global synthesis, aglobal survey was done outside <strong>FAO</strong> and published in World forest resources – reviewof the world’s forest resources in the early 1970s (Persson, 1974). Another <strong>FAO</strong> study,Attempt at an assessment of the world’s tropical moist forests (Sommer, 1976), provideda summary of findings on the forest situation in all tropical moist forests.FRA 1980FRA 1980 covered 97 percent of the land area of developing countries or 76 tropicalcountries: 37 in Africa, 16 in Asia and 23 in Latin America and the Caribbean. FRA 1980was distinguished by many features. Its breadth was the greatest up to that time, andin many cases remains unmatched by more recent assessments. It is also notable as thefirst assessment to use a definition of forests in which measurable parameters wereindicated – 10 percent canopy cover density, minimum tree height of 7 m and 10 haas the minimum area. Previous assessments had relatively broad definitions, whichcould be interpreted quite differently by different countries. This consistent definitionprovided parameters useful in adjusting country information to a common standard.An adjustment in time was also made, using expert opinion to project the informationto common reference years of 1976, 1980, 1981 and 1985.FRA 1980 relied extensively on existing documentation from countries to formulateits estimates of forest area (status and change), plantation resources and wood volume.Existing information from multiple sources in the countries was gathered and analysed.Dialogues with national and international experts on information utility and reliabilityhelped to firm up country estimates. The assessment noted that information wasabundant, but that it was hard to locate and synthesize in the coherent manner neededfor a consistent global survey.Extended narratives, explanatory text and qualitative information complementedthe statistical data set. During the tenure of FRA 1980, <strong>FAO</strong> was conducting extensivework on forest inventories in tropical countries. Roughly one project existed for everytwo to three countries, and <strong>FAO</strong> experts in the projects provided valuable input to the1980 assessment results.In major forested areas for which existing information was lacking, the assessmentconducted manual interpretations of satellite imagery (1:1 000 000 scale). This wasdone for six Latin American countries, two African countries, two Asian countries andportions of two other Asian countries. The interpretations covered about 70–99 percentof these countries, using 55 satellite images.The final documentation for FRA 1980 included three volumes of country briefs(one for each developing country region) (<strong>FAO</strong>, 1981a, b and c), three regional
318<strong>Global</strong> <strong>Forest</strong> <strong>Resources</strong> <strong>Assessment</strong> <strong>2005</strong>summaries and a condensed main report, published as an <strong>FAO</strong> <strong>Forest</strong>ry Paper (<strong>FAO</strong>,1982). While the findings were not global, FRA 1980 was used again in 1988 to makean interim global assessment.Major findings on forest area and forest area change• Total forest area (tropical developing countries only) 1980: 2.1 billion hectares(natural forests and plantations)• Net forest change (tropical developing countries only) 1981–1985: -10.2 millionhectares per year• Net forest change (global): not reportedInterim assessment 1988The Interim report on the state of forest resources in the developing countries (<strong>FAO</strong>,1988) provided information on 129 developing countries (53 more than FRA 1980)as well as on industrialized countries. The report provided information on the stateof forests in the year 1980 and changes over the period 1981–1985. Definitions variedbetween the industrialized and developing countries specifically for crown coverthresholds for forests, which were set at 20 percent for industrialized countries and10 percent for developing ones. Information on the industrialized countries wascollected by UNECE in Geneva, which drew on the report <strong>Forest</strong> resources of the ECEregion (Europe, the USSR, North America) (UNECE and <strong>FAO</strong>, 1985). Parametersvaried as well for the two groups of countries. Thus a global synthesis of core elementswas needed in order to achieve a uniform global data set.Elements of the global synthesis included forest, operable forest, inoperable forest,other wooded land, broad-leaved forest and coniferous forest.Major findings on forest area and forest area change• Total forest area (global) 1980: 3.6 billion hectares• Net forest change (tropical developing countries) 1981–1985: -11.4 millionhectares per year• Net forest change (global): not reportedFRA 1990FRA 1990 (<strong>FAO</strong>, 1993) covered all developing and industrialized countries and wasdistinguished by two innovations: the development and use of a computerized ‘deforestationmodel’, which was applied to the developing country data in order to project forest areastatistics to a common reference year; and an independent, pan-tropical remote sensingsurvey of forest change based on high-resolution remote sensing data.FRA 1990 sought to improve estimates by eliminating the bias in expert opinionsthrough a statistical model for predicting forest area loss (and thus deforestation rates).The model was based on forest area change derived from the few comparable multidateassessments available. Deforestation rates were then regressed against independentvariables to determine the rate of forest loss relative to changes in population densitieswithin specific ecological zones. <strong>Forest</strong> area change rates were obtained by applyingthe model to available baseline statistics for the countries.The advantages of the 1990 method were the near-uniformity achieved by applyingthe model equally to almost all developing countries and the ability to streamlinethe production of statistics using computer routines. 1 The disadvantages of the 1990method were the low number of variables used in the deforestation algorithm and the¹ Two different models were used – one for the tropics and one for subtropical areas. Other differencesamong countries consisted in the lack of: baseline data in some countries, a uniform ecological map andcomparable multi-date observations.
Annex 6: Earlier global assessments 319low number of observations used to construct the model, introducing a relatively highrandom error (i.e. low precision) in country estimates.Because of the many uncertainties involved in working with existing national data,FRA 1990 implemented a remote sensing survey to provide a quality-controlled set ofstatistics on forest resources. The use of statistical sampling combined with a uniformdata source (satellite imagery) and standard data-collection methods were importanttools in providing a set of statistics to compare with the country data.The survey relied on statistical sampling (10 percent) of the world’s tropical foreststhrough 117 sample units distributed throughout the tropics. Based on the sampling,estimates were produced of the status of and changes in tropical forests at regional,ecological and pan-tropical levels (but not at the national level). Each of the sampleunits consisted of multi-date, Landsat satellite images, which provided the raw materialfor producing statistics on forest and other land cover changes from 1980 to 1990.<strong>FAO</strong> used an interdependent, manual interpretation of satellite scenes at a scaleof 1:250 000, conducted by local professionals, where possible, and internationallyexperienced professionals in other areas. Multi-date image interpretations weremanually compared to one another. Ground information was incorporated into about50 percent of the interpretations. In some areas, ground truthing was not necessary,owing to the large and consistent amount of forest. In other locations, especially wherethe composition of the landscape was highly differentiated, it was found to be veryvaluable.The principal output of the remote sensing survey was a change matrix thatillustrated and quantified how the forest and landscape change over time. The forestand land cover classification scheme of the remote sensing survey was linked closely tothe FRA classes for global reporting by countries.Different definitions of forests for developing and industrialized countries limited theutility of the final global synthesis, as did the absence of change information on forests inindustrialized countries. Only changes in the area of forest, combined with other woodedland, were assessed (the definition of forest was again set at 20 percent crown coverdensity for industrialized countries and 10 percent for developing countries).The assessment covered the parameters of volume, biomass, annual harvesting(tropics) and plantations. Brief summaries were also prepared on conservation, forestmanagement and biological diversity. Unfortunately, the country briefs prominent inFRA 1980 were discontinued.Major findings on forest area and forest area change• Total forest area (global) 1990: 3.4 billion hectares• Net forest change (tropical developing countries) 1980–1990: -13.6 millionhectares per year• Net forest change (global) 1980–1990: -9.9 million hectares per year (forest andother wooded land combined)Interim 1995 assessmentAn interim 1995 assessment was published in State of the World’s <strong>Forest</strong>s 1997 (<strong>FAO</strong>,1997b). This report published new statistics on forest area status and change for allcountries with a reference year of 1995, and a change interval from 1991–1995. Thedefinition of forest set canopy closure thresholds at 20 percent for industrializedcountries and 10 percent for developing countries.The baseline information set was drawn, with a minimum of updating, fromFRA 1990 data and had an average reference year of 1983. Although <strong>FAO</strong> contacted alldeveloping countries and requested their latest inventory reports, updated informationwas submitted and used only for Brazil, Bolivia, Cambodia, Côte d’Ivoire, Guinea-Bissau, Mexico, Papua New Guinea, the Philippines and Sierra Leone.
320<strong>Global</strong> <strong>Forest</strong> <strong>Resources</strong> <strong>Assessment</strong> <strong>2005</strong>The FRA 1990 deforestation model was used to adjust developing country statisticsto standard reference years (1991 and 1995). No adjustments to standard referenceyears were made for industrialized country statistics. Consequently, the industrializedand developing country data were not harmonized in terms of their definitions orreference year.Major findings on forest area and forest area change• Total forest area (global) 1995: 3.4 billion hectares• Net forest change (tropical developing countries) 1990–1995: -12.7 millionhectares per year• Net forest change (global): -11.3 million hectares per year (total forests)FRA 2000FRA 2000 improved on previous assessments in several ways. It covered more countriesand parameters and used a single global definition of forest. The average nationalinventory year for information was closer to the global reporting year than in previousassessments. More support than in the past was given to country capacity-building,and new technologies, such as remote sensing, were used extensively. Reliability of theresults was thus greatly enhanced, but there were still many information gaps.In FRA 2000, a uniform definition of forest – 10 percent canopy cover – was used forall regions of the world. Revised estimates were made for the area of temperate andboreal forests in 1990 using the definition and methodology adopted in 2000.An independent remote sensing survey used the same 117 sample units used inFRA 1990 and added recent Landsat satellite images, which made the productionof statistics possible on forest and other land cover changes from 1980 to 2000. Theresulting change matrix illustrated and quantified changes in the forest and landscapeover time. The survey showed different patterns among regions within the tropics,which may have reflected general land-use patterns and policies. In Latin America,large-scale, direct conversion of forests dominated. Direct conversions also dominatedin Africa, but on a smaller scale. In Asia, the area of gradual conversions (intensificationof shifting agriculture) was equal to the direct conversions from forests to other landuses. At the global level, direct conversions dominated the picture, accounting for aboutthree-quarters of the converted area. Most tropical deforestation was thus a result ofrapid, planned or large-scale conversion to other land uses, mainly agriculture.Efforts were made to increase the transparency and availability of backgroundinformation. Many working papers were published in order to provide details onkey countries and topics. Statistics, together with their underlying analyses andassumptions, were published on the <strong>FAO</strong> website. Countries were officially requestedto confirm their key statistics before publication. As a follow-up, a dedicated issue ofUnasylva (<strong>FAO</strong>, 2002c) reviewed forest resources assessment processes at global andnational levels. The Kotka IV expert consultation in 2002 also reviewed the FRA 2000process and results (Luhtala and Varjo, 2003).Major findings on forest area and forest area change• Total forest area (global) 2000: Nearly 3.9 billion hectares, of which 95 percentwas natural forest and 5 percent forest plantationsNet forest change (global) 1990–2000: -9.4 million hectares per year (forest)<strong>Global</strong> deforestation 1990–2000: 14.6 million hectares. <strong>Global</strong> increase in forestarea due to afforestation and natural expansion of forests during the same period:average of 5.2 million hectares per yearNet forest change (tropical countries) 1990–2000: -12.3 million hectares per year• Net forest change (non-tropical countries) 1990–2000: 2.9 million hectares peryear