iSTOXX® EUROPE MINIMUM VARIANCE INDEX - STOXX.com
iSTOXX® EUROPE MINIMUM VARIANCE INDEX - STOXX.com
iSTOXX® EUROPE MINIMUM VARIANCE INDEX - STOXX.com

Create successful ePaper yourself
Turn your PDF publications into a flip-book with our unique Google optimized e-Paper software.
STRATEGY <strong>INDEX</strong><br />
<strong>i<strong>STOXX</strong>®</strong> <strong>EUROPE</strong> <strong>MINIMUM</strong> <strong>VARIANCE</strong> <strong>INDEX</strong><br />
<strong>STOXX</strong>® GLOBAL TMI<br />
<strong>STOXX</strong>® GLOBAL 1800<br />
REGIONS SIZES SUPERSECTORS STYLE, STRATEGIES & THEME BLUE CHIPS<br />
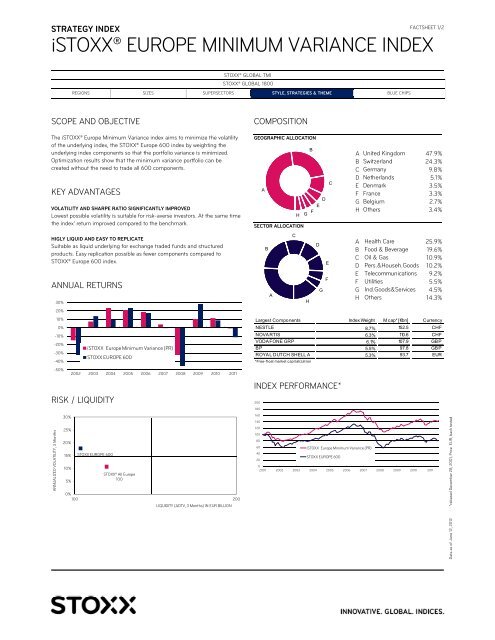
SCOPE AND OBJECTIVE<br />
The <strong>i<strong>STOXX</strong>®</strong> Europe Minimum Variance index aims to minimize the volatility<br />
of the underlying index, the <strong>STOXX</strong>® Europe 600 index by weighting the<br />
underlying index <strong>com</strong>ponents so that the portfolio variance is minimized.<br />
Optimization results show that the minimum variance portfolio can be<br />
created without the need to trade all 600 <strong>com</strong>ponents.<br />
KEY ADVANTAGES<br />
VOLATILITY AND SHARPE RATIO SIGNIFICANTLY IMPROVED<br />
Lowest possible volatility is suitable for risk-averse investors. At the same time<br />
the index’ return improved <strong>com</strong>pared to the benchmark.<br />
HIGLY LIQUID AND EASY TO REPLICATE<br />
Suitable as liquid underlying for exchange traded funds and structured<br />
products. Easy replication possible as fewer <strong>com</strong>ponents <strong>com</strong>pared to<br />
<strong>STOXX</strong>® Europe 600 index.<br />
ANNUAL RETURNS<br />
30%<br />
20%<br />
10%<br />
0%<br />
-10%<br />
-20%<br />
-30%<br />
-40%<br />
-50%<br />
i<strong>STOXX</strong> Europe Minimum Variance (PR)<br />
<strong>STOXX</strong> <strong>EUROPE</strong> 600<br />
2002 2003 2004 2005 2006 2007 2008 2009 2010 2011<br />
RISK / LIQUIDITY<br />
ANNUALIZED VOLATILITY, 3 Months<br />
30%<br />
25%<br />
20%<br />
15%<br />
10%<br />
5%<br />
<strong>STOXX</strong> <strong>EUROPE</strong> 600<br />
<strong>STOXX</strong>® All Europe<br />
100<br />
0%<br />
100 200<br />
LIQUIDITY (ADTV, 3 Months) IN EUR BILLION<br />
COMPOSITION<br />
GEOGRAPHIC ALLOCATION<br />
A<br />
SECTOR ALLOCATION<br />
B<br />
A<br />
C<br />
B<br />
D<br />
E<br />
F<br />
H G<br />
H<br />
D<br />
G<br />
E<br />
F<br />
C<br />
FACTSHEET 1/2<br />
A United Kingdom 47.9%<br />
B Switzerland 24.3%<br />
C Germany 9.8%<br />
D Netherlands 5.1%<br />
E Denmark 3.5%<br />
F France 3.3%<br />
G Belgium 2.7%<br />
H Others 3.4%<br />
A Health Care 25.9%<br />
B Food & Beverage 19.6%<br />
C Oil & Gas 10.9%<br />
D Pers.&Househ.Goods 10.2%<br />
E Tele<strong>com</strong>munications 9.2%<br />
F Utilities 5.5%<br />
G Ind.Goods&Services 4.5%<br />
H Others 14.3%<br />
Largest Components Index Weight M cap* [€ bn] Currency<br />
NESTLE 8.7% 152.5 C H F<br />
NOVA RTIS 6.3% 110.6 C H F<br />
VODAFONE GRP 6.1% 107.9 GB P<br />
B P 5.5% 97.8 GBP<br />
ROYAL DUTCH SHELL A 5.3% 93.7 EUR<br />
*Free-f loat market capit alization<br />
<strong>INDEX</strong> PERFORMANCE*<br />
200<br />
180<br />
160<br />
140<br />
120<br />
100<br />
80<br />
60<br />
i<strong>STOXX</strong> Europe Minimum Variance (PR)<br />
40<br />
20<br />
0<br />
<strong>STOXX</strong> <strong>EUROPE</strong> 600<br />
2001 2002 2003 2004 2005 2006 2007 2008 2009 2010 2011<br />
Data as of June 12, 2012 *rebased December 28, 2001, Price EUR, back tested
FACTSHEET 2/2<br />
STRATEGY <strong>INDEX</strong><br />
<strong>i<strong>STOXX</strong>®</strong> <strong>EUROPE</strong> <strong>MINIMUM</strong> <strong>VARIANCE</strong> <strong>INDEX</strong><br />
<strong>INDEX</strong> METHODOLOGY<br />
On the basis of the <strong>STOXX</strong>® Europe 600 index, the <strong>com</strong>ponents are ranked<br />
according to their liquidity (ADTV over 50 days). The top 300 constituents are<br />
selected.<br />
The remaining index constituents are then weighted using an optimization<br />
procedure that aims to minimize portfolio variance under certain constraints.<br />
The mathematical model minimizes the variance of the <strong>STOXX</strong>® Europe 600<br />
index portfolio.<br />
To avoid extreme <strong>com</strong>pany or sector concentrations, the constituent level is<br />
capped at 4.5% and the sector level at 20%.<br />
Quick Facts<br />
Weighting scheme Free float market capitalization and liquidity<br />
Review frequency M onthly<br />
Components Variable<br />
Component capping 4.5% for <strong>com</strong>ponents, 20% for sectors<br />
Currencies EUR<br />
Calculation hours 9:00 - 17:45 CET<br />
Calculation frequencies Realtime 15 sec., End-of-Day<br />
Launch date June 24, 2011<br />
Base value 100 as of December 28, 2001<br />
History back to December 28, 2001<br />
VERSIONS AND SYMBOLS<br />
Index ISIN Symbol Bloomberg Reuters<br />
Price EUR CH0124001618 ISEM VP ISEM VP Index .ISEM VP<br />
Net Ret. EUR CH0124001543 ISEM VT ISEM VT Index .ISEM VT<br />
Grs. Ret. EUR CH0128395313 ISEM VGT ISEM VGT Index .ISEM VGT<br />
<strong>STOXX</strong> is part of Deutsche Börse and SIX<br />
ABOUT <strong>STOXX</strong><br />
<strong>STOXX</strong> Ltd. is part of Deutsche Börse and SIX Group, and is an independent, leading index<br />
specialist. <strong>STOXX</strong> is providing innovative index solutions for global markets and across all asset<br />
classes. The indices are licensed to the world’s largest issuers of financial products, capital owners<br />
and asset managers as well as to more than 400 <strong>com</strong>panies around the world.<br />
CUSTOMIZATION<br />
The index can be used as basis for the definition of Customized indices, which can be tailored to<br />
specific client or mandate needs. <strong>STOXX</strong> offers customization in almost unlimited forms for<br />
example in terms of <strong>com</strong>ponent selection, weighting schemes and personalized calculation<br />
methodologies.<br />
DISCLAIMER<br />
<strong>STOXX</strong>® indices are protected through intellectual property rights. ‘<strong>STOXX</strong>’ and ‘EURO <strong>STOXX</strong> 50’<br />
are registered trademarks. The use of the <strong>STOXX</strong>® indices for financial products or for other<br />
purposes requires a license from <strong>STOXX</strong>. <strong>STOXX</strong> does not make any warranties or<br />
representations, express or implied with respect to the timeliness, sequence, accuracy,<br />
KEY RATIOS<br />
Name<br />
i<strong>STOXX</strong> Europe<br />
Minimum Variance (PR)<br />
Performance YTD 2.3% -0.4%<br />
Performance 1 Y -0.4% -9.4%<br />
Performance 3 Y (annualized) 8.0% 4.3%<br />
Performance 5 Y (annualized) -3.8% -9.2%<br />
Volatility 30 D (annualized) 10.5% 18.0%<br />
Volatility 1 Y (annualized) 13.4% 22.9%<br />
Sharpe ratio 1 Y -0.13 -0.47<br />
M arket capitalization (EUR) 1762 bn 4864 bn<br />
M arket capitalization (USD) 2507 bn 6920 bn<br />
ADTV (3 months, EUR) 120 bn 104 bn<br />
P/E (trailing) 19.0 22.2<br />
P/E (projected) 15.4 13.4<br />
Dividended yield 2.3% 2.5%<br />
Price/Book 3.1 1.6<br />
KEY PERFORMANCE<br />
<strong>STOXX</strong> <strong>EUROPE</strong> 600<br />
The <strong>i<strong>STOXX</strong>®</strong> Europe Minimum Variance index shows a significant increase of<br />
return <strong>com</strong>pared to the underlying <strong>STOXX</strong>® Europe 600 index.<br />
<strong>com</strong>pleteness, currentness, merchantability, quality or fitness for any particular purpose of its<br />
index data. <strong>STOXX</strong>® is not providing investment advice through the publication of the <strong>STOXX</strong>®<br />
indices or in connection therewith. In particular, the inclusion of a <strong>com</strong>pany in an index, its<br />
weighting, or the exclusion of a <strong>com</strong>pany from an index, does not in any way reflect an opinion of<br />
<strong>STOXX</strong> on the merits of that <strong>com</strong>pany. Financial instruments based on the <strong>STOXX</strong>® indices are in<br />
no way sponsored, endorsed, sold or promoted by <strong>STOXX</strong>.<br />
BACK TESTED PERFORMANCE<br />
This document contains index performance data based on back testing, i.e. calculations of how<br />
the index might have performed prior to launch if it had existed using the same index<br />
methodology and based on historical constituents. Back tested performance information is purely<br />
hypothetical and is provided in this document solely for information purposes. Back tested<br />
performance does not represent actual performance and should not be interpreted as an<br />
indication of actual performance.<br />
CONTACT DETAILS<br />
<strong>STOXX</strong> Customer Support Zurich/Headquarters Madrid: P +34 (0)91 369 1229 New York: P +1 212 669 6426 Singapore: P +65 9189 7970<br />
P +41 (0)58 399 5900 P +41 (0)58 399 5300 Frankfurt: P +49 (0)69 211 0 London: P +44 (0)207 862 7680 Tokyo: P + 81 (0)3 5847 8215<br />
customersupport@stoxx.<strong>com</strong> www.stoxx.<strong>com</strong> Paris: P +33 (0)1 4070 8004 Stockholm: P +46 (0)8 4600 6090 Hong Kong: P +852 6307 9316