AP Physics Chapter 2 Practice Test
AP Physics Chapter 2 Practice Test
AP Physics Chapter 2 Practice Test
- No tags were found...

Create successful ePaper yourself
Turn your PDF publications into a flip-book with our unique Google optimized e-Paper software.
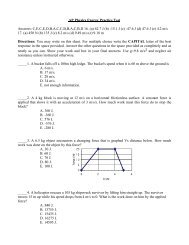
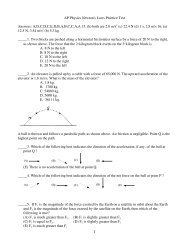
_____11. Use the Velocity Vs Time graph above to determine the acceleration at t = 3 sec .A. 0.5 m/s 2 .B. -0.5 m/s 2 .C. 2.0 m/s 2 .D. -2.0 m/s 2 .E. -4.0 m/s 2 ._____12. What is the velocity of the object whose motion is graphed below at t = 3 seconds?A. 3 m/s.B. -2 m/s.C. -3 m/s.D. 2 m/s.E. -0.5 m/s._____13. At time t = 0, car X traveling with speed v 0 passes car Y. which is just starting to move. Bothcars then travel on two parallel lanes of the same straight road. The graphs of speed v versus time t forboth cars are shown below. Which of the following is true at time t = 20 seconds?A. Car Y is behind car X.B. Car Y is passing car X.C. Car Y is in front of car X.D. Both cars have the same acceleration.E. Car X is accelerating fester then car Y._____14. In the absence of air friction, an object dropped near the surface of the Earth experiences aconstant acceleration of about 9.8 m/s 2 . This means that theA. speed of the object increases 9.8 m/s during each secondB. speed of the object as it falls is 9.8 m/sC. object falls 9.8 meters during each secondD. object falls 9.8 meters during the first second onlyE. slope of the distance Vs time graph for the object equals 9.8 m/s 23
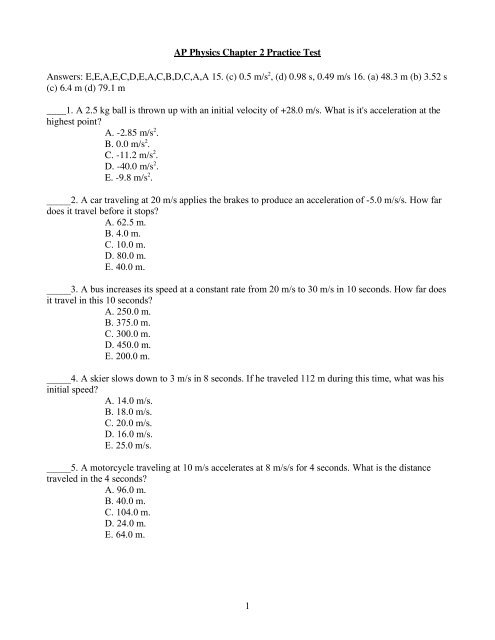
15. (8 Points) An astronaut drops a small snowball from a step on his spaceshipon Pluto. A picture of the snowball’s entire fall is taken while a strobe lightflashes every 0.2 seconds. The picture showing the position of the snowballevery 0.2 seconds at right is to actual scale.(a) Using a ruler, complete the position Vs Time data table below. Record yourdata in the units given.Time Position Position(sec) (cm) (m)0.00.20.40.60.8(b) Using your position Vs time data, complete the Velocity Vs Time data tablebelow. Record your data in the units given. Use this data to construct a VelocityVs Time graph on the axes at the bottom of the page.ΔPosition ΔTime Velocity(m) (sec) (m/s)(c) Using your Velocity Vs Time graph, determine the acceleration of thesnowball. Show your work on the graph and record your answer below.Acceleration = _____________ m/s 2(d) Using the acceleration you determined in part (c), predict the time it will takethe snowball to hit the ground and its speed just before it hits.4
16. (8 Points) Two hot air balloons are in a race and are moving vertically, balloon A is directly aboveballoon B as shown below. When the top of balloon B is 30 m above the ground and descending at 5m/s, balloon A is ascending at 8 m/s. At this moment balloon A drops a spear to puncture balloon B sothey can win the race. The spear is 15 m above the top of balloon B when it is released from rest, evenwith the bottom of balloon A. Each balloon is 6 m tall. Answer the questions below.(Note: This is a hard problem, if you can do half of it correctly you are doing well!)A6 m(a) What is the maximum height above the ground reached by the spear?15 mB(b) How much time passes after the spear is released to when it hits balloon B?30 m(c) How high is the basket of balloon B when the spear punctures it?(d) How high is the basket of balloon A the moment balloon B hits the ground? Assume balloon B is infreefall the moment it is punctured.5