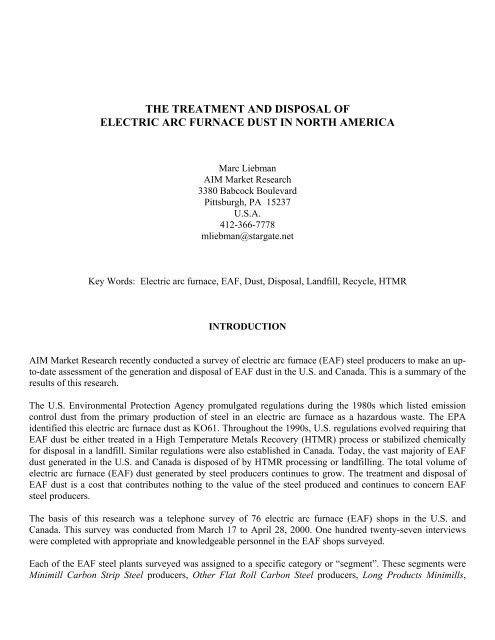
EAF Dust Treatment and Disposal
EAF Dust Treatment and Disposal
EAF Dust Treatment and Disposal
- No tags were found...

You also want an ePaper? Increase the reach of your titles
YUMPU automatically turns print PDFs into web optimized ePapers that Google loves.
Specialty Long Products mills, <strong>and</strong> Stainless Steel producers. The information obtained was then analyzedoverall <strong>and</strong> by each of these segments. Presentation of the analysis of results by segment is limited in thismanuscript in order to comply with the guidelines specified by The Iron <strong>and</strong> Steel Society.ELECTRIC ARC FURNACE DUST GENERATION AND COMPOSITIONTotal quantity of <strong>EAF</strong> dust generated - All of the <strong>EAF</strong> shops in the U.S. <strong>and</strong> Canada are estimated to havegenerated a total of 1.2 million tons of <strong>EAF</strong> dust in 1999. A total of 1,069,457 tons of <strong>EAF</strong> dust was generatedby the plants surveyed in 1999. Thus, the survey accounted for about 90% of the <strong>EAF</strong> dust production in the U.S.<strong>and</strong> Canada. The survey covered all of the Minimill Carbon Strip <strong>EAF</strong> shops <strong>and</strong> a high percentage of <strong>EAF</strong> shops inthe other segments. If Stainless Steel <strong>EAF</strong> shops <strong>and</strong> <strong>EAF</strong> based steel Foundries are not considered, the surveyaccounted for 94% of the total <strong>EAF</strong> dust generated from carbon steel production in the U.S. <strong>and</strong> Canada. <strong>EAF</strong>dust generated by Foundries is not subject to the same regulations as <strong>EAF</strong> dust from a primary steel plant. Thetreatment of Stainless Steel <strong>EAF</strong> dust in most cases is subject to a different cost structure than for <strong>EAF</strong> dustgenerated by carbon steel producers.Table I below summarizes the share of <strong>EAF</strong> dust generated that is accounted for by the survey <strong>and</strong> in each industrysegment. This analysis was based on the share of total <strong>EAF</strong> dust generation that was accounted for in the surveyversus the <strong>EAF</strong> dust generation in the U.S. <strong>and</strong> Canada not included in the survey. AIM estimated the <strong>EAF</strong> dustgenerated by plants not surveyed by using a formula derived from the average level of <strong>EAF</strong> dust generated forthe facilities within each segment that were surveyed.SegmentsTable I: Share of total <strong>EAF</strong> dust production by plants surveyed<strong>Dust</strong> Production byPlants Surveyed(tons)<strong>Dust</strong> Production byPlants Not Surveyed(tons)TotalShare ofTotal inSurveyMinimill Carbon Strip (9) 284,600 0 284,600 100%Carbon/Alloy Flat Roll (8) 98,200 2,023 100,223 98%Minimill Long Prod (41) 519,969 37,606 557,575 93%Specialty Long Prod (15) 141,313 10,594 151,907 93%Stainless Steel(3) 25,375 27,000 52,375 48%<strong>EAF</strong> Based Steel Foundries 0 18,581 18,581 0%Ingot Cast Shops 0 19,632 19,632 0%Total 1,069,457 115,436 1,184,893 90%The quantity of <strong>EAF</strong> dust generated by Stainless Steel facilities not surveyed was estimated by multiplying theaverage level of <strong>EAF</strong> dust generated in the three facilities surveyed (26.7 lbs./ton) by the estimated total steelproduction of all Stainless Steel facilities. The formula derived from plants surveyed in the Specialty Long
Products segment was used as a basis for projecting <strong>EAF</strong> dust production for Foundries <strong>and</strong> Ingot Cast Shops.This is because Specialty Long Products plants commonly cast ingots <strong>and</strong> therefore have high revert rates notunlike Foundries <strong>and</strong> Ingot Cast Shops.Share of <strong>EAF</strong> dust generated by segment - <strong>EAF</strong> dust generating facilities (40) in the Minimill Long Productssegment accounted for 49% of all <strong>EAF</strong> dust generated by the plants surveyed. A significant share (27%) of thetotal <strong>EAF</strong> dust generated was accounted for by the nine <strong>EAF</strong> Minimill Carbon Strip plants surveyed. The shareof <strong>EAF</strong> dust generated by the 75 <strong>EAF</strong> plants surveyed that produced steel in 1999 is illustrated in Figure 1.Total <strong>EAF</strong> <strong>Dust</strong>Generation =1,069,457 tonsStainless SteelSpecialty Long 2%Prod13%Minimill CarbonStrip27%Minimill LongProd49%Carbon/AlloyFlat Roll9%Figure 1: <strong>EAF</strong> dust generated by plants surveyedRate of <strong>EAF</strong> dust generation per ton of steel - Of the <strong>EAF</strong> shops that responded to the survey, 82% generatedfrom 25 to 44 pounds of <strong>EAF</strong> dust per ton of steel produced. Figure 2 provides a distribution of the generationof <strong>EAF</strong> dust per ton of steel produced.Share of Plants Surveyed50%40%30%20%10%0%42%40%11%5%14-24 25-34 35-44 >45Lbs of <strong>EAF</strong> <strong>Dust</strong> per Ton of Steel MeltedFigure 2: <strong>EAF</strong> dust generated per ton of steel by (73) plants surveyed
The <strong>EAF</strong> Minimill Carbon Strip plants generated the most <strong>EAF</strong> dust per ton of steel produced. Of the <strong>EAF</strong>Minimill Carbon Strip plants surveyed, 77% generate at least 35 pounds per ton of steel produced.Annual level of <strong>EAF</strong> dust generation by each shop - Of the <strong>EAF</strong> shops that responded, 42% (31) eachgenerate from 7,500 to 14,999 tons of <strong>EAF</strong> dust per year. On-site <strong>EAF</strong> dust treatment will only be consideredwhere the economies of scale necessary to justify the capital expense of an on-site treatment technology arerealized. The survey reveals the rarity of instances in which an adequate level of <strong>EAF</strong> dust is generated tojustify an on-site facility employing currently commercially viable technologies. Only seven of the <strong>EAF</strong> shopssurveyed generated 30,000 tons or more of <strong>EAF</strong> dust per year, five of which were in the Minimill Carbon Stripsegment. Plants with this level of <strong>EAF</strong> dust generation provide the strongest opportunity for justifying on-site<strong>EAF</strong> dust treatment. Of Minimill Carbon Strip <strong>EAF</strong> shops surveyed, 56% (5 of 9) each generated 30,000 ormore tons of <strong>EAF</strong> dust annually. The other two <strong>EAF</strong> shops which generated 30,000 tons or more <strong>EAF</strong> dust peryear produce carbon steel long products. The Minimill Long Products <strong>and</strong> Specialty Long Products plantsexhibited a similar distribution profile regarding <strong>EAF</strong> dust annual generation. Figure 3 provides a distributionof the annual generation of <strong>EAF</strong> dust.Share of Plants Surveyed50%40%30%20%10%0%23%42%30,000Expected changes in level of <strong>EAF</strong> dust generation - No change in the quantity of <strong>EAF</strong> dust generated isexpected by 88% (63) of the 72 <strong>EAF</strong> shops that responded. Of the nine plants that did project a change, all butone expect the volume of <strong>EAF</strong> dust to decline. Of these eight shops that project a reduction, five believe that thereduction will be attributed to an effort to minimize the quantity of <strong>EAF</strong> dust generated, or to a change intendedto achieve that objective. New <strong>EAF</strong> steel production is contemplated by several steel producers in the U.S.; thiswould increase the volume of <strong>EAF</strong> dust generated in the U.S. <strong>and</strong> Canada.Typical chemistry of <strong>EAF</strong> dust currently generated - The chemistry of <strong>EAF</strong> dust is a significant factor indetermining the potential viability of recycling the <strong>EAF</strong> dust to recover metals. In carbon based steel
production, zinc oxide recovery provides the best opportunity to obtain some value from recycling <strong>EAF</strong> dust. Alimited number of zinc producers use crude zinc oxide from an HTMR facility to produce zinc.Of the 62 <strong>EAF</strong> shops that responded, 47% (29) indicated that the percentage of zinc oxide (ZnO) in their <strong>EAF</strong>dust ranged from 15 to 24.9% <strong>and</strong> 21% (13) had a zinc oxide content of 25% or more. Figure 4 indicates theshare of <strong>EAF</strong> shops that responded overall that generate <strong>EAF</strong> dust within a range of zinc oxide content.>25 % ZnO21%15 - 24.9% ZnO47%
Overall, 47% (29) of the 61 <strong>EAF</strong> shops that responded indicated that the percentage of cadmium oxide (CdO) intheir <strong>EAF</strong> dust was .04% or more. As is the case with lead oxides, cadmium oxides in <strong>EAF</strong> dust are capturedwith the zinc oxide, therefore having a negative impact on the value of the crude zinc oxides.Of the 47 <strong>EAF</strong> shops that responded, 34% (16) indicated that the percentage of lime (CaO) in their <strong>EAF</strong> dustwas 10% or more. The long products <strong>EAF</strong> shops surveyed tended to have the greatest amount of lime in their<strong>EAF</strong> dust. Overall, 44% of the plants in the Specialty Long Products segment <strong>and</strong> 39% of plants in the MinimillLong Products segment had 10% or more lime in their <strong>EAF</strong> dust. The Minimill Carbon Strip <strong>EAF</strong> shopssurveyed all indicated that the percentage of lime in their <strong>EAF</strong> dust was 5 to 9.9%.Charging lime into the <strong>EAF</strong> - Steel producers add lime (CaO) to desulfurize the steel in the <strong>EAF</strong>. Theparticular practice employed in charging lime to the <strong>EAF</strong> can have a significant impact on the volume of the<strong>EAF</strong> dust generated. For example, when lime is injected pneumatically through the roof of an <strong>EAF</strong>, the lime canend up being sucked out the fourth hole along with the furnace off-gases.Of the 60 <strong>EAF</strong> shops that responded, 63% (38) revealed that lime is charged into the <strong>EAF</strong> by first charging itinto a Scrap Bucket. The next most common lime charging method is Injection (23%); this includes Injection inthe front or side of the furnace, through the roof, or through a “fifth hole”. When using a Scrap Bucket to chargelime, the lime content in the dust tends to decline. When charging lime directly either into the furnace orthrough the roof, the lime content in dust tends to increase. Only 44% of the plants with a lime content above15% use a Scrap Bucket. In contrast, the plants that have less than 15% lime in their dust predominantly (in 70to 80% of the cases) are using a Scrap Bucket . This is illustrated in Figure 5.Share of Plants100%80%60%40%20%0%80% 80%70%44%1533%20% 22%20%16%10%4%0%Scrap Bucket Furnace RoofLime Charging MethodFigure 5: Correlation analysis between % CaO in <strong>EAF</strong> dust <strong>and</strong> method of charging lime (CaO)
GENERAL <strong>EAF</strong> MELT SHOP INFORMATION<strong>EAF</strong> shops in the survey produced 54.7 million tons of steel in 1999, <strong>and</strong> operated at roughly 82% of theircapacity of 67.1 million tons. The plants surveyed represented 94% of the total <strong>EAF</strong> steel production in the U.S.<strong>and</strong> Canada <strong>and</strong> approximately 44% of the total steel production (123.8 million tons) for the U.S. <strong>and</strong> Canada in1999. Overall, the <strong>EAF</strong> shops that responded to the survey projected an 11% increase in annual steel productionin 2000.Carbon steel production accounted for 81% of the steel produced by the <strong>EAF</strong> shops surveyed, alloy steelsaccounted for 15%, stainless steel accounted for 3%, <strong>and</strong> resulfurized <strong>and</strong> silicon steels accounted for theremaining 1%.IRON BEARING CHARGE MATERIAL MELTEDThe types of scrap <strong>and</strong> other iron bearing charge materials (IBCMs) consumed in the production of steel have asignificant impact on the quantity of <strong>EAF</strong> dust generated. Higher qualities of steel scrap contain less residuals<strong>and</strong> other heavy metals, such as zinc, lead, cadmium, etc. <strong>and</strong> lower qualities of steel scrap result in greater dustvolumes <strong>and</strong> higher levels of these heavy metals in the dust. For this reason, we also obtained information aboutthe IBCMs consumed by these plants including scrap types, pig iron, <strong>and</strong> alternative iron sources such as DRI<strong>and</strong> HBI. Shredded scrap is the type of iron bearing charge material most frequently (85%) melted by the <strong>EAF</strong>plants surveyed. Shredded scrap also accounts for the largest single share (25%) of IBCM consumed by the<strong>EAF</strong> shops that responded.CURRENT <strong>EAF</strong> DUST DISPOSITIONThe two fundamental alternatives for disposing of <strong>EAF</strong> dust are l<strong>and</strong>filling <strong>and</strong> recycling. When decidingbetween these alternatives, several factors are essential. The main factors are economic (treatment <strong>and</strong>transportation costs), environmental (regulations <strong>and</strong> conservation), long term liability, <strong>and</strong> concerns overpublic opinion. Overall, 63% (47) of the 75 plants that responded arrange to have <strong>EAF</strong> dust recycled in a HighTemperature Metals Recovery (HTMR) facility, 41% (31) utilize a L<strong>and</strong>fill, <strong>and</strong> 5% employ other recyclingtechniques. Several employ more than one <strong>EAF</strong> dust disposal solution.Recycling <strong>EAF</strong> dust using an HTMR process is most common (73%) among the Minimill Long Products <strong>EAF</strong>shops <strong>and</strong> least common (50%) in the Carbon/Alloy Flat Roll plants. Employing l<strong>and</strong>fills for disposal is mostcommon (60%) in the Specialty Long Products plants, but these plants are also most likely (7%) to be usingother recycling methods. Overall, 54% (586,939 tons) of the total quantity of <strong>EAF</strong> dust generated by the plantssurveyed is recycled; 45% (470,518 tons) is l<strong>and</strong>filled. While some plants employ both options, the majority of
Recycling of <strong>EAF</strong> dust - Of the 51 plants that recycle their <strong>EAF</strong> dust, 86% (44) recycle 100% of this dust, <strong>and</strong>another 8% recycle at least 50%. Only six of the <strong>EAF</strong> shops surveyed recycle all or a portion of their <strong>EAF</strong> dustin an on-site facility or directly into their <strong>EAF</strong>. Three other plants acknowledged having had on-site <strong>EAF</strong> dustprocessing operations in the past. Just two plants acknowledged that they are considering a new on-site <strong>EAF</strong>dust treatment technology.Each plant that is not considering an on-site <strong>EAF</strong> dust treatment facility was asked what would motivate themto consider a new on-site technology. Overall, 46% (32) of the plants that responded said they would consider itif it were more Cost Effective than the present practice. However, 33% (23) of the plants said that they wouldnot consider it in any case, believing that economies of scale would not permit an on-site facility to beeconomically viable considering today’s known <strong>EAF</strong> dust processing technology.The distance that <strong>EAF</strong> dust must be shipped is also a factor in the cost of recycling <strong>EAF</strong> dust. Overall, 38% (17)of the 45 plants that identified the location of their off-site <strong>EAF</strong> dust recycling facility ship their <strong>EAF</strong> dust atleast 500 miles for processing. Only 31% (14) of these plants only need to ship their <strong>EAF</strong> dust for l<strong>and</strong>fill lessthan 200 miles. A distribution of the distance ranges’ shares of <strong>EAF</strong> plants that use an off-site l<strong>and</strong>fill processoris presented in Figure 7.40%40%Share of Plants30%20%10%18%13%22%16%0%1000Figure 7: Distance to off-site <strong>EAF</strong> dust recycle processor - overallDRIVERS AND TRENDS FOR <strong>EAF</strong> DUST PROCESSINGEach plant was asked to indicate the relative importance of four leading drivers for <strong>EAF</strong> dust processing.Overall, Economic Issues was the most frequently identified driver indicated regarding <strong>EAF</strong> dust processing.Regulatory Considerations <strong>and</strong> Industry Dynamics (such as Scrap Types) were of secondary importance.Technological Factors was the least frequently identified driver.
Economic issues - When asked to rate the importance of reducing the cost of processing <strong>EAF</strong> dust, all but twoplants replied “10” (on a scale from 0 to 10, 10 being highest). The highest level of activity among <strong>EAF</strong> steelproducers in responding to <strong>EAF</strong> dust treatment <strong>and</strong> disposal drivers involves Economic Issues. When asked todescribe their plant’s level of activity regarding Economic Issues associated with <strong>EAF</strong> dust, all plants indicated“High”.Of the plants surveyed, 95% (72) acknowledged paying a processor to h<strong>and</strong>le their <strong>EAF</strong> dust. However, only 11plants would reveal the fee or fee range. The processing fees indicated by these plants ranged from a low of $70per ton to a high of $150 per ton. The cost of recycling is generally higher than the cost of l<strong>and</strong>filling, exceptwhere either is affected by transportation costs. Figure 8 provides a distribution of the total cost of processing(including transportation) indicated by individual plants surveyed, whether the <strong>EAF</strong> dust is recycled (R) orl<strong>and</strong>filled (L), <strong>and</strong> the distance shipped.Minimum Maximum Distance (Miles)$/TonMiles160140120100806040200120010008006004002000-2001(L)2(R)3(R)4(L)5(L)6(L)7(R)8(R)9(R)10(L)11(R)Plant No.Figure 8: Cost of <strong>EAF</strong> dust processing vs. mileage to siteOf the 72 plants that pay a processor to h<strong>and</strong>le their <strong>EAF</strong> dust, 10% (7) expect the processing fee to increase,while 53% (38) do not. The remaining plants replied that they did not know what to expect. Of the seven thatexpect the fee to increase, five acknowledged that they expect this trend to continue. Of the 38 <strong>EAF</strong> shopsoverall that do not expect the <strong>EAF</strong> processing fee to increase, 53% (20) expect the <strong>EAF</strong> dust processing fee toremain stable.Regulatory considerations - Based on the responses, it is clear that <strong>EAF</strong> steel plants are actively involved inaddressing the Regulatory Considerations associated with <strong>EAF</strong> dust processing. Overall, 62% of the <strong>EAF</strong> plantssurveyed indicated a “High” level of activity in dealing with Regulatory Considerations <strong>and</strong> another 37%indicated at least a “Medium” level of activity.
Generally speaking, the plants surveyed expect the regulations for treatment <strong>and</strong> disposal of <strong>EAF</strong> dust shallreflect the status quo. The regulatory authorities are keeping a low profile, while insuring compliance <strong>and</strong>enforcement of the existing regulations. Processors <strong>and</strong> acceptable treatment technologies have been in placefor some time <strong>and</strong> appear to be h<strong>and</strong>ling <strong>EAF</strong> dust to the satisfaction of the regulatory agencies. Stateregulations are typically of the greatest concern to the <strong>EAF</strong> plants overall. In many cases the United States EPAhas delegated enforcement to the state authorities.Technological factors - All <strong>EAF</strong> shops indicated a “9” or “10” level of interest in response to the question ofwhether they would be interested in minimizing the amount of <strong>EAF</strong> dust generated.Leading trends in <strong>EAF</strong> dust processing - The leading trend in <strong>EAF</strong> dust processing is an ongoing <strong>and</strong>concerted effort by steel producers to Reduce Spending, followed by a significant effort to Reduce <strong>EAF</strong> <strong>Dust</strong>Volumes. Overall, 68% of the plants commented that Reduced Spending on <strong>EAF</strong> dust processing is their mainfocus <strong>and</strong> 45% mentioned Reduced <strong>Dust</strong> Volume. Overall, 81% (51) of the 63 plants that responded expect thatthese trends will impact upon the viability of their operation.Only five <strong>EAF</strong> shops said they plan to change their <strong>EAF</strong> dust processor. Just four acknowledged seeking a newsolution for <strong>EAF</strong> dust disposition.SUMMARYIn summary, despite continuing efforts to reduce the volume of electric arc furnace dust generated, the totalvolume of <strong>EAF</strong> dust generated by steel producers continues to grow. <strong>EAF</strong> dust disposal <strong>and</strong> treatment is a costof <strong>EAF</strong> steel production that contributes nothing to the value of the steel produced. It is a cost burden thatcontinues to plague <strong>EAF</strong> steel producers. A limited number of options for disposal <strong>and</strong> recycling are presentlyemployed. <strong>EAF</strong> steel producers are ripe for considering any new technologies or treatment alternatives that willreduce the volume of <strong>EAF</strong> dust generated <strong>and</strong> ultimately the cost of processing <strong>EAF</strong> dust.ACKNOWLEDGMENTSAIM Market Research would like to acknowledge the financial support for this study provided by HeckettMultiServ West <strong>and</strong> the Canada Center for Mineral <strong>and</strong> Energy Technology (CANMET). AIM also thanks theone hundred twenty-seven respondents from <strong>EAF</strong> steel producing shops who shared their time <strong>and</strong> information.
REFERENCES1. Bernard J. Hrosik, 127 Interviews with personnel in 76 <strong>EAF</strong> melt shops, AIM Market Research, March17 to April 28, 2000.2. Marc Liebman, “<strong>EAF</strong> <strong>Dust</strong> <strong>Treatment</strong> Market Study”, Report No. 28, January 1992, AIM MarketResearch.3. Marc Liebman, “Electric Arc Furnace <strong>Dust</strong> <strong>and</strong> Slag Market Study”, Report No. 53, June 1993, AIMMarket Research.4. Marc Liebman, “IRRS Process <strong>and</strong> <strong>EAF</strong> <strong>Dust</strong> Processing Requirements Market Study”, Report No. 1,October 1988, AIM Market Research.5. “Proceedings of the 1998 CMP Electric Arc Furnace <strong>Dust</strong> Management Symposium”, Report CR-110348, March 1998, EPRI Center for Materials Production (CMP).6. “Statistics”, Iron & Steelmaker magazine, published by the Iron & Steel Society, March 2000, page 9.