CRC - MEUC
CRC - MEUC
CRC - MEUC

Create successful ePaper yourself
Turn your PDF publications into a flip-book with our unique Google optimized e-Paper software.
COVER STORY<br />
Ihave for several years been convinced<br />
that a fundamental reason why people<br />
don't 'get' climate change is that we don't<br />
see the 80 million tonnes of carbon dioxide<br />
we release into the atmosphere every day,<br />
mainly from burning fossil fuels. As a<br />
species we're hard-wired to react to visible<br />
things. For most people sight is our number<br />
one sense and has served us well. Now, the<br />
biggest threat we face is caused by something<br />
invisible and intangible.<br />
A way round this problem is to picture<br />
our greenhouse gas emissions - to illustrate<br />
the actual volume of gas. We can reveal<br />
current emissions, targets or savings<br />
(greenhouse gases that have been prevented<br />
from entering the atmosphere) in a visually<br />
compelling way. By showing these volumes<br />
of the gas at 100 per cent concentration<br />
as spheres, cubes or other shapes and<br />
placing them in landscapes familiar to the<br />
audience, then the problem starts to 'make<br />
sense'. Stakeholders recognise that the<br />
problem is real, reduction targets can be<br />
set and actions can be taken which have<br />
everyone's support.<br />
The Carbon<br />
Quilt(tm)<br />
IF THE daily 80 million tonnes of CO2<br />
was a thin invisible layer over our heads<br />
at 100 per cent concentration it would<br />
be the thickness of a piece of paper - 80<br />
microns. We have embarked on a giant<br />
'wrap-the-planet' game with nature. But<br />
it looks like there won't be a winner. Of<br />
course nature adjusts - by absorbing half<br />
this quantity in forests, soils and oceans.<br />
But simple chemistry confirms that<br />
carbon dioxide absorption by oceans<br />
increases their acidity.<br />
The other 40 million tonnes per day<br />
stays in the atmosphere so in effect we<br />
are building an extra 15mm of pure CO2<br />
layer into the atmosphere every year.<br />
Before the Industrial Revolution, this<br />
'layer' was just over 2 metres thick, vital<br />
for keeping the planet at a comfortable<br />
temperature. Now it is over 3 metres<br />
and thickening fast.<br />
Understanding carbon emissions is a difficult issue for<br />
most people to grasp. The gasses are invisible to the<br />
eye and therefore their weight is virtually impossible to<br />
visualise. However, during <strong>MEUC</strong>'s 'Tomorrow's Energy<br />
World' meeting at the NEMEX Exhibition in Birmingham,<br />
Antony Turner, Managing Director of CarbonSense and<br />
CEO of the recently formed Carbon Visuals Ltd., had<br />
the audience spellbound<br />
with a simple yet fully<br />
understandable<br />
visualisation method his<br />
London's daily carbon dioxide emissions -<br />
139,000 tonnes of carbon dioxide - would<br />
fill a sphere 521 metres across. Image:<br />
Carbon Visuals Ltd.<br />
organisation has created.<br />
The Carbon Quilt and other volumetric<br />
representations of greenhouse gases help<br />
people to make sense of emissions and their<br />
contribution to climate change and can<br />
make an important contribution to carbon<br />
communication. Framing climate change as<br />
a problem of 'changing the atmosphere'<br />
helps people see the emissions arising from<br />
any human activity. Decisions and choices<br />
around home, work, food, energy and travel<br />
then have a reference point in people's<br />
real world. Behavioural research shows that<br />
a sense of ownership ensures people are<br />
more likely to take action.<br />
Major energy users now have a choice.<br />
They can grumble about ever increasing<br />
Government 'red tape' around this issue, or<br />
they can radically reposition the issue as<br />
fundamental to their business. They can<br />
allocate the problem a minimum of<br />
resources and strategic thinking, or they can<br />
move into pro-active mode, recognising the<br />
enormity of the challenge and seek to find<br />
ways to be part of the solution, rather than<br />
just part of the problem.<br />
Over the last five years we have been<br />
invited to help companies such as BT, TNT<br />
and the Scandinavian telecoms giant Telenor<br />
understand these issues and find ways to<br />
show leadership. We have used a framework<br />
called the Carbon Journey to help boards<br />
and senior managers chart a way towards a<br />
leadership position that minimises business<br />
risks and opens up opportunities whilst<br />
strengthening employee and other stakeholder<br />
engagement. And in the last two<br />
years we have increasingly used carbon visualisation<br />
as a way to help communicate carbon<br />
footprint information to both time-constrained<br />
people - typically boards and<br />
trustees - and wider stakeholder groups of<br />
employees, shareholders, customers and<br />
members of the local community.<br />
A recent example of the success of this<br />
approach is Central Bedfordshire Council,<br />
which has become the first local authority in<br />
the UK to take the 'visual language' route to<br />
communicating carbon footprints and targets<br />
to key stakeholders and staff. The Guardian<br />
Media Group and the South Kensington<br />
1851 Estate are also using this method for<br />
internal carbon footprint communication.<br />
Major energy users have a financial<br />
interest in reducing their carbon footprints.<br />
But they are increasingly being asked to<br />
communicate to boards, management<br />
teams and external stakeholders. A clear climate<br />
change strategy that incorporates<br />
smart internal and external carbon communication<br />
will become increasingly important<br />
for these organisations.<br />
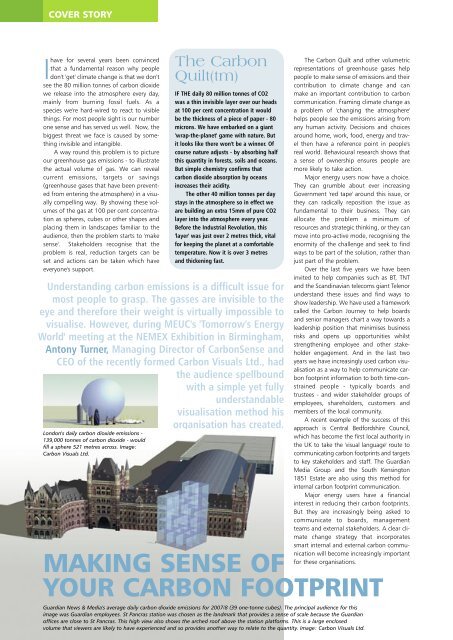
MAKING SENSE OF<br />
YOUR CARBON FOOTPRINT<br />
Guardian News & Media's average daily carbon dioxide emissions for 2007/8 (39 one-tonne cubes). The principal audience for this<br />
image was Guardian employees. St Pancras station was chosen as the landmark that provides a sense of scale because the Guardian<br />
offices are close to St Pancras. This high view also shows the arched roof above the station platforms. This is a large enclosed<br />
volume that viewers are likely to have experienced and so provides another way to relate to the quantity. Image: Carbon Visuals Ltd.