Innisfil Creeks Subwatershed Plan 2012 - Lake Simcoe Region ...
Innisfil Creeks Subwatershed Plan 2012 - Lake Simcoe Region ...
Innisfil Creeks Subwatershed Plan 2012 - Lake Simcoe Region ...
- No tags were found...

Create successful ePaper yourself
Turn your PDF publications into a flip-book with our unique Google optimized e-Paper software.
AcknowledgementsThe Barrie <strong>Creeks</strong>, Lovers Creek and Hewitt’s Creek <strong>Subwatershed</strong> <strong>Plan</strong> was completed withthe assistance of many participants. The report was prepared by staff of the <strong>Lake</strong> <strong>Simcoe</strong><strong>Region</strong> Conservation Authority with input from the Barrie and <strong>Innisfil</strong> <strong>Subwatershed</strong> <strong>Plan</strong>sWorking Group, the members of which are listed below. We would like to express ourappreciation to all who contributed.Mike Walters - General Manager of Watershed Management, <strong>Lake</strong> <strong>Simcoe</strong> <strong>Region</strong>Conservation Authority (LSRCABen Longstaff - Manager of Integrated Watershed Management, LSRCAPhil Davies - Manager of Watershed Stewardship, LSRCAWayne Bando - Infrastructure <strong>Plan</strong>ning Engineer, City of BarrieEric Hodgins - Growth Management Coordinator, City of BarrieJennifer Robinson – Councillor, City of BarrieJim Zimmerman - Director of Infrastructure and Town Engineer, Town of <strong>Innisfil</strong>Grant Shellswell – Manager of Engineering, Town of <strong>Innisfil</strong>Tim Cane – Manager of <strong>Plan</strong>ning, Town of <strong>Innisfil</strong>Karel Kamerman – Senior Regulatory Compliance Officer, Town of <strong>Innisfil</strong>Silvia Pedrazzi - South <strong>Simcoe</strong> Streams NetworkElizabeth Stanley - <strong>Lake</strong> <strong>Simcoe</strong> Area Supervisor, Ministry of Natural Resources (MNR)Kate Gee - District Ecologist (Acting), MNREmma Followes – Stewardship Coordinator, MNREmily Funnell – Management Biologist, MNRRobin Skeates - Senior Engineer, <strong>Lake</strong> <strong>Simcoe</strong> Project, MOEEllen Schmarje - Senior Program Advisor, <strong>Lake</strong> <strong>Simcoe</strong> Project, MOETim Brook - Water Management Engineer (Acting), MAFRAGreg Marek – <strong>Plan</strong>ner, County of <strong>Simcoe</strong>
The <strong>Innisfil</strong> <strong>Creeks</strong> <strong>Subwatershed</strong> <strong>Plan</strong> (<strong>2012</strong>)WHAT IS A SUBWATERSHED PLAN?<strong>Subwatershed</strong> planning is a process whereby thecomponents of the environmental system arecharacterized, the stresses and demands on thosesystems are identified, and actions arerecommended to guide the management of thesubwatershed. These demands can be from urbanand agricultural land uses and recreation; and alsoinclude the ecological needs of the system. Socialand economic factors are also considered throughthe subwatershed planning process.A subwatershed plan will normally includerecommendations around:• Stormwater managementExecutive Summary• Protection of the integrity of both hydrological and hydrogeological functions.• Improvement of water quality.• Conservation of wetlands and woodlands.• Maintenance or enhancement of fish habitat.• Conservation and restoration of ecologically functional natural features and corridors.• Land-use planning.Maintenance of the ecological processes of the subwatershed through the retention of key naturalheritage features, sufficient supplies of ground and surface water, and the protection of water qualityand aquatic habitat while planning for urbanizing land uses and landscape restoration, are integral tothe subwatershed planning process.<strong>Subwatershed</strong> plans are often implemented through the incorporation of policies into municipalplanning documents, including Official <strong>Plan</strong>s, and Secondary, District or Community <strong>Plan</strong>s andsubsequent development applications.CONTEXTThis subwatershed plan looks at the tributaries that make up the <strong>Innisfil</strong> <strong>Creeks</strong> subwatershed. Thesubwatershed is located on the western side of the <strong>Lake</strong> <strong>Simcoe</strong> watershed. It lies almost entirelywithin the Town of <strong>Innisfil</strong>, with just over 3% within the City of Barrie and less than 1% in the Town ofBradford West Gwillimbury. The subwatershed is 107 km 2 in size, and accounts for 4% of <strong>Lake</strong><strong>Simcoe</strong>’s total watershed area. It consists of 17 named streams: Banks Creek, Belle Aire Creek, BonSecours Creek, Carson Creek, Cedar Creek, Gilford Creek, Holland River, <strong>Innisfil</strong> <strong>Creeks</strong> (smallunnamed tributaries), Leonard’s Creek, Mooselanka Creek, Moyer Creek, Sandy Cove Creek,Strathallan Creek, Sylvan Creek, Upper Marsh Creek, White Birch Creek, and Wilson Creek. All of thesubwatershed’s streams have headwaters in agricultural areas, and then flow downstream, somethrough urban areas, before entering the lake.
Land use in the subwatershed is currently dominated by agriculture, which occupies 45% of thesubwatershed area. Natural heritage cover accounts for 33% of the subwatershed. Developed landaccounts for approximately 14 % of the land use; while the remaining area includes rural development,roads and railways, golf courses, and aggregate operations. This area has undergone fairly significantchange in recent years, with the urban area expected to continue to expandThis subwatershed plan was prepared under the direction of the <strong>Lake</strong> <strong>Simcoe</strong> Protection <strong>Plan</strong> (LSPP),which was released by the province in 2009. The LSPP identifies the preparation of subwatershedevaluations/plans as a crucial stage in its implementation. The LSPP states that they “will be critical forprioritizing actions, developing focused action plans, monitoring andevaluating results…[and will] provide more detailed guidance for areaspecifichydrologic and natural heritage resource planning andmanagement.”It should be noted that the <strong>Lake</strong> <strong>Simcoe</strong> <strong>Region</strong> Conservation Authority’s(LSRCA’s) Integrated Watershed Management <strong>Plan</strong> (IWMP) (2008) alsoinfluenced the development of this subwatershed plan. The IWMP,released by the LSRCA in 2008, is considered to be a road map thatoutlines the future direction of the protection and rehabilitation of the entire<strong>Lake</strong> <strong>Simcoe</strong> watershed. Its broad-scale recommendations provide thebasis for a number of this plan’s recommended actions for the smallerscale <strong>Innisfil</strong> <strong>Creeks</strong> subwatersheds; these two reports are meant tocomplement each other.APPROACHThe initial focus of this subwatershed planningexercise used an ecosystem approach. Thisapproach takes into consideration all of thecomponents of the environment to assess the overallhealth of the environment in the subwatershed. Thisincludes considerations of the movement of waterthrough the system, land use, climate, geology, andlocal species. Everything is intricately related, andchanges in any one area can have significant effectson othersIn this subwatershed plan, we include an analysis ofwater quality, water quantity, aquatic habitat, and State-pressure-response frameworkterrestrial habitat (e.g. wetlands, forests, andgrasslands). Each chapter follows an identical format loosely structured around a state-pressureresponseframework. Each chapter begins with a description of the current condition (state), thendescribes the stressors likely leading to the current condition (pressure), and finally providesrecommendations for improvement (response).Based on this analysis, a separate document, known as an “Implementation <strong>Plan</strong>” was developed to actupon the recommendations made in the subwatershed plan. The implementation plan was prepared byLSRCA staff, and reviewed by a subwatershed plan working group, comprised of representatives frommunicipalities, provincial ministries, conservation authorities and community group representatives. TheImplementation <strong>Plan</strong> will become the common work plan used in long term protection and rehabilitationefforts.
can be improved through stream rehabilitation, wetland protection, streambank planting, and treatingstormwater run-off from both urban and agricultural areas.The Terrestrial Natural Environment – These features includewoodlands, wetlands, grasslands, and riparian (streambank)habitat, and account for approximately 33% of the land area inthe <strong>Innisfil</strong> <strong>Creeks</strong> subwatershed. Woodlands cover 26% of thesubwatershed. This is slightly below Environment Canada’sAreas of Concern guideline of 30% as a minimum threshold formaintaining woodland dependent biodiversity. Wetland coveroccupies11% of the subwatershed, a relatively healthy level.Natural riparian cover along the streams and shoreline of thesubwatershed is relatively low, at 49.7% and 17.7% respectively.Significant increases in urban area and climate change are ofsignificant concern to the natural environment features in this subwatershed.RECOMMENDATIONSRecommendations based on analysis of the current conditions and stressors are provided in eachchapter of this subwatershed plan. There are close to 80 recommendations in total, with somepertaining to all of the partners involved in the development of the plan, including the LSRCA,municipalities, and the provincial ministries of Natural Resources; Environment; and Agriculture, Food,and Rural Affairs. Through policies in the <strong>Lake</strong> <strong>Simcoe</strong> Protection <strong>Plan</strong>, it is expected that municipalOfficial <strong>Plan</strong>s will be consistent with these recommendationsThese recommendations include:• Continued implementation of on-the-ground stewardship projects to improve water quality andaquatic habitat, promote infiltration of precipitation, and broaden the extent of natural features• Promoting and supporting water conservation and re-use initiatives• Improved land use planning practices to minimize the impacts of development• Educating members of the public and targeted industries on topics including the dangers ofusing invasive species in horticulture, the importance of maintaining groundwater rechargeareas, and good practices for the use of road salt to minimize environmental impacts• Studying the potential impacts of climate change and developing plans to limit its impacts• Researching and using new and innovative solutions to address uncontrolled stormwater• Evaluating monitoring activities, and adjusting programs as necessary• Striving to ensure that natural features lost through development are re-established in otherparts of the watershedNEXT STEPSThese recommendations form the basis of the Implementation <strong>Plan</strong>, which is the framework andprocess for acting on the recommendations. The Implementation <strong>Plan</strong> prioritizes the recommendations;identifying activities to be carried out to achieve each of the priority recommendations. It also identifiesthe milestones to be met, specific deliverables, and partners’ responsibilities. The implementationprocess will also include regular tracking of activities to ensure that milestones are being met.
TABLE OF CONTENTS1 APPROACH AND MANAGEMENT SETTING 11.1 INTRODUCTION 11.2 SUBWATERSHED EVALUATION REQUIREMENTS WITHIN THE LAKE SIMCOE PROTECTIONPLAN 31.3 SUBWATERSHED PLANNING CONTEXT 51.4 SUBWATERSHED PLANNING PROCESS 71.5 SUBWATERSHED IMPLEMENTATION PROCESS 71.6 CURRENT MANAGEMENT FRAMEWORK 91.7 HOW THIS PLAN IS ORGANIZED 102 STUDY AREA: THE INNISFIL CREEKS SUBWATERSHED 122.1 LOCATION 122.2 HUMAN GEOGRAPHY 142.2.1 Population and Municipal Boundaries 142.2.2 Land Use 162.3 HUMAN HEALTH AND WELL-BEING 262.3.1 Outdoor Recreation and Human Health 262.3.2 Drinking Water Source Protection 292.3.3 Ecological Goods and Services 342.4 GEOLOGY AND PHYSICAL GEOGRAPHY 362.4.1 Geology 362.4.2 Physiography, Topography, and Soils 452.5 FLUVIAL GEOMORPHOLOGY 502.5.1 Introduction and background 50
2.5.2 Geomorphic Processes 502.5.3 Current Status 512.6 CLIMATE AND CLIMATE CHANGE 572.6.1 Current climate conditions and trends 572.6.2 Climate change and predicted scenarios 673 WATER QUALITY– SURFACE AND GROUNDWATER 693.1 INTRODUCTION AND BACKGROUND 693.2 CURRENT STATUS 703.2.1 Measuring Groundwater Quality 703.2.2 Measuring Surface Water Quality and Water Quality Standards 703.2.3 Groundwater Quality Status 743.2.4 Surface Water Quality Status 743.3 FACTORS IMPACTING STATUS - STRESSORS 803.3.1 Groundwater 803.3.2 Surface Water 813.4 CURRENT MANAGEMENT FRAMEWORK 1023.4.1 Protection and Policy 1023.4.2 Restoration and Remediation 1063.4.3 Science and Research 1073.5 MANAGEMENT GAPS AND RECOMMENDATIONS 1083.5.1 Groundwater (Hydrogeologic and Hydrologic) 1083.5.2 Surface Water 1083.5.3 Agriculture 1113.5.4 Water Temperature – thermal degradation 1123.5.5 Monitoring and Assessment 112
4.6 MANAGEMENT GAPS AND RECOMMENDATIONS 1644.6.1 Water Demand 1644.6.2 Ecological Flows 1644.6.3 Reducing impacts of land use – groundwater recharge and discharge 1654.6.4 Climate Change 1665 AQUATIC NATURAL HERITAGE 1675.1 INTRODUCTION 1675.2 CURRENT STATUS 1675.2.1 Overview of aquatic communities – Tributaries 1685.2.2 Overview of aquatic communities – <strong>Lake</strong> Nearshore 1805.2.3 Rare and endangered species 1835.3 FACTORS IMPACTING STATUS - STRESSORS 1845.3.1 Municipal drains 1845.3.2 Loss of riparian vegetation 1875.3.3 Water quality and thermal degradation 1875.3.4 Barriers 1895.3.5 Bank hardening and channelization 1915.3.6 Enclosures 1915.3.7 Uncontrolled stormwater and impervious surfaces 1935.3.8 Loss of wetlands 1945.3.9 Invasive species 1945.3.10 Climate Change 1965.4 ASSESSMENT OF TRIBUTARIES 1985.4.1 <strong>Innisfil</strong> <strong>Creeks</strong> subwatershed 1985.5 CURRENT MANAGEMENT FRAMEWORK 209
5.5.1 Protection and policy 2095.5.2 Restoration and remediation 2125.5.3 Science and research 2135.6 MANAGEMENT GAPS AND RECOMMENDATIONS 2155.6.1 Stewardship implementation – increasing uptake 2155.6.2 Stewardship implementation – prioritize projects 2165.6.3 Impacts to Hydrologic Regime 2165.6.4 Water Quality and Water Temperature 2175.6.5 Enclosures 2175.6.6 Monitoring and Assessment 2176 TERRESTRIAL NATURAL HERITAGE 2196.1 INTRODUCTION 2196.2 CURRENT STATUS 2216.2.1 Woodlands 2216.2.2 Wetlands 2276.2.3 Valleylands 2326.2.4 Riparian and shoreline habitat 2346.2.5 Areas of Natural and Scientific Interest 2376.2.6 Species of conservation concern 2386.2.7 Grasslands 2396.3 FACTORS IMPACTING NATURAL HERITAGE STATUS – STRESSORS 2406.3.1 Land use change 2406.3.2 Habitat fragmentation 2416.3.3 Shoreline development 2436.3.4 Road development 244
6.3.5 Changes to hydrologic regime 2446.3.6 Invasive species 2456.3.7 Trophic cascades 2466.3.8 Recreation 2466.3.9 Climate change 2476.4 CURRENT MANAGEMENT FRAMEWORK 2496.4.1 Protection and policy 2496.4.2 Restoration and remediation 2566.4.3 Science and research 2586.5 MANAGEMENT GAPS AND RECOMMENDATIONS 2596.5.1 Official <strong>Plan</strong> conformity 2596.5.2 Revisions in Key Natural Heritage Protection Policies 2596.5.3 Grassland protection 2596.5.4 Infrastructure as a Key Natural Heritage Feature gap 2606.5.5 Land securement by public agencies 2616.5.6 Stewardship implementation – increasing uptake 2616.5.7 Stewardship implementation – prioritize projects 2626.5.8 Dealing with indirect impacts 2636.5.9 Filling data gaps 2636.5.10 Improving data management 2646.5.11 Terrestrial Natural Heritage Research Needs 2647 INTEGRATION AND IMPLEMENTATION 2657.1 INTRODUCTION 2657.2 GROUNDWATER INTERACTIONS - LAND COVER, GROUNDWATER, AND AQUATIC HABITATS 2657.3 AGRICULTURAL INTERACTIONS - LAND USE, STREAMS, AND AQUATIC WILDLIFE 267
7.4 URBAN INTERACTIONS - LAND USE, STREAMS, AND AQUATIC WILDLIFE 2727.5 IN-STREAM INTERACTIONS - ACTIVITIES IN AND NEAR CREEKS, WATER QUALITY, AND AQUATIC WILDLIFE 2757.6 SHORELINE INTERACTIONS - ACTIVITIES IN AND NEAR THE LAKESHORE, WATER QUALITY, AND AQUATICWILDLIFE 2777.7 DEVELOPING AN IMPLEMENTATION PLAN 2828 COMBINED RECOMMENDATIONS 2838.1 PROTECTION AND POLICY 2848.1.1 Official <strong>Plan</strong> consistency 2848.1.2 The adaptive watershed planning process 2848.1.3 Protecting Natural Heritage 2848.1.4 Reducing impact of land use – groundwater recharge and discharge 2858.1.5 Incorporating LSPP objectives in Environmental Assessments 2868.1.6 Promoting Low Impact Development 2868.1.7 Improving stormwater management 2868.1.8 Managing thermal degradation 2878.1.9 Improving construction practices 2878.1.10 Land securement by public agencies 2878.2 RESTORATION AND REMEDIATION 2888.2.1 Improving stormwater management 2888.2.2 Managing water demand 2888.2.3 Managing agricultural impacts 2888.2.4 Dealing with enclosed watercourses 2888.2.5 Dealing with indirect impacts to natural areas 2898.2.6 Increasing uptake of stewardship programs 2898.2.7 Prioritizing stewardship projects 2908.2.8 Reducing salt use 291
8.3 APPLIED SCIENCE 2928.3.1 Reducing salt use 2928.3.2 Establishing instream flow targets 2928.3.3 Increasing our understanding of climate change 2928.3.4 Monitoring and assessment 2938.3.5 Improving data management 2948.3.6 Additional research needs 294
LIST OF FIGURESCHAPTER 1Figure 1-1: Location of the <strong>Innisfil</strong> <strong>Creeks</strong> subwatershed 2Figure 1-2: The hydrological cycle (image courtesy of Conservation Ontario) 4Figure 1-3: Anticipated availability of LSPP 'strategic action' documents 6Figure 1-4: <strong>Subwatershed</strong> planning context 9CHAPTER 2Figure 2-1 : The <strong>Innisfil</strong> <strong>Creeks</strong> subwatershed 13Figure 2-2: Land use distribution within the <strong>Innisfil</strong> <strong>Creeks</strong> subwatershed 16Figure 2-3: Land uses in the <strong>Innisfil</strong> <strong>Creeks</strong> subwatershed 17Figure 2-4: Urban land use in the <strong>Lake</strong> <strong>Simcoe</strong> subwatersheds 18Figure 2-5: Natural heritage land cover in the <strong>Lake</strong> <strong>Simcoe</strong> subwatersheds 19Figure 2-6: Rural land use in the <strong>Lake</strong> <strong>Simcoe</strong> subwatersheds 20Figure 2-7: Impervious cover in the <strong>Innisfil</strong> <strong>Creeks</strong> subwatershed 22Figure 2-8: Settlement areas in the <strong>Innisfil</strong> <strong>Creeks</strong> subwatershed 25Figure 2-9: Watershed governance prism (Parkes et al., 2010) 26Figure 2-10: Vulnerable Areas (WHPA/IPZ) located within the <strong>Innisfil</strong> <strong>Creeks</strong> subwatershed 33Figure 2-11: Bedrock geology in the <strong>Innisfil</strong> <strong>Creeks</strong> subwatershed 37Figure 2-12: Bedrock topography in the <strong>Innisfil</strong> <strong>Creeks</strong> subwatershed 39Figure 2-13: Surficial geology in the <strong>Innisfil</strong> <strong>Creeks</strong> subwatershed 41Figure 2-14: Overburden thickness in the <strong>Innisfil</strong> <strong>Creeks</strong> subwatershed 42Figure 2-15: Generalized conceptual stratigraphy of upland complexes, lowland tunnel channelcomplexes and the Oro Moraine (AquaResource et al., 2011) 43Figure 2-16: Physiography in the <strong>Innisfil</strong> <strong>Creeks</strong> subwatershed 47Figure 2-17: Ground surface topography in the <strong>Innisfil</strong> <strong>Creeks</strong> subwatershed 48
Figure 2-18: Soils in the <strong>Innisfil</strong> <strong>Creeks</strong> subwatershed 49Figure 2-19: <strong>Innisfil</strong> <strong>Creeks</strong> subwatershed stream profiles 54Figure 2-20: Percentage of stream bank that is unstable, moderate, or stable for five creeks withinthe <strong>Innisfil</strong> <strong>Creeks</strong> subwatershed 56Figure 2-21: Location of climate stations in and around the <strong>Innisfil</strong> <strong>Creeks</strong> subwatershed 58Figure 2-22: Comparison of the average annual, maximum and minimum temperatures at the BarrieWPCC Meteorological Monitoring Station (1950-2008). Source: SGBLS, <strong>2012</strong> 59Figure 2-23: Average annual temperature at the Barrie WPCC Meteorological Monitoring Station(1950-2008). Source: SGBLS, <strong>2012</strong> 60Figure 2-24: Annual precipitation (mm/yr) in the Barrie <strong>Creeks</strong>, Lovers Creek and Hewitt’s <strong>Creeks</strong>ubwatersheds as distributed by PRMS (LSRCA, 2011) 61Figure 2-25: Mean monthly precipitation as snowfall and rainfall for Barrie WPCC station(AquaResource et al., 2011) 62Figure 2-26: Total annual precipitation at the Barrie WPCC Meteorological Monitoring Station(1950 - 2008). Source: SGBLS, <strong>2012</strong> 62Figure 2-27: Seasonal water column temperature contour in degrees Celsius) and stability (white line)in Kempenfelt Bay in 1980 (a) and 2002 (b). Red triangles show the sampling dates along thex-axis. Source: Stainsby, et al., 2011 63Figure 2-28: The timing of the onset of stratification in (a) Kempenfelt Bay, (b) the main basin, and(c) Cook’s Bay. Source: Stainsby et al., 2011 64Figure 2-29: The timing of fall turnover in (a) Kempenfelt Bay, (b) the main basin, and (c) Cook’s Bay.Source: Stainsby et al., 2011 65Figure 2-30: The length of the stratified period in (a) Kempenfelt Bay, (b) the main basin, and(c) Cook’s Bay. Source: Stainsby et al., 2011 66CHAPTER 3Figure 3-1: Water quality monitoring sites in the <strong>Innisfil</strong> <strong>Creeks</strong> subwatershed 72Figure 3-2: Leonard’s Creek phosphorus concentrations (mg/L), 2008-2010 75Figure 3-3: Percent phosphorus loads to <strong>Lake</strong> <strong>Simcoe</strong> per subwatershed under current conditions(data: Berger, 2010) 83
Figure 3-4: Percent phosphorus loads to <strong>Lake</strong> <strong>Simcoe</strong> per subwatershed under committed growthscenario (data: Berger, 2010) 83Figure 3-5: Phosphorus loading (kg/yr) per hectare for each <strong>Lake</strong> <strong>Simcoe</strong> subwatershed (data:Berger, 2010) 84Figure 3-6: <strong>Innisfil</strong> <strong>Creeks</strong> subwatershed agricultural BMP scenario total phosphorus loads(Berger, 2010) 86Figure 3-7: <strong>Innisfil</strong> <strong>Creeks</strong> subwatershed target total phosphorus loads (Berger, 2010) 87Figure 3-8: <strong>Innisfil</strong> <strong>Creeks</strong> – pond design efficiency level vs. 2010 surveyed efficiency level 95Figure 3-9: Stormwater control in the <strong>Innisfil</strong> <strong>Creeks</strong> subwatershed 97Figure 3-10: Uncontrolled stormwater and retrofit opportunities in the <strong>Innisfil</strong> <strong>Creeks</strong> subwatershed 98Figure 3-11: Base case land use applied to climate change scenarios for total phosphorus loads in the<strong>Innisfil</strong> <strong>Creeks</strong> subwatershed 100CHAPTER 4Figure 4-1: Hydrologic cycle (USGS, 2008) 115Figure 4-2: Shallow water levels (AquaResource, <strong>2012</strong>) 121Figure 4-3: Deep water levels (AquaResource et al., 2010) 122Figure 4-4: Baseflow (LSRCA, <strong>2012</strong>) 125Figure 4-5: Groundwater discharge to surface water simulated from the SGBWLS Tier 2 FEFLOW model(AquaResource et al., 2011) 127Figure 4-6: Potential groundwater discharge (LSRCA, 2011) 128Figure 4-7: Simulated average annual groundwater recharge (mm/yr) from the PRMS model(LSRCA, 2011) 132Figure 4-8: Significant Groundwater Recharge Areas (LSRCA, 2011) 133Figure 4-9: Average net annual evapotranspiration (LSRCA, 2011) 135Figure 4-10: Water budget components 136Figure 4-11: Water budget results from the Tier Two Assessment (AquaResource, <strong>2012</strong>) 139Figure 4-12: Municipal groundwater supply system within the subwatershed (LSRCA, <strong>2012</strong>) 143Figure 4-13: Spatial distribution of land use within Significant Groundwater Recharge Areas 153
Figure 4-14: Two year drought analysis: impacts to streams and wetlands (AquaResource, <strong>2012</strong>) 159CHAPTER 5Figure 5-1: Cold, cool and warm water trout stream temperature ranges (Stoneman and Jones, 1996) 168Figure 5-2: Occurrence of fish communities in relation to measured in-stream water temperatures in the<strong>Innisfil</strong> <strong>Creeks</strong> subwatershed 172Figure 5-3: Ecological integrity of stream sites based on fish community conditions assessed using theIndex of Biotic Integrity (IBI) 173Figure 5-4: Historic and current presence of brook trout in the <strong>Innisfil</strong> <strong>Creeks</strong> subwatershed 176Figure 5-5: Historic and current presence of mottled sculpin the <strong>Innisfil</strong> <strong>Creeks</strong> subwatershed 177Figure 5-6: Ecological integrity of stream sites based on benthic community conditions assessed using theHilsenhoff Biotic Index 179Figure 5-7: <strong>Lake</strong> nearshore habitat of the <strong>Innisfil</strong> <strong>Creeks</strong> subwatershed 182Figure 5-8: Municipal drains in the <strong>Innisfil</strong> <strong>Creeks</strong> subwatershed 186Figure 5-9: Thermal degradation in the <strong>Innisfil</strong> <strong>Creeks</strong> subwatershed 188Figure 5-10: Barriers to fish movement in the <strong>Innisfil</strong> <strong>Creeks</strong> subwatershed 190Figure 5-11: Bank hardening and/or channelization in the <strong>Innisfil</strong> <strong>Creeks</strong> subwatershed 192Figure 5-12: Pathways by which impervious surfaces may impact aquatic biological communities (ORMCPTechnical Paper Series, #13) 194CHAPTER 6Figure 6-1: Terrestrial natural heritage features in the <strong>Innisfil</strong> <strong>Creeks</strong> subwatershed 220Figure 6-2: Pre-settlement vegetation in the <strong>Innisfil</strong> <strong>Creeks</strong> subwatershed 223Figure 6-3: Woodland types in the <strong>Innisfil</strong> <strong>Creeks</strong> subwatershed 224Figure 6-4: Woodland patch size distribution in the <strong>Innisfil</strong> <strong>Creeks</strong> subwatershed 227Figure 6-5: Wetland types in the <strong>Innisfil</strong> <strong>Creeks</strong> subwatershed 229Figure 6-6: Wetland patch size distribution in the <strong>Innisfil</strong> <strong>Creeks</strong> subwatershed 232Figure 6-7: Key valleyland features in the <strong>Innisfil</strong> <strong>Creeks</strong> subwatershed 233Figure 6-8: Riparian cover percentage per buffer distance 235
Figure 6-9: Riparian and shoreline habitat in the <strong>Innisfil</strong> <strong>Creeks</strong> subwatershed 236Figure 6-10: Example of loss of forest interior resulting from estate residential development 242Figure 6-11: Preliminary interpretation of Key Natural Heritage Features 252Figure 6-12: Extreme-case scenario of possible land use change in the <strong>Innisfil</strong> <strong>Creeks</strong> subwatershed 255CHAPTER 7Figure 7-1: Influences of agricultural land use on subwatershed health 268Figure 7-2: An agricultural landscape with appropriate best practices implemented to protectsubwatershed health 269Figure 7-3: Approximate number of stewardship projects completed and stewardship opportunitiesin the <strong>Innisfil</strong> <strong>Creeks</strong> subwatershed. Graph includes projects done both in agricultural andurban settings 270Figure 7-4: Best Management Project opportunities in the <strong>Innisfil</strong> <strong>Creeks</strong> subwatershed 271Figure 7-5: Influences of urban land use on subwatershed health 273Figure 7-6: An urban landscape with appropriate best management practices implemented to protectsubwatershed health 274Figure 7-7: Influences of riparian land use on subwatershed health 276Figure 7-8: Riparian area with appropriate best management practices implemented to protectsubwatershed health 277Figure 7-9: Influences of urban shoreline land use on subwatershed health 278Figure 7-10: Influences of rural shoreline use on subwatershed health 279Figure 7-11. Urban shoreline area with appropriate best management practices implemented to protectsubwatershed health 280Figure 7-12. Rural shoreline area with appropriate best management practices implemented to protectshoreline health 281
LIST OF TABLESCHAPTER 2Table 2-1: Estimated population and population density within the <strong>Innisfil</strong> <strong>Creeks</strong> subwatershed (DataSource: Stats Canada, 2006 Community Profiles) 15Table 2-2: Educational attainment for the Town of <strong>Innisfil</strong> and City of Barrie (Stats Canada, 2006) 16Table 2-3: Place of work status in the Town of <strong>Innisfil</strong> and City of Barrie (Data Source: Statistics Canada,2006) 23Table 2-4: Changes in industry in the Town of <strong>Innisfil</strong> and City of Barrie (Data Source: Statistics Canada,2001 and 2006) 24Table 2-5: Summary of non-market ecosystem service values by land cover type (2010 values) 35Table 2-6: <strong>Innisfil</strong> <strong>Creeks</strong> subwatershed stream order and stream length 51Table 2-7: <strong>Innisfil</strong> <strong>Creeks</strong> subwatershed stream length, watershed area and drainage density 53Table 2-8: Summary of climate normals (1971-2001) for the City of Barrie and surrounding area(modified from AquaResource and Golder, 2010) 57Table 2-9: Summary of projected change in average annual temperature (°C) in the 2050s comparedwith 1961-1990 (CCCSN, 2009) 67Table 2-10: Summary of projected change in precipitation (%) in 2050s compared with 1961-1990(CCCSN, 2009) 68CHAPTER 3Table 3-1: A summary of surface water quality variables and their potential effects and sources 71Table 3-2: Current surface water quality conditions for Leonard's Creek (2008-2010) 74Table 3-3: Current water quality onditions in the <strong>Lake</strong> <strong>Simcoe</strong> watershed 76Table 3-4: List of beach postings in the Town of <strong>Innisfil</strong>, 2006-2011 (SMU, 2011) 77Table 3-5: List of beach postings in the City of Barrie 2006-2011 (SMU, 2011) 78Table 3-6: Phosphorus loads by source for the <strong>Innisfil</strong> <strong>Creeks</strong> subwatershed associated withagriculture BMP scenarios (Berger, 2010a) 82Table 3-7: Classification of catchments in prioritization tiers (Berger, 2010) 85
Table 3-8: Retrofit opportunities in the <strong>Innisfil</strong> <strong>Creeks</strong> subwatershed 94Table 3-9: Controlled vs. uncontrolled stormwater catchments in the Town of <strong>Innisfil</strong> and the Cityof Barrie 96Table 3-10: Summary of the current management framework as it relates to the protection andrestoration of water quality 103CHAPTER 4Table 4-1: Hydrostratigraphic units within the subwatershed (Table has been modified fromAquaResources et al., 2011) 119Table 4-2: Average initial hydraulic conductivity estimates (AquaResource et al., 2011) 119Table 4-3: Water budget summary by subwatershed (AquaResource, <strong>2012</strong>) 138Table 4-4: Summary of municipal systems (AquaResource, <strong>2012</strong>) 141Table 4-5: Monthly consumptive demand (AquaResource, <strong>2012</strong>) 142Table 4-6: Percentage of consumptive water demand by sector (AquaResource, <strong>2012</strong>) 142Table 4-7: Non-permitted agriculture and unserviced domestic water use (AquaResource, <strong>2012</strong>) 144Table 4-8: Monthly demand adjustments based on active months of taking (MOE, 2007) 145Table 4-9: Consumptive use factors (MOE, 2007) 147Table 4-10: Groundwater potential stress thresholds 155Table 4-11: Stress assessment components and percent water demand – existing conditions(AquaResource, <strong>2012</strong>) 156Table 4-12: Stress assessment components and percent water demand – future conditions(AquaResource, <strong>2012</strong>) 157Table 4-13: Two year drought results (AquaResource, <strong>2012</strong>) 158Table 4-14: Summary of current regulatory framework as it relates to the protection and restorationof water quantity 161CHAPTER 5Table 5-1: Fish species captured in the <strong>Innisfil</strong> <strong>Creeks</strong> subwatershed from 1975-2011 169
Table 5-2: Likelihood of watersheds to retain cold water species in 2055 using maximum airtemperature projections from the Canadian Global Model 2 A2 scenario and groundwaterdischarge potential (Source: Chu et al., 2008) 196Table 5-3: Maximum air temperature and groundwater discharge potential characteristics of thesubwatersheds that have cold-water stream fish species in the <strong>Lake</strong> <strong>Simcoe</strong> watershed.Base flow index values are measures of groundwater discharge potential, values close to 1indicate high groundwater inflows 196Table 5-4: Summary of current the current management framework as it relates to the protectionand restoration of aquatic natural heritage 210CHAPTER 6Table 6-1: Woodland cover types in the <strong>Innisfil</strong> <strong>Creeks</strong> subwatershed 225Table 6-2: Distribution of wetland types in the <strong>Innisfil</strong> <strong>Creeks</strong> subwatershed 230Table 6-3: Status of wetlands in the <strong>Innisfil</strong> <strong>Creeks</strong> subwatershed 231Table 6-4: Extent of natural vegetation along riparian areas in the <strong>Innisfil</strong> <strong>Creeks</strong> subwatershed 235Table 6-5: ANSIs found in the <strong>Innisfil</strong> <strong>Creeks</strong> subwatershed 238Table 6-6: Distribution of grassland types in the <strong>Innisfil</strong> <strong>Creeks</strong> subwatershed 239Table 6-7: Cumulative impact of estate residential development in the <strong>Innisfil</strong> <strong>Creeks</strong> subwatershed 243Table 6-8 : Summary of the current management framework as it relates to the protection of terrestrialnatural heritage 250Table 6-9: Extent of natural heritage protection policies in the <strong>Innisfil</strong> <strong>Creeks</strong> subwatershed 254
The <strong>Innisfil</strong> <strong>Creeks</strong> <strong>Subwatershed</strong> <strong>Plan</strong>1 Approach and Management Setting1.1 IntroductionA subwatershed plan is the characterization of the current conditions and stressors of thenatural environment. The plan considers the multiple competing demands, providesrecommendations to guide management, as well as providing direction on howrecommendations may be acted upon.The <strong>Innisfil</strong> <strong>Creeks</strong> subwatershed is located in the western portion of the <strong>Lake</strong> <strong>Simcoe</strong>watershed and is 107.2 km 2 in size, which accounts for 4% of <strong>Lake</strong> <strong>Simcoe</strong>’s total watershedarea. The <strong>Innisfil</strong> <strong>Creeks</strong> subwatershed lies mostly within the Town of <strong>Innisfil</strong> (County of<strong>Simcoe</strong>), but has a small portion (3.3%) lying within the boundaries of the City of Barrie and inthe Town of Bradford West Gwillimbury (0.7%). One major road is found within thesubwatershed boundaries.According to available data, there are 17 named streams in the <strong>Innisfil</strong> <strong>Creeks</strong> subwatershed:Banks Creek, Belle Aire Creek, Bon Secours Creek, Carson Creek, Cedar Creek, Gilford Creek,Holland River, <strong>Innisfil</strong> <strong>Creeks</strong> (small unnamed tributaries), Leonard’s Creek, Mooselanka Creek,Moyer Creek, Sandy Cove Creek, Strathallan Creek, Sylvan Creek, Upper Marsh Creek, WhiteBirch Creek and Wilson Creek. All of these streams flow from west to east into <strong>Lake</strong> <strong>Simcoe</strong>,with the exception of Strathallan Creek which flows north into Kempenfelt Bay, and all haveheadwaters in agricultural areas, flowing downstream through urban areas before entering thelake. In total, the <strong>Innisfil</strong> <strong>Creeks</strong> subwatershed has a combined watercourse length of 149,086m, which is about 3.5% of the total combined watercourse length of the entire watershed.In the <strong>Lake</strong> <strong>Simcoe</strong> watershed, the various land uses have had considerable impacts on waterquality and quantity, and aquatic and terrestrial habitats. In order to mitigate the impacts of landuse changes in each of the subwatersheds, and to prevent future impacts, subwatershed plansare developed. These plans provide a framework for the implementation of remedial activitiesand a focus for community action. More importantly, they prevent further serious degradation tothe existing environment and can reduce the need for expensive rehabilitation efforts.<strong>Subwatershed</strong> plans provide a framework within which sustainable development can occur.As part of the requirements through the <strong>Lake</strong> <strong>Simcoe</strong> Protection <strong>Plan</strong> (LSPP), subwatershedevaluations need to be developed and completed for priority subwatersheds within five years ofthe <strong>Plan</strong> coming into effect. <strong>Subwatershed</strong>s plans for York <strong>Region</strong> (includes the East and WestHolland Rivers, Maskinonge River and Black River subwatersheds) were completed in 2010 andDurham <strong>Region</strong> (includes the Beaver River and Pefferlaw Brook subwatersheds) in <strong>2012</strong>. Thesubwatershed plans prepared for the Town of <strong>Innisfil</strong> (includes <strong>Innisfil</strong> <strong>Creeks</strong> subwatershed)and the City of Barrie (includes Barrie <strong>Creeks</strong>, Lovers Creek and Hewitt’s <strong>Creeks</strong>ubwatersheds) is scheduled for completion in <strong>2012</strong>. The evaluation of these subwatershedswill reflect the goals, objectives and targets of the <strong>Lake</strong> <strong>Simcoe</strong> Protection <strong>Plan</strong> and will betailored to the needs and local issues within each.Chapter 1: Approach and Management Setting 1
RIDGE RD WKempenfelt BayStrathallan Creek<strong>Lake</strong><strong>Simcoe</strong>The <strong>Innisfil</strong> <strong>Creeks</strong>subwatershedLegendFigure 2-1ESSA RDBARRIE400 HWY NSIDERD 5SIDERD 10BIG BAY PT RDLOCKHART RD10TH LINE9TH LINEINNISFIL BEACH RDSIDERD 107TH LINE6TH LINEYONGE ST5TH LINE4TH LINESandy CoveCreekMooselankaBanksLeonard'sAlcona!Bon Secours<strong>Innisfil</strong><strong>Creeks</strong>Belle AireCarsonWilson!LefroyCreekSIDERD 25CreekCreekCreekCreekCedarCreekCreekCreekBurts DrainMclean CreekMoyer CreekSylvan CreekMETRO RD NWARDEN AVEWOODBINE AVEBASELINE RDGEORGINAPOLLOCK RDRoadMunicipal BoundaryWatercourse<strong>Innisfil</strong> <strong>Creeks</strong><strong>Subwatershed</strong>HWY 400 S3RD LINEINNISFIL2ND LINECOUNTY RD 8914TH LINELINE 13White BirchCreekUpper MarshGilford!GilfordCreekCreekCook'sBayGLENWOODS AVERAVENSHOE RD0 0.5 1 2 3 4 5KilometresKThis product was produced by the <strong>Lake</strong> <strong>Simcoe</strong> <strong>Region</strong> Conservation Authority andsome information depicted on this map may have been compiled from various sources.While every effort has been made to accurately depict the information,data / mapping errors may exist.This map has been produced for illustrative purposes only.LSRCA GIS Services DRAFT created July 2010.© LAKE SIMCOE REGION CONSERVATION AUTHORITY, 2010. All Rights ReservedThe following datasets roads, municipal boundaries and Oak Ridges Moraine are© Queens Printer for Ontario, 2010. Reproduced with Permission
The <strong>Innisfil</strong> <strong>Creeks</strong> <strong>Subwatershed</strong> <strong>Plan</strong>1.2 <strong>Subwatershed</strong> Evaluation Requirements within the <strong>Lake</strong> <strong>Simcoe</strong> Protection<strong>Plan</strong>The <strong>Lake</strong> <strong>Simcoe</strong> Protection <strong>Plan</strong> (LSPP), released by the Provincein 2009, aims to be a comprehensive plan to protect and restore theecological health of the lake and its watershed. Its priorities includerestoring the health of aquatic life, improving water quality,maintaining water quantity, and improving ecosystem health byprotecting and rehabilitating important areas, as well as addressingthe impacts of invasive species, climate change, and recreationalactivities.Preparation of subwatershed evaluations/plans is identified as acrucial stage in implementation of the LSPP. The LSPP states thatsubwatershed plans “will be critical in prioritizing actions, developingfocused action plans, monitoring and evaluating results…. The planswill provide more detailed guidance for area-specific hydrologic andnatural heritage resource planning and management.”Policies within the LSPP guiding the preparation of this subwatershed plan are:8.1-SA Within one year of the date the <strong>Plan</strong> comes into effect, the MOE and LSRCA incollaboration with other ministries, the First Nations and Métis communities, watershedmunicipalities, the <strong>Lake</strong> <strong>Simcoe</strong> Coordinating Committee and the <strong>Lake</strong> <strong>Simcoe</strong> ScienceCommittee will develop guidelines to provide direction on:a. identifying sub-lake areas and subwatersheds of the <strong>Lake</strong> <strong>Simcoe</strong> watershed anddetermining which sub-lake areas and subwatersheds are of priority;b. preparing subwatershed evaluations including, where appropriate, developingsubwatershed-specific targets and recommending actions that need to be taken withinsubwatersheds in relation to:i. the phosphorus reduction strategy (Chapter 4),ii.stormwater management master plans, including consideration of the amount ofimpervious surfaces within subwatersheds (Chapter 4),iii. water budgets (Chapter 5),iv. instream flow regime targets (Chapter 5),v. preventing invasive species and mitigating the impacts of existing invasivespecies (Chapter 7),vi. natural heritage restoration and enhancement (Chapter 6),vii. increasing public access (Chapter 7), andviii. climate change impacts and adaptation (Chapter 7);c. monitoring and reporting in relation to subwatershed targets that may be established;andd. consultation to be undertaken during the preparation of the subwatershed evaluations.8.2-SA In developing the guidance outlined in 8.1, the partners identified above will developapproaches to undertake the subwatershed evaluations in a way that builds upon and integrateswith source protection plans required under the Clean Water Act, 2006, as well as relevant workof the LSRCA and watershed municipalities.8.3-SA Within five years of the date the <strong>Plan</strong> comes into effect, the LSRCA in partnership withmunicipalities and in collaboration with the MOE, MNR, and MAFRA will develop and completesubwatershed evaluations for priority subwatersheds.Chapter 1: Approach and Management Setting 3
The <strong>Innisfil</strong> <strong>Creeks</strong> <strong>Subwatershed</strong> <strong>Plan</strong>8.4-DP Municipal official plans shall be amended to ensure that they are consistent with therecommendations of the subwatershed evaluations.This plan is being developed to meet requirements of policy 8.3-SA, while also followingrequirements of policies 8.1-SA and 8.2-SA. Ensuring municipal Official <strong>Plan</strong>s are updated inaccordance with policy 8.4-DP is identified as an activity within the associate implementationplan.This subwatershed plan aims to be consistent with the themes and policies of the <strong>Lake</strong> <strong>Simcoe</strong>Protection <strong>Plan</strong> to ensure a consistent approach is being taken by all of the partners towardimproving watershed health.The ecosystem approach to environmental management takes into consideration all of thecomponents of the environment. These components include the movement of water through thesystem, the land use, climate, geology, human communities, and all of the species thatcomprise the community living in the system. These ecosystem components are all intricatelyrelated, and changes in any can have significant effects on the others.To manage natural resources using an ecosystem approach it is essential to establishbiophysical boundaries. In the <strong>Lake</strong> <strong>Simcoe</strong> watershed, the subwatersheds or river systems thatdrain into the lake have been identified as the best “fit” for the implementation of an ecosystemstudy because they are virtually self-contained water-based ecosystems (OMOE and OMNR,1993). Watersheds are defined as the area of land drained by a watercourse and, subsequently,the land draining to a tributary of the main watercourse (<strong>Lake</strong> <strong>Simcoe</strong> is the “main watercourse”in this case) is called a subwatershed. Watershed processes are controlled by the hydrologiccycle (Figure 1-2). The movement of water influences topography, climate, and life cycles. It isdue to this connectivity that any change within the watershed will impact other parts of thesubwatershed.Figure 1-2: The hydrological cycle (image courtesy of Conservation Ontario).Chapter 1: Approach and Management Setting 4
The <strong>Innisfil</strong> <strong>Creeks</strong> <strong>Subwatershed</strong> <strong>Plan</strong>1.3 <strong>Subwatershed</strong> <strong>Plan</strong>ning ContextThis subwatershed plan has been written firstly to comply with the requirements under theProvince’s <strong>Lake</strong> <strong>Simcoe</strong> Protection <strong>Plan</strong>. However there are other documents that haveinfluenced and fed into the development of this plan and its recommendations including theLSRCA’s Integrated Watershed Management <strong>Plan</strong> (2008). The Integrated WatershedManagement <strong>Plan</strong>, released by the <strong>Lake</strong> <strong>Simcoe</strong> <strong>Region</strong> Conservation Authority in 2008, wasintended to be a roadmap to provide future direction for the protection and rehabilitation of the<strong>Lake</strong> <strong>Simcoe</strong> watershed ecosystem. Its broad-scale recommendations for the <strong>Lake</strong> <strong>Simcoe</strong>watershed provided the basis for a number of this plan’s recommended actions.Technical documents that are being developed to meet the ‘strategic action’ policy requirementsof the <strong>Lake</strong> <strong>Simcoe</strong> Protection <strong>Plan</strong> and their expected completion dates are shown in Figure1-3. As these documents are scheduled to be phased in over a number of years, they will beincorporated in the subwatershed plans as they become available. In cases where thedocuments are not available when a subwatershed plan is being written, they will beincorporated into the five year review and update of the subwatershed plan, as well as beaddressed in the implementation plan where feasible.Chapter 1: Approach and Management Setting 5
The <strong>Innisfil</strong> <strong>Creeks</strong> <strong>Subwatershed</strong> <strong>Plan</strong>Figure 1-3: Anticipated availability of LSPP 'strategic action' documents.This subwatershed plan also aims to complement and be supportive of the policies of theapplicable upper and lower tier municipal official plans and the related municipal programs thatstrive to achieve similar outcomes related to subwatershed health. Within the City of Barrie,studies have also been completed that have contributed to this report, including backgrounddocuments for the Secondary <strong>Plan</strong> for the annexed lands along the City of Barrie’s southernChapter 1: Approach and Management Setting 6
The <strong>Innisfil</strong> <strong>Creeks</strong> <strong>Subwatershed</strong> <strong>Plan</strong>border. This border has been extended to included 2,293 hectares of land from the Town of<strong>Innisfil</strong> to accommodate the projected growth within the City of Barrie. The backgrounddocuments for the Secondary <strong>Plan</strong> provide a platform for identifying development opportunitiesand limitations within the annexed lands, as well as a scope of the environments (economic,social, cultural, natural) that already exist (Barrie, 2010). The Secondary <strong>Plan</strong> is alsoaccompanied by an Infrastructure Master <strong>Plan</strong> which addresses stormwater management needsas projected development occurs. This subwatershed plan is being developed concurrently withthe Secondary <strong>Plan</strong>.1.4 <strong>Subwatershed</strong> <strong>Plan</strong>ning ProcessPreliminary ConsultationStart up meetings were had with the Town of <strong>Innisfil</strong>, City of Barrie, Ministry of the Environment(MOE) and Ministry of Natural Resources (MNR) to go over the intended direction and scope ofthe subwatershed plan, the projected timeline and how it would incorporate any new informationcoming from studies currently underway.CharacterizationThe initial focus of the subwatershed planning exercise has involved the completion andsummarization of subwatershed characterization work. It also involved the development of waterquality, quantity, aquatic, and terrestrial habitat models to assess the environmental impactsassociated with potential changes in the landscape. Based on this important information,recommendations are developed to address the stressors as well as the gaps and limitations foreach parameter. They are also intended to be consistent with the policies of the LSPP.<strong>Subwatershed</strong> Working Group – Review CommitteeThe <strong>Subwatershed</strong> Working Group (SWG) consists of representatives from the City of Barrie,Town of <strong>Innisfil</strong>, <strong>Simcoe</strong> County, MOE, MNR, MAFRA, and the South <strong>Simcoe</strong> Streams Network.This is a voluntary committee that is essential for reviewing content of the plan and developingrecommendations. The SWG convened at approximately three to four month intervals during2011 and <strong>2012</strong>. Before each meeting, committee members are presented with characterizationchapters and their associated recommendations. Comments received on the characterizationmaterial were documented and addressed, while comments received on recommendations werediscussed, incorporated and re-distributed for further discussion/approval at the next meeting.This was done to ensure that all parties are fully aware of, and agree with, finalrecommendations that will be the basis of the <strong>Subwatershed</strong> Implementation <strong>Plan</strong>s.Public ConsultationPublic consultation occurred in the fall of <strong>2012</strong> to educate residents within the subwatershedsabout the plans, what the current conditions are of their local natural areas, what the immediatestressors are and what recommendations have been developed to improve the conditions.1.5 <strong>Subwatershed</strong> Implementation ProcessImplementation <strong>Plan</strong>Recommendations were used to form the basis of the development of the Implementation <strong>Plan</strong>for the subwatersheds. The Implementation <strong>Plan</strong> is a framework and process for acting on theChapter 1: Approach and Management Setting 7
The <strong>Innisfil</strong> <strong>Creeks</strong> <strong>Subwatershed</strong> <strong>Plan</strong>recommendations put forth in the <strong>Subwatershed</strong> <strong>Plan</strong>s. It prioritizes the recommendations,identifying activities to be carried out, the milestones to be met, timeframes and, partner’sresponsibilities. The Implementation <strong>Plan</strong> was drafted by staff and revised by the SWG during aone day workshop.Implementation Working GroupUpon approval of this subwatershed plan it is proposed that the subwatershed working grouptransition into an implementation working group. The primary role of the working group will be tooversee, track and report on progress of the various activities identified in the implementationplan. Project updates, integrating and linking the numerous efforts, and monitoring and reportingon success will be the ongoing business of the IWG.It is recognized that many of these undertakings will be dependent on funding from all levels ofgovernment. Should there be financial constraints, it may affect the ability of the partners toachieve these recommendations. These constraints and other potential challenges will beaddressed by the IWG with the ultimate goal of adapting as necessary to achieve the desiredoutcomes of the recommendations.ImplementationImplementation of recommendations will be the responsibility of the agencies and organizationsidentified in the implementation plans. In many cases implementation will require collaborationbetween different partners to achieve the required outcomes, and will also be fundingdependent.To ensure that this subwatershed plan remains current and relevant, it has been developedusing an adaptive management framework. As such, it is proposed that the subwatershed planbe updated every five years to ensure that it contains the best available science and monitoringdata reflecting the health of the subwatershed and associated environmental stressors.Between updates to the plan, ongoing monitoring, assessing and evaluation of thesubwatersheds as well as the extent and effectiveness of implementation of therecommendations of this subwatershed plan will be occurring, with new reports and studiesbeing produced. Communications will need to be updated to coincide with these studies andimplementation approaches will need to adapt to reflect the most current information availableFigure 1-4 depicts the relationship between this subwatershed plan and the materials that haveguided and contributed to its development. It also depicts the implementation plan, which willprovide details of a plan to undertake the recommended actions.Chapter 1: Approach and Management Setting 8
The <strong>Innisfil</strong> <strong>Creeks</strong> <strong>Subwatershed</strong> <strong>Plan</strong>Figure 1-4: <strong>Subwatershed</strong> planning context1.6 Current Management FrameworkThe goals and management recommendations offered in this plan have been developed incontext of the <strong>Lake</strong> <strong>Simcoe</strong> Protection <strong>Plan</strong> (LSPP) and other existing legislation and theirassociated plans and policies. There are many regulations related to the protection andChapter 1: Approach and Management Setting 9
The <strong>Innisfil</strong> <strong>Creeks</strong> <strong>Subwatershed</strong> <strong>Plan</strong>restoration of <strong>Lake</strong> <strong>Simcoe</strong> and its subwatersheds, and although each of these acts andassociated plans differ, although in some cases policies do overlap. The manner in whichregulations differ include: (1) the number and types of watershed activity they have authorityover. For example some regulations have a very broad mandate, regulating many activities (e.g.the LSPP) while others are very specific (e.g. The Endangered Species Act); (2) the legal effectof policies they contain; (3) the geographic area they represent; and (4) the degree ofimplementation–many aspects of more recent legislation, such as the <strong>Lake</strong> <strong>Simcoe</strong> Protection<strong>Plan</strong>, still need to be acted upon. Each chapter of this subwatershed plan provides a moredetailed assessment of the legislation and associated polices related to that particularsubwatershed element e.g. water quantity or aquatic habitat).1.7 How this plan is organizedThis plan includes a chapter dedicated to each of the five subwatershed features identifiedabove, these being water quality, water quantity, aquatic habitat, and terrestrial natural heritage.Each of these chapters follows an identical format, loosely structured around a pressure-stateresponseframework, in that each chapter firstly describes the current condition (state), secondlydescribes the stressors likely leading to the current condition (pressure), and finallyrecommends management responses in the context of the current management framework(response) (See text box below).Chapter 1: Approach and Management Setting 10
The <strong>Innisfil</strong> <strong>Creeks</strong> <strong>Subwatershed</strong> <strong>Plan</strong><strong>Plan</strong> section:1) <strong>Subwatershed</strong> Condition: Describes and analyzes the current state or condition of thesubwatershed feature based on the best available data and information. Thisassessment is based on monitoring data, model output, surveys etc.2) <strong>Subwatershed</strong> Stressors: Uses the best available information to identify and quantifythe factors affecting the current condition of the watershed. For example, describingphosphorus loads from different land use activities.3) Current Management: Establishes the relationship of the subwatershed plan to otherlegislation and planning documents;4) Management needs: Identifies areas within the current management framework whereimprovements within this plan may be able to have greatest impact i.e. gaps oropportunities for the subwatershed plan to act upon.5) Management recommendations: outlines resource management goals and objectives;as well as options for protection, rehabilitation, and enhancement of conditions in thesubwatershed.The resulting plan will protect the existing natural resources, facilitate informed planningdecisions, and improve the efficiency of the development review process. An over-archingconcept to keep in mind throughout the subwatershed planning process is that it is far morebeneficial, both financially and ecologically, to protect resources from degradation than torehabilitate them once they have been damaged.Chapter 1: Approach and Management Setting 11
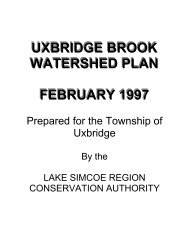
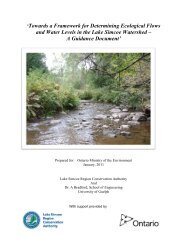
The <strong>Innisfil</strong> <strong>Creeks</strong> <strong>Subwatershed</strong> <strong>Plan</strong>2 Study Area: The <strong>Innisfil</strong> <strong>Creeks</strong> subwatershed2.1 LocationAll of the lands within the <strong>Lake</strong> <strong>Simcoe</strong> watershed ultimately drain into <strong>Lake</strong> <strong>Simcoe</strong>, via one ofthe tributary rivers. The <strong>Innisfil</strong> <strong>Creeks</strong> subwatershed is one of 18 subwatersheds that drain into<strong>Lake</strong> <strong>Simcoe</strong>. The subwatershed’s southern streams empty into Cook’s Bay, the northern onesempty into the main basin, and one drains into Kempenfelt Bay (Figure 2-1).The <strong>Innisfil</strong> <strong>Creeks</strong> subwatershed is located almost entirely within the Town of <strong>Innisfil</strong>, with asmall portion falling into the City of Barrie (3.3%). Within the subwatershed boundaries there are15 named streams, as well as a few small creeks, draining separately into <strong>Lake</strong> <strong>Simcoe</strong>. Aspreviously mentioned in Chapter 1 - Introduction, all of the streams have headwaters inagricultural areas and flow from west to east, through urban areas, before entering <strong>Lake</strong><strong>Simcoe</strong>. The exception is Strathallan Creek, which flows north into Kempenfelt Bay. The <strong>Innisfil</strong><strong>Creeks</strong> subwatershed is not as densely populated as some of its neighbouring subwatersheds,and has a total area of approximately 107.2 km 2 with a total watercourse length of 149 km(including all branches), or about 3.5% of the total combined watercourse length of the entire<strong>Lake</strong> <strong>Simcoe</strong> watershed.Chapter 2: Study Area: The <strong>Innisfil</strong> <strong>Creeks</strong> <strong>Subwatershed</strong> 12
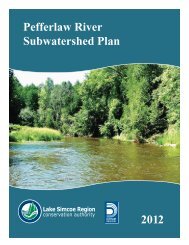
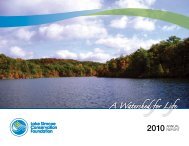
RIDGE RD WKempenfelt Bay<strong>Lake</strong><strong>Simcoe</strong>Impervious cover in the<strong>Innisfil</strong> <strong>Creeks</strong>subwatershedFigure 2-7LegendBARRIEBIG BAY PT RDRoadMunicipal BoundaryWatercourseSIDERD 25LOCKHART RD<strong>Subwatershed</strong>400 HWY NESSA RD10TH LINE9TH LINEYONGE STAlcona!Impervious Area( includes Active aggregates,Commercial,Inactive Aggregates, Estate Residential, Road,Rail, Rural Developmetn, and Urban)SIDERD 10INNISFIL BEACH RD7TH LINE<strong>Innisfil</strong><strong>Creeks</strong>METRO RD NBASELINE RDWARDEN AVEWOODBINE AVE6TH LINE5TH LINE!LefroySIDERD 10SIDERD 54TH LINEGEORGINAPOLLOCK RDHWY 400 S3RD LINEINNISFIL2ND LINECOUNTY RD 8914TH LINELINE 13Gilford!Cook'sBayGLENWOODS AVERAVENSHOE RD0 0.5 1 2 3 4 5KilometresKThis product was produced by the <strong>Lake</strong> <strong>Simcoe</strong> <strong>Region</strong> Conservation Authority andsome information depicted on this map may have been compiled from various sources.While every effort has been made to accurately depict the information,data / mapping errors may exist.This map has been produced for illustrative purposes only.LSRCA GIS Services DRAFT created July 2010.© LAKE SIMCOE REGION CONSERVATION AUTHORITY, 2010. All Rights ReservedThe following datasets roads, municipal boundaries and Oak Ridges Moraine are© Queens Printer for Ontario, 2010. Reproduced with Permission
The <strong>Innisfil</strong> <strong>Creeks</strong> <strong>Subwatershed</strong> <strong>Plan</strong>2.3 Human Health and Well-beingOne of the major reasons for understanding and managing watersheds and their function is toprotect the health and well-being of watershed residents. Figure 2-9 illustrates the watershedgovernance prism (Parkes et al., 2010) and the four different aspects of watershed governanceincluding “watersheds”, “ecosystems”, “health and well-being” and “social systems”. Thecombination of all of the aspects of watershed management gives a comprehensive view of theway watershed governance can link the determinants of health and well-being to watershedmanagement.Figure 2-9: Watershed governance prism (Parkes et al., 2010).The management of the <strong>Lake</strong> <strong>Simcoe</strong> watershed includes a number of these perspectives,incorporating issues related to human health and well-being, protection of wildlife habitats, andensuring the preservation of water quality and water quantity.The following sections highlight the link the between the <strong>Lake</strong> <strong>Simcoe</strong> watershed and therelated health benefits for residents of the watershed.2.3.1 Outdoor Recreation and Human HealthWithin an urban setting, green spaces (including parks, conservation areas, forests, wetlands,streams, and lake shore) are at a premium. Even within a more rural setting, these features aresometimes taken for granted when, in fact, they are an essential part of a healthy community.Chapter 2: Study Area: The <strong>Innisfil</strong> <strong>Creeks</strong> <strong>Subwatershed</strong> 26
The <strong>Innisfil</strong> <strong>Creeks</strong> <strong>Subwatershed</strong> <strong>Plan</strong>oWHPA-D: 25-year tot capture zone• Similarly, an IPZ is the area around a surface water intake and includes three time-oftravelzones.oooIPZ-1: 1000 m radiusIPZ-2: 2 hour time of travelIPZ-3: Area within the surface water body through which contaminants releasedduring an extreme event could be transported to the intake. For the intakesassociated with these (and <strong>Innisfil</strong> <strong>Creeks</strong>) subwatersheds this includes the entire<strong>Lake</strong> <strong>Simcoe</strong> watershed.Two additional vulnerable areas that were also delineated in the Assessment Reports areSignificant Groundwater Recharge Areas (SGRAs) and Highly Vulnerable Aquifers (HVAs).These vulnerable areas do not pertain directly to any particular drinking water system, butinstead are on a regional (landscape) scale:• SGRAs are areas where water enters an aquifer (underground reservoirs from which wedraw our water) through the ground. Recharge areas are significant when they supplymore water to an aquifer than the land around it. Significant Recharge Areas are animportant area on the landscape for ensuring a sufficient amount of water enters anaquifer. For example, paving over an SGRA would prevent water from getting into theground to recharge an aquifer, potentially decreasing the amount of water available.• HVAs are those areas where an aquifer may be more prone to contamination. Theseareas have been identified where there is little or no protection from an overlyingaquitard (a protective layer of low permeability materials). Generally, the faster water isable to flow through the ground to an aquifer, the more vulnerable the area is tocontamination. For example, a fuel spill would get into an aquifer much more quicklywhere a HVA has been identified than where one has not.Further information on these two regional scale Vulnerable Areas can be found in the SGBLSSPR Assessment Reports.Both the Town of <strong>Innisfil</strong> and City of Barrie have groundwater and surface water being used tosupply drinking water to their residents. With over 156,700 people (combined) relying on thesewater supplies as a source of safe drinking water it stresses the importance of maintainingand/or improving the quality (and quantity) of these supplies. When initiating, contributing,and/or participating in restoration efforts along streams draining into <strong>Lake</strong> <strong>Simcoe</strong>, or on thelake itself, it benefits not only the local wildlife and natural habitats, but also all those whodepend on the watershed and lake as a source of safe drinking water.For the Assessment Report, studies were done to assess the vulnerability, issues, and threatsfor each of the Wellhead Protection Areas and Intake Protection Zones. All three of the systemswithin the <strong>Innisfil</strong> <strong>Creeks</strong> subwatershed are located within the Town of <strong>Innisfil</strong> and consist of theAlcona Water Treatment <strong>Plan</strong>t, Golf Haven Well Supply, and Goldcrest Well Supply.The Alcona Water Treatment <strong>Plan</strong>t is a surface water intake located on the eastern shore of thesubwatershed at the inlet to Cook’s Bay. This system had a total of five significant drinkingwater threats identified in association with one land parcel. The significant threats identified areall associated with the municipal sewage treatment plant within the IPZ-1 (SGBLS-SPC, 2011).The Golf Haven Well Supply has two wells located in the south east area of the <strong>Innisfil</strong> <strong>Creeks</strong>subwatershed. A total of 21 significant drinking water threats were identified in association withChapter 2: Study Area: The <strong>Innisfil</strong> <strong>Creeks</strong> <strong>Subwatershed</strong> 31
The <strong>Innisfil</strong> <strong>Creeks</strong> <strong>Subwatershed</strong> <strong>Plan</strong>2.3.3 Ecological Goods and Services.In addition to the direct benefits to human health provided by public natural areas and cleandrinking water, the environment also provides a range of other, less tangible, benefits, oftentermed ‘ecological goods and services’. These benefits include the storage of floodwaters bywetlands, water capture and filtration by forests, the absorption of air pollution by trees, andclimate regulation.Forests, wetlands, and rivers that make up watersheds are essentially giant utilities providingecosystem services for local communities as well as the regional and global processes that weall benefit from. Ecosystems provide many services including carbon storage and sequestration,water storage, rainfall generation, climate buffering, biodiversity, soil stabilization, and more(Global Canopy Programme. http://www.globalcanopy.org/main.php?m=3).These benefits are dependent on ecosystem functions, which are the processes, or attributes,that maintain the ecosystems and the species that live within them. Humans are reliant on thecapacity of natural processes and systems to provide for human and wildlife needs (De Groot,2002). These include products received from ecosystems (e.g. food, fibre, clean air and water),benefits derived from processes (e.g. nutrient cycling, water purification, climate regulation), andnon-material benefits (e.g. recreation and aesthetic benefits) (Millennium EcosystemAssessment, 2003).In 2008, the <strong>Lake</strong> <strong>Simcoe</strong> <strong>Region</strong> Conservation Authority partnered with the David SuzukiFoundation and the Greenbelt Foundation to determine the value (natural capital) of theecosystem goods and services provided by the natural heritage features in the watershed in thereport: <strong>Lake</strong> <strong>Simcoe</strong> Basin’s Natural Capital: The Value of the Watershed’s Ecosystem Services(Wilson, 2008). By identifying and quantifying ecosystem services within a watershed,environmental resources can be directed towards areas that are currently of high value or areasthat have the potential to be of high value.2.3.3.1. Valuing EcosystemsThere have been several techniques developed to estimate economic values for non-marketecosystem services. The method used for the 2008 study uses avoided cost (i.e. damagesavoided) and replacement cost (cost to replace that service) for ecosystem service valuation, aswell as contingent valuations or willingness-to-pay studies for cultural values. Some of thevalues were derived using direct analysis and some values were adapted from other studies.Table 2-6 summarizes the value of the various ecosystem services by land cover type in the<strong>Innisfil</strong> <strong>Creeks</strong> subwatershed, as well as for the whole <strong>Lake</strong> <strong>Simcoe</strong> watershed. All ecosystemservice values have been updated to 2010 Canadian dollars.The estimated values provided are likely a conservative estimate because our knowledge of allthe benefits provided by nature is incomplete, and because these values are likely non-linear innature (i.e. the value of natural capital and its services will increase over time, as natural areasbecome more scarce, and demands for services such as clean water or mitigation of climatechange become greater). It is also important to note that without the earth’s ecosystems andresources, life would not be possible, so essentially the true value of nature is priceless. Thevaluations of ecosystem services, however, provide an opportunity to quantitatively assess thecurrent benefits and the potential costs of human impact.Chapter 2: Study Area: The <strong>Innisfil</strong> <strong>Creeks</strong> <strong>Subwatershed</strong> 34
The <strong>Innisfil</strong> <strong>Creeks</strong> <strong>Subwatershed</strong> <strong>Plan</strong>Table 2-5: Summary of non-market ecosystem service values by land cover type (2010 values).Land Cover TypeTotal <strong>Innisfil</strong> <strong>Creeks</strong>subwatershed value($million/yr)Total <strong>Lake</strong> <strong>Simcoe</strong> basinvalue($million/yr)Cropland 2.32 54.52Forest 8.93 207.93Forest/ Wetlands* 15.95 466.64Wetlands 3.34 176.12Grasslands 0.54 22.49Hedgerows/ CulturalWoodland0.19 6.31Pasture 1.24 41.80Urban Parks 0.17 3.18Water** 0.01 1.54Total 32.70 980.53* This includes treed swamps.** This does not include the value of <strong>Lake</strong> <strong>Simcoe</strong>As has been demonstrated, the natural systems of the <strong>Innisfil</strong> <strong>Creeks</strong> subwatershed provide anumber of goods and services. These so-called “free” ecosystem services have, in fact,significant value. The analysis in the 2008 report provided a first approximation of the value ofthe non-market services provided – totalling annually (in 2010 values) for the <strong>Lake</strong> <strong>Simcoe</strong>watershed $980 million and at least $32.7 million for the <strong>Innisfil</strong> <strong>Creeks</strong> subwatershed. The mosthighly valued natural assets are the forests and treed swamps. For the <strong>Lake</strong> <strong>Simcoe</strong> watershedthese were calculated to be worth $208 and $467 million per year, respectively. These valuesfor <strong>Innisfil</strong> <strong>Creeks</strong> were $8.9 million and $5.9 million.The high value for forests reflects the many important services they provide, such as waterfiltration, carbon storage, habitat for pollinators, and recreation. Treed swamps and wetlandsprovide high value because of their importance for water filtration, flood control, wastetreatment, recreation, and wildlife habitat.It is important to note that while the value of <strong>Lake</strong> <strong>Simcoe</strong> is not included in the watershed total,it is of considerable value to all surrounding natural and human communities within the <strong>Lake</strong><strong>Simcoe</strong> watershed. It is the focal point of many waterfront communities (such as the City ofBarrie and Town of <strong>Innisfil</strong>), provides a vast number of recreational opportunities for both localsand tourists alike, is a source of drinking water for seven municipal surface water intakes,supports a substantial fishery, and as well as being a significant natural heritage feature, itprovides people with beautiful scenery. As such, the preservation of the lake and the rest of thenatural heritage features within the watershed results in a significant cost savings in municipalinfrastructure that would otherwise be needed to service watershed residents and users.Chapter 2: Study Area: The <strong>Innisfil</strong> <strong>Creeks</strong> <strong>Subwatershed</strong> 35
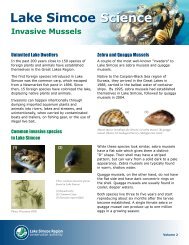
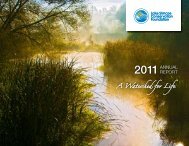
RIDGE RD WKempenfelt BaySoils in the <strong>Innisfil</strong><strong>Creeks</strong> subwatershed<strong>Lake</strong><strong>Simcoe</strong>LegendFigure 2-18BARRIEBIG BAY PT RDRoadMunicipal BoundaryWatercourseSIDERD 25400 HWY NLOCKHART RDSoil Hydro ClassESSA RD10TH LINE9TH LINEYONGE STA - high infiltration ratesB - moderate infiltration ratesC - slow infiltration ratesD - very slow infiltration ratesSIDERD 10SIDERD 5INNISFIL BEACH RDSIDERD 107TH LINE6TH LINE5TH LINE4TH LINE<strong>Innisfil</strong><strong>Creeks</strong>METRO RD NWARDEN AVEWOODBINE AVEBASELINE RDGEORGINAPOLLOCK RDSoil Texture ClassGRAVELLY SANDY LOAMSANDSANDY LOAMFINE SANDY LOAMLOAMLOAMY SANDSILTY LOAMSILTY CLAY LOAMORGANICHWY 400 S3RD LINEINNISFIL2ND LINECOUNTY RD 8914TH LINELINE 13Cook'sBayGLENWOODS AVERAVENSHOE RD0 0.5 1 2 3 4 5KilometresKThis product was produced by the <strong>Lake</strong> <strong>Simcoe</strong> <strong>Region</strong> Conservation Authority andsome information depicted on this map may have been compiled from various sources.While every effort has been made to accurately depict the information,data / mapping errors may exist.This map has been produced for illustrative purposes only.LSRCA GIS Services DRAFT created July 2010.© LAKE SIMCOE REGION CONSERVATION AUTHORITY, 2010. All Rights ReservedThe following datasets roads, municipal boundaries and Oak Ridges Moraine are© Queens Printer for Ontario, 2010. Reproduced with Permission
The <strong>Innisfil</strong> <strong>Creeks</strong> <strong>Subwatershed</strong> <strong>Plan</strong>CreekCedar Creek (#6)Gilford Creek<strong>Innisfil</strong> <strong>Creeks</strong>Leonard's Creek (#3)Mooselanka Creek (#2)Moyer CreekSandy Cove Creek (#1)Strathallan CreekSylvan CreekUpper Marsh CreekWhite Birch Creek (#10)Wilson Creek (#9)Stream OrderLength of Creek per % of Creek perOrder (m)Order4th 1,686 13TOTALS 12,655 1001st 657 442nd 823 56TOTALS 1,480 1001st 2,752 100TOTALS 2,752 1001st 6,465 832nd 1,334 17TOTALS 7,799 1001st 7,777 512nd 5,838 393rd 1,546 10TOTALS 15,160 1001st 2,837 442nd 765 123rd 2,880 44TOTALS 6,482 1001st 807 732nd 303 27TOTALS 1,110 1001st 10,828 472nd 6,891 303rd 1,746 84th 3,526 15TOTALS 22,991 1001st 2,055 932nd 159 7TOTALS 2,213 1001st 382 100TOTALS 382 1001st 1,162 352nd 2,145 65TOTALS 3,308 1001st 14,112 492nd 8,399 293rd 5,720 204th 461 2TOTALS 28,693 1001st 7,232 542nd 3,784 283rd 2,449 18TOTALS 13,465 100Chapter 2: Study Area: The <strong>Innisfil</strong> <strong>Creeks</strong> <strong>Subwatershed</strong> 52
The <strong>Innisfil</strong> <strong>Creeks</strong> <strong>Subwatershed</strong> <strong>Plan</strong>2.5.3.2.Drainage DensityDrainage density is a measure of how well a watershed is drained by its streams and iscalculated as the total length of all streams within a watershed divided by the total area of thewatershed. Typically, streams with high drainage densities are characterized by greater peakflows, high suspended and bed loads, and steep slopes (Dunne and Leopold, 1978). Theaverage drainage density of the <strong>Innisfil</strong> Creek subwatershed is more than 20% greater than theaverage <strong>Lake</strong> <strong>Simcoe</strong> watershed drainage density ( Table 2-8). This indicates potentially greaterrelief and increased erosion compared to other <strong>Lake</strong> <strong>Simcoe</strong> subwatersheds. The drainagedensities of the <strong>Innisfil</strong> <strong>Creeks</strong> are fairly homogenous with the exception of Strathallan Creekand Sylvan Creek. Strathallan Creek has a fairly small subwatershed and high local reliefresulting in very straight un-branched drainage. Sylvan Creek is a very small creek with asubwatershed area of only 0.056 km 2 , which makes measuring the stream length anddelineating the subwatershed boundary difficult using GIS.Table 2-7: <strong>Innisfil</strong> <strong>Creeks</strong> subwatershed stream length, watershed area and drainage density.CreekTotal StreamLength (km)Watershed Area(km 2 )Drainage Density(km/km 2 )Banks Creek (#5) 15.248 9.618 1.585Belle Aire Creek (#7) 8.481 5.076 1.671Bon Secours Creek (#4) 4.701 2.030 2.316Carson Creek (#8) 12.655 7.409 1.708Cedar Creek (#6) 1.480 1.850 0.800Gilford Creek 2.752 1.995 1.380<strong>Innisfil</strong> <strong>Creeks</strong> 7.799 4.504 1.732Leonards Creek (#3) 15.160 4.010 3.781Mooselanka Creek (#2) 6.482 2.404 2.697Moyer Creek 1.110 1.015 1.093Sandy Cove Creek (#1) 22.991 18.270 1.258Strathallan Creek 2.213 0.516 4.287Sylvan Creek 0.382 0.054 7.127Upper Marsh Creek 3.308 1.730 1.912White Birch Creek (#10) 28.693 12.972 2.212Wilson Creek (#9) 13.465 8.127 1.656<strong>Innisfil</strong> <strong>Creeks</strong>81.58 1.801146.92(at subwatershed level)***<strong>Simcoe</strong> Watershed2446.274 1.4633578.589Avg***The <strong>Lake</strong> <strong>Simcoe</strong> watershed average includes the subwatersheds of: Barrie <strong>Creeks</strong>, Beaver River,Black River, East Holland River, Georgina <strong>Creeks</strong>, Georgina Island, Hawkestone Creek, Hewitts Creek,Lovers Creek, Maskinonge River, Oro <strong>Creeks</strong> North, Oro Creek South, Pefferlaw/Uxbridge Brook,Ramara <strong>Creeks</strong>, West Holland River, and Whites Creek.Chapter 2: Study Area: The <strong>Innisfil</strong> <strong>Creeks</strong> <strong>Subwatershed</strong> 53
The <strong>Innisfil</strong> <strong>Creeks</strong> <strong>Subwatershed</strong> <strong>Plan</strong>2.5.3.3.Elevation along watercourseWhen there is a change in elevation, such as when water flows down from headwaters to baselevels, energy is produced. Where there is greater fall (steeper slope) energy is gained andwaters flow faster, picking up more sediment and having more force to erode banks. These canalso be areas of unique fishery habitats where water is flowing quickly over shallow bedrock(riffles and rapids) that are used by some fish species such as brook trout (Salvelinus fontinalis),walleye (Sander vitreus), and longnose dace (Rhinichthys cataractae), as spawning grounds.Depending on the fall, it can also create a barrier to some aquatic species that are unable toswim against the force of the flow. Where the elevation levels out, the energy dissipates,releasing sediment and creating a slower flowing stream. These different processes help to alterthe stream system over time. Stream profiles are shown below in relation to underlying surficialgeology and features (discussed in Section 2.4.2) and only represent the main branch.Figure 2-19 illustrates the stream profile of ten of the <strong>Innisfil</strong> <strong>Creeks</strong> starting from headwaterelevation (length = 0) down to <strong>Lake</strong> <strong>Simcoe</strong> (elevation = 220). Average gradient ranges from alow gradient (0.50% gradient for Sandy Cove) to a relatively steep medium gradient (1.04% forUpper Marsh and Wilson <strong>Creeks</strong>). The rest fall somewhere in between those values: Banks(0.72%), Belle Aire (1.01%), Bon Secours (0.96%), Cedar (0.51%), Leonard’s (0.89%),Mooselanka (0.82%), and White Birch (0.84%). Overall the streams in the subwatershed havesimilar gradients, with a few that have steeper sections and others that are levelled out in areas.The stream length does vary across the watershed (see Table 2-8 for lengths of each).Figure 2-19: <strong>Innisfil</strong> <strong>Creeks</strong> subwatershed stream profiles.2.5.3.4.Bank StabilityThe stability of the stream bank depends on the strength of erosive forces against the bank andthe stream bank’s ability to minimize the impacts. Erosion is a natural process that occurs in allstream systems, but its effects can be exacerbated by changes (both natural andanthropogenic) to the system. Precipitation events can rapidly increase flows and in turnChapter 2: Study Area: The <strong>Innisfil</strong> <strong>Creeks</strong> <strong>Subwatershed</strong> 54
The <strong>Innisfil</strong> <strong>Creeks</strong> <strong>Subwatershed</strong> <strong>Plan</strong>increase the rate of erosion. As the force of the water and the sediments increases, the streambank’s resistance decreases and scouring occurs. Visible signs of this include eroded sectionsnear river bends and undercut banks. If banks are already unstable, excessive undercutting canlead to slumping where large portions of stream bank can collapse.Unstable sites are those that typically have:• Removal of riparian vegetation, whose roots create a network of tiny soil anchors andslow overland flow;• Replacement of large, deep-rooted vegetation with impervious surfaces (i.e. in urbanareas), which cause an increase in the volume and velocity of overland water flow; and• Removal of in-stream debris which can provide a means of slowing water anddecreasing the force at which it interacts with the stream bank.Figure 2-20 illustrates the percentage of stream bank along White Birch, Sandy Cove, BelleAire, Leonard’s, and Wilson <strong>Creeks</strong> that are unstable, moderate or stable.White Birch Creek has five sites that range from theheadwaters of one of the branches (WBC-E) to thesite closest to the mouth at Cook’s Bay (WBC-A).Sites WBC-A, -B, and -C are located close togetherand all have a similar, high amount of stable streambank and a smaller portion of unstable stream bank.These sites are close to golf courses. Sites WBC-Dand WBC-E are further upstream, on differentbranches, but both surrounded by rural land use andsmall amounts of natural heritage areas. Both ofthese sites have a larger percentage of unstablestream banks, with Site WBC-D having almost equalamounts stable and unstable, while the majority of Site WBC-E stream banks are unstable.Sandy Cove Creek also has five sites that are spread out from the mouth at <strong>Lake</strong> <strong>Simcoe</strong>(SANDY-A) to the headwaters of one of the branches (SANDY-E). With the exception of SiteSANDY-A, all sites have a high percentage of stable stream bank, located through a variety ofland uses.Belle Aire Creek has four sites, located mostly in the eastern half of the watercourse with SiteBELLE-A at the mouth and Site BELLE-D midway along the creek. All four sites have greaterthan 80% of stable stream bank and run through urban, rural, and natural heritage areas.Leonard’s Creek also has four sites spread along the whole creek. With the exception of SiteLEONARD-B, all of the sites have at least 50% unstable stream bank. Both LEONARD-A andLEONARD-C are located within urban areas, with LEONARD-B and LEONARD-D in naturalheritage areas that are surrounded by either urban or rural land use.Lastly, Wilson Creek has three sites located near the mouth, one midway down the main branchand the last (WILSON-C) midway down a tributary. Both Site WILSON-A and WILSON-C have ahigh percentage of stable stream bank, and are in natural heritage and rural areas. SiteWILSON-B has 60% unstable stream bank with smaller percentages of stable and moderatestream bank. This site is located in area with both natural heritage and aggregate land uses.It should be noted that these sites were randomly chosen, where possible, and provide ageneral representation of the stream bank conditions.Chapter 2: Study Area: The <strong>Innisfil</strong> <strong>Creeks</strong> <strong>Subwatershed</strong> 55
The <strong>Innisfil</strong> <strong>Creeks</strong> <strong>Subwatershed</strong> <strong>Plan</strong>Figure 2-20: Percentage of stream bank that is unstable, moderate, or stable for five creeks withinthe <strong>Innisfil</strong> <strong>Creeks</strong> subwatershed.Chapter 2: Study Area: The <strong>Innisfil</strong> <strong>Creeks</strong> <strong>Subwatershed</strong> 56
The <strong>Innisfil</strong> <strong>Creeks</strong> <strong>Subwatershed</strong> <strong>Plan</strong>2.6 Climate and climate change2.6.1 Current climate conditions and trendsThe <strong>Innisfil</strong> <strong>Creeks</strong> subwatershed lies within the <strong>Simcoe</strong> and Kawartha <strong>Lake</strong>s climatic region asdefined by Brown et al. (1980). The climate within the subwatershed and surrounding area ischaracterized by moderate winters, warm summers, and long growing seasons with usuallyreliable precipitation patterns. Variations in topography, prevailing winds, and proximity toGeorgian Bay and <strong>Lake</strong> <strong>Simcoe</strong> lead to local differences in climate across the subwatershed.Climate data collected from the Barrie WPCC station has been used to characterize the climatefor the <strong>Innisfil</strong> <strong>Creeks</strong> subwatershed and to support the water budget analysis that is discussedwithin Chapter 4 – Water Quantity.Table 2-8 displays a summary of the climate normals from 1971 to 2001 for the climate stationslocated within the City of Barrie and the surrounding municipalities (Figure 2-21). Based on thedata collected at the Barrie WPCC station, the average mean annual temperature is 6.7 °C,while the total mean annual precipitation is 921 mm/yr. It should be noted that precipitationpatterns have become less predictable in recent years, perhaps due to climate change.Long-term climate data was obtained from Environment Canada stations shown on Figure 2-21including daily maximum and minimum temperature, daily rainfall and snowfall, and hourlyrainfall for the period of 1950-2008. The data gaps were infilled using methods carried outaccording to the methodology outlined in “Filling gaps in meteorological data sets used for longtermwatershed modelling” (H.O Schroeter, D.K. Boyd, and H.R. Whitely) by Schroeter &Associates in 2009. The record period for the Barrie WPCC (6110218) after the data infillingexercise was from 1950-2008.Table 2-8: Summary of climate normals (1971-2001) for the City of Barrie and surrounding area(modified from AquaResource and Golder, 2010).Mean Annual TemperatureMean Annual Precipitation°CStation NameElevation(mASL)Avg. Min. Max.Rainfall(mm)Snowfall(cm)*Angus Camphill 212 6.2 0.4 12.1 636 215 851Barrie WPCC** 221 6.7 1.7 11.7 683 237 921Cookstown 244 6.3 1.1 11.4 657 161 818Essa Ont Hydro 216 6.6 1.5 11.8 670 213 884Midhurst 226 6.6 1.3 11.9 687 222 908* The water storage capacity of 1 cm of snow pack is equivalent to 1 mm of rainfallTotal(mm)Chapter 2: Study Area: The <strong>Innisfil</strong> <strong>Creeks</strong> <strong>Subwatershed</strong> 57
@ARIDGE RD WKempenfelt Bay<strong>Lake</strong><strong>Simcoe</strong>Location of climate stations inand around the <strong>Innisfil</strong> <strong>Creeks</strong>subwatershedsFigure 2-21B A R R I E400 HWY NBIG BAY PT RDLOCKHART RDSIDERD 25LegendClimate StationLSRCA StationNVCA Station@AEDRoadA RDSIDERD 1010TH LINE9TH LINEYONGE STMunicipal BoundaryWatercourseINNISFIL BEACH RD7TH LINE6TH LINEMETRO RD NBASELINE RDWARDEN AVEWOODBINE AVESIDERD 105TH LINESIDERD 5HWY 400 S4TH LINE3RD LINEG E O R G I N APOLLOCK RDEDI N N I S F I L2ND LINECOUNTY RD 8914TH LINELINE 13Cook'sBayGLENWOODS AVERAVENSHOE RD0 0.5 1 2 3 4 5KilometresKThis product was produced by the <strong>Lake</strong> <strong>Simcoe</strong> <strong>Region</strong> Conservation Authority andsome information depicted on this map may have been compiled from various sources.While every effort has been made to accurately depict the information,data / mapping errors may exist.This map has been produced for illustrative purposes only.LSRCA GIS Services DRAFT created June2011.© LAKE SIMCOE REGION CONSERVATION AUTHORITY, 2011. All Rights ReservedThe following datasets roads, municipal boundaries and Oak Ridges Moraine are© Queens Printer for Ontario, 2011. Reproduced with Permission
The <strong>Innisfil</strong> <strong>Creeks</strong> <strong>Subwatershed</strong> <strong>Plan</strong>2.6.1.1.TemperatureTo examine temperature trends for the past 60 years, the daily average air temperature wasaveraged for each year to produce Figure 2-22 to compare the average annual, averagemaximum annual, and average minimum annual air temperature. Figure 2-22 gives a generaloverview of the temperature trends at the Barrie WPCC meteorological monitoring station,illustrating how all appear to fluctuate in relatively the same manner over the years.Figure 2-22: Comparison of the average annual, maximum and minimum temperatures at theBarrie WPCC Meteorological Monitoring Station (1950-2008). Source: SGBLS, <strong>2012</strong>.Figure 2-23 displays only the average annual temperature, giving a closer look at the trend forthe period of record. From it we can see that there is a gradual increase over the entire period,with this trend becoming more pronounced after 1980. There is a slight decrease at thebeginning of the period of record from 1950 through the 1960s, followed by a plateau for thenext 20 years or so before starting to increase. Overall, there has been an increase of 0.87°Cover the past 60 years.It should be noted that this is only a broad assessment of temperature trends at the BarrieWPCC meteorological monitoring station.Chapter 2: Study Area: The <strong>Innisfil</strong> <strong>Creeks</strong> <strong>Subwatershed</strong> 59
The <strong>Innisfil</strong> <strong>Creeks</strong> <strong>Subwatershed</strong> <strong>Plan</strong>Figure 2-23: Average annual temperature at the Barrie WPCC Meteorological Monitoring Station(1950-2008). Source: SGBLS, <strong>2012</strong>.2.6.1.2. PrecipitationPrecipitation is the driving force of the hydrological cycle, influencing aquatic and wetlandhabitats, as well as urban storm water management needs.Figure 2-24 illustrates the spatial distribution of annual precipitation over the study area asaveraged over the study period and interpolated by the PRMS model (this model is described inChapter 4 – Water Quantity). These data also show that annual average precipitation is fairlyuniform across the three subwatersheds.The mean monthly precipitation measured at Barrie WPCC from 1971-2000 is shown in Figure2-25 and shows the amount that fell as rain and the amount that fell as snow in each month.Figure 2-26 illustrates the total annual precipitation from 1950 to 2008. Fluctuations in theamount of precipitation, particularly winter precipitation, are somewhat expected at the BarrieWPCC meteorological station due to its close proximity to <strong>Lake</strong> <strong>Simcoe</strong>, causing lake effectprecipitation events. Overall, there is no significant change in annual precipitation over the past60 years, but a possible tendency to increasing precipitation since the 1980s.Chapter 2: Study Area: The <strong>Innisfil</strong> <strong>Creeks</strong> <strong>Subwatershed</strong> 60
RIDGE RD WStrahallan CreekAnnual Precipitation (mm/yr) in the<strong>Innisfil</strong> <strong>Creeks</strong> subwatershed asdistributed by PRMSKempenfelt Bay<strong>Lake</strong><strong>Simcoe</strong>LegendFigure 2-24BARRIEBIG BAY PT RDSandy CoveCreekMooselankaCreekRoadMunicipal BoundaryWatercourseSIDERD 25ESSA RD400 HWY NSIDERD 5SIDERD 10LOCKHART RD10TH LINE9TH LINEINNISFIL BEACH RDSIDERD 107TH LINE6TH LINEYONGE ST5TH LINE4TH LINEBanksLeonard'sAlcona!Bon Secours<strong>Innisfil</strong><strong>Creeks</strong>Belle AireCarsonWilsonCreek!LefroyCreekCreekCreekCedarCreekCreekCreekMoyer CreekSylvan CreekMETRO RD NWARDEN AVEWOODBINE AVEBASELINE RDGEORGINAPOLLOCK RD<strong>Innisfil</strong> <strong>Creeks</strong><strong>Subwatershed</strong># Stream GaugesObserved Annual AveragePrecipitation (mm/yr)970 - 972973 - 974975 - 976977 - 978979 - 980HWY 400 S3RD LINEINNISFIL2ND LINECOUNTY RD 8914TH LINELINE 13White BirchCreekUpper MarshGilford!GilfordCreekCreekCook'sBayGLENWOODS AVERAVENSHOE RD0 0.5 1 2 3 4 5KilometresKThis product was produced by the <strong>Lake</strong> <strong>Simcoe</strong> <strong>Region</strong> Conservation Authority andsome information depicted on this map may have been compiled from various sources.While every effort has been made to accurately depict the information,data / mapping errors may exist.This map has been produced for illustrative purposes only.LSRCA GIS Services DRAFT TF created November 2011.© LAKE SIMCOE REGION CONSERVATION AUTHORITY, 2010. All Rights ReservedThe following datasets roads, municipal boundaries and Oak Ridges Moraine are© Queens Printer for Ontario, 2010. Reproduced with Permission
The <strong>Innisfil</strong> <strong>Creeks</strong> <strong>Subwatershed</strong> <strong>Plan</strong>Figure 2-25: Mean monthly precipitation as snowfall and rainfall for Barrie WPCC station(AquaResource et al., 2011).Figure 2-26: Total annual precipitation at the Barrie WPCC Meteorological Monitoring Station(1950 - 2008). Source: SGBLS, <strong>2012</strong>.Chapter 2: Study Area: The <strong>Innisfil</strong> <strong>Creeks</strong> <strong>Subwatershed</strong> 62
The <strong>Innisfil</strong> <strong>Creeks</strong> <strong>Subwatershed</strong> <strong>Plan</strong>2.6.1.3.Thermal Stability of <strong>Lake</strong> <strong>Simcoe</strong>The thermal stability of the lake is important as it can have significant impacts on the biologicalcommunities within the lake, which in turn can impact the lives of those who rely on the lake asa resource. The thermal stability of the lake refers to the amount of energy needed for a watercolumn to mix completely, overcoming the vertical density differences of thermal stratification. Ina system where there is low stability, the lake completely mixes, whereas in a system wherethere is high stability there is little to no mixing (remains stratified). In <strong>Lake</strong> <strong>Simcoe</strong>, which is adimictic lake, the water column is thermally stratified during the ice-free season, and mixes inthe spring and fall. Most winters, it completely freezes over.To determine if the thermal stability of <strong>Lake</strong> <strong>Simcoe</strong> was changing in relation to mean airtemperatures (collected at Environment Canada’s weather station at Shanty Bay), Stainsby etal. (2011) compared the water column stability of the lake at three locations (main basin,Kempenfelt Bay, and Cook’s Bay), andthe timing of stratification in the springand turnover in the fall occurred over anapproximate 30 year time period (1980-2008). As the <strong>Innisfil</strong> <strong>Creeks</strong>subwatershed has section of waterfrontalong parts of each of these areas,results for all three are included.Out of the three sampling areas,Kempenfelt Bay generally has higherthermal stability due to its deeper depths(max 42 m; mean 26 m), whereasCook’s Bay tends to have lower thermalstability because of its shallower depths(max 21 m; mean 8 m) andconsequently smaller volume of waterthat needs to mix or stratify (Stainsby etal., 2011).The first parameter studied was thetemperature of Kempenfelt Bay duringthe ice-free period of the year. Figure2-27 illustrates the temperature changesin Kempenfelt Bay from 1980 (a) and2002 (b) as well as the stability of thelake. From it we can see that, incomparison to the 1980 graph, in 2002there is a high degree of red (warmertemperatures during the ice-freeseason) and wider contours (the lakebegins to stratify earlier in the year andmixes later in the fall, increasing theoverall time the lake remains stratified), allof which correspond with the recordedhigher lake stability (white line) (Stainsbyet al., 2011).To further support these findings, FigureFigure 2-27: Seasonal water column temperaturecontour in degrees Celsius) and stability(white line) in Kempenfelt Bay in 1980 (a) and2002 (b). Red triangles show the samplingdates along the x-axis. Source: Stainsby et al.,2011.Chapter 2: Study Area: The <strong>Innisfil</strong> <strong>Creeks</strong> <strong>Subwatershed</strong> 63
The <strong>Innisfil</strong> <strong>Creeks</strong> <strong>Subwatershed</strong> <strong>Plan</strong>2-28 illustrates the timing of the onset of stratification in the Kempenfelt Bay (Figure 2-24a), themain basin (Figure 2-28b), and Cook’s Bay (Figure 2-28c). It can be seen from the data that thelake is stratifying earlier in the year. As of 2002, stratification is occurring approximately 20 daysearlier in Kempenfelt Bay (Figure 2-28a) than it was in 1980. In the main basin stratification isoccurring approximately 13 days earlier (Figure 2-34b), while in Cook’s Bay, stratification isoccurring approximately 25 days earlier (Figure 2-28c).Figure 2-28: The timing of the onset of stratification in (a) Kempenfelt Bay, (b) the main basin,and (c) Cook’s Bay. Source: Stainsby et al., 2011.When looking at the fall turnover, Figure 2-29 shows it to be occurring later and later each yearfor the different sections of the lake. Between 1980 and 2002, mixing of the water column in thefall is occurring approximately 15 days later in Kempenfelt Bay (Figure 2-29a). In the main basinof <strong>Lake</strong> <strong>Simcoe</strong>, fall turnover is occurring 18 days later (Figure 2-29b) and approximately 24days later in Cook’s Bay (Figure 2-29c).Chapter 2: Study Area: The <strong>Innisfil</strong> <strong>Creeks</strong> <strong>Subwatershed</strong> 64
The <strong>Innisfil</strong> <strong>Creeks</strong> <strong>Subwatershed</strong> <strong>Plan</strong>Figure 2-29: The timing of fall turnover in (a) Kempenfelt Bay, (b) the main basin, and (c)Cook’s Bay. Source: Stainsby et al., 2011.Together this means that the lake remains stratified for a longer period of time. A longerstratified period can result in an increase in oxygen depletion in the hypolimnion, which in thedeeper zones may create “dead zone” areas where conditions are anoxic. These conditions canalso potentially increase the release of nutrients (such as phosphorus) and contaminants fromsediments. The impacts of this can include large fish die-offs, decrease in the fisheries, algalblooms (which, when dead and decomposing at the bottom further decrease oxygen levels) andcan deteriorate drinking water (Kling, et al. 2003).The length of the stratification period in Kempenfelt Bay and in the main basin has increasedapproximately 33 days from 1980 to 2008 (Figure 2-30 a and b). In comparison, the changes inthe length of time the water column remains stratified were most significant in Cook’s Bay wherethe water column remains stratified 56 days longer (Figure 2-30c).Chapter 2: Study Area: The <strong>Innisfil</strong> <strong>Creeks</strong> <strong>Subwatershed</strong> 65
The <strong>Innisfil</strong> <strong>Creeks</strong> <strong>Subwatershed</strong> <strong>Plan</strong>Figure 2-30: The length of the stratified period in (a) Kempenfelt Bay, (b) the main basin, and (c)Cook’s Bay. Source: Stainsby et al., 2011.Many of the impacts already being observed in the <strong>Lake</strong> <strong>Simcoe</strong> watershed counteract much ofthe work the LSRCA and partner municipalities have done to increase dissolved oxygenconcentrations and decrease phosphorus levels in <strong>Lake</strong> <strong>Simcoe</strong>. To ensure that the effortstaken are successful, despite the impacts of climate change, projects undertaken on tributaries,particularly those that are managed as coldwater need to focus on reducing the temperatureand the amount of phosphorus input. This can include an increase in riparian habitat, improvedstormwater management, and improvement of construction practices and agricultural practices.Additionally, municipalities are encouraged to include climate change adaptation policies in theOfficial <strong>Plan</strong>s, to plan for the future and implement pre-emptive measures.Chapter 2: Study Area: The <strong>Innisfil</strong> <strong>Creeks</strong> <strong>Subwatershed</strong> 66
The <strong>Innisfil</strong> <strong>Creeks</strong> <strong>Subwatershed</strong> <strong>Plan</strong>2.6.2 Climate change and predicted scenariosClimate change can have numerous impacts on ecological systems and those who depend onthem. As mentioned in the previous section, an increase in air temperature can increase thethermal stability of the lake, extending the stratified period, as well as changing the compositionof biological communities and creating ideal growing conditions for algae and bacteria. Anincrease in temperature can also cause an increase in evaporation and evapotranspiration,decreasing the amount of water infiltrating into the ground and recharging the groundwatersystem. Changes in precipitation patterns will also impact the hydrologic cycle, whether thesechanges show less or more precipitation. Where less precipitation is falling, habitats willexperience drought, and be susceptible to fires (terrestrial) and reduction in area (watercoursesand wetlands), and less water will be available replenish aquifers. Where more precipitationfalls, it is likely that flows will be altered (potentially changing the stream morphology),stormwater retention areas may overflow (releasing contaminants), and there is an increasedrisk of flooding and property damage. Further impacts of climate change can be found in thefollowing chapters, where applicable, in the stressors section. An important part of addressingthese stressors is to gain an understanding of what the changes will be in the future and actaccordingly to minimize the impacts. Climate models, used worldwide, give us an estimate ofwhat these possible changes are.To obtain more accurate projections for parameters such as seasonal and annual temperatureand precipitation, an ensemble of climate models are typically run together. The report“Adapting to Climate Change in Ontario: Towards the Design and Implementation of a Strategyand Action <strong>Plan</strong>” was released by the Expert Panel on Climate Change in November 2009(EPCCA, 2009). The study included a review of climate change model projections for Ontario,completed by Environment Canada (CCCSN, 2009). The projections were based on acombination of 24 models and divides Ontario into 63 grid cells, one of which covers the <strong>Lake</strong><strong>Simcoe</strong> watershed. Three scenarios were produced based on future amount of greenhouse gas(GHG) emissions (Low, Medium and High).Table 2-9 lists the projected change in average annual and seasonal temperatures, comparing1961-1990 to the 2050s. From it we can see under high GHG emissions there is a projectedincrease in temperature of 3% for the area. All seasons are expected to see at least a 2.2%temperature increase; however the most significant increase is seen during the winter, wherethere is a projected increase of 2.5 -3.4% based on Low to High GHG emissions.Table 2-9: Summary of projected change in average annual temperature (°C) in the 2050scompared with 1961-1990 (CCCSN, 2009).Projected change in air temperature ( o C)GHG emmision scenarioSeason Low Medium HighAnnual 2.3 2.7 3.0Winter 2.5 3.0 3.4Spring 2.2 2.5 2.8Summer 2.2 2.6 2.9Autumn 2.3 2.6 2.8Table 2-10 lists the projected change in average annual and seasonal temperatures, comparing1961-1990 to 2050s.Under the high GHG emission scenario, annual precipitation is projected toincrease by 5.51%. All seasons are expected to increase by at least 3.06%, with the exceptionof summer precipitation. As the amount of GHG emissions increase, there is only a slightChapter 2: Study Area: The <strong>Innisfil</strong> <strong>Creeks</strong> <strong>Subwatershed</strong> 67
The <strong>Innisfil</strong> <strong>Creeks</strong> <strong>Subwatershed</strong> <strong>Plan</strong>increase predicted for the Low and Medium emission scenarios, and a decrease in the amountof precipitation of -0.62% under High GHG emission scenario.Table 2-10: Summary of projected change in precipitation (%) in 2050s compared with 1961-1990(CCCSN, 2009).Projected change in precipitation (%)GHG emmision scenarioSeason Low Medium HighAnnual 5.15 5.45 5.51Winter 9.38 10.19 10.76Spring 8.58 9.1 9.65Summer 0.92 0.11 -0.62Autumn 3.06 3.79 3.82Despite the use of a combination of multiple models, it is important to note that there is still avery high level of uncertainty associated with the projections. As scientists continue tounderstand the smaller interactions (i.e. what role clouds play in climate change) and are able tointegrate them into the models, this uncertainty will decrease.Chapter 2: Study Area: The <strong>Innisfil</strong> <strong>Creeks</strong> <strong>Subwatershed</strong> 68
The <strong>Innisfil</strong> <strong>Creeks</strong> <strong>Subwatershed</strong> <strong>Plan</strong>2 Study Area: The <strong>Innisfil</strong> <strong>Creeks</strong> subwatershed2.1 LocationAll of the lands within the <strong>Lake</strong> <strong>Simcoe</strong> watershed ultimately drain into <strong>Lake</strong> <strong>Simcoe</strong>, via one ofthe tributary rivers. The <strong>Innisfil</strong> <strong>Creeks</strong> subwatershed is one of 18 subwatersheds that drain into<strong>Lake</strong> <strong>Simcoe</strong>. The subwatershed’s southern streams empty into Cook’s Bay, the northern onesempty into the main basin, and one drains into Kempenfelt Bay (Figure 2-1).The <strong>Innisfil</strong> <strong>Creeks</strong> subwatershed is located almost entirely within the Town of <strong>Innisfil</strong>, with asmall portion falling into the City of Barrie (3.3%). Within the subwatershed boundaries there are15 named streams, as well as a few small creeks, draining separately into <strong>Lake</strong> <strong>Simcoe</strong>. Aspreviously mentioned in Chapter 1 - Introduction, all of the streams have headwaters inagricultural areas and flow from west to east, through urban areas, before entering <strong>Lake</strong><strong>Simcoe</strong>. The exception is Strathallan Creek, which flows north into Kempenfelt Bay. The <strong>Innisfil</strong><strong>Creeks</strong> subwatershed is not as densely populated as some of its neighbouring subwatersheds,and has a total area of approximately 107.2 km 2 with a total watercourse length of 149 km(including all branches), or about 3.5% of the total combined watercourse length of the entire<strong>Lake</strong> <strong>Simcoe</strong> watershed.Chapter 2: Study Area: The <strong>Innisfil</strong> <strong>Creeks</strong> <strong>Subwatershed</strong> 12
OrilliaRamaraLocation of the<strong>Innisfil</strong> <strong>Creeks</strong>subwatershedFigure 1-1LegendOro-Medonte<strong>Lake</strong><strong>Simcoe</strong>CITYOFKAWARTHALAKESLSRCA Watershed<strong>Innisfil</strong> <strong>Creeks</strong> <strong>Subwatershed</strong>Lower Tier BoundaryUpper Tier BoundaryBarrie<strong>Innisfil</strong>SIMCOEBrockGeorginaDURHAMYORKScugogBradfordWestGwillimburyEastGwillimburyUxbridgeCaledonNewTecumsethKingNewmarketAuroraWhitchurch-Stouffville0 1 2 4 6 8 10KilometresKThis product was produced by the <strong>Lake</strong> <strong>Simcoe</strong> <strong>Region</strong> Conservation Authority andsome information depicted on this map may have been compiled from various sources.While every effort has been made to accurately depict the information,data / mapping errors may exist.This map has been produced for illustrative purposes only.LSRCA GIS Services DRAFT created July 2010.© LAKE SIMCOE REGION CONSERVATION AUTHORITY, 2009. All Rights ReservedThe following datasets roads, municipal boundaries and Oak Ridges Moraine are© Queens Printer for Ontario, 2009. Reproduced with Permission
The <strong>Innisfil</strong> <strong>Creeks</strong> <strong>Subwatershed</strong> <strong>Plan</strong>2.2 Human Geography2.2.1 Population and Municipal BoundariesBecause the subwatershed boundaries and the municipal boundaries are not the same, thesubwatersheds contain residents from multiple municipalities. <strong>Innisfil</strong> <strong>Creeks</strong> is located mostlywithin the Town of <strong>Innisfil</strong>, with a small portion in the City of Barrie and even less the Town ofBradford-West Gwillimbury.Population within the Town of <strong>Innisfil</strong> expanded from an estimated 31,175 residents in the 2006census to 33,061 in the 2011 census, resulting in an increase of 6.1% over the 5 year period.This population is a not a very mobile one, with only 10% having changed their addressbetween the 2001 and 2006 census, suggesting that people may have deeper roots here and alonger term investment in their community. The median age of those living in the Town of <strong>Innisfil</strong>is 40.3, slightly above the provincial average, and a median income of $29,888, above both theCity of Barrie and the provincial average (Stats Canada, 2006). The projected population for theTown of <strong>Innisfil</strong> is 56,000 by 2031 (Growth <strong>Plan</strong> for the Greater Golden Horseshoe, 2006, OfficeConsolidation January <strong>2012</strong>). This is a 70% increase over a 20 year periodThe population of City of Barrie during the 2006 census was estimated to be 128,430. This roseto 135,711 during the 2011 census, representing a 5.7 % population increase over a five yearperiod. While this is a large population, it is also a very mobile one with an estimated 54%having changed addresses between the 2001 and 2006 census, possibly indicating thatresidents may have a short term view of their community. The median age of those living in theCity of Barrie is 35.4, almost four years younger than the provincial median of 39 years, and themedian income for 2005 was $28,785, above the provincial median income of $27,258 (StatsCanada, 2006). The projected population for the City of Barrie is 210,000 by 2031 (Growth <strong>Plan</strong>for the Greater Golden Horseshoe, 2006, Office Consolidation January <strong>2012</strong>). This is a 55%increase from the 2011 population of approximately 135,711 (Stats Canada, 2011).Municipal population from each municipality and total population density for each of thesubwatersheds is presented on the following page in Table 2-1.Chapter 2: Study Area: The <strong>Innisfil</strong> <strong>Creeks</strong> <strong>Subwatershed</strong> 14
The <strong>Innisfil</strong> <strong>Creeks</strong> <strong>Subwatershed</strong> <strong>Plan</strong>Table 2-1: Estimated population and population density within the <strong>Innisfil</strong> <strong>Creeks</strong> subwatershed (Data Source: Stats Canada, 2006Community Profiles)<strong>Subwatershed</strong><strong>Subwatershed</strong>Area (km 2 )<strong>Innisfil</strong> <strong>Creeks</strong> 107.15MunicipalityTotalMunicipalPopulation(2011)EstimatedMunicipalPopulation(2011) withinsubwatershedTown of <strong>Innisfil</strong> 33,079 25,876City of Barrie 135,711 1,144Town ofBradford-WestGwillimbury28,077 29EstimatedTotalsubwatershedpopulation(2011)EstimatedPopulationDensity(persons/km 2 )27,049 252Chapter 2: Study Area: The <strong>Innisfil</strong> <strong>Creeks</strong> <strong>Subwatershed</strong> 15
The <strong>Innisfil</strong> <strong>Creeks</strong> <strong>Subwatershed</strong> <strong>Plan</strong>The level of education attained by a person can influence both their career choice and incomelevel. Table 2-2 lists the percentage of the Town of <strong>Innisfil</strong> and City of Barrie populations, 15years and over, and their education attainment compared to that of the provincial standings.Table 2-2: Educational attainment for the Town of <strong>Innisfil</strong> and City of Barrie (Stats Canada, 2006).Town of<strong>Innisfil</strong>City ofBarrieProvinceof OntarioNo certificate; diploma or degree 27% 22% 22%High school certificate or equivalent 29% 29% 27%Apprenticeship or trades certificate or diploma 13% 9% 8%College; CEGEP or other non-university certificate ordiploma20% 24% 18%University certificate or diploma below the bachelor level 3% 3% 4%University certificate; diploma or degree 9% 13% 20%As of January 1, 2010 the City of Barrie’s southern border extended to include 2,293 hectares ofland from the Town of <strong>Innisfil</strong> to accommodate the City’s projected growth. With the removal ofthese annexed lands, approximately 500 residents that were in the Town of <strong>Innisfil</strong> are nowlocated within the City of Barrie.2.2.2 Land UseLand use within the <strong>Innisfil</strong> <strong>Creeks</strong> subwatershed has been divided up into 12 classes includingintensive and non-intensive agriculture, rural development, urban areas, and natural heritagefeatures (Figure 2-2). Land uses with 0% coverage in a subwatershed were not reported.Land use in the <strong>Innisfil</strong> <strong>Creeks</strong> subwatershed is currently dominated by agriculture (45%) andnatural heritage cover (33%). Urban areas account for 15% of the subwatershed land use,including commercial, estate residential, institutional, and other various land uses. Other landuses occupying smaller areas include commercial (0.3%), industrial (0.3%), aggregate (0.5%),institutional (0.5%), and manicured open space (0.5%).Figure 2-2: Land use distribution within the <strong>Innisfil</strong> <strong>Creeks</strong> subwatershed.The distributions of land uses within the <strong>Innisfil</strong> <strong>Creeks</strong> subwatershed can be seen in Figure 2-3.Chapter 2: Study Area: The <strong>Innisfil</strong> <strong>Creeks</strong> <strong>Subwatershed</strong> 16
B A R R I EBIG BAY PT RDRIDGE RD WKempenfelt Bay<strong>Lake</strong><strong>Simcoe</strong>LegendLand uses in the<strong>Innisfil</strong> <strong>Creeks</strong>subwatershedFigure 2-3RoadMunicipal BoundarySIDERD 25RD400 HWY NSIDERD 10LOCKHART RD10TH LINE9TH LINEINNISFIL BEACH RD7TH LINE6TH LINEYONGE STMETRO RD NBASELINE RDWARDEN AVEWOODBINE AVEWatercourseGreenbelt(Protected Country Side)Land UseUrbanRuralNatural HeritageGolf CourseAggregateSIDERD 105TH LINESIDERD 5HWY 400 S4TH LINE3RD LINEG E O R G I N APOLLOCK RDI N N I S F I L2ND LINECOUNTY RD 8914TH LINELINE 13Cook'sBayGLENWOODS AVERAVENSHOE RD0 0.5 1 2 3 4 5KilometresKThis product was produced by the <strong>Lake</strong> <strong>Simcoe</strong> <strong>Region</strong> Conservation Authority andsome information depicted on this map may have been compiled from various sources.While every effort has been made to accurately depict the information,data / mapping errors may exist.This map has been produced for illustrative purposes only.LSRCA GIS Services DRAFT created July 2010.© LAKE SIMCOE REGION CONSERVATION AUTHORITY, 2010. All Rights ReservedThe following datasets roads, municipal boundaries and Oak Ridges Moraine are© Queens Printer for Ontario, 2010. Reproduced with Permission
The <strong>Innisfil</strong> <strong>Creeks</strong> <strong>Subwatershed</strong> <strong>Plan</strong>To see how the <strong>Innisfil</strong> <strong>Creeks</strong> subwatershed compares to the other subwatersheds within the<strong>Lake</strong> <strong>Simcoe</strong> watershed, Figure 2-4 to Figure 2-6 illustrate all 18 of the <strong>Lake</strong> <strong>Simcoe</strong>subwatersheds from the subwatershed with the highest percentage of urban, natural heritageand rural land uses to the subwatershed with the lowest percentage. The <strong>Innisfil</strong> <strong>Creeks</strong>subwatershed is outlined in black.For urban land use (Figure 2-4), the <strong>Innisfil</strong> <strong>Creeks</strong> has the sixth highest percentage (15%). Thesubwatershed with the highest percentage is the Barrie <strong>Creeks</strong> subwatershed in the westernpart of the watershed with 63%, while the Whites Creek subwatershed in the eastern part of thewatershed has the lowest (1%).Figure 2-4: Urban land use in the <strong>Lake</strong> <strong>Simcoe</strong> subwatersheds.Chapter 2: Study Area: The <strong>Innisfil</strong> <strong>Creeks</strong> <strong>Subwatershed</strong> 18
The <strong>Innisfil</strong> <strong>Creeks</strong> <strong>Subwatershed</strong> <strong>Plan</strong>The subwatershed with the highest percentage of natural heritage land cover is HawkestoneCreek (57%) in the north-west of the watershed, while the Barrie <strong>Creeks</strong> subwatershed in thewest has the lowest percentage (17%). The <strong>Innisfil</strong> <strong>Creeks</strong> subwatershed has the seventhlowest percentage with 33% (Figure 2-5).Figure 2-5: Natural heritage land cover in the <strong>Lake</strong> <strong>Simcoe</strong> subwatersheds.Chapter 2: Study Area: The <strong>Innisfil</strong> <strong>Creeks</strong> <strong>Subwatershed</strong> 19
The <strong>Innisfil</strong> <strong>Creeks</strong> <strong>Subwatershed</strong> <strong>Plan</strong>Figure 2-6 illustrates the rural land use in the <strong>Lake</strong> <strong>Simcoe</strong> subwatersheds. The MaskinongeRiver subwatershed in the southern part of the watershed has the highest percentage with 73%,while the Barrie <strong>Creeks</strong> subwatershed in the west has the lowest (4%) percentage of rurallanduse, with a large percentage gap between it and of the second lowest subwatershed (EastHolland) which has 34%. The <strong>Innisfil</strong> <strong>Creeks</strong> subwatershed is in the middle with 48%..Figure 2-6: Rural land use in the <strong>Lake</strong> <strong>Simcoe</strong> subwatersheds.Chapter 2: Study Area: The <strong>Innisfil</strong> <strong>Creeks</strong> <strong>Subwatershed</strong> 20
The <strong>Innisfil</strong> <strong>Creeks</strong> <strong>Subwatershed</strong> <strong>Plan</strong>2.2.2.1.Impervious SurfacesImpervious surfaces refer to hardened surfaces, such as roads, parking lots, and rooftops,which are made of (or covered in) a material impenetrable by water (i.e. asphalt, concrete, brick,1rock, etc) . As this reduces the amount of water infiltrating down into the groundwater suppliesand increases surface runoff, the hydrologic properties or drainage characteristics of the areaare significantly altered.An increase in impervious surfaces,generally associated with urbangrowth, can impact the surroundingenvironment in a number of ways.These impacts include: decreases inevapotranspiration as there is littlevegetation and the permeable soil ispaved over; decreases ingroundwater recharge; increases infrequency and intensity of surfacerunoff, leading to an increase in flowvelocities and energy (which canalter the morphology of the streamthrough channel widening, undercutting of banks, sedimentation, andbraiding of the stream); thermal degradation of the watercourses; decreases in water quality aspollutants are washed off streets into storm drains or ditches which discharge to watercoursesor the lake; and impairment of aquatic communities (which can be negatively affected by allimpacts listed above).Environment Canada’s Areas of Concern (AOC) Guidelines (2004) suggest a lower limit of 10%imperviousness, where subwatersheds should still be able to maintain surface water quality andquantity, and preserve aquatic species density and biodiversity. The AOC Guidelines furtherrecommend an upper limit of 30% as a threshold for degraded systems that have alreadyexceeded the 10% impervious guidelines. The <strong>Innisfil</strong> <strong>Creeks</strong> subwatershed is above the 10%guideline, but is below the upper limit threshold with approximately 21% impervious surface. Asthis subwatershed hasn’t reached the 30% threshold, there is still room through mitigative actionand careful development practices to reduce or at least maintain this number to assist inmaintaining water quality. Figure 2-7 illustrates the impervious cover within the subwatershed.1 For the majority of this report, impervious surfaces do not include features such as wetlands. These are sometimesconsidered impervious in hydrogeological models, such as those presented in Chapter 4 – Water Quantity.Chapter 2: Study Area: The <strong>Innisfil</strong> <strong>Creeks</strong> <strong>Subwatershed</strong> 21
RIDGE RD WKempenfelt Bay<strong>Lake</strong><strong>Simcoe</strong>Impervious cover in the<strong>Innisfil</strong> <strong>Creeks</strong>subwatershedFigure 2-7LegendBARRIEBIG BAY PT RDRoadMunicipal BoundaryWatercourseSIDERD 25LOCKHART RD<strong>Subwatershed</strong>400 HWY NESSA RD10TH LINE9TH LINEYONGE STAlcona!Impervious Area( includes Active aggregates,Commercial,Inactive Aggregates, Estate Residential, Road,Rail, Rural Developmetn, and Urban)SIDERD 10INNISFIL BEACH RD7TH LINE<strong>Innisfil</strong><strong>Creeks</strong>METRO RD NBASELINE RDWARDEN AVEWOODBINE AVE6TH LINE5TH LINE!LefroySIDERD 10SIDERD 54TH LINEGEORGINAPOLLOCK RDHWY 400 S3RD LINEINNISFIL2ND LINECOUNTY RD 8914TH LINELINE 13Gilford!Cook'sBayGLENWOODS AVERAVENSHOE RD0 0.5 1 2 3 4 5KilometresKThis product was produced by the <strong>Lake</strong> <strong>Simcoe</strong> <strong>Region</strong> Conservation Authority andsome information depicted on this map may have been compiled from various sources.While every effort has been made to accurately depict the information,data / mapping errors may exist.This map has been produced for illustrative purposes only.LSRCA GIS Services DRAFT created July 2010.© LAKE SIMCOE REGION CONSERVATION AUTHORITY, 2010. All Rights ReservedThe following datasets roads, municipal boundaries and Oak Ridges Moraine are© Queens Printer for Ontario, 2010. Reproduced with Permission
The <strong>Innisfil</strong> <strong>Creeks</strong> <strong>Subwatershed</strong> <strong>Plan</strong>2.2.2.2.Settlement AreasFor the most part, the built up, urban areas in the Town of <strong>Innisfil</strong> tend to be in communitiesalong the shoreline, while the majority of the town remains rural, unlike the City of Barrie whichcontinues to be one of the major urban areas within the <strong>Lake</strong> <strong>Simcoe</strong> watershed. Compared topast population projections, the <strong>Lake</strong> <strong>Simcoe</strong> watershed population continues to grow fasterthan originally anticipated (LSEMS, 1995). Urban development activities have subsequentlyincreased to keep pace with this population growth. Construction of new dwellings was essentialto meet the demands of the rising populations within the urban centres, and between the 2001and 2006 census, there was an increase of approximately 840 private dwellings in the Town of<strong>Innisfil</strong>. In the City of Barrie there was an increase of approximately 10,000 private dwellings(Statistics Canada, 2006). Settlement areas are shown in Figure 2-8.Even with a growing population, there are still a large number of residents who work outsidetheir municipality, county, and even province and Canada. Many of the people who work in largecities cannot afford to live within them, so they commute from smaller towns that have a moreaffordable cost of living. These small towns/communities are known as ‘bedroom communities’.Typically bedroom communities are located in rural or semi-rural areas, surrounded by greenspace, and are in close proximity to a major highway that leads to the larger cities. The Town of<strong>Innisfil</strong> is a good example of this, with only 14% of the total employed labour force working in themunicipality. The City of Barrie could also be considered a bedroom community for some of thelarger cities, such as the City of Toronto, but as its economy grows it is slowly becoming a focalurban centre itself. Within the City of Barrie, approximately half of the population works withinthe City (49%) and the other half works outside it (51%) (Table 2-3).Table 2-3: Place of work status in the Town of <strong>Innisfil</strong> and City of Barrie (Data Source: StatisticsCanada, 2006).Town of <strong>Innisfil</strong>City of BarriePlace of Work StatusPopulationPop.Percentage(%)PopulationPop.Percentage(%)Worked at home 1,045 6 4,080 6Worked outside Canada 60 0.4 240 0.4No fixed workplace address 2,470 15 7,520 11Worked in census (municipality) ofresidenceWorked in different census subdivision(municipality) within the census division(county) of residenceWorked in different census division(county)2,195 14 33,315 494,635 29 9,770 145,700 35 12,660 19Worked in different province 40 0.2 120 0.2Total employed labour force 16,145 100 67,705 100The economy of the bedroom communities tends to focus around real estate, general retail, andservices that are oriented to serving residents. Industrial and technological industries are not aChapter 2: Study Area: The <strong>Innisfil</strong> <strong>Creeks</strong> <strong>Subwatershed</strong> 23
The <strong>Innisfil</strong> <strong>Creeks</strong> <strong>Subwatershed</strong> <strong>Plan</strong>main focus and offer fewer employment opportunities. This is evident in the Town of <strong>Innisfil</strong>where the industries that saw the largest growth between the 2001 and 2006 census werefinance and real estate (24.8%), health, social and educational services (28.8%), and agricultureand other resource-based industries (31.2%). The industries with the lowest growth includedconstruction and manufacturing (5.4%), while business services saw a 0.7% decrease (Table2-4). Even though there is an increase in various industries, a reason that many people chooseto live in the Town of <strong>Innisfil</strong>, whilst working outside it, is the opportunity to enjoy the largeamount of waterfront along the eastern and northern borders of the town. There is still a largeinflux of residents who own or rent cottages during the summer months, but many people whowork in the city are moving to more natural areas and converting seasonal properties topermanent residences. This brings business to the area and increases the demands forservices.The City of Barrie, with more residents working within the municipality, saw an increase in allindustries with the largest in agriculture and other resource-based industries (82.8%). Most ofthe other industries saw an increase of at least 25%, with the smallest increase being inconstruction and manufacturing (18.9%) and wholesale and retail trade (20.4%).Table 2-4: Changes in industry in the Town of <strong>Innisfil</strong> and City of Barrie (Data Source: StatisticsCanada, 2001 and 2006).Town of <strong>Innisfil</strong>City of BarrieIndustry<strong>Innisfil</strong>2001census<strong>Innisfil</strong>2006census%changeBarrie2001censusBarrie2006census%changeAgriculture and other resourcebasedindustries385 505 31.2 495 905 82.8Construction17355,31543205.4 13,150Manufacturing 2820 10,315Wholesale trade11003,705268513.4 11,095Retail trade 1945 9,65518.920.4Finance and real estate 630 785 24.8 2,840 3,610 27.1Health care and social services11306,555151028.8 8,125Educational services 815 4,73538.9Business services 2880 2860 -0.7 9,610 12,030 25.2Other services 2575 3180 23.5 10,575 14,320 35.4Total Experienced work force 14,980 16,880 12.7 55,885 71,140 27.3* Red font indicates a decreaseChapter 2: Study Area: The <strong>Innisfil</strong> <strong>Creeks</strong> <strong>Subwatershed</strong> 24
RIDGE RD WKempenfelt Bay<strong>Lake</strong><strong>Simcoe</strong>Settlement areas in the<strong>Innisfil</strong> <strong>Creeks</strong>subwatershed.Figure 2-8LegendBARRIEBIG BAY PT RDRoadMunicipal BoundaryWatercourseLOCKHART RDSIDERD 25400 HWY NSettlementESSA RD10TH LINEAlcona!<strong>Innisfil</strong> <strong>Creeks</strong><strong>Subwatershed</strong>YONGE STSIDERD 109TH LINEINNISFIL BEACH RD7TH LINE<strong>Innisfil</strong><strong>Creeks</strong>METRO RD NBASELINE RDWARDEN AVEWOODBINE AVE6TH LINE5TH LINE!LefroySIDERD 10SIDERD 54TH LINEGEORGINAPOLLOCK RDHWY 400 S3RD LINEINNISFIL2ND LINECOUNTY RD 8914TH LINELINE 13Gilford!Cook'sBayGLENWOODS AVERAVENSHOE RD0 0.5 1 2 3 4 5KilometresKThis product was produced by the <strong>Lake</strong> <strong>Simcoe</strong> <strong>Region</strong> Conservation Authority andsome information depicted on this map may have been compiled from various sources.While every effort has been made to accurately depict the information,data / mapping errors may exist.This map has been produced for illustrative purposes only.LSRCA GIS Services DRAFT created July 2010.© LAKE SIMCOE REGION CONSERVATION AUTHORITY, 2010. All Rights ReservedThe following datasets roads, municipal boundaries and Oak Ridges Moraine are© Queens Printer for Ontario, 2010. Reproduced with Permission
The <strong>Innisfil</strong> <strong>Creeks</strong> <strong>Subwatershed</strong> <strong>Plan</strong>2.3 Human Health and Well-beingOne of the major reasons for understanding and managing watersheds and their function is toprotect the health and well-being of watershed residents. Figure 2-9 illustrates the watershedgovernance prism (Parkes et al., 2010) and the four different aspects of watershed governanceincluding “watersheds”, “ecosystems”, “health and well-being” and “social systems”. Thecombination of all of the aspects of watershed management gives a comprehensive view of theway watershed governance can link the determinants of health and well-being to watershedmanagement.Figure 2-9: Watershed governance prism (Parkes et al., 2010).The management of the <strong>Lake</strong> <strong>Simcoe</strong> watershed includes a number of these perspectives,incorporating issues related to human health and well-being, protection of wildlife habitats, andensuring the preservation of water quality and water quantity.The following sections highlight the link the between the <strong>Lake</strong> <strong>Simcoe</strong> watershed and therelated health benefits for residents of the watershed.2.3.1 Outdoor Recreation and Human HealthWithin an urban setting, green spaces (including parks, conservation areas, forests, wetlands,streams, and lake shore) are at a premium. Even within a more rural setting, these features aresometimes taken for granted when, in fact, they are an essential part of a healthy community.Chapter 2: Study Area: The <strong>Innisfil</strong> <strong>Creeks</strong> <strong>Subwatershed</strong> 26
The <strong>Innisfil</strong> <strong>Creeks</strong> <strong>Subwatershed</strong> <strong>Plan</strong>2.3.1.1.PhysicalWhether it’s an open soccer field, running/walking trailsthrough forests, or sandy beaches along the lake front,the green spaces within this subwatershed provide anumber of outdoor recreational opportunities for residentsand visiting tourists. The different types of areas availableoffer a variety of physical activities that would not beavailable at a local gym and come at little to no cost.Parks and sports field provide areas for recreational orpick up games of soccer, football, or frisbee. Trails areareas to walk, run, or bike. Parks and conservation areaswith forests and wetlands provide a range of recreationaland aesthetic opportunities and the nearby lake shoreand waterways offer residents a place to swim, canoe,kayak, and fish. It is these types of areas that encouragethe physical stimulation of individuals and families as awhole, creating a healthier lifestyle for people of all ages.By encouraging children to be active outdoors at a youngage, a number of health-related issues can be minimizedor avoided all together. These include:• Childhood Obesity: In Canada, approximately 26% of children ages 2-17 are currentlyoverweight or obese (Childhood Obesity Foundation). Obesity can also lead to a numberof other diseases including Type-2 diabetes, hypertension, asthma, and cardiovasculardisease (NEEF).• Vitamin D Deficiency: The most common diseases resulting from a lack of Vitamin Dinclude rickets (children) and osteoporosis later in life (NEEF).• Myopia: One study found that 12 years olds who spent less time doing near-workactivities (reading, drawing, etc) and more time doing outdoor activities were two to threetimes less likely to develop myopia than those who spent the majority of their time doingnear-work activities (Rose et al., 2008).Within the <strong>Innisfil</strong> Creek subwatershed there are a number of parks and recreationalopportunities available including baseball diamonds, soccer pitches, swimming areas, playstructures, and walking trails. A full list of parks and trails is available athttp://www.town.innisfil.on.ca/Parks-and-Trails.The Town of <strong>Innisfil</strong> also has the Luck Conservation Area within its municipal boundaries (andwithin the <strong>Innisfil</strong> <strong>Creeks</strong> subwatershed boundaries). This is a 20 ha natural area with forest,streams and ponds, as well as being home to the Gilford Arboretum, managed by the Gilfordand District Horticultural Society. The society provides a network of walking trails, as well asinteresting specimen trees and plants.2.3.1.2.MentalIn addition to physical health benefits, there are a number of mental health benefits associatedwith natural areas. These areas, free of technology and the “jolts per minute” of contemporarylife, allow people to take in their surroundings, and benefit from the serene and calmingenvironment. Those who like to explore natural areas are mentally engaged to interact with thesurrounding flora and fauna and associate these visual ‘pictures’ with other senses, such asChapter 2: Study Area: The <strong>Innisfil</strong> <strong>Creeks</strong> <strong>Subwatershed</strong> 27
The <strong>Innisfil</strong> <strong>Creeks</strong> <strong>Subwatershed</strong> <strong>Plan</strong>touch, smell, and sound. Studies have also shown the effects of nature on the socialinteractions, emotional status, and cognitive growth of children. Many young children havegrown up watching television, playing on computers or with video games with very little ‘playtime’(unstructured, spontaneous activity) in their daily routine. Burdette and Whitaker (2005)suggest that through playing outdoors, a child’s social interactions, emotional status, and theircognitive growth are improved. In an unstructured, non-monotonous environment they will comeacross different situations that encourage them to problem solve, interact, and communicatewith others and learn from the different experiences they are exposed to. Studies also showinteractions with nature have positive impacts on those with attention-deficit/hyperactivitydisorder (ADHD). Something as simple as a 20 minute walk through park was found to increaseconcentration and elicit a positive emotional response (Faber and Kuo, 2008).It should also be noted that many individuals also have an important spiritual connection to theenvironment.2.3.1.3. Community Engagement and CohesivenessThe more people recognize the benefits that the green spaces in their city or town have on theirwell-being, the more they will work to maintain and protect these areas. Green spaces can bringa community together to perform maintenance and restoration work, create fun and interactiveenvironments, boost tourism (and in turn the local economy), and are places for communityevents, camps or public forums. By putting effort into caring for the green spaces and enjoyingthe benefits they gain from them, people form an attachment to these areas, as well as theircommunity as a whole.2.3.1.4. Economic BenefitsWhile the previous section highlighted the social and health benefits of urban natural areas,studies have also shown the monetary benefits of having tree lined streets and urban naturalareas.For example, the presence of mature trees in residential areas can increase the sale prices ofneighbouring properties by 2-15% (Wolf, 2007; Donovan and Butry, 2009), and decrease theamount of time such properties are on the market (Donovan and Butry, 2009). The presence oflarger natural areas nearby can increase property values by up to 32% (Wolf, 2007). Evenduring the initial development process, retaining mature trees on residential lots can increasetheir sale value by up to 7% (Theriault et al., 2002).In addition to increasing property values, natural areas in or near residential neighbourhoodscan act as a draw for white-collar workers working in high paying, creative jobs, who prefer tolive in an urban setting that encourages their ‘creativity’, through a stimulating, diverse, culturalsetting with easily accessible natural amenities for a healthy lifestyle. As a result, thepreservation of urban green space can attract new businesses with highly paid staff, andstrengthen the local economy (Florida, 2002).Commercial sectors can also benefit from an increase in urban tree cover. Studies have shownthat shoppers tend to spend more time, and make more purchases, in downtown commercialand retail districts that have more trees, creating income both for the city and for store owners(Wolf, 2005).Chapter 2: Study Area: The <strong>Innisfil</strong> <strong>Creeks</strong> <strong>Subwatershed</strong> 28
The <strong>Innisfil</strong> <strong>Creeks</strong> <strong>Subwatershed</strong> <strong>Plan</strong>2.3.2 Drinking Water Source ProtectionA major threat to human health is the degradation and depletion of freshwater resources.Degradation of water quality can either be anthropogenic or natural in nature. Humans canimpact their water through:• Poor sanitation habits (crude solid waste disposal methods, improper filtration methodsof waste water and drinking water);• Removal of riparian buffers, allowing unfiltered run off from streets, lawns, andagricultural fields to go directly into waterways;• Improper storage of chemicals that can spill in to surface water or leach into the groundto reach the deeper groundwater resources;• Warming of water temperatures (creates ideal temperatures for bacteria) by connectingrunoff systems to watercourses or creation of standing bodies of water that link to thewatercourse.Climate change can also impact water quality through changes in air temperature, precipitation,and extreme events by:• Releasing contaminants: extreme events and increases in precipitation may damagebuildings/containers holding contaminants, cause the overflow of retention areas holdingcontaminants, and/or wash surface contaminants into watercourses;• Transporting contaminants: extreme events can transport contaminants greaterdistances, potentially increasing the exposure to them;• Creating warmer environments: surface waters become more hospitable to pathogensand other waterborne disease.Poor water quality, either because of anthropogenic or natural conditions, can lead to anincrease in water-borne diseases, loss of fisheries, contaminated food sources, and closures ofbeaches due to high levels of the bacteria E. coli. Residents can be directly impacted throughsickness, increases in food costs (uncontaminated), or loss/decrease in income (loss offisheries, farms with unusable, contaminated produce).Depletion of available water is another major health concern. Low water quantity can result inwater restrictions that lead to lower agricultural produce yields, increasing the cost of food. Lesswater available to residents also means that there is less water available to naturalenvironments, leading to a loss of habitat.In 2006, the provincial government made a commitment to the citizens of Ontario by passing theClean Water Act (CWA). The CWA introduced a new level of protection – Source WaterProtection - for the Province’s drinking water resources that will help communities acrossOntario enjoy a safe and plentiful supply of clean drinking water for generations to come.Drinking Water Source Protection is the first step in a multi-barrier approach to protecting oursources of drinking water. It identifies possible threats to drinking water, assesses the risks ofthose threats, mitigates them and plans ahead to prevent contamination before it gets into thewater supply. It is a responsible and effective way of ensuring safe, clean drinking water andavoiding serious health issues.Chapter 2: Study Area: The <strong>Innisfil</strong> <strong>Creeks</strong> <strong>Subwatershed</strong> 29
The <strong>Innisfil</strong> <strong>Creeks</strong> <strong>Subwatershed</strong> <strong>Plan</strong>2.3.2.1.Drinking Water Systems and their Vulnerable AreasThe South Georgian Bay-<strong>Lake</strong> <strong>Simcoe</strong> (SGBLS) Source Protection <strong>Region</strong> (SPR) is one of 19in Ontario. It contains three Source Protection Areas (<strong>Lake</strong>s <strong>Simcoe</strong> and Couchiching-BlackRiver, Nottawasaga Valley, and Severn Sound) that are composed of four watersheds: <strong>Lake</strong>2<strong>Simcoe</strong> , Black-Severn River, Nottawasaga Valley, and Severn Sound watersheds.One of the key documents of the Source Protection program that has been completed for eachof the Source Protection Areas (and the watersheds within their borders) is the AssessmentReport. The SGBLS Source Protection Committee released three Assessment Reports inNovember 2011 that provides the following information for each area:• Characterization of the Source Protection Area watershed: this includes descriptions ofthe natural and human geography;• A Conceptual water budget for the entire Source Protection Area and a Tier 1 waterbudget for each subwatershed: those systems identified as having water quantity stressin the Tier 1 water budget progress to a more detailed Tier 2 water budget and Tier 3 ifneeded;• Broad scale assessment of <strong>Region</strong>al Groundwater Vulnerability: this aspect of theAssessment Report requires that both Highly Vulnerable Aquifers (HVA) and SignificantGroundwater Recharge Areas (SGRAs) be identified; and• Drinking water system assessment: for each drinking water system within the Terms ofReference, the Vulnerability of the supply wells or surface water intakes is assessed andany potentially Significant Threats to the water quality are identified.Within the whole SGBLS SPR there are 108 drinking water systems, with 31 in the <strong>Lake</strong> <strong>Simcoe</strong>watershed. There are three systems in the <strong>Innisfil</strong> <strong>Creeks</strong> subwatershed. Two of these aregroundwater supply systems (the Golf Haven and Goldcrest Well Supplies), while the other is asurface water intake (Alcona Water Treatment <strong>Plan</strong>t). Even though a large portion of the BarrieWater Treatment <strong>Plan</strong>t Intake Protection Zone (IPZ) is located along the northern shore of thesubwatershed, the IPZ-2 stretches down within the Lovers Creek subwatershed and hastherefore been accounted for in the Barrie <strong>Subwatershed</strong> <strong>Plan</strong>.Each of the drinking water systems in the <strong>Innisfil</strong> <strong>Creeks</strong> subwatershed have had theirvulnerable areas delineated. These vulnerable areas that are directly associated with drinkingwater systems are referred to as Wellhead Protection Areas (WHPAs) for groundwater systemsand Intake Protection Zones (IPZs) for surface water intakes:• A WHPA is the area around a wellhead where land use activities have the greatestpotential to affect the quality of water that flows into the well. Each WHPA is subdividedinto four time-of-travel zones that estimate the amount of time it would take acontaminant to reach the municipal welloooWHPA-A: 100 m radius.WHPA-B: 2 year time of travel (tot) capture zoneWHPA-C: 5 year tot capture zoneo WHPA-C1: 10 year tot capture zone (for WHPAs delineated before April 2005).2 Information for the <strong>Innisfil</strong> <strong>Creeks</strong> subwatershed can be found in the Approved <strong>Lake</strong>s <strong>Simcoe</strong> and Couchiching-Black River Source Protection Area Assessment Report, Part 1: <strong>Lake</strong> <strong>Simcoe</strong>. Chapter 10 of this Assessment Reportis specific to the Town of <strong>Innisfil</strong>.Chapter 2: Study Area: The <strong>Innisfil</strong> <strong>Creeks</strong> <strong>Subwatershed</strong> 30
The <strong>Innisfil</strong> <strong>Creeks</strong> <strong>Subwatershed</strong> <strong>Plan</strong>oWHPA-D: 25-year tot capture zone• Similarly, an IPZ is the area around a surface water intake and includes three time-oftravelzones.oooIPZ-1: 1000 m radiusIPZ-2: 2 hour time of travelIPZ-3: Area within the surface water body through which contaminants releasedduring an extreme event could be transported to the intake. For the intakesassociated with these (and <strong>Innisfil</strong> <strong>Creeks</strong>) subwatersheds this includes the entire<strong>Lake</strong> <strong>Simcoe</strong> watershed.Two additional vulnerable areas that were also delineated in the Assessment Reports areSignificant Groundwater Recharge Areas (SGRAs) and Highly Vulnerable Aquifers (HVAs).These vulnerable areas do not pertain directly to any particular drinking water system, butinstead are on a regional (landscape) scale:• SGRAs are areas where water enters an aquifer (underground reservoirs from which wedraw our water) through the ground. Recharge areas are significant when they supplymore water to an aquifer than the land around it. Significant Recharge Areas are animportant area on the landscape for ensuring a sufficient amount of water enters anaquifer. For example, paving over an SGRA would prevent water from getting into theground to recharge an aquifer, potentially decreasing the amount of water available.• HVAs are those areas where an aquifer may be more prone to contamination. Theseareas have been identified where there is little or no protection from an overlyingaquitard (a protective layer of low permeability materials). Generally, the faster water isable to flow through the ground to an aquifer, the more vulnerable the area is tocontamination. For example, a fuel spill would get into an aquifer much more quicklywhere a HVA has been identified than where one has not.Further information on these two regional scale Vulnerable Areas can be found in the SGBLSSPR Assessment Reports.Both the Town of <strong>Innisfil</strong> and City of Barrie have groundwater and surface water being used tosupply drinking water to their residents. With over 156,700 people (combined) relying on thesewater supplies as a source of safe drinking water it stresses the importance of maintainingand/or improving the quality (and quantity) of these supplies. When initiating, contributing,and/or participating in restoration efforts along streams draining into <strong>Lake</strong> <strong>Simcoe</strong>, or on thelake itself, it benefits not only the local wildlife and natural habitats, but also all those whodepend on the watershed and lake as a source of safe drinking water.For the Assessment Report, studies were done to assess the vulnerability, issues, and threatsfor each of the Wellhead Protection Areas and Intake Protection Zones. All three of the systemswithin the <strong>Innisfil</strong> <strong>Creeks</strong> subwatershed are located within the Town of <strong>Innisfil</strong> and consist of theAlcona Water Treatment <strong>Plan</strong>t, Golf Haven Well Supply, and Goldcrest Well Supply.The Alcona Water Treatment <strong>Plan</strong>t is a surface water intake located on the eastern shore of thesubwatershed at the inlet to Cook’s Bay. This system had a total of five significant drinkingwater threats identified in association with one land parcel. The significant threats identified areall associated with the municipal sewage treatment plant within the IPZ-1 (SGBLS-SPC, 2011).The Golf Haven Well Supply has two wells located in the south east area of the <strong>Innisfil</strong> <strong>Creeks</strong>subwatershed. A total of 21 significant drinking water threats were identified in association withChapter 2: Study Area: The <strong>Innisfil</strong> <strong>Creeks</strong> <strong>Subwatershed</strong> 31
The <strong>Innisfil</strong> <strong>Creeks</strong> <strong>Subwatershed</strong> <strong>Plan</strong>20 land parcels. These significant threats were mainly related to individual sewage systems(SGBLS-SPC, 2011).Finally, the Goldcrest Well Supply has two wells located in the south western part of the <strong>Innisfil</strong><strong>Creeks</strong> subwatershed and had a total of 19 significant drinking water threats identified inassociation with 15 land parcels. The significant threats reflect a variety of land uses, fromresidential to agriculture to commercial (SGBLS-SPC, 2011).The final document the Source Protection Committee is responsible for is creating a SourceProtection <strong>Plan</strong> that will be effective in mitigating all existing significant threats and preventingnew ones from arising on the landscape. The process of creating this plan includes the SPCdeveloping policies to protect drinking water supplies. With input from local municipalities, theSPC has developed an evaluation criteria that ensures all policies will be specific, measureable,achievable, realistic, and time bound, or SMART for short. The Source Protection <strong>Plan</strong> isexpected to be completed in <strong>2012</strong>.Full results of these studies, showing the vulnerability scores and the enumeration of threats todrinking water can be found in the Approved <strong>Lake</strong>s <strong>Simcoe</strong> and Couchiching-Black RiverAssessment Report, Part 1: <strong>Lake</strong> <strong>Simcoe</strong>. The local vulnerable areas (Wellhead ProtectionAreas and Intake Protection Zones) for the drinking water systems located in each of the threesubwatersheds within this report are shown in Figure 2-10 (Note: The IPZ-3 is not included forthis figure).Chapter 2: Study Area: The <strong>Innisfil</strong> <strong>Creeks</strong> <strong>Subwatershed</strong> 32
RIDGE RD WKempenfelt BayVulnerable areas (WHPA/IPZ)located within the <strong>Innisfil</strong><strong>Creeks</strong> subwatershed.BarrieSW Intake<strong>Lake</strong><strong>Simcoe</strong>LegendFigure 2-10BARRIEBIG BAY PT RDRoadMunicipal BoundaryWatercourseSIDERD 25ESSA RD400 HWY NSIDERD 10LOCKHART RD10TH LINE9TH LINEINNISFIL BEACH RD7TH LINEYONGE ST<strong>Innisfil</strong><strong>Creeks</strong>AlconaSW IntakeMETRO RD NBASELINE RD<strong>Innisfil</strong> <strong>Creeks</strong><strong>Subwatershed</strong>IPZ-1 (1000m)IPZ-2 (2-hrs time of travel)WHPA-A (100m)WHPA-B (2-yrs tot)WHPA-C1 (10-yrs tot)WHPA-D (25-yrs tot)WARDEN AVEWOODBINE AVE6TH LINESIDERD 105TH LINESIDERD 5HWY 400 S4TH LINE3RD LINEGolf havenGEORGINAPOLLOCK RDINNISFIL2ND LINECOUNTY RD 8914TH LINELINE 13Cook'sBayGLENWOODS AVEGoldcrest 0 0.5 1 2 3 4 5RAVENSHOE RDKilometresKThis product was produced by the <strong>Lake</strong> <strong>Simcoe</strong> <strong>Region</strong> Conservation Authority andsome information depicted on this map may have been compiled from various sources.While every effort has been made to accurately depict the information,data / mapping errors may exist.This map has been produced for illustrative purposes only.LSRCA GIS Services DRAFT created July 2010.© LAKE SIMCOE REGION CONSERVATION AUTHORITY, 2010. All Rights ReservedThe following datasets roads, municipal boundaries and Oak Ridges Moraine are© Queens Printer for Ontario, 2010. Reproduced with Permission
The <strong>Innisfil</strong> <strong>Creeks</strong> <strong>Subwatershed</strong> <strong>Plan</strong>2.3.3 Ecological Goods and Services.In addition to the direct benefits to human health provided by public natural areas and cleandrinking water, the environment also provides a range of other, less tangible, benefits, oftentermed ‘ecological goods and services’. These benefits include the storage of floodwaters bywetlands, water capture and filtration by forests, the absorption of air pollution by trees, andclimate regulation.Forests, wetlands, and rivers that make up watersheds are essentially giant utilities providingecosystem services for local communities as well as the regional and global processes that weall benefit from. Ecosystems provide many services including carbon storage and sequestration,water storage, rainfall generation, climate buffering, biodiversity, soil stabilization, and more(Global Canopy Programme. http://www.globalcanopy.org/main.php?m=3).These benefits are dependent on ecosystem functions, which are the processes, or attributes,that maintain the ecosystems and the species that live within them. Humans are reliant on thecapacity of natural processes and systems to provide for human and wildlife needs (De Groot,2002). These include products received from ecosystems (e.g. food, fibre, clean air and water),benefits derived from processes (e.g. nutrient cycling, water purification, climate regulation), andnon-material benefits (e.g. recreation and aesthetic benefits) (Millennium EcosystemAssessment, 2003).In 2008, the <strong>Lake</strong> <strong>Simcoe</strong> <strong>Region</strong> Conservation Authority partnered with the David SuzukiFoundation and the Greenbelt Foundation to determine the value (natural capital) of theecosystem goods and services provided by the natural heritage features in the watershed in thereport: <strong>Lake</strong> <strong>Simcoe</strong> Basin’s Natural Capital: The Value of the Watershed’s Ecosystem Services(Wilson, 2008). By identifying and quantifying ecosystem services within a watershed,environmental resources can be directed towards areas that are currently of high value or areasthat have the potential to be of high value.2.3.3.1. Valuing EcosystemsThere have been several techniques developed to estimate economic values for non-marketecosystem services. The method used for the 2008 study uses avoided cost (i.e. damagesavoided) and replacement cost (cost to replace that service) for ecosystem service valuation, aswell as contingent valuations or willingness-to-pay studies for cultural values. Some of thevalues were derived using direct analysis and some values were adapted from other studies.Table 2-6 summarizes the value of the various ecosystem services by land cover type in the<strong>Innisfil</strong> <strong>Creeks</strong> subwatershed, as well as for the whole <strong>Lake</strong> <strong>Simcoe</strong> watershed. All ecosystemservice values have been updated to 2010 Canadian dollars.The estimated values provided are likely a conservative estimate because our knowledge of allthe benefits provided by nature is incomplete, and because these values are likely non-linear innature (i.e. the value of natural capital and its services will increase over time, as natural areasbecome more scarce, and demands for services such as clean water or mitigation of climatechange become greater). It is also important to note that without the earth’s ecosystems andresources, life would not be possible, so essentially the true value of nature is priceless. Thevaluations of ecosystem services, however, provide an opportunity to quantitatively assess thecurrent benefits and the potential costs of human impact.Chapter 2: Study Area: The <strong>Innisfil</strong> <strong>Creeks</strong> <strong>Subwatershed</strong> 34
The <strong>Innisfil</strong> <strong>Creeks</strong> <strong>Subwatershed</strong> <strong>Plan</strong>Table 2-5: Summary of non-market ecosystem service values by land cover type (2010 values).Land Cover TypeTotal <strong>Innisfil</strong> <strong>Creeks</strong>subwatershed value($million/yr)Total <strong>Lake</strong> <strong>Simcoe</strong> basinvalue($million/yr)Cropland 2.32 54.52Forest 8.93 207.93Forest/ Wetlands* 15.95 466.64Wetlands 3.34 176.12Grasslands 0.54 22.49Hedgerows/ CulturalWoodland0.19 6.31Pasture 1.24 41.80Urban Parks 0.17 3.18Water** 0.01 1.54Total 32.70 980.53* This includes treed swamps.** This does not include the value of <strong>Lake</strong> <strong>Simcoe</strong>As has been demonstrated, the natural systems of the <strong>Innisfil</strong> <strong>Creeks</strong> subwatershed provide anumber of goods and services. These so-called “free” ecosystem services have, in fact,significant value. The analysis in the 2008 report provided a first approximation of the value ofthe non-market services provided – totalling annually (in 2010 values) for the <strong>Lake</strong> <strong>Simcoe</strong>watershed $980 million and at least $32.7 million for the <strong>Innisfil</strong> <strong>Creeks</strong> subwatershed. The mosthighly valued natural assets are the forests and treed swamps. For the <strong>Lake</strong> <strong>Simcoe</strong> watershedthese were calculated to be worth $208 and $467 million per year, respectively. These valuesfor <strong>Innisfil</strong> <strong>Creeks</strong> were $8.9 million and $5.9 million.The high value for forests reflects the many important services they provide, such as waterfiltration, carbon storage, habitat for pollinators, and recreation. Treed swamps and wetlandsprovide high value because of their importance for water filtration, flood control, wastetreatment, recreation, and wildlife habitat.It is important to note that while the value of <strong>Lake</strong> <strong>Simcoe</strong> is not included in the watershed total,it is of considerable value to all surrounding natural and human communities within the <strong>Lake</strong><strong>Simcoe</strong> watershed. It is the focal point of many waterfront communities (such as the City ofBarrie and Town of <strong>Innisfil</strong>), provides a vast number of recreational opportunities for both localsand tourists alike, is a source of drinking water for seven municipal surface water intakes,supports a substantial fishery, and as well as being a significant natural heritage feature, itprovides people with beautiful scenery. As such, the preservation of the lake and the rest of thenatural heritage features within the watershed results in a significant cost savings in municipalinfrastructure that would otherwise be needed to service watershed residents and users.Chapter 2: Study Area: The <strong>Innisfil</strong> <strong>Creeks</strong> <strong>Subwatershed</strong> 35
The <strong>Innisfil</strong> <strong>Creeks</strong> <strong>Subwatershed</strong> <strong>Plan</strong>2.4 Geology and Physical GeographyThe geology, topography and other physical features of a subwatershed provide the foundationfor the subwatershed’s hydrological and ecological processes, as they have a strong influenceon factors such as local climate patterns, types of land cover, land use practices, and surfacewater and groundwater flow paths.2.4.1 GeologyThere have been a number of studies that have lead to the geologic understanding in the <strong>Innisfil</strong>area. A generalized description of the bedrock geology, quaternary geology, and conceptualstratigraphic units within the <strong>Innisfil</strong> <strong>Creeks</strong> subwatershed is provided. For more detailedinformation the reader is referred to: Johnson et al., 1992; Barnett, 1992; and Armstrong andCarter, 2006.2.4.1.1.Bedrock GeologyThe bedrock can be characterized as being from the Paleozoic Era, consisting primarily oflimestone of the Middle Ordovician <strong>Simcoe</strong> Group. The <strong>Simcoe</strong> Group overlies the Precambrian‘basement’ rock units that comprise the Canadian Shield and outcrop (present at surface) northof the <strong>Lake</strong> <strong>Simcoe</strong> watershed. The <strong>Simcoe</strong> Group has been overlain by a sequence ofsediments that have been deposited over the last 135,000 years by glacial, fluvial, andlacustrine environments.The Middle Ordovician-aged carbonates and shales of the <strong>Simcoe</strong> Group were deposited in agradually deepening shelf system in a shallow subtropical sea approximately 460 million yearsago (Brookfield and Brett, 1988). The <strong>Simcoe</strong> Group consists of four formations that dip gentlytoward the southwest: Gull River Formation, Bobcaygeon Formation, Verulam Formation, andthe Lindsay Formation from oldest to youngest. However, only the Verulam and LindsayFormations are found within the subwatershed boundary.Verulam FormationThe oldest Paleozoic rocks underlying the subwatershed are those of the Verulam Formation.The formation occurs along the shoreline of Kempenfelt and Cook’s Bay. The formation is amember of the <strong>Simcoe</strong> Group (which is represented as [blue] on Figure 2-11). The formationranges in thickness from 32 to 65 m and consists of fossiliferous limestone with inter-beds ofcalcareous shale. The depositional environment of Verulam Formation was open marine shelf(Thurston et al., 1992).Lindsay FormationThe Lindsay Formation overlays the Verulam Formation and extends up from the south towardKempenfelt Bay, underlying most of the western portions of the subwatershed. The formation isrepresented as (blue) on Figure 2-11. The Lindsay Formation tends to be less than 67 m thickand is richly fossiliferous, which indicates that the depositional environment was a shallow todeep marine environment (Thurston et al., 1992).Chapter 2: Study Area: The <strong>Innisfil</strong> <strong>Creeks</strong> <strong>Subwatershed</strong> 36
RIDGE RD WKempenfelt Bay<strong>Lake</strong><strong>Simcoe</strong>Bedrock geology in the<strong>Innisfil</strong> <strong>Creeks</strong>subwatershed.Figure 2-11LegendBARRIEBIG BAY PT RDRoadMunicipal BoundaryWatercourseSIDERD 25400 HWY NLOCKHART RD51a Ottawa Group;ESSA RD10TH LINE<strong>Simcoe</strong> Group;Shadow <strong>Lake</strong> Fm.YONGE STSIDERD 109TH LINEINNISFIL BEACH RD7TH LINE<strong>Innisfil</strong><strong>Creeks</strong>METRO RD NBASELINE RDWARDEN AVEWOODBINE AVE6TH LINESIDERD 105TH LINESIDERD 54TH LINEGEORGINAPOLLOCK RDHWY 400 S3RD LINEINNISFIL2ND LINECOUNTY RD 8914TH LINELINE 13Cook'sBayGLENWOODS AVERAVENSHOE RD0 0.5 1 2 3 4 5KilometresKThis product was produced by the <strong>Lake</strong> <strong>Simcoe</strong> <strong>Region</strong> Conservation Authority andsome information depicted on this map may have been compiled from various sources.While every effort has been made to accurately depict the information,data / mapping errors may exist.This map has been produced for illustrative purposes only.LSRCA GIS Services DRAFT created July 2010.© LAKE SIMCOE REGION CONSERVATION AUTHORITY, 2010. All Rights ReservedThe following datasets roads, municipal boundaries and Oak Ridges Moraine are© Queens Printer for Ontario, 2010. Reproduced with Permission
The <strong>Innisfil</strong> <strong>Creeks</strong> <strong>Subwatershed</strong> <strong>Plan</strong>2.4.1.2.Bedrock TopographyThe bedrock surface of the subwatersheds has a general elevation range of 115 to 179 mASL(Figure 2-12). The bedrock surface is thought to have been the result of a long period of nondepositionand/or erosion activity that occurred between the deposition of the sedimentarybedrock and the overlying sediments.The topographic lows are associated with significant valleys that have been eroded into thebedrock surface. These valleys are believed to be a result of fluvial activity prior to glaciation,approximation 440 to 2 million years ago with additional modification by glacial processes overthe last 2 million years (Earthfx and Gerber, 2008).A major bedrock valley known as the Laurentian bedrock channel traverses through the southwesternportion of the <strong>Lake</strong> <strong>Simcoe</strong> watershed, in the neighbouring subwatersheds. Recentinterest has been generated over the Laurentian Channel (also referred to as the LaurentianValley), a proposed Tertiary-aged river network that extended from Georgian Bay to <strong>Lake</strong>Ontario (Brennan et al., 1998; Sharpe et al., 2004). This interest has been driven primarily bythe attempt to locate additional sources of potable water as increasing population continues toplace additional stress on existing groundwater supplies. This valley identifies an ancientdrainage system that extended from Georgian Bay to Toronto.Chapter 2: Study Area: The <strong>Innisfil</strong> <strong>Creeks</strong> <strong>Subwatershed</strong> 38
RIDGE RD WKempenfelt BayBedrock topography inthe <strong>Innisfil</strong> <strong>Creeks</strong>subwatershed.<strong>Lake</strong><strong>Simcoe</strong>LegendFigure 2-12BARRIEBIG BAY PT RDRoadMunicipal BoundaryWatercourseSIDERD 25400 HWY NESSA RDSIDERD 10LOCKHART RD10TH LINE9TH LINEINNISFIL BEACH RDSIDERD 107TH LINE6TH LINEYONGE ST<strong>Innisfil</strong><strong>Creeks</strong>METRO RD NBASELINE RDWARDEN AVEBedrockTop Elv (m)172WOODBINE AVE5TH LINESIDERD 54TH LINEGEORGINAPOLLOCK RDHWY 400 S3RD LINEINNISFIL2ND LINECOUNTY RD 8914TH LINELINE 13Cook'sBayGLENWOODS AVERAVENSHOE RD0 0.5 1 2 3 4 5KilometresKThis product was produced by the <strong>Lake</strong> <strong>Simcoe</strong> <strong>Region</strong> Conservation Authority andsome information depicted on this map may have been compiled from various sources.While every effort has been made to accurately depict the information,data / mapping errors may exist.This map has been produced for illustrative purposes only.LSRCA GIS Services DRAFT created July 2010.© LAKE SIMCOE REGION CONSERVATION AUTHORITY, 2010. All Rights ReservedThe following datasets roads, municipal boundaries and Oak Ridges Moraine are© Queens Printer for Ontario, 2010. Reproduced with Permission
The <strong>Innisfil</strong> <strong>Creeks</strong> <strong>Subwatershed</strong> <strong>Plan</strong>2.4.1.3.Glacial HistoryQuaternary GeologyThe bedrock within the <strong>Innisfil</strong> <strong>Creeks</strong> subwatershed is overlain by unconsolidated sediments,known as the overburden, which were deposited during the Quaternary Period. The QuaternaryPeriod can be further divided into the Pleistocene (Great Ice Age) and the Holocene (Recent)Epochs. During the Pleistocene, at least four major continental-scale glaciations occurred,which include, from youngest to oldest, the Wisconsinan, Illionian, Kansan, and NebraskanStages (Dreimanis and Karrow, 1972). All of the surficial deposits within the subwatershed, andwithin most of southern Ontario, are interpreted to have been deposited within thesubwatershed, and within most of southern Ontario are interpreted to have been deposited bythe Laurentide Ice Sheet during the Wisconsinan glaciations. The Laurentide Ice Sheet is theglacier that occupied most of Canada during the Late Wisconsinan period, approximately20,000 years ago (Barnett, 1992).Sediments deposited during the Late Wisconsinan substage are extensive in southern Ontarioand are thought to represent all of the surficial deposits in the subwatersheds. All of the depositswhich outcrop at surface within the subwatersheds were likely laid down within the last 15,000years during and after the Port Bruce Stade. Deep boreholes indicated that older Wisconsinandeposits do occur at depth; however, it is not always possible to date them (Dreimanis andKarrow, 1972). These deposits are often quarried by the aggregate industry for use ininfrastructure building. The quaternary deposits are depicted on Figure 2-13.Quaternary Sediment ThicknessWithin the subwatershed the Quaternary sediment thickness is the difference between theground surface and the bedrock surface. The thickness of the Quaternary sediments has beendetermined from borehole and water well information within the subwatershed. Figure 2-14shows the thickness ranges from approximately 39 to 186 m. The Paleozoic bedrocktopography appears to strongly influence the overlying Quaternary sediment thickness anddistribution. The thicker Quaternary sediments occur in bedrock topographical lows (i.e. withinbedrock valleys), while the thinnest areas of Quaternary deposits occur at the north end of thesubwatershed, south of Cook’s Bay.Chapter 2: Study Area: The <strong>Innisfil</strong> <strong>Creeks</strong> <strong>Subwatershed</strong> 40
RIDGE RD WKempenfelt Bay<strong>Lake</strong><strong>Simcoe</strong>Surficial geology in the<strong>Innisfil</strong> <strong>Creeks</strong>subwatershed.Figure 2-13LegendBARRIEBIG BAY PT RDRoadMunicipal BoundaryWatercourseESSA RDSIDERD 5SIDERD 10LOCKHART RD10TH LINE9TH LINEINNISFIL BEACH RDSIDERD 107TH LINE6TH LINEYONGE ST5TH LINE4TH LINESIDERD 25<strong>Innisfil</strong><strong>Creeks</strong>METRO RD NWARDEN AVEWOODBINE AVEBASELINE RDGEORGINAPOLLOCK RD43 drumlin! beachbluffÙ Ù icsloperiblterrace1: Precambrian bedrock5b: Stone-poor, carbonate-derivedsilty to sandy till5d: Glaciolacustrine-derivedsilty to clayey till6: Ice-contact stratified deposits7: Glaciofluvial deposits8a: Massive-well laminated9b: Littoral-foreshore deposits9c: Foreshore-basinal deposits12: Older alluvial deposits19: Modern alluvial deposits20: Organic deposits!HWY 400 S400 HWY N3RD LINEINNISFIL2ND LINECOUNTY RD 8914TH LINELINE 13Cook'sBayGLENWOODS AVERAVENSHOE RD0 0.5 1 2 3 4 5KilometresKThis product was produced by the <strong>Lake</strong> <strong>Simcoe</strong> <strong>Region</strong> Conservation Authority andsome information depicted on this map may have been compiled from various sources.While every effort has been made to accurately depict the information,data / mapping errors may exist.This map has been produced for illustrative purposes only.LSRCA GIS Services DRAFT created July 2010.© LAKE SIMCOE REGION CONSERVATION AUTHORITY, 2010. All Rights ReservedThe following datasets roads, municipal boundaries and Oak Ridges Moraine are© Queens Printer for Ontario, 2010. Reproduced with Permission
RIDGE RD WKempenfelt Bay<strong>Lake</strong><strong>Simcoe</strong>Overburden thicknessin the <strong>Innisfil</strong> <strong>Creeks</strong>subwatershed.Figure 2-14LegendBARRIEBIG BAY PT RDRoadMunicipal BoundaryWatercourse400 HWY NESSA RDSIDERD 10LOCKHART RD10TH LINE9TH LINEINNISFIL BEACH RDSIDERD 107TH LINE6TH LINEYONGE STSIDERD 25<strong>Innisfil</strong><strong>Creeks</strong>METRO RD NBASELINE RDWARDEN AVEOverberdenThickness (m)505560657075808590951001051101151<strong>2012</strong>5130135140145150155160165170175180185190200220240WOODBINE AVE5TH LINESIDERD 54TH LINEGEORGINAPOLLOCK RDHWY 400 S3RD LINEINNISFIL2ND LINECOUNTY RD 8914TH LINELINE 13Cook'sBayGLENWOODS AVERAVENSHOE RD0 0.5 1 2 3 4 5KilometresKThis product was produced by the <strong>Lake</strong> <strong>Simcoe</strong> <strong>Region</strong> Conservation Authority andsome information depicted on this map may have been compiled from various sources.While every effort has been made to accurately depict the information,data / mapping errors may exist.This map has been produced for illustrative purposes only.LSRCA GIS Services DRAFT created July 2010.© LAKE SIMCOE REGION CONSERVATION AUTHORITY, 2010. All Rights ReservedThe following datasets roads, municipal boundaries and Oak Ridges Moraine are© Queens Printer for Ontario, 2010. Reproduced with Permission
The <strong>Innisfil</strong> <strong>Creeks</strong> <strong>Subwatershed</strong> <strong>Plan</strong>2.4.1.4.HydrostratigraphyThe geology of the subwatershed significantly influences the local hydrogeology, which is thestudy of groundwater. Hydrogeologists study the geologic formations to understand how muchwater infiltrates into the subsurface, where it flows, how quickly it flows, and where it re-entersthe surface water system. Changes in groundwater quantity and quality have potential impactson natural functions that could affect the surface water flow regime, aquatic ecosystems, anduse of the resource as a viable water supply.Hydrostratigraphy is the spatial mapping of geologic formations based on their water bearingproperties. The hydrostratigraphy of the surficial deposits within the subwatershed is complex asa result of the glacial history. There are a number of ongoing initiatives to understand the localhydrostratigraphic framework of the Southern <strong>Simcoe</strong> County and Barrie area. The followingsubsections provide a brief overview of relevant and previously completed stratigraphic studies.The stratigraphic framework of Quaternary glacial and non-glacial sediments, as shown inFigure 2-15, was completed by AquaResource et al., 2011 for the City of Barrie Tier 3 WaterBudget and Risk Assessment, which encompasses a large portion of the <strong>Innisfil</strong> <strong>Creeks</strong>subwatershed. The conceptual model builds upon previous models built for the South <strong>Simcoe</strong>Groundwater Studies (Golder, 2004). Four regional aquifers have been defined throughoutstudy area. An aquifer is an underground saturated permeable geological formation that iscapable of transmitting water in sufficient quantities under ordinary hydraulic gradients to serveas a source of groundwater supply. Aquifers are typically composed of coarse grained materialssuch as sands and gravels. The aquifers are named A1 through A4, from top to bottom. Despitethe continuity of the hydrostratigraphic framework, it is important to note that pinchouts, lenses,and windows do occur within any given unit (AquaResource et al., 2011). A description of theinterpreted regional hydrostratigraphic framework is provided below. The discussion of thelayers is focused on the areas where the data exists. Key features for the <strong>Innisfil</strong> <strong>Creeks</strong>subwatershed will be pointed out where known.Figure 2-15: Generalized conceptual stratigraphy of upland complexes, lowland tunnel channelcomplexes and the Oro Moraine (AquaResource et al., 2011).Chapter 2: Study Area: The <strong>Innisfil</strong> <strong>Creeks</strong> <strong>Subwatershed</strong> 43
The <strong>Innisfil</strong> <strong>Creeks</strong> <strong>Subwatershed</strong> <strong>Plan</strong>The nine conceptual model layers (from youngest to oldest) are:1. Upper Confining Layer2. Aquifer 1 (A1)3. Confining Layer 1 (C1)4. Aquifer 2 (A2)5. Confining Layer 2 (C2)6. Aquifer 3 (A3)7. Confining Layer 3 (C3)8. Aquifer 4 (A4)9. Top of BedrockUpper Confining Layer (UC)The upper confining layer or aquitard has been mapped as coarse-grained lacustrine depositswhich are part of a regionally extensive sand plain extending west from the shoreline of Cook’sBay. An aquitard is a confining bed and/or formation composed of rock or sediment that retardsbut does not prevent the flow of water to or from an adjacent aquifer. It does not readily yieldwater to wells or springs, but stores groundwater.Aquifer 1 (A1)The A1 aquifer is commonly associated with the upland areas. Overall, the aquifer can bedescribed as being composed of fine to medium grained sand with occasional occurrences ofgravel. Detailed logging of this unit in the northwest part of Barrie (Dixon hydrogeology , 2001)indicates that the upper aquifer consists of a number of coarsening upward sequences oflacustrine sand with only minor occurrences of silt (AquaResource et al, 2011).Confining Layer 1 (C1)The C1 layer has been cored within the City of Barrie and is described as varved clay and silt.The C1 layer is noted as thin to non-existent in some areas (typically west of Barrie towardAngus) (AquaResource et al., 2011).Aquifer 2 (A2)The A2 aquifer is found in the elevation range of approximately 175 to 230 mASL within thelowland areas but the stratigraphic equivalent extends up to approximately 250 mASL to thenortheast, under the Oro Moraine. The aquifer can generally be described as being composedof sand, with some clast rich portions. The aquifer is interpreted to extend under KempenfeltBay and to the north (towards Midhurst). The lower elevation of the aquifer in the vicinity ofKempenfelt Bay corresponds with the deeper channelized aquifer and suggests that it mayrepresent in-filled former river channels in this area. The A2 aquifer ranges in thickness fromapproximately 10 to 30 m in most areas. It is regionally extensive, but does pinch out in someareas. The eastern part of the A2 aquifer is interpreted to be in direct contact with KempenfeltChapter 2: Study Area: The <strong>Innisfil</strong> <strong>Creeks</strong> <strong>Subwatershed</strong> 44
The <strong>Innisfil</strong> <strong>Creeks</strong> <strong>Subwatershed</strong> <strong>Plan</strong>Bay, based on the base elevation of the bay and the interpreted aquifer extents near its shores(AquaResources et al., 2011).Confining Layer 2 (C2)The C2 layer has been described as a silty sand to sandy silt, stone-rich diamicton(AquaResource & Golder, 2009).Aquifer 3 (A3)The A3 aquifer is commonly referred to as the lower aquifer and is the primary groundwatersupply source for the Town of <strong>Innisfil</strong> drinking water. The aquifer is composed of extensivecoarse grained sand and gravel, which readily transmits the flow of water. The A2 aquifer isinterpreted to be in contact with the A3 aquifer in some locations. The elevation of the A3aquifer ranges from 150 to 195 mASL, and ranges in thickness from 10 to 40 m. North of <strong>Innisfil</strong>,the aquifer is interpreted to be in direct contact with the A4 aquifer in the City of Barrie core, atthe location of the interpreted tunnel channel (AquaResource et al., 2011).Confining Layer 3 (C3)Confining Layer 3 is thin to absent in some areas. Where present the layer is composed of finegrainedsilts and clays (AquaResource & Golder, 2009).Aquifer 4 (A4)The A4 aquifer is typically found at elevations below 150 mASL in areas of depressed bedrockelevation. The aquifer is reported to consist of fine to medium grained sand with minor graveldeposits in some areas. The aquifer is thin to absent in some areas, and is often limited to areasof depressed bedrock elevation. In the Golf Haven area the aquifer is removed from bedrockdepressions the aquifer is very thin and composed of fine grained sand and silt, and is underlainby till (AquaResource & Golder, 2009).Top of BedrockThe Middle-aged Ordovician aged carbonates of the <strong>Simcoe</strong> group (discussed above) are indirect contact with the bottom of the A4 aquifer.2.4.2 Physiography, Topography, and Soils2.4.2.1. PhysiographyPhysiography is the study of the physical structure of the surface of the land. A physiographicregion is an area with similar geologic structure and climate, and which has a unifiedgeomorphic history (DRAFT GRIPS, 2008). The study of physiography is important from a waterresource perspective as the knowledge gained from knowing the land composition aidshydrogeologists and hydrologists in understanding the groundwater and surface water flowsystems. The physiography of an area is also important from an agricultural perspective as thesediments and landforms present at the surface influence the types of crops that can easily begrown.Chapter 2: Study Area: The <strong>Innisfil</strong> <strong>Creeks</strong> <strong>Subwatershed</strong> 45
The <strong>Innisfil</strong> <strong>Creeks</strong> <strong>Subwatershed</strong> <strong>Plan</strong>The physiographic regions within the <strong>Innisfil</strong> <strong>Creeks</strong> subwatershed are a direct result of thedeposition and erosion of the quaternary sediments (overburden) during glacial and post-glacialevents, and closely correspond to the topography discussed in the following section. Accordingto Chapman and Putnam (1984), two physiographic regions are found within thesubwatersheds: <strong>Simcoe</strong> Lowlands and the Peterborough Drumlin Field (Figure 2-16).<strong>Simcoe</strong> LowlandsThe <strong>Simcoe</strong> Lowlands is the physiographic region that comprises narrow stretches of land alongthe shores of Kempenfelt and Cook’s Bay within the subwatershed. The region is described ashaving lower elevations, with flat-floored valley features that generally correspond to currentriver systems (Sharpe et al., 1999). The lowlands were flooded by glacial <strong>Lake</strong> Algonquin andas a result are floored by sand, silt, and clay (Chapman and Putnam, 1984).Peterborough Drumlin FieldDrumlin is a Celtic word meaning little hill. Drumlins are typically oval shaped hills with smoothconvex contours. In areas where drumlins are pointing in the same direction, the direction ofmovement of a glacier during the last ice age can be determined (Chapman and Putnam, 1984).The Peterborough Drumlin Field extends south of Kempenfelt Bay down to the Oak RidgesMoraine, encompassing the majority of the subwatershed. The physiographic region is typicallycharacterized by numerous drumlins that are on average oriented 60° west of south or 240°azimuth and rise up from the surrounding Newmarket Till plain. On average, drumlins are 20-75m in width and 100-450 m in length. Internally, drumlins are composed of a stone-rich, slightlysilty to silty fine to medium grained sand till.2.4.2.2. TopographyThe topography of the subwatershed closely corresponds to the physiographic regions thatcomprise the subwatersheds. The topographic features of the <strong>Innisfil</strong> <strong>Creeks</strong> subwatershed arerelated to the present-day stream network, as well as their geological history, includingsignificant glacial events. The ground surface topography within the subwatersheds ranges from306 metres above mean sea level (mASL) in the <strong>Innisfil</strong> Heights area to 216 mASL along theshores of Kempenfelt and Cook’s Bay (Figure 2-17).2.4.2.3. SoilsThe soils present within the subwatershed influence the type and productivity of the vegetationcommunities commonly found growing within the subwatersheds. Soils also influence the qualityand quantity of water entering the ground and running along the surface. Traditionally, soilswithin the subwatershed have been characterized based on the coarseness of their texture.Coarse textured soils (gravel and sand) allow water to infiltrate better than finer-textured soils(clay, silty loam) do. The texture of the soil is important because it directly influences thelandscape’s ability to generate runoff. For example, during a heavy thunderstorm, rainfall thatcannot infiltrate the ground will pool on the surface. Once enough water has collected it will startflowing overland as a result of gravity and in so doing can erode soil particles, washing theminto ditches, streams and lakes. Figure 2-18 depicts the spatial distribution of the soil typespresent throughout the subwatersheds.Chapter 2: Study Area: The <strong>Innisfil</strong> <strong>Creeks</strong> <strong>Subwatershed</strong> 46
RIDGE RD WKempenfelt BayGround surfacetopography in the <strong>Innisfil</strong><strong>Creeks</strong> subwatershed.<strong>Lake</strong><strong>Simcoe</strong>LegendFigure 2-17BARRIEBIG BAY PT RDRoadMunicipal BoundaryWatercourseSIDERD 25400 HWY NESSA RDSIDERD 5SIDERD 10LOCKHART RD10TH LINE9TH LINEINNISFIL BEACH RDSIDERD 107TH LINE6TH LINEYONGE ST5TH LINE4TH LINE<strong>Innisfil</strong><strong>Creeks</strong>METRO RD NWARDEN AVEWOODBINE AVEBASELINE RDGEORGINAPOLLOCK RDGround SurfaceElevation (m)100 - 1<strong>2012</strong>0 - 140140 - 160160 - 170170 - 180180 - 190190 - 200200 - 210210 - 220220 - 230230 - 240240 - 250250 - 260260 - 270270 - 280280 - 290290 - 300300 - 310310 - 320320 - 330330 - 340340 - 360360 - 380380 - 400400 - 420420 - 440440 - 460460 - 480480 - 500500 - 520520 - 540540 - 560HWY 400 S3RD LINEINNISFIL2ND LINECOUNTY RD 8914TH LINELINE 13Cook'sBayGLENWOODS AVERAVENSHOE RD0 0.5 1 2 3 4 5KilometresKThis product was produced by the <strong>Lake</strong> <strong>Simcoe</strong> <strong>Region</strong> Conservation Authority andsome information depicted on this map may have been compiled from various sources.While every effort has been made to accurately depict the information,data / mapping errors may exist.This map has been produced for illustrative purposes only.LSRCA GIS Services DRAFT created July 2010.© LAKE SIMCOE REGION CONSERVATION AUTHORITY, 2010. All Rights ReservedThe following datasets roads, municipal boundaries and Oak Ridges Moraine are© Queens Printer for Ontario, 2010. Reproduced with Permission
RIDGE RD WKempenfelt BaySoils in the <strong>Innisfil</strong><strong>Creeks</strong> subwatershed<strong>Lake</strong><strong>Simcoe</strong>LegendFigure 2-18BARRIEBIG BAY PT RDRoadMunicipal BoundaryWatercourseSIDERD 25400 HWY NLOCKHART RDSoil Hydro ClassESSA RD10TH LINE9TH LINEYONGE STA - high infiltration ratesB - moderate infiltration ratesC - slow infiltration ratesD - very slow infiltration ratesSIDERD 10SIDERD 5INNISFIL BEACH RDSIDERD 107TH LINE6TH LINE5TH LINE4TH LINE<strong>Innisfil</strong><strong>Creeks</strong>METRO RD NWARDEN AVEWOODBINE AVEBASELINE RDGEORGINAPOLLOCK RDSoil Texture ClassGRAVELLY SANDY LOAMSANDSANDY LOAMFINE SANDY LOAMLOAMLOAMY SANDSILTY LOAMSILTY CLAY LOAMORGANICHWY 400 S3RD LINEINNISFIL2ND LINECOUNTY RD 8914TH LINELINE 13Cook'sBayGLENWOODS AVERAVENSHOE RD0 0.5 1 2 3 4 5KilometresKThis product was produced by the <strong>Lake</strong> <strong>Simcoe</strong> <strong>Region</strong> Conservation Authority andsome information depicted on this map may have been compiled from various sources.While every effort has been made to accurately depict the information,data / mapping errors may exist.This map has been produced for illustrative purposes only.LSRCA GIS Services DRAFT created July 2010.© LAKE SIMCOE REGION CONSERVATION AUTHORITY, 2010. All Rights ReservedThe following datasets roads, municipal boundaries and Oak Ridges Moraine are© Queens Printer for Ontario, 2010. Reproduced with Permission
The <strong>Innisfil</strong> <strong>Creeks</strong> <strong>Subwatershed</strong> <strong>Plan</strong>2.5 Fluvial Geomorphology2.5.1 Introduction and backgroundFluvial geomorphology is the study of the processes that influence the shape and form ofstreams and rivers. It describes the processes whereby sediment and water are transportedfrom the headwaters of a watershed to its mouth. These processes govern and constantlychange the form of river and stream channels, and determine how stable the channels are.Fluvial geomorphology provides a means of identifying and studying these processes, which aredependent on climate, land use, topography, geology, vegetation, and other natural and humaninfluenced changes.An extensive understanding of geomorphic processes and their influences is required in order toprotect, enhance, and restore stream form in a watershed. Changes in land use, andurbanization in particular, can significantly impact the movement of both water and sediment,and can thus cause considerable changes to the geomorphic processes in the watershed.Changes to the morphology of stream channels, such as accelerated erosion, can impact theaquatic community, which has adapted to the natural conditions, and can also threaten humanlives, property, and infrastructure.2.5.2 Geomorphic ProcessesAll streams and river systems are constantly in a state of transition, influenced by the flow ofwater and the amount of sediment entering into the system, which in turn are influenced byclimate and geology. The amount of water delivered to the surface of a watercourse, as well ashow and when it arrives is influenced by climate. Typical patterns are high flow events duringthe spring freshet, and low flow conditions during the winter and summer months.The surficial geology of an area influences the path of water once it reaches the ground surface.The underlying geology establishes the volume and proportion of groundwater and surfacewater available to flow through a watershed through its effect on infiltration. Geology alsoshapes the amount and type of sediment that enters a watercourse, and the strength anderodibility of the surficial material through which the watercourse flows. A complex underlyinggeology and topography can result in considerable variation in channel character, as well assensitivity to potential impacts, within the same drainage system.Natural watercourses respond to continually changing conditions in flow and sediment supplywith adjustments in shape and channel position. These changes take place through theprocesses of erosion and deposition. This ability to continually change is an inherentcharacteristic of natural systems that allows the morphology of the channels to remain relativelyconstant. The state in which flow and sediment supply are balanced to achieve this stablechannel form is referred to as “dynamic equilibrium.” While in a state of dynamic equilibrium,channel morphology is stable but not static, since it makes gradual changes as sediment isdeposited and moved throughout the watercourse. For example, many natural watercoursescan be seen to “migrate” within their floodplain over time. This is due to the erosion of theoutsides of channel bends, but with corresponding deposition of material on the insides ofbends. This process maintains the balance between flow and sediment supply in the system.Riparian and aquatic biota are adapted to and depend on the habitats provided by a system indynamic equilibrium.Chapter 2: Study Area: The <strong>Innisfil</strong> <strong>Creeks</strong> <strong>Subwatershed</strong> 50
The <strong>Innisfil</strong> <strong>Creeks</strong> <strong>Subwatershed</strong> <strong>Plan</strong>2.5.3 Current StatusSpecific fluvial geomorphology studies have not been completed for these subwatersheds, butsome other information was available through other studies. The information and data providedwithin this section has been collected by LSRCA staff completing studies on the condition of thefisheries in the subwatersheds. While a fisheries study is specific in nature, it also tends toprovide a “snap-shot” of the biological, chemical and physical characteristics of the system. Itshould also be noted that some sections of the watercourses in the subwatershed have beenmoved, piped, channelized, eliminated or manipulated in some fashion to varying degrees.While specific data on the exact location and the degree to which a stream has beenmanipulated is not currently available, it is fair to say that the alteration of the watercourses haschanged both the shape and functioning ability of them. Information on the impacts ofmanipulating watercourses is available in Chapter 5 - Aquatic Natural Heritage.2.5.3.1.Strahler Stream OrderStream order is a measure of the magnitude of a stream within a watershed and allows for thecomparison of rivers of different sizes or importance within or between systems (Dunne andLeopold, 1978). A first-order stream is an unbranched tributary that typically drains theheadwater portion of the watershed. When two or more first order streams converge thedownstream segment is classified as a second order stream. A third-order stream is thedownstream segment of the confluence of two or more second order streams, and so on. As theorder of a stream increases, the characteristics of the watercourse typically change. Largerorder streams are generally characterized by lesser elevation gradients, slower velocities, andan increased stream area to accommodate the flow from additional tributaries.Table 2-7 below presents the stream order and the total length of the creek within the <strong>Innisfil</strong><strong>Creeks</strong> subwatershed. To allow more detailed reporting, the <strong>Innisfil</strong> <strong>Creeks</strong> subwatershed hasbeen divided up into the individual creeks: Banks, Belle Aire, Bon Secours, Carson, Cedar,Gilford, Leonard’s, Mooselanka, Moyer, Sandy Cove, Strathallan, Sylvan Upper Marsh, WhiteBirch, and Wilson, as well as the smaller unnamed creeks (<strong>Innisfil</strong> <strong>Creeks</strong>, which include <strong>Innisfil</strong><strong>Creeks</strong> 1 and <strong>Innisfil</strong> <strong>Creeks</strong> 2) (see Figure 2-1 for location of the creeks).Table 2-6: <strong>Innisfil</strong> <strong>Creeks</strong> subwatershed stream order and stream length.Creek Stream OrderLength of Creek per % of Creek perOrder (m)Order1st 6,701 44Banks Creek (#5)2nd 4,936 323rd 3,611 24TOTALS 15,248 1001st 4,395 52Belle Aire Creek (#7)2nd 1,452 173rd 2,634 31TOTALS 8,481 1001st 1,221 26Bon Secours Creek (#4) 2nd 3,480 74TOTALS 4,701 1001st 3,591 28Carson Creek (#8)2nd 4,147 333rd 3,232 26Chapter 2: Study Area: The <strong>Innisfil</strong> <strong>Creeks</strong> <strong>Subwatershed</strong> 51
The <strong>Innisfil</strong> <strong>Creeks</strong> <strong>Subwatershed</strong> <strong>Plan</strong>CreekCedar Creek (#6)Gilford Creek<strong>Innisfil</strong> <strong>Creeks</strong>Leonard's Creek (#3)Mooselanka Creek (#2)Moyer CreekSandy Cove Creek (#1)Strathallan CreekSylvan CreekUpper Marsh CreekWhite Birch Creek (#10)Wilson Creek (#9)Stream OrderLength of Creek per % of Creek perOrder (m)Order4th 1,686 13TOTALS 12,655 1001st 657 442nd 823 56TOTALS 1,480 1001st 2,752 100TOTALS 2,752 1001st 6,465 832nd 1,334 17TOTALS 7,799 1001st 7,777 512nd 5,838 393rd 1,546 10TOTALS 15,160 1001st 2,837 442nd 765 123rd 2,880 44TOTALS 6,482 1001st 807 732nd 303 27TOTALS 1,110 1001st 10,828 472nd 6,891 303rd 1,746 84th 3,526 15TOTALS 22,991 1001st 2,055 932nd 159 7TOTALS 2,213 1001st 382 100TOTALS 382 1001st 1,162 352nd 2,145 65TOTALS 3,308 1001st 14,112 492nd 8,399 293rd 5,720 204th 461 2TOTALS 28,693 1001st 7,232 542nd 3,784 283rd 2,449 18TOTALS 13,465 100Chapter 2: Study Area: The <strong>Innisfil</strong> <strong>Creeks</strong> <strong>Subwatershed</strong> 52
The <strong>Innisfil</strong> <strong>Creeks</strong> <strong>Subwatershed</strong> <strong>Plan</strong>2.5.3.2.Drainage DensityDrainage density is a measure of how well a watershed is drained by its streams and iscalculated as the total length of all streams within a watershed divided by the total area of thewatershed. Typically, streams with high drainage densities are characterized by greater peakflows, high suspended and bed loads, and steep slopes (Dunne and Leopold, 1978). Theaverage drainage density of the <strong>Innisfil</strong> Creek subwatershed is more than 20% greater than theaverage <strong>Lake</strong> <strong>Simcoe</strong> watershed drainage density ( Table 2-8). This indicates potentially greaterrelief and increased erosion compared to other <strong>Lake</strong> <strong>Simcoe</strong> subwatersheds. The drainagedensities of the <strong>Innisfil</strong> <strong>Creeks</strong> are fairly homogenous with the exception of Strathallan Creekand Sylvan Creek. Strathallan Creek has a fairly small subwatershed and high local reliefresulting in very straight un-branched drainage. Sylvan Creek is a very small creek with asubwatershed area of only 0.056 km 2 , which makes measuring the stream length anddelineating the subwatershed boundary difficult using GIS.Table 2-7: <strong>Innisfil</strong> <strong>Creeks</strong> subwatershed stream length, watershed area and drainage density.CreekTotal StreamLength (km)Watershed Area(km 2 )Drainage Density(km/km 2 )Banks Creek (#5) 15.248 9.618 1.585Belle Aire Creek (#7) 8.481 5.076 1.671Bon Secours Creek (#4) 4.701 2.030 2.316Carson Creek (#8) 12.655 7.409 1.708Cedar Creek (#6) 1.480 1.850 0.800Gilford Creek 2.752 1.995 1.380<strong>Innisfil</strong> <strong>Creeks</strong> 7.799 4.504 1.732Leonards Creek (#3) 15.160 4.010 3.781Mooselanka Creek (#2) 6.482 2.404 2.697Moyer Creek 1.110 1.015 1.093Sandy Cove Creek (#1) 22.991 18.270 1.258Strathallan Creek 2.213 0.516 4.287Sylvan Creek 0.382 0.054 7.127Upper Marsh Creek 3.308 1.730 1.912White Birch Creek (#10) 28.693 12.972 2.212Wilson Creek (#9) 13.465 8.127 1.656<strong>Innisfil</strong> <strong>Creeks</strong>81.58 1.801146.92(at subwatershed level)***<strong>Simcoe</strong> Watershed2446.274 1.4633578.589Avg***The <strong>Lake</strong> <strong>Simcoe</strong> watershed average includes the subwatersheds of: Barrie <strong>Creeks</strong>, Beaver River,Black River, East Holland River, Georgina <strong>Creeks</strong>, Georgina Island, Hawkestone Creek, Hewitts Creek,Lovers Creek, Maskinonge River, Oro <strong>Creeks</strong> North, Oro Creek South, Pefferlaw/Uxbridge Brook,Ramara <strong>Creeks</strong>, West Holland River, and Whites Creek.Chapter 2: Study Area: The <strong>Innisfil</strong> <strong>Creeks</strong> <strong>Subwatershed</strong> 53
The <strong>Innisfil</strong> <strong>Creeks</strong> <strong>Subwatershed</strong> <strong>Plan</strong>2.5.3.3.Elevation along watercourseWhen there is a change in elevation, such as when water flows down from headwaters to baselevels, energy is produced. Where there is greater fall (steeper slope) energy is gained andwaters flow faster, picking up more sediment and having more force to erode banks. These canalso be areas of unique fishery habitats where water is flowing quickly over shallow bedrock(riffles and rapids) that are used by some fish species such as brook trout (Salvelinus fontinalis),walleye (Sander vitreus), and longnose dace (Rhinichthys cataractae), as spawning grounds.Depending on the fall, it can also create a barrier to some aquatic species that are unable toswim against the force of the flow. Where the elevation levels out, the energy dissipates,releasing sediment and creating a slower flowing stream. These different processes help to alterthe stream system over time. Stream profiles are shown below in relation to underlying surficialgeology and features (discussed in Section 2.4.2) and only represent the main branch.Figure 2-19 illustrates the stream profile of ten of the <strong>Innisfil</strong> <strong>Creeks</strong> starting from headwaterelevation (length = 0) down to <strong>Lake</strong> <strong>Simcoe</strong> (elevation = 220). Average gradient ranges from alow gradient (0.50% gradient for Sandy Cove) to a relatively steep medium gradient (1.04% forUpper Marsh and Wilson <strong>Creeks</strong>). The rest fall somewhere in between those values: Banks(0.72%), Belle Aire (1.01%), Bon Secours (0.96%), Cedar (0.51%), Leonard’s (0.89%),Mooselanka (0.82%), and White Birch (0.84%). Overall the streams in the subwatershed havesimilar gradients, with a few that have steeper sections and others that are levelled out in areas.The stream length does vary across the watershed (see Table 2-8 for lengths of each).Figure 2-19: <strong>Innisfil</strong> <strong>Creeks</strong> subwatershed stream profiles.2.5.3.4.Bank StabilityThe stability of the stream bank depends on the strength of erosive forces against the bank andthe stream bank’s ability to minimize the impacts. Erosion is a natural process that occurs in allstream systems, but its effects can be exacerbated by changes (both natural andanthropogenic) to the system. Precipitation events can rapidly increase flows and in turnChapter 2: Study Area: The <strong>Innisfil</strong> <strong>Creeks</strong> <strong>Subwatershed</strong> 54
The <strong>Innisfil</strong> <strong>Creeks</strong> <strong>Subwatershed</strong> <strong>Plan</strong>increase the rate of erosion. As the force of the water and the sediments increases, the streambank’s resistance decreases and scouring occurs. Visible signs of this include eroded sectionsnear river bends and undercut banks. If banks are already unstable, excessive undercutting canlead to slumping where large portions of stream bank can collapse.Unstable sites are those that typically have:• Removal of riparian vegetation, whose roots create a network of tiny soil anchors andslow overland flow;• Replacement of large, deep-rooted vegetation with impervious surfaces (i.e. in urbanareas), which cause an increase in the volume and velocity of overland water flow; and• Removal of in-stream debris which can provide a means of slowing water anddecreasing the force at which it interacts with the stream bank.Figure 2-20 illustrates the percentage of stream bank along White Birch, Sandy Cove, BelleAire, Leonard’s, and Wilson <strong>Creeks</strong> that are unstable, moderate or stable.White Birch Creek has five sites that range from theheadwaters of one of the branches (WBC-E) to thesite closest to the mouth at Cook’s Bay (WBC-A).Sites WBC-A, -B, and -C are located close togetherand all have a similar, high amount of stable streambank and a smaller portion of unstable stream bank.These sites are close to golf courses. Sites WBC-Dand WBC-E are further upstream, on differentbranches, but both surrounded by rural land use andsmall amounts of natural heritage areas. Both ofthese sites have a larger percentage of unstablestream banks, with Site WBC-D having almost equalamounts stable and unstable, while the majority of Site WBC-E stream banks are unstable.Sandy Cove Creek also has five sites that are spread out from the mouth at <strong>Lake</strong> <strong>Simcoe</strong>(SANDY-A) to the headwaters of one of the branches (SANDY-E). With the exception of SiteSANDY-A, all sites have a high percentage of stable stream bank, located through a variety ofland uses.Belle Aire Creek has four sites, located mostly in the eastern half of the watercourse with SiteBELLE-A at the mouth and Site BELLE-D midway along the creek. All four sites have greaterthan 80% of stable stream bank and run through urban, rural, and natural heritage areas.Leonard’s Creek also has four sites spread along the whole creek. With the exception of SiteLEONARD-B, all of the sites have at least 50% unstable stream bank. Both LEONARD-A andLEONARD-C are located within urban areas, with LEONARD-B and LEONARD-D in naturalheritage areas that are surrounded by either urban or rural land use.Lastly, Wilson Creek has three sites located near the mouth, one midway down the main branchand the last (WILSON-C) midway down a tributary. Both Site WILSON-A and WILSON-C have ahigh percentage of stable stream bank, and are in natural heritage and rural areas. SiteWILSON-B has 60% unstable stream bank with smaller percentages of stable and moderatestream bank. This site is located in area with both natural heritage and aggregate land uses.It should be noted that these sites were randomly chosen, where possible, and provide ageneral representation of the stream bank conditions.Chapter 2: Study Area: The <strong>Innisfil</strong> <strong>Creeks</strong> <strong>Subwatershed</strong> 55
The <strong>Innisfil</strong> <strong>Creeks</strong> <strong>Subwatershed</strong> <strong>Plan</strong>Figure 2-20: Percentage of stream bank that is unstable, moderate, or stable for five creeks withinthe <strong>Innisfil</strong> <strong>Creeks</strong> subwatershed.Chapter 2: Study Area: The <strong>Innisfil</strong> <strong>Creeks</strong> <strong>Subwatershed</strong> 56
The <strong>Innisfil</strong> <strong>Creeks</strong> <strong>Subwatershed</strong> <strong>Plan</strong>2.6 Climate and climate change2.6.1 Current climate conditions and trendsThe <strong>Innisfil</strong> <strong>Creeks</strong> subwatershed lies within the <strong>Simcoe</strong> and Kawartha <strong>Lake</strong>s climatic region asdefined by Brown et al. (1980). The climate within the subwatershed and surrounding area ischaracterized by moderate winters, warm summers, and long growing seasons with usuallyreliable precipitation patterns. Variations in topography, prevailing winds, and proximity toGeorgian Bay and <strong>Lake</strong> <strong>Simcoe</strong> lead to local differences in climate across the subwatershed.Climate data collected from the Barrie WPCC station has been used to characterize the climatefor the <strong>Innisfil</strong> <strong>Creeks</strong> subwatershed and to support the water budget analysis that is discussedwithin Chapter 4 – Water Quantity.Table 2-8 displays a summary of the climate normals from 1971 to 2001 for the climate stationslocated within the City of Barrie and the surrounding municipalities (Figure 2-21). Based on thedata collected at the Barrie WPCC station, the average mean annual temperature is 6.7 °C,while the total mean annual precipitation is 921 mm/yr. It should be noted that precipitationpatterns have become less predictable in recent years, perhaps due to climate change.Long-term climate data was obtained from Environment Canada stations shown on Figure 2-21including daily maximum and minimum temperature, daily rainfall and snowfall, and hourlyrainfall for the period of 1950-2008. The data gaps were infilled using methods carried outaccording to the methodology outlined in “Filling gaps in meteorological data sets used for longtermwatershed modelling” (H.O Schroeter, D.K. Boyd, and H.R. Whitely) by Schroeter &Associates in 2009. The record period for the Barrie WPCC (6110218) after the data infillingexercise was from 1950-2008.Table 2-8: Summary of climate normals (1971-2001) for the City of Barrie and surrounding area(modified from AquaResource and Golder, 2010).Mean Annual TemperatureMean Annual Precipitation°CStation NameElevation(mASL)Avg. Min. Max.Rainfall(mm)Snowfall(cm)*Angus Camphill 212 6.2 0.4 12.1 636 215 851Barrie WPCC** 221 6.7 1.7 11.7 683 237 921Cookstown 244 6.3 1.1 11.4 657 161 818Essa Ont Hydro 216 6.6 1.5 11.8 670 213 884Midhurst 226 6.6 1.3 11.9 687 222 908* The water storage capacity of 1 cm of snow pack is equivalent to 1 mm of rainfallTotal(mm)Chapter 2: Study Area: The <strong>Innisfil</strong> <strong>Creeks</strong> <strong>Subwatershed</strong> 57
@ARIDGE RD WKempenfelt Bay<strong>Lake</strong><strong>Simcoe</strong>Location of climate stations inand around the <strong>Innisfil</strong> <strong>Creeks</strong>subwatershedsFigure 2-21B A R R I E400 HWY NBIG BAY PT RDLOCKHART RDSIDERD 25LegendClimate StationLSRCA StationNVCA Station@AEDRoadA RDSIDERD 1010TH LINE9TH LINEYONGE STMunicipal BoundaryWatercourseINNISFIL BEACH RD7TH LINE6TH LINEMETRO RD NBASELINE RDWARDEN AVEWOODBINE AVESIDERD 105TH LINESIDERD 5HWY 400 S4TH LINE3RD LINEG E O R G I N APOLLOCK RDEDI N N I S F I L2ND LINECOUNTY RD 8914TH LINELINE 13Cook'sBayGLENWOODS AVERAVENSHOE RD0 0.5 1 2 3 4 5KilometresKThis product was produced by the <strong>Lake</strong> <strong>Simcoe</strong> <strong>Region</strong> Conservation Authority andsome information depicted on this map may have been compiled from various sources.While every effort has been made to accurately depict the information,data / mapping errors may exist.This map has been produced for illustrative purposes only.LSRCA GIS Services DRAFT created June2011.© LAKE SIMCOE REGION CONSERVATION AUTHORITY, 2011. All Rights ReservedThe following datasets roads, municipal boundaries and Oak Ridges Moraine are© Queens Printer for Ontario, 2011. Reproduced with Permission
The <strong>Innisfil</strong> <strong>Creeks</strong> <strong>Subwatershed</strong> <strong>Plan</strong>2.6.1.1.TemperatureTo examine temperature trends for the past 60 years, the daily average air temperature wasaveraged for each year to produce Figure 2-22 to compare the average annual, averagemaximum annual, and average minimum annual air temperature. Figure 2-22 gives a generaloverview of the temperature trends at the Barrie WPCC meteorological monitoring station,illustrating how all appear to fluctuate in relatively the same manner over the years.Figure 2-22: Comparison of the average annual, maximum and minimum temperatures at theBarrie WPCC Meteorological Monitoring Station (1950-2008). Source: SGBLS, <strong>2012</strong>.Figure 2-23 displays only the average annual temperature, giving a closer look at the trend forthe period of record. From it we can see that there is a gradual increase over the entire period,with this trend becoming more pronounced after 1980. There is a slight decrease at thebeginning of the period of record from 1950 through the 1960s, followed by a plateau for thenext 20 years or so before starting to increase. Overall, there has been an increase of 0.87°Cover the past 60 years.It should be noted that this is only a broad assessment of temperature trends at the BarrieWPCC meteorological monitoring station.Chapter 2: Study Area: The <strong>Innisfil</strong> <strong>Creeks</strong> <strong>Subwatershed</strong> 59
The <strong>Innisfil</strong> <strong>Creeks</strong> <strong>Subwatershed</strong> <strong>Plan</strong>Figure 2-23: Average annual temperature at the Barrie WPCC Meteorological Monitoring Station(1950-2008). Source: SGBLS, <strong>2012</strong>.2.6.1.2. PrecipitationPrecipitation is the driving force of the hydrological cycle, influencing aquatic and wetlandhabitats, as well as urban storm water management needs.Figure 2-24 illustrates the spatial distribution of annual precipitation over the study area asaveraged over the study period and interpolated by the PRMS model (this model is described inChapter 4 – Water Quantity). These data also show that annual average precipitation is fairlyuniform across the three subwatersheds.The mean monthly precipitation measured at Barrie WPCC from 1971-2000 is shown in Figure2-25 and shows the amount that fell as rain and the amount that fell as snow in each month.Figure 2-26 illustrates the total annual precipitation from 1950 to 2008. Fluctuations in theamount of precipitation, particularly winter precipitation, are somewhat expected at the BarrieWPCC meteorological station due to its close proximity to <strong>Lake</strong> <strong>Simcoe</strong>, causing lake effectprecipitation events. Overall, there is no significant change in annual precipitation over the past60 years, but a possible tendency to increasing precipitation since the 1980s.Chapter 2: Study Area: The <strong>Innisfil</strong> <strong>Creeks</strong> <strong>Subwatershed</strong> 60
RIDGE RD WStrahallan CreekAnnual Precipitation (mm/yr) in the<strong>Innisfil</strong> <strong>Creeks</strong> subwatershed asdistributed by PRMSKempenfelt Bay<strong>Lake</strong><strong>Simcoe</strong>LegendFigure 2-24BARRIEBIG BAY PT RDSandy CoveCreekMooselankaCreekRoadMunicipal BoundaryWatercourseSIDERD 25ESSA RD400 HWY NSIDERD 5SIDERD 10LOCKHART RD10TH LINE9TH LINEINNISFIL BEACH RDSIDERD 107TH LINE6TH LINEYONGE ST5TH LINE4TH LINEBanksLeonard'sAlcona!Bon Secours<strong>Innisfil</strong><strong>Creeks</strong>Belle AireCarsonWilsonCreek!LefroyCreekCreekCreekCedarCreekCreekCreekMoyer CreekSylvan CreekMETRO RD NWARDEN AVEWOODBINE AVEBASELINE RDGEORGINAPOLLOCK RD<strong>Innisfil</strong> <strong>Creeks</strong><strong>Subwatershed</strong># Stream GaugesObserved Annual AveragePrecipitation (mm/yr)970 - 972973 - 974975 - 976977 - 978979 - 980HWY 400 S3RD LINEINNISFIL2ND LINECOUNTY RD 8914TH LINELINE 13White BirchCreekUpper MarshGilford!GilfordCreekCreekCook'sBayGLENWOODS AVERAVENSHOE RD0 0.5 1 2 3 4 5KilometresKThis product was produced by the <strong>Lake</strong> <strong>Simcoe</strong> <strong>Region</strong> Conservation Authority andsome information depicted on this map may have been compiled from various sources.While every effort has been made to accurately depict the information,data / mapping errors may exist.This map has been produced for illustrative purposes only.LSRCA GIS Services DRAFT TF created November 2011.© LAKE SIMCOE REGION CONSERVATION AUTHORITY, 2010. All Rights ReservedThe following datasets roads, municipal boundaries and Oak Ridges Moraine are© Queens Printer for Ontario, 2010. Reproduced with Permission
The <strong>Innisfil</strong> <strong>Creeks</strong> <strong>Subwatershed</strong> <strong>Plan</strong>Figure 2-25: Mean monthly precipitation as snowfall and rainfall for Barrie WPCC station(AquaResource et al., 2011).Figure 2-26: Total annual precipitation at the Barrie WPCC Meteorological Monitoring Station(1950 - 2008). Source: SGBLS, <strong>2012</strong>.Chapter 2: Study Area: The <strong>Innisfil</strong> <strong>Creeks</strong> <strong>Subwatershed</strong> 62
The <strong>Innisfil</strong> <strong>Creeks</strong> <strong>Subwatershed</strong> <strong>Plan</strong>2.6.1.3.Thermal Stability of <strong>Lake</strong> <strong>Simcoe</strong>The thermal stability of the lake is important as it can have significant impacts on the biologicalcommunities within the lake, which in turn can impact the lives of those who rely on the lake asa resource. The thermal stability of the lake refers to the amount of energy needed for a watercolumn to mix completely, overcoming the vertical density differences of thermal stratification. Ina system where there is low stability, the lake completely mixes, whereas in a system wherethere is high stability there is little to no mixing (remains stratified). In <strong>Lake</strong> <strong>Simcoe</strong>, which is adimictic lake, the water column is thermally stratified during the ice-free season, and mixes inthe spring and fall. Most winters, it completely freezes over.To determine if the thermal stability of <strong>Lake</strong> <strong>Simcoe</strong> was changing in relation to mean airtemperatures (collected at Environment Canada’s weather station at Shanty Bay), Stainsby etal. (2011) compared the water column stability of the lake at three locations (main basin,Kempenfelt Bay, and Cook’s Bay), andthe timing of stratification in the springand turnover in the fall occurred over anapproximate 30 year time period (1980-2008). As the <strong>Innisfil</strong> <strong>Creeks</strong>subwatershed has section of waterfrontalong parts of each of these areas,results for all three are included.Out of the three sampling areas,Kempenfelt Bay generally has higherthermal stability due to its deeper depths(max 42 m; mean 26 m), whereasCook’s Bay tends to have lower thermalstability because of its shallower depths(max 21 m; mean 8 m) andconsequently smaller volume of waterthat needs to mix or stratify (Stainsby etal., 2011).The first parameter studied was thetemperature of Kempenfelt Bay duringthe ice-free period of the year. Figure2-27 illustrates the temperature changesin Kempenfelt Bay from 1980 (a) and2002 (b) as well as the stability of thelake. From it we can see that, incomparison to the 1980 graph, in 2002there is a high degree of red (warmertemperatures during the ice-freeseason) and wider contours (the lakebegins to stratify earlier in the year andmixes later in the fall, increasing theoverall time the lake remains stratified), allof which correspond with the recordedhigher lake stability (white line) (Stainsbyet al., 2011).To further support these findings, FigureFigure 2-27: Seasonal water column temperaturecontour in degrees Celsius) and stability(white line) in Kempenfelt Bay in 1980 (a) and2002 (b). Red triangles show the samplingdates along the x-axis. Source: Stainsby et al.,2011.Chapter 2: Study Area: The <strong>Innisfil</strong> <strong>Creeks</strong> <strong>Subwatershed</strong> 63
The <strong>Innisfil</strong> <strong>Creeks</strong> <strong>Subwatershed</strong> <strong>Plan</strong>2-28 illustrates the timing of the onset of stratification in the Kempenfelt Bay (Figure 2-24a), themain basin (Figure 2-28b), and Cook’s Bay (Figure 2-28c). It can be seen from the data that thelake is stratifying earlier in the year. As of 2002, stratification is occurring approximately 20 daysearlier in Kempenfelt Bay (Figure 2-28a) than it was in 1980. In the main basin stratification isoccurring approximately 13 days earlier (Figure 2-34b), while in Cook’s Bay, stratification isoccurring approximately 25 days earlier (Figure 2-28c).Figure 2-28: The timing of the onset of stratification in (a) Kempenfelt Bay, (b) the main basin,and (c) Cook’s Bay. Source: Stainsby et al., 2011.When looking at the fall turnover, Figure 2-29 shows it to be occurring later and later each yearfor the different sections of the lake. Between 1980 and 2002, mixing of the water column in thefall is occurring approximately 15 days later in Kempenfelt Bay (Figure 2-29a). In the main basinof <strong>Lake</strong> <strong>Simcoe</strong>, fall turnover is occurring 18 days later (Figure 2-29b) and approximately 24days later in Cook’s Bay (Figure 2-29c).Chapter 2: Study Area: The <strong>Innisfil</strong> <strong>Creeks</strong> <strong>Subwatershed</strong> 64
The <strong>Innisfil</strong> <strong>Creeks</strong> <strong>Subwatershed</strong> <strong>Plan</strong>Figure 2-29: The timing of fall turnover in (a) Kempenfelt Bay, (b) the main basin, and (c)Cook’s Bay. Source: Stainsby et al., 2011.Together this means that the lake remains stratified for a longer period of time. A longerstratified period can result in an increase in oxygen depletion in the hypolimnion, which in thedeeper zones may create “dead zone” areas where conditions are anoxic. These conditions canalso potentially increase the release of nutrients (such as phosphorus) and contaminants fromsediments. The impacts of this can include large fish die-offs, decrease in the fisheries, algalblooms (which, when dead and decomposing at the bottom further decrease oxygen levels) andcan deteriorate drinking water (Kling, et al. 2003).The length of the stratification period in Kempenfelt Bay and in the main basin has increasedapproximately 33 days from 1980 to 2008 (Figure 2-30 a and b). In comparison, the changes inthe length of time the water column remains stratified were most significant in Cook’s Bay wherethe water column remains stratified 56 days longer (Figure 2-30c).Chapter 2: Study Area: The <strong>Innisfil</strong> <strong>Creeks</strong> <strong>Subwatershed</strong> 65
The <strong>Innisfil</strong> <strong>Creeks</strong> <strong>Subwatershed</strong> <strong>Plan</strong>Figure 2-30: The length of the stratified period in (a) Kempenfelt Bay, (b) the main basin, and (c)Cook’s Bay. Source: Stainsby et al., 2011.Many of the impacts already being observed in the <strong>Lake</strong> <strong>Simcoe</strong> watershed counteract much ofthe work the LSRCA and partner municipalities have done to increase dissolved oxygenconcentrations and decrease phosphorus levels in <strong>Lake</strong> <strong>Simcoe</strong>. To ensure that the effortstaken are successful, despite the impacts of climate change, projects undertaken on tributaries,particularly those that are managed as coldwater need to focus on reducing the temperatureand the amount of phosphorus input. This can include an increase in riparian habitat, improvedstormwater management, and improvement of construction practices and agricultural practices.Additionally, municipalities are encouraged to include climate change adaptation policies in theOfficial <strong>Plan</strong>s, to plan for the future and implement pre-emptive measures.Chapter 2: Study Area: The <strong>Innisfil</strong> <strong>Creeks</strong> <strong>Subwatershed</strong> 66
The <strong>Innisfil</strong> <strong>Creeks</strong> <strong>Subwatershed</strong> <strong>Plan</strong>2.6.2 Climate change and predicted scenariosClimate change can have numerous impacts on ecological systems and those who depend onthem. As mentioned in the previous section, an increase in air temperature can increase thethermal stability of the lake, extending the stratified period, as well as changing the compositionof biological communities and creating ideal growing conditions for algae and bacteria. Anincrease in temperature can also cause an increase in evaporation and evapotranspiration,decreasing the amount of water infiltrating into the ground and recharging the groundwatersystem. Changes in precipitation patterns will also impact the hydrologic cycle, whether thesechanges show less or more precipitation. Where less precipitation is falling, habitats willexperience drought, and be susceptible to fires (terrestrial) and reduction in area (watercoursesand wetlands), and less water will be available replenish aquifers. Where more precipitationfalls, it is likely that flows will be altered (potentially changing the stream morphology),stormwater retention areas may overflow (releasing contaminants), and there is an increasedrisk of flooding and property damage. Further impacts of climate change can be found in thefollowing chapters, where applicable, in the stressors section. An important part of addressingthese stressors is to gain an understanding of what the changes will be in the future and actaccordingly to minimize the impacts. Climate models, used worldwide, give us an estimate ofwhat these possible changes are.To obtain more accurate projections for parameters such as seasonal and annual temperatureand precipitation, an ensemble of climate models are typically run together. The report“Adapting to Climate Change in Ontario: Towards the Design and Implementation of a Strategyand Action <strong>Plan</strong>” was released by the Expert Panel on Climate Change in November 2009(EPCCA, 2009). The study included a review of climate change model projections for Ontario,completed by Environment Canada (CCCSN, 2009). The projections were based on acombination of 24 models and divides Ontario into 63 grid cells, one of which covers the <strong>Lake</strong><strong>Simcoe</strong> watershed. Three scenarios were produced based on future amount of greenhouse gas(GHG) emissions (Low, Medium and High).Table 2-9 lists the projected change in average annual and seasonal temperatures, comparing1961-1990 to the 2050s. From it we can see under high GHG emissions there is a projectedincrease in temperature of 3% for the area. All seasons are expected to see at least a 2.2%temperature increase; however the most significant increase is seen during the winter, wherethere is a projected increase of 2.5 -3.4% based on Low to High GHG emissions.Table 2-9: Summary of projected change in average annual temperature (°C) in the 2050scompared with 1961-1990 (CCCSN, 2009).Projected change in air temperature ( o C)GHG emmision scenarioSeason Low Medium HighAnnual 2.3 2.7 3.0Winter 2.5 3.0 3.4Spring 2.2 2.5 2.8Summer 2.2 2.6 2.9Autumn 2.3 2.6 2.8Table 2-10 lists the projected change in average annual and seasonal temperatures, comparing1961-1990 to 2050s.Under the high GHG emission scenario, annual precipitation is projected toincrease by 5.51%. All seasons are expected to increase by at least 3.06%, with the exceptionof summer precipitation. As the amount of GHG emissions increase, there is only a slightChapter 2: Study Area: The <strong>Innisfil</strong> <strong>Creeks</strong> <strong>Subwatershed</strong> 67
The <strong>Innisfil</strong> <strong>Creeks</strong> <strong>Subwatershed</strong> <strong>Plan</strong>increase predicted for the Low and Medium emission scenarios, and a decrease in the amountof precipitation of -0.62% under High GHG emission scenario.Table 2-10: Summary of projected change in precipitation (%) in 2050s compared with 1961-1990(CCCSN, 2009).Projected change in precipitation (%)GHG emmision scenarioSeason Low Medium HighAnnual 5.15 5.45 5.51Winter 9.38 10.19 10.76Spring 8.58 9.1 9.65Summer 0.92 0.11 -0.62Autumn 3.06 3.79 3.82Despite the use of a combination of multiple models, it is important to note that there is still avery high level of uncertainty associated with the projections. As scientists continue tounderstand the smaller interactions (i.e. what role clouds play in climate change) and are able tointegrate them into the models, this uncertainty will decrease.Chapter 2: Study Area: The <strong>Innisfil</strong> <strong>Creeks</strong> <strong>Subwatershed</strong> 68
The <strong>Innisfil</strong> <strong>Creeks</strong> <strong>Subwatershed</strong> <strong>Plan</strong>3 Water Quality– Surface and Groundwater3.1 Introduction and backgroundThe chemical, physical and microbiological characteristics of natural water make up anintegrated index we define as “water quality”. Water quality is a function of both naturalprocesses and anthropogenic impacts. For example, natural processes such as weathering ofminerals and various kinds of erosion are two actions that can affect the quality of groundwaterand surface water. There are also several types of anthropogenic influences, including pointsource and non-point sources of pollution. Point sources of pollution are direct inputs ofcontaminants to the surface water or groundwater system and include municipal and industrialwastewater discharges, ruptured underground storage tanks, and landfills. Non-point sourcesinclude, but are not exclusive to, agricultural drainage, urban runoff, land clearing, constructionactivity and land application of waste that typically travel to waterways through surface runoffand infiltration. Contaminants delivered by point and non-point sources can travel in suspensionand/or solution and are characterized by routine sampling of surface waters in the <strong>Lake</strong> <strong>Simcoe</strong>watershed.The <strong>Lake</strong> <strong>Simcoe</strong> Protection <strong>Plan</strong> (LSPP) identifies a number of targets and indicators related towater quality in <strong>Lake</strong> <strong>Simcoe</strong> and its tributaries, which include:• Reducing phosphorus loadings to achieve a target for dissolved oxygen of 7 mg/L in thelake (long-term goal currently estimated at 44 tonnes per year)• Reducing pathogen loading to eliminate beach closures• Reducing contaminants to levels that achieve Provincial Water Quality Objectives orbetterFor the most part, these targets are established to preserve the health of the <strong>Lake</strong>, rather thanits tributaries. As such, the LSPP has also provided indicators to evaluate progress in achievingthe water quality targets that can be evaluated in a subwatershed basis. These include:• Total phosphoruso Concentrationo Loading• Pathogenso Beach closures• Other water quality parameters, including:o Chlorideso Other nutrients (e.g. nitrogen)o Total suspended solidso Heavy metalso Organic chemicalsWhere information is available, current conditions andtrends are provided for the main water quality indicators,as identified by the LSPP.Chapter 3: Water Quality – Surface and Groundwater 69
The <strong>Innisfil</strong> <strong>Creeks</strong> <strong>Subwatershed</strong> <strong>Plan</strong>3.2 Current Status3.2.1 Measuring Groundwater QualityGroundwater quality sampling is typically conducted twice annually at all ProvincialGroundwater Monitoring Network (PGMN) wells located throughout the <strong>Lake</strong> <strong>Simcoe</strong>watershed. Each sample was routinely analyzed for 41 chemical parameters including metals,nutrients and general chemistry. One PGMN well located within the <strong>Innisfil</strong> <strong>Creeks</strong>,subwatershed was monitored from 2001 to 2010 (Figure 3-1).In addition, much work has been done through the Clean Water Act, 2006 Source ProtectionProgram. As a requirement of the Clean Water Act, 2006, Source Water Protection Authoritiesare required to determine the vulnerability of aquifers to water quality stressors and identifyingpotential threats to drinking water supply. Results of this vulnerability and threats assessmentare presented in the Approved <strong>Lake</strong> <strong>Simcoe</strong> and Couchiching-Black River Source ProtectionArea, Part 1: <strong>Lake</strong> <strong>Simcoe</strong> Assessment Report (SGBLS, 2011). This report discusses the threetypes of vulnerable areas associated with aquifers, these being: (1) Well Head Protection Areas(WHPA); (2) Significant Ground Water Recharge Areas (SGRA); and (3) Highly VulnerableAquifers (HVA).A WHPA is the area around a wellhead where land use activities have the greatest potential toaffect the quality of water that flows into the municipal supply well. Location of the WHPAswithin the <strong>Innisfil</strong> <strong>Creeks</strong> subwatershed can be found in Chapter 2 - Study Area.3.2.2 Measuring Surface Water Quality and Water Quality StandardsWater quality is currently sampled at one station on Leonards Creek under the LSPP (Figure3-1). Samples collected under the LSPP are collected year round, every three weeks in thewinter months (December to March) and every two weeks from April to November. Samples areanalyzed for 12 parameters by the Laboratory Services Branch of the Ministry of Environment,and are assessed using the Provincial Water Quality Objectives (PWQO) (Ministry ofEnvironment, 1994). As stated by the Ministry of Environment, the goal of the PWQO is toprotect and preserve aquatic life and to protect the recreational potential of surface waterswithin the province of Ontario. Meeting the PWQO is generally a minimum requirement, as onehas to take into account the effects of multiple guideline exceedances, overall ecosystemhealth, and the protection of site-specific uses. In instances where a chemical parameter is notincluded in the PWQO, the CanadianWater Quality Guidelines for the Protectionof Aquatic Life (CWQG) are applied(Environment Canada, 2003). The CWQGwere developed by the EnvironmentalQuality Branch of Environment Canada toprotect aquatic species by establishingacceptable levels for substances thataffect water quality and are based ontoxicity data for the most sensitive speciesfound in streams and lakes of Canada.Some of the water quality variables ofgreatest concern for the <strong>Innisfil</strong> <strong>Creeks</strong>subwatershed are summarized in Table3-1.Chapter 3: Water Quality – Surface and Groundwater 70
The <strong>Innisfil</strong> <strong>Creeks</strong> <strong>Subwatershed</strong> <strong>Plan</strong>Table 3-1: A summary of surface water quality variables and their potential effects and sourcesVariable Effects Sources Objective/GuidelineChlorideControl of excess chloride levels isimportant to protect the aestheticsand taste of drinking water. Highlevels may also have an impact onaquatic life. Backgroundconcentrations in natural surfacewaters are typically below 10 mg/L.The largest source ofchloride is from roadsalt applicationsduring the wintermonths. Othersources include wastewater treatment,industry, potash usedfor fertilizersCCME (draft June 2010):CWQG for protection offreshwater aquatic life is128 mg/L for chronic(long-term) exposure andthe benchmarkconcentration is 586 mg/Lfor acute (short-term)exposure.TotalPhosphorusPhosphorus promoteseutrophication of surface waters bystimulating nuisance algal andaquatic plant growth, which depleteoxygen levels as they decomposeresulting in adverse impacts toaquatic fauna and restrictions onrecreational use of waterways.Sources include lawnand garden fertilizers,animal wastes,eroded soil particlesand sanitary sewage.Interim PWQO: 0.03 mg/Lto prevent excessive plantgrowth in rivers andstreams.TotalSuspendedSolids (TSS)Elevated concentrations reducewater clarity which can inhibit theability of aquatic organisms to findfood. Suspended particles maycause abrasion on fish gills andinfluence the frequency and methodof dredging activities in harboursand reservoirs. As solids settle,coarse rock and gravel spawningand nursery areas become coatedwith fine particles, limiting theecological function of theseimportant areas. Many pollutantsare readily adsorbed andtransported by suspended solids,and may become available tobenthic fauna.TSS originates fromareas of soildisturbance, includingconstruction sites andfarm fields, lawns,gardens, erodingstream channels, andgrit accumulated onroadsCWQG: 25 mg/L +background (approx 5mg/L) for short term (
B A R R I EBIG BAY PT RDRIDGE RD WKempenfelt Bay<strong>Lake</strong><strong>Simcoe</strong>Water quality monitoring sitesin the<strong>Innisfil</strong> <strong>Creeks</strong> subwatershedLegendRoadFigure 3-1Municipal BoundaryRD400 HWY NSIDERD 10LOCKHART RD10TH LINE9TH LINEYONGE STLeonards CreekSIDERD 25!AEDED!AWatercourseHistoric Water Quality StationWater Quality Stations (LSPP)INNISFIL BEACH RD7TH LINE6TH LINE5TH LINEMETRO RD NBASELINE RDWOODBINE AVEWARDEN AVEEDSIDERD 10SIDERD 5HWY 400 S4TH LINE3RD LINEG E O R G I N APOLLOCK RDI N N I S F I L2ND LINECOUNTY RD 8914TH LINELINE 13Cook'sBayGLENWOODS AVERAVENSHOE RD0 0.5 1 2 3 4KilometresKThis product was produced by the <strong>Lake</strong> <strong>Simcoe</strong> <strong>Region</strong> Conservation Authority andsome information depicted on this map may have been compiled from various sources.While every effort has been made to accurately depict the information,data / mapping errors may exist.This map has been produced for illustrative purposes only.LSRCA GIS Services DRAFT created July 2010.© LAKE SIMCOE REGION CONSERVATION AUTHORITY, 2010. All Rights ReservedThe following datasets roads, municipal boundaries and Oak Ridges Moraine are© Queens Printer for Ontario, 2010. Reproduced with Permission
The <strong>Innisfil</strong> <strong>Creeks</strong> <strong>Subwatershed</strong> <strong>Plan</strong>3.2.2.1.Temperature CollectionThe MNR/DFO protocol (“A Simple Method to Determine the Thermal Stability of SouthernOntario Trout Streams” (Stoneman, C.L. and M.L. Jones 1996), Figure 5-1 in Chapter 5 -Aquatic Natural Heritage) suggests that trout streams are considered to be coldwater if theyhave an average maximum summer temperature of approximately 14°C. Cool water sites areconsidered to have average maximum summer temperatures of 18°C. Warm water sites havean average maximum daily water temperature of 23°C.To monitor these temperatures, electronic data loggers are installed throughout the <strong>Lake</strong><strong>Simcoe</strong> watershed during the hot summer months. They are installed in late May/early June andthen retrieved in late September/early October each year. The loggers are used to monitor thedaily fluctuations in water temperature of the watercourse over the summer. They are set to takea temperature reading every hour for the entire study period. Periodic checking of the loggersthroughout the summer is necessary for quality control purposes. Once the loggers are retrievedin early Fall from the various stream locations, the data is downloaded and then compared tothe air temperature data over the same period of time. Using an Excel spreadsheet, themaximum, minimum and mean temperatures for each day are graphed. There is someemphasis placed on the daily high temperatures and average maximum temperaturesspecifically in cold water stream conditions. The various streams can then be classified as cold,cool or warm (see Chapter 5 - Aquatic Natural Heritage, for figure displaying temperature ofcreeks). Daily minimum stream temperatures are used to observe stream recovery from periodsof extended warming and the influence of groundwater/baseflow in the individual system.The LSRCA has been collecting temperature data for approximately six years in the <strong>Innisfil</strong><strong>Creeks</strong> subwatershed (Note: data has been collected to characterize the watercourses, so forsome sites this means data has only been collected once, while others that are being monitoredfor long term trends are collected every year). While this has been sufficient for increasing ourunderstanding of where coldwater systems are found in the subwatershed, it is difficult at thispoint to see any trends or patterns in the data for most sites. There are factors influencing watertemperature in addition to upstream and surrounding land use, including air temperature and theamount of precipitation, which make it difficult to analyze trends in water temperature.3.2.2.2. Beach MonitoringPublic beaches in the Town of <strong>Innisfil</strong> are monitored every year, from June to the end of August,to ensure that the quality water (in terms of bacteria) is safe for swimmers. Typically, a there is aminimum of five sampling sites at each beach that are spread out to be representative of thewhole beach area. Samples are normally takenonce a week, but additional samples will betaken under certain conditions. Samples are sentto the Provincial Laboratory and analyzed forE.coli bacteria (key indicator of fecal pollution).Other parameters are not tested for unlessdeemed necessary. Additional data that isrecorded at the time of sampling include weatherconditions, whether there was rain in theprevious two days, wind direction, degree ofwave action, number of bathers, number of waterfowl and/or animals in the area and clarity of thewater (<strong>Simcoe</strong> Muskoka Health Unit, 2011).<strong>Innisfil</strong> Beach ParkChapter 3: Water Quality – Surface and Groundwater 73
The <strong>Innisfil</strong> <strong>Creeks</strong> <strong>Subwatershed</strong> <strong>Plan</strong>3.2.3 Groundwater Quality StatusWithin the <strong>Innisfil</strong> <strong>Creeks</strong> subwatershed, WHPAs have been delineated for the Golf Haven andGoldcrest Well Supplies. An assessment of potential Significant Threats was undertaken withineach WHPA, with potential threats associated with individual septic systems being the mostcommon threat identified for the Golf Haven Well Supply and a variety of land uses (residential,commercial, agricultural) for the Goldcrest Well Supply (SGBLS, 2011).For more in-depth information on the drinking water systems in this subwatershed, see theApproved <strong>Lake</strong>s <strong>Simcoe</strong> and Couchiching – Black River Source Protection Area, Part 1: <strong>Lake</strong><strong>Simcoe</strong> Watershed Assessment Report (SGBLS, 2011). Individual studies completed byconsultants on the water quality of the drinking water sources are available in the AssessmentReports Appendix I for the Town of <strong>Innisfil</strong>.3.2.4 Surface Water Quality StatusWater quality sampling at Leonard’s Creek has been ongoing since 2008 which unfortunately isnot long enough to examine the data for trends. While metals are not collected under LSPPsampling, an examination of chloride, phosphorus and TSS in Table 3-2 shows phosphorus tobe the main parameter of concern for Leonard’s Creek. The proportion of phosphorus samplesmeeting the PWQO is only slightly greater than 50%. The median concentration of the data setis 0.029 mg/L only slightly below the PWQO of 0.03 mg/L. A scatter plot of phosphorus data isdisplayed in Figure 3-2. Further sampling is necessary to better characterize the phosphorusconcentrations in the system due to the short period of record and also to capture the full rangeof flow conditions and seasonality. Table 3-2 also shows the vast majority chloride and TSSconcentrations and all nitrate concentrations are meeting the relevant guideline. As there isrelatively little urbanization in the catchment it is expected that chloride concentrations would belower, compared to other subwatersheds, and only one sample from the 2008-2010 period ofrecord has exceeded the CWQG of 128 mg/L. None of the samples exceeded the CWQG acutetoxicity guideline 1 of 586 mg/L.Table 3-2: Current surface water quality conditions for Leonard's Creek (2008-2010).Current Conditions (2008 – 2010)Percentage of samples that meet objectivesOrange = median Concentration >objectiveGreen = median Concentration < objectiveMonitoring StationChloridePhosphorusNitrateTSSLeonards Creek 99 55 100 94Objective 128 mg/L 0.03mg/L 2.9 mg/L 30 mg/L1 An estimate of the point at which severe effects to the aquatic ecosystem are likely to occur over a 24 to 96 hourexposure period.Chapter 3: Water Quality – Surface and Groundwater 74
The <strong>Innisfil</strong> <strong>Creeks</strong> <strong>Subwatershed</strong> <strong>Plan</strong>Figure 3-2: Leonard’s Creek phosphorus concentrations (mg/L), 2008-2010.With much of the <strong>Innisfil</strong> <strong>Creeks</strong> catchments supporting similar land use characteristics to theLeonard’s Creek catchment it is likely that the water quality issues are similar across much ofthe subwatershed. Indeed as the biologic data shows (Chapter 5 - Aquatic Natural Heritage)the majority of creeks received benthic invertebrate scores in the ‘good’ to ‘fairly poor’ rangewhich is primarily based on the degree of organic pollution. The Leonard’s Creek benthicinvertebrate score at the water quality station is ‘fair’, indicating fairly significant organicpollution, which is likely a reflection of the phosphorus concentrations recorded in the waterquality samples. As such it is reasonable to assume that the benthic scores in the other creeksare being driven by phosphorus concentrations and would be seeing concentrations andguideline exceedances in the range of those at Leonard’s Creek. Unless mitigation measuresare put in place, it is also likely that water quality issues within the systems will shift as a resultof the land use changes (i.e. as development replaces agriculture, metals may continue to riseand become a greater issue, while nitrate may see a decreasing trend and become less of anissue). Recommendations at the end of this chapter provide direction to avoid further decline inwater quality. For comparison, Table 3-3 displays current water quality trends for keyparameters at long term stations throughout the <strong>Lake</strong> <strong>Simcoe</strong> watershed.Chapter 3: Water Quality – Surface and Groundwater 75
The <strong>Innisfil</strong> <strong>Creeks</strong> <strong>Subwatershed</strong> <strong>Plan</strong>Table 3-3: Current water quality onditions in the <strong>Lake</strong> <strong>Simcoe</strong> watershedMonitoring Station Current Conditions (2006 – 2010)Percentage of samples that meetobjectivesOrange = median Concentration>objective Green = median Concentration< objectiveCurrent Condition TrendAnalysis (2002-2010) +Orange = IncreasingGrey = no significant trendGreen = DecreasingChloridePhosphorusNitrateTSSIronZincCopperChloridePhosphorusNitrateTSSIronZincCopperWest Holland River * 95 8 97 89 76 100 91Tannery Creek 60 9 100 66 34 94 89Mt. Albert Creek 100 14 100 74 56 100 94Beaver River*100 74 98 95 83 97 100Pefferlaw River* 100 53 100 97 89 97 97Lovers Creek*67 65 100 87 65 100 97Schomberg River 100 19 99 79 33 100 94Maskinonge River** 92 6 100 93 17 97 83 n/d n/d n/dEast Holland River* 33 3 100 44 3 89 71Black River* 98 36 100 99 80 100 100Hawkestone Creek* 99 83 100 97 89 100 97Uxbridge Brook 100 31 100 89 74 97 97Objective128mg/L0.03mg/L2.9mg/L30mg/L300μg/L20μg/L5μg/L* Chloride, Phosphorus and Nitrate Trends for this station = 2000 to 2010.** All trends for this station are 2003-2010Chapter 3: Water Quality – Surface and Groundwater 76
The <strong>Innisfil</strong> <strong>Creeks</strong> <strong>Subwatershed</strong> <strong>Plan</strong>3.2.2.3.Beach PostingsThe <strong>Simcoe</strong> Muskoka Health Unit (SMU) collects samples at each of the beaches in the City ofBarrie and Town of <strong>Innisfil</strong>, to test for E.Coli levels. Table 3-4 and Table 3-5 list each of thebeaches in the municipalities and indicate which years had an advisory or closure posted, andfor how many days.An advisory indicates that bacteria levels in the water are at a concentration that couldpotentially cause minor skin, eye, ear, nose, and throat infections and stomach disorders.Warning signs are posted at the beach and those who still choose to swim are advised to notput their head under water or swallow the water.A closure, which rarely occurs, happens when there is a catastrophic event or an immediate riskto health present. Examples that could cause a beach closure include sewage spills or toxicchemical release, etc.In the Town of <strong>Innisfil</strong>, there were no beach closures in the 2006-2011 period of record. Only Killarney Beach has had no advisorypostings, while each of the other seven beaches had had at leastone advisory posting, with Alcona North Beach having one(sometimes multiple) advisories every year except in 2007 and2011. Leonard’s Beach has also had at least one advisory postingevery year, except for 2009 and 2010 (Table 3-4).Table 3-4: List of beach postings in the Town of <strong>Innisfil</strong>, 2006-2011 (SMU, 2011).Beach Year Posting # of days9Th Line BeachAlcona North BeachAlcona South BeachAdvisory 92006Advisory 2Advisory n/a2007/2008/2009/2010/2011 -Advisory 92006Advisory 6Advisory n/a2007 -2008 Advisory 32009Advisory 3Advisory 3Advisory 22010Advisory 1Advisory 142011 -2006Advisory 2Advisory n/a2007 Advisory 22008 Advisory 32009 -2010 Advisory n/a2011 -Chapter 3: Water Quality – Surface and Groundwater 77
The <strong>Innisfil</strong> <strong>Creeks</strong> <strong>Subwatershed</strong> <strong>Plan</strong>Beach Year Posting # of daysCrescent Harbour Beach2006 -2007 Advisory 82008/2009/2010/2011 -Gilford Beach 2006/2007/2008/2009/2010/2011 -<strong>Innisfil</strong> Centennial Park2006 Advisory n/a2007/2008/2009/2010/2011 -Killarney Beach 2006/2007/2008/2009/2010/2011 -Leonard's BeachAdvisory 12006Advisory 1Advisory 72007 Advisory 82008 Advisory 12009/2010 -2011Advisory 15Advisory 8Since 2006, beaches in the City of Barrie have only been closed once. In August 2006 therewas major sewage spill, creating a large brown stain in the water. Beaches were immediatelyclosed as a precaution, but when the brown, murky water was tested, bacteria levels were nothigher than normal. Minets Point and Tyndale Beaches also experienced one advisory in thatyear. Since then, Minets Point Beach has had an advisory posting in 2009, 2010 and two in2011. Wilkins Beach had one advisory posting in 2011 (Table 3-5).Table 3-5: List of beach postings in the City of Barrie 2006-2011 (SMU, 2011).Beach Year Posting # of days postedBarrie Centennial Park2006 Closure 12007/2008/2009/2010/2011 -*Gables Beach 2006 Closure 1Johnsons Beach2006 Closure 12007/2008/2009/2010/2011 -2006Advisory 2Closure 12007/2008 -Minets Point Beach2009 Advisory 22010 Advisory 82011Advisory 7Advisory 2Advisory 32006Tyndale BeachClosure 12007/2008/2009/2010/2011 -Chapter 3: Water Quality – Surface and Groundwater 78
The <strong>Innisfil</strong> <strong>Creeks</strong> <strong>Subwatershed</strong> <strong>Plan</strong>Beach Year Posting # of days posted2006 Closure 1Wilkins Beach2007/2008/2009/2010 -2011 Advisory 2* In 2007, the <strong>Simcoe</strong> Muskoka Health Unit (SMU) removed Gables Beach from the beach watermonitoring program.Johnsons Beach – City of BarrieKey points – Current Water Quality Status:• Groundwater sampling at the one PGMN well from 2001 to 2010 showed noexceedances of guidelines for the 184 parameters analyzed.• Through the Source Protection Program, potential Significant Drinking Water Threatswere identified in association with individual septic systems for the Golf Haven WellSupply, and a variety of land uses (residential, commercial, agricultural) for theGoldcrest Well Supply.• Surface water is sampled at only one creek, Leonard’s, in the <strong>Innisfil</strong> <strong>Creeks</strong>subwatershed and only has data from 2008-2010, too short to establish trends.• While the majority of samples for all parameters (chloride, phosphorus, nitrate andTSS) where below the PWQO objectives, the proportion of phosphorus samplesmeeting this guideline were only slightly greater than 50%. As such, phosphorusappears to be the main parameter of concern for Leonard’s Creek, which is the onlywatercourse from which water quality samples are taken.• In 2011, there were two advisory postings at Leonard’s Beach, one at Wilkins and twoat Minets Point Beach. Beaches have not been closed in the Town of <strong>Innisfil</strong> during the2006-2011 period of record, and have only been closed once (2006) in the City ofBarrie, after a major sewage spill.Chapter 3: Water Quality – Surface and Groundwater 79
The <strong>Innisfil</strong> <strong>Creeks</strong> <strong>Subwatershed</strong> <strong>Plan</strong>3.3 Factors impacting status - stressorsThere are numerous factors that can have an effect on the water quality of the ground andsurface water within these subwatersheds. These include:• Phosphorus,• Chloride,• Sediment,• Thermal degradation,• Pesticides,• Metals,• Bacteria• Emerging contaminants,• Uncontrolled stormwater and impervious surfaces,• Recreation, and• Climate change.These factors are discussed further in the following sections.3.3.1 GroundwaterBecause groundwater moves more slowly and is subject to natural filtering as it moves throughthe soil, the quality of groundwater is most often better than that of surface water. As the watermoves through the soil, contaminants are subject to the processes of adsorption, where theyare bound to soil particles; precipitation; and degradation over time. These processes serve toimprove the quality of the water.There are some substances that can easily move through the groundwater system withoutattenuation by any of the aforementioned processes. The most notable of these is chloride fromroad salt. Further, if a contaminant source is located near a discharge area, there may not besufficient time and distance for natural filtering to occur. There are also some parameters,including iron and chloride, which are naturally found within some groundwater aquifers.Groundwater quality can also be impacted by anthropogenic factors. In rural areas, levels ofcontaminants including bacteria, phosphorus, nitrates, and road salt can become elevatedwhere the groundwater is beyond the capacity of the natural filtration capability of the soils.Sources of contaminants in these areas are fertilizers, improperly functioning septic systems,manure storage facilities, and road salt application. In urban areas, groundwater can be subjectto contamination by road salt, hydrocarbons, metals, solvents, bacteria, phosphorus, and othernutrients. Groundwater contamination becomes an issue where it is discharged to the surfaceand is used by animals or humans. As mentioned in Section 3.2.3, the Golf Haven andGoldcrest Well Supplies had no contaminants identified as Drinking Water Issues or Conditions,however possible Significant Threats were identified related to individual septic systems (GolfHaven) and a variety of land uses (Goldcrest).Chapter 3: Water Quality – Surface and Groundwater 80
The <strong>Innisfil</strong> <strong>Creeks</strong> <strong>Subwatershed</strong> <strong>Plan</strong>3.3.2 Surface Water3.3.2.1.PhosphorusOne of the most significant causes of water quality degradation in <strong>Lake</strong> <strong>Simcoe</strong> and itstributaries is an excess of phosphorus. Phosphorus promotes the eutrophication of surfacewaters by stimulating excessive growth of plants and algae. This impairs both the aquaticcommunities (the decomposition of this extra plant material depletes dissolved oxygen levels,particularly in the deeper parts of the lake where there is critical coldwater species habitat) andrecreational opportunities (restricts recreational use of waterways, washes up on beaches,creates a negative aesthetic view along the shoreline, etc).Phosphorus occurs naturally in the environment and is a vital nutrient needed by both plantsand animals. However, current land uses have increased the phosphorus loading to <strong>Lake</strong><strong>Simcoe</strong> from an estimated 32 T/yr (prior to settlement and land clearing in the 1800s) to acurrent estimated 72 T/yr (MOE, 2010). Rural and agricultural land uses make up the majority ofthe <strong>Innisfil</strong> <strong>Creeks</strong> subwatershed land area (48%). Both runoff from pastures and crop land, aswell as wind which erodes topsoil, contribute to the phosphorus loading in this subwatershed.Urban land use makes up only 15% of this subwatershed, but still contributes a considerableamount to the phosphorus loading through stormwater runoff (discussed further in Section3.3.2.9).Phosphorus load estimates were originally calculated in the Assimilative Capacity Studies,2006, but have since been updated by the original authors, the Louis Berger Group, in a reportcompleted in September, 2010, entitled ‘Estimation of the Phosphorus Loadings to <strong>Lake</strong><strong>Simcoe</strong>’. A watershed model (CANWET) that estimates nutrient loads based on inputs such asland use, precipitation and soil type was used for both the ACS and the updated study. Thefollowing table (Table 3-6) presents the average yearly phosphorus loads derived from eachsource in the subwatersheds under current conditions, the approved growth scenario, and theapproved growth scenario with implementation of agricultural BMPs. Urban BMPs are notconsidered in this particular study as the model used did not consider them, but the model iscurrently being updated and future versions of this <strong>Plan</strong> will include the amount of phosphorusthat can be reduced through urban BMPs. However, in Section 3.3.2.9 (Uncontrolled stormwaterand impervious surfaces), BMPs related to retrofit opportunities for stormwater ponds and theresulting phosphorus reduction are presented for the subwatershed.The primary sources of phosphorusin the <strong>Innisfil</strong> <strong>Creeks</strong> subwatershed,under existing conditions, arederived from septic systems (23%),crop land (22.8%) and high intensitydevelopment (21%). Under theapproved growth scenario, there is aprojected increase in totalphosphorus loads of 29% withoutthe implementation of agriculturalBMPs (does not consider urbanBMPs). The projected phosphorusload under the approved growthscenario can be reduced byapproximately 5.6% through theimplementation of BMPs (Table3-6). Taken together, this suggests that with agricultural BMP implementation under theChapter 3: Water Quality – Surface and Groundwater 81
The <strong>Innisfil</strong> <strong>Creeks</strong> <strong>Subwatershed</strong> <strong>Plan</strong>committed growth scenario, phosphorus loading will still increase by 21.8% compared to thecurrent estimated load if all committed growth plans are implemented. When compared to all thesubwatersheds in the <strong>Lake</strong> <strong>Simcoe</strong> watershed, <strong>Innisfil</strong> <strong>Creeks</strong> is the 6 th highest contributor oftotal phosphorus to the lake, based on current conditions. Under the committed growthscenario, it will still be the 6 th highest contributor (Berger, 2010a).Table 3-6: Phosphorus loads by source for the <strong>Innisfil</strong> <strong>Creeks</strong> subwatershed associated withagriculture BMP scenarios (Berger, 2010a).SourceExisting (kg/year)Committed GrowthScenario (kg/year)Change (ExistingCondition to CommittedGrowth)Committed Growth (withBMPs) (kg/year)Change (CommittedGrowth scenario withBMP implementation)% Change (with BMPimplementation)Hay/Pasture 67 63 -4 62 -1 -2%Crop Land 796 748 -48 519 -229 -31%Turf-Sod 10 8 -2 8 0 0Tile drainage 170 158 -12 158 0 0Low intensitydevelopment21 21 0 21 0 0High intensitydevelopment729 1,466 737 1,466 0 0Septics 816 816 0 816 0 0Polder 0 0 0 0 0 0Quarry 29 28 -1 28 0 0Unpaved road 20 20 0 20 0 0Transition 8 6 -2 6 0 0Forest 8 7 -1 7 0 0Wetland 0 0 0 0 0 0Stream bank 114 120 6 96 -24 -20%Groundwater(shallowsubsurface444 416 -28 416 0 0flow)Point sources 258 629 371 629 0 0TOTAL 3,490 4,504 1,014 4,250 -254 -6%- Based on Strategic Direction #3 in the Phosphorus Reduction Strategy, future development should bemoving to no net increase in phosphorus. Currently our understanding is that the province is working on aphosphorus reduction tool to ensure this.Chapter 3: Water Quality – Surface and Groundwater 82
The <strong>Innisfil</strong> <strong>Creeks</strong> <strong>Subwatershed</strong> <strong>Plan</strong>Figure 3-3: Percent phosphorus loads to <strong>Lake</strong> <strong>Simcoe</strong> per subwatershed under current conditions(data: Berger, 2010).Figure 3-4: Percent phosphorus loads to <strong>Lake</strong> <strong>Simcoe</strong> per subwatershed under committed growthscenario (data: Berger, 2010).Chapter 3: Water Quality – Surface and Groundwater 83
The <strong>Innisfil</strong> <strong>Creeks</strong> <strong>Subwatershed</strong> <strong>Plan</strong>Another way to look at the phosphorus loading of each subwatershed is the amount per yearper hectare. Figure 3-5 illustrates this, showing that <strong>Innisfil</strong> <strong>Creeks</strong> is the 6 th largest contributorper hectare to <strong>Lake</strong> <strong>Simcoe</strong>. While <strong>Innisfil</strong> <strong>Creeks</strong> has the same ranking as in Figure 3-3, thelarge difference is seen in the Barrie <strong>Creeks</strong> subwatershed, which becomes the highestcontributor per hectare, with almost three times Oro <strong>Creeks</strong> North which is the second highestcontributor per hectare in the <strong>Lake</strong> <strong>Simcoe</strong> watershed.Figure 3-5: Phosphorus loading (kg/yr) per hectare for each <strong>Lake</strong> <strong>Simcoe</strong> subwatershed (data:Berger, 2010).Additionally, the <strong>Innisfil</strong> <strong>Creeks</strong> subwatershed can be split up into 11 catchments, each namedby the tributaries they contain. The areas of the catchments range from 287.3 ha (<strong>Innisfil</strong> <strong>Creeks</strong>3) to 1,911.7 ha (Belle Aire/Carson Creek). As already mentioned, an overall potential reductionof 5.6% can be achieved through the implementation of agricultural BMPs. However, to achievethe basin wide total phosphorus target of 44 T/year, the CANWET watershed model alsoproduced targets for individual subwatersheds. These were further narrowed down to catchmentlevel targets to give a better idea of the priority areas for phosphorus reduction. Figure 3-6illustrates the total phosphorus loads per catchment, based on the agricultural BMP scenario,while Figure 3-7 illustrates the target total phosphorus loads for each catchment. The differencebetween the two is a further 71.1% reduction from the agricultural BMP scenario to the required(modelled) target loads.To prioritize areas for phosphorus reduction, each catchment area was assessed based on theamount of phosphorus that needs to be reduced to reach the target, and the associated unitcost ($/kg). For instance, a catchment which contributes relatively high phosphorus loads, butcan be reduced at a lower cost, is a higher priority than a catchment that contributes lowerphosphorus loads or has a higher unit cost. Berger (2010) prioritized all the catchments in the<strong>Lake</strong> <strong>Simcoe</strong> watershed, splitting them into four Tiers (Tier 1 being the highest priority, Tier 4the lowest) for each subwatershed. Table 3-7 lists each of the 11 catchments based on thisranking system.Chapter 3: Water Quality – Surface and Groundwater 84
The <strong>Innisfil</strong> <strong>Creeks</strong> <strong>Subwatershed</strong> <strong>Plan</strong>Table 3-7: Classification of catchments in prioritization tiers (Berger, 2010).Catchments*<strong>Subwatershed</strong>sTier 1(highest priority)Tier 2 Tier 3Tier 4(lowest priority)Banks Creek <strong>Innisfil</strong> <strong>Creeks</strong> 1 <strong>Innisfil</strong> <strong>Creeks</strong> 2<strong>Innisfil</strong> <strong>Creeks</strong><strong>Subwatershed</strong>Belle Aire/CarsonCreekMooselanka/Leonards/ BonSecours CreekSandy Cove CreekWhite Birch CreekWilson Creek<strong>Innisfil</strong> <strong>Creeks</strong> 3Strathallan CreekUpper MarshCreek* Catchments are illustrated in following figureChapter 3: Water Quality – Surface and Groundwater 85
The <strong>Innisfil</strong> <strong>Creeks</strong> <strong>Subwatershed</strong> <strong>Plan</strong>Figure 3-6: <strong>Innisfil</strong> <strong>Creeks</strong> subwatershed agricultural BMP scenario total phosphorus loads(Berger, 2010).Chapter 3: Water Quality – Surface and Groundwater 86
The <strong>Innisfil</strong> <strong>Creeks</strong> <strong>Subwatershed</strong> <strong>Plan</strong>Figure 3-7: <strong>Innisfil</strong> <strong>Creeks</strong> subwatershed target total phosphorus loads (Berger, 2010)Chapter 3: Water Quality – Surface and Groundwater 87
The <strong>Innisfil</strong> <strong>Creeks</strong> <strong>Subwatershed</strong> <strong>Plan</strong>3.3.2.2.ChlorideThe main source of chloride, in its various compounds, in the environment is from road salt(Environment Canada, 2001). It enters the environment through runoff from roadways as well asthrough losses from salt storage and snow disposal sites. Due to its high solubility, chloride veryeasily contaminates both surface and groundwater.High levels of chloride, such as those found in runoff water draining from roads and salt storageyards, can damage the roots and leaves of aquatic and terrestrial plants, and can also havebehavioural and toxicological impacts to animals. Continued exposure to high chloride levelscan cause a shift from sensitive communities to those more tolerant of degraded conditions(including a number of invasive species that are able to thrive).3.3.2.3. SedimentWhile a certain amount of sediment input is normal in a natural system, in larger amounts itbegins to cause a number of problems. Many contaminants, including phosphorus, bindthemselves to soil particles, and eroding soil acts as a vector for introducing these particulatesto an aquatic system. There are also impacts to aquatic biota, which are discussed in greaterdetail in Chapter 5 - Aquatic Natural Heritage.There are a number of sources of sediment in the <strong>Innisfil</strong> <strong>Creeks</strong> subwatershed:Development sites: these sites are often stripped of vegetationwell in advance of development in an effort to reduce costs asthe development is built in phases. These bare soils are thensubject to erosion by both wind and water. The proper installationof erosion controls can prevent some of the soil from reachingwatercourses, but need to be inspected and maintainedregularly.Agricultural areas: fields are particularly vulnerable to erosionwhenever they are bare (e.g. after tilling and in the spring prior to the establishment of crops).The flow of melt waters and precipitation over the fields during these periods can result in ahuge influx of sediment. In addition, some farmers may also remove treed windbreaks andriparian vegetation along watercourses flowing through theirproperties in order to maximize the cultivable land, both of whichhelp to prevent soil erosion. Practices such as conservationtillage and the use of cover crops, as well as the implementationof appropriate BMPs, will help to reduce soil loss and itsassociated impacts on watercourses. For more information onthe extent of agriculture and riparian buffers in thissubwatershed, see Chapter 2 - Study Area and Chapter 6 -Terrestrial Natural Heritage, respectively.Urban areas: The use of sand, as well as salt, for maintaining safe road conditions during thewinter is commonplace. However, large quantities of sand remain on the roadsides after all ofthe snow has melted in the spring, and if it is not removed (e.g. by street sweeping) in a timelymanner, much of it will be washed away by surface runoff during rain events. This is ofparticular concern in areas without stormwater controls, as the sand will be transported directlyto local watercourses. For more information on the extent of urban area within thissubwatershed, see Chapter 2 - Study Area.Chapter 3: Water Quality – Surface and Groundwater 88
The <strong>Innisfil</strong> <strong>Creeks</strong> <strong>Subwatershed</strong> <strong>Plan</strong>3.3.2.4.Thermal degradationThe warming of surface water can generally be attributed to one of two factors: flow overimpervious surfaces, and/or the detention of water in a pond. During the summer, impervioussurfaces such as parking lots and rooftops can become extremely warm. As water flows overthese surfaces before discharging to a watercourse, its temperature increases as well. Thedetention of water in a pond increases the surface area of the water that is exposed to sunlight,and keeps it there for a prolonged period of time, leading to warming. Although online ponds arethe greatest concern due to their direct impact on the watercourse, offline ponds (includingstormwater ponds and detention ponds for irrigation) that discharge to watercourses are also aconcern. While the planting of vegetation around a pond and along its outflow, and theinstallation of structures such as bottom-draws to ensure that the coolest water is beingdischarged can help to reduce the heating effect, ponds will still have an impact on the thermalregime of a watercourse. This issue will likely worsen as the amount of impervious area in thesubwatershed increases in the coming years. Chapter 5 - Aquatic Natural Heritage discussesthe impact of thermal degradation on survival of cool water fish such as brook trout and whichwatercourses are experiencing a degree of thermal degradation.3.3.2.5. PesticidesGiven the large proportion of agricultural and urban land uses, pesticide use is a concern inthese subwatersheds. While pesticide use for cosmetic purposes has been banned by theProvince of Ontario, which is a very positive step, there are a number of exceptions to this lawthat allows for the use of pesticides for public health or safety (including the protection of publicworks structures), golf courses, specialty turf, specified sports fields, arboriculture and to protectnatural resources, if certain conditions are met. There are also exceptions for agriculture,forestry, research and scientific purposes, and uses of pesticides for structural exterminations(e.g., in and around homes to control insects) and uses of pesticides required by otherlegislation. Due to the number of uses still allowed for pesticides, there is still the potential forthese substances to end up in the surface waters of the subwatersheds. There can be a numberof impacts to both terrestrial and aquatic systems due to pesticide contamination, including:• Cancers, tumours and/or lesions on fish and animals;• Reproductive inhibition/failure – reduced egg suppression and hatching, sterility;• Nest and brood abandonment;• Immune system suppression;• Endocrine disruption;• Weight loss;• Loss of attention; and• Loss of predator avoidance (Ongley, E.,1996, Helfrich et al., 2009).The use of best management practices for thestorage and use of pesticides can limit theamount of pesticide required in a given area,and will also reduce the movement of thepesticides from target areas. These practicesshould be promoted throughout theGolf course within the <strong>Innisfil</strong> <strong>Creeks</strong>subwatershed.Chapter 3: Water Quality – Surface and Groundwater 89
The <strong>Innisfil</strong> <strong>Creeks</strong> <strong>Subwatershed</strong> <strong>Plan</strong>subwatershed.In 2004 the LSRCA conducted a Toxic Pollutant Screening Program (LSRCA, 2004) collectingstream water and sediment samples throughout the watershed to analyze for a number ofpollutants including current and past use pesticides. This included a water sample fromLeonards Creek which did not detect any of the parameters for which the screening wasintended.3.3.2.6. MetalsMetals are found almost everywhere and are persistent within the environment. While somenaturally occur in nature, elevated amounts in settled areas are typically associated withagricultural waste, industrial wastes (e.g. metal finishing, tanneries, plastic fabrication, etc) ,residential sewage and urban runoff (Adriano, 2001). These elevated levels of metals in theenvironment can have significant impacts on wildlife communities, as metals can bioaccumulatewithin organisms, cause chronic toxicity, and adversely affect organisms’ behaviour, growth,metabolism and reproduction (Wright and Welbourne, 2002).In 2008, Landre, et al. took sediment samples from <strong>Lake</strong> <strong>Simcoe</strong>, at the same 22 locations of anearlier study (Johnson and Nicolls, 1988). Sampling sites were located in the main basin, at theoutlet from <strong>Lake</strong> Couchiching, and in Kempenfelt Bay and Cooks Bay. Each of the samples wastested for 17 metals: aluminum, arsenic, barium, cadmium, cobalt, chromium, copper, iron,mercury, manganese, nickel, lead, rubidium, antimony, strontium, vanadium, and zinc. Thisstudy found high concentrations of cadmium, chromium, copper, mercury, nickel, lead and zincnear the shore in Kempenfelt, with concentrations decreasing farther away from shore and intothe main basin. A similar pattern was seen in Cook’s Bay, with sites closest to the shore havingthe highest metal concentrations (Landre et al., 2011).Higher concentrations close to shorelines are not unexpected as these are the areas of thesubwatersheds experiencing urban growth, both in the residential and commercial sectors, andis where streams running through agricultural and urban lands dump loads into the lake. Inaddition, metal pollution historically was not regulated from metal finishing facilities andtanneries that were operating in and around Kempenfelt Bay in the past.When comparing current results to the results of the earlier study (Johnson and Nicolls, 1988),metal concentrations had remained the same or decreased, with the exception of copper andzinc in Kempenfelt Bay. The concentrations of these two metals were on par with the peaklevels seen in the 1950s, 60s and 70s (both decreased slightly in 1980s). Additionally, cadmium,mercury, lead and antimony were found at concentrations that were three to seven times higherthan pre-1900s conditions (Landre et al., 2011). Of all the metals studied, chromium was thegreatest concern, as it exceeded the Ontario Sediment Quality Guidelines severe effect level atthree sample sites. This makes it one of the metals of most concern to ecological systems.Depending on the chemical form of chromium, the type of organism and the life stage of theorganism, contamination over the guideline can impact the growth, activities, reproduction andsurvival, as well as causing changes to chromosomes and physical formation, due to itscarcinogenic, mutagenic and teratogenic properties (U.S Environmental Protection Agency,2011).Overall though, because of a decrease in industrial activity, better wastewater treatment and anincrease in urban area, there has been a shift in the source of metals from industrial dischargeto urban runoff (Landre et al., 2011). Hence, to manage the concentration of metal contaminantsin <strong>Lake</strong> <strong>Simcoe</strong>, it is important to install and maintain sufficient stormwater treatment facilitiesand to decrease metal inputs into stormwater.Chapter 3: Water Quality – Surface and Groundwater 90
The <strong>Innisfil</strong> <strong>Creeks</strong> <strong>Subwatershed</strong> <strong>Plan</strong>and parking lots, and even lawns, and are washed to watercourses during precipitation events.The pollutants that can be carried by urban stormwater runoff include nutrients and pesticidesfrom lawns, parks and golf courses; road salts; tire residue; oil and gas; sediment; and nutrientsand bacteria from pet and wild animal faeces. Generally, concentrations of pollutants such asbacteria (e.g. Escherichia coli, fecal coliform, Pseudomonas aeruginosa and fecal streptococci),nutrients (e.g. phosphorus, nitrogen), phenolics, metals and organic compounds are higher inurban stormwater runoff than the acceptable limits established in the PWQO (MOE, 1994).In the past it was common practice to route stormwater directly to streams, rivers or lakes in themost efficient manner possible. This practice typically has negative impacts on the receivingwatercourse. Over the last two decades this has changed and efforts are made to intercept andtreat stormwater prior to its entering watercourses or waterbodies. However, in many olderurban areas stormwater typically still reaches watercourses untreated.Paved surfaces increase the volume and velocity of surface runoff, which leads to streambankerosion, contributing more sediment to watercourses. <strong>Subwatershed</strong>s with less than 10%imperviousness 2 (hardened surfaces) should be able to maintain surface water quality andquantity and preserve aquatic species density and biodiversity, as recommended inEnvironment Canada’s Areas of Concern (AOC) Guidelines (2004). The AOC Guidelines furtherrecommend an upper limit of 30% as a threshold for degraded systems that have alreadyexceeded the 10% impervious guidelines. The <strong>Innisfil</strong> <strong>Creeks</strong> subwatershed is above the 10%guideline, but is below the upper limit threshold with approximately 21% impervious surface. Asthis subwatershed hasn’t reached the 30% threshold, there is still room through mitigative actionand careful development to reduce or at least maintain this number to assist in maintaining thewater quality.The increase in impervious surface area associated with urban growth and the resultantincreases in stormwater runoff can have significant effects on water quality and quantity andaquatic habitat in a subwatershed. While it will obviously not be possible to eliminate impervioussurfaces and their impacts, there are activities that can be undertaken to reduce these impacts.The requirement for stormwater management facilities in all new developments will help tomitigate these issues in urban areas, however, the ongoing maintenance of these facilities iscrucial to ensuring that they continue to reduce sediment and nutrient loads as designed.Additional best management practices should also be implemented in conjunction withstormwater management wherever possible to reduce the amount of these pollutants, as even astormwater facility with the highest level of control does not achieve 100 % removal. A furtherinput of sediment and nutrients from urban areas is the wind erosion of soils stripped bare fordevelopment. These areas can be without vegetation for prolonged periods of time, and can bea significant source of windborne pollution.Based on the Stormwater Practices Manual (MOE, 1994, 2003), there are various levels ofstormwater control established to ensure the protection of receiving waters (i.e. watercourse,ditch, lake). Four levels of protection were established focusing on the ability of stormwatermanagement ponds to control and remove suspended solids. The four levels are:Level 1 is the most stringent level of protection designed to protect habitat which isessential to the fisheries productivity (such as spawning, rearing and feeding areas) andrequires 80% removal of suspended solids.2 Impervious surfaces refer to any hardened surface, but do not include features such as wetlands that are sometimesconsidered impervious in hydrogeological modelsChapter 3: Water Quality – Surface and Groundwater 93
The <strong>Innisfil</strong> <strong>Creeks</strong> <strong>Subwatershed</strong> <strong>Plan</strong>Level 2 protection calls for a 70% removal of suspended solids. In this instance thereceiving water can sustain the increased loading without a decrease in fisheriesproductivity.Level 3 controls are relaxed further, requiring a 60% sediment removal rate againreflecting the lower quality of the receiving water for fish production.Level 4 controls exclusively address retrofit situations where, due to site constraints theother levels of control cannot be achieved. Level 4 protection is not considered for anynew development, only for instances where uncontrolled urban areas can implementsome stormwater management facilities to improve the environmental health.Urban areas in the <strong>Innisfil</strong> <strong>Creeks</strong> subwatershed include the communities of Alcona, Stroud,Gilford and Lefroy in the Town of <strong>Innisfil</strong> and the City of Barrie. In the urban areas in the Town of<strong>Innisfil</strong>, 67% of the stormwater is uncontrolled, while 14% has quantity control only. Theremaining 19% is controlled by Level 1, 2, 3 or 4 stormwater facilities. Of the stormwater controlin the urban areas in the City of Barrie approximately 62% is uncontrolled, 22% has quantitycontrol only, and the remaining 16% is controlled by Level 1, 2, 3 or 4 stormwater facilities(Table 3-9, Figure 3-9).The <strong>Lake</strong> <strong>Simcoe</strong> Basin Stormwater Management and Retrofit Opportunities report (LSRCA,2007) identified and evaluated opportunities to control phosphorus from existing urban areas. Inthe urban areas, stormwater runoff should be addressed through stormwater pond retrofits.These include creating facilities in uncontrolled catchments or upgrading existing facilities orquantity only facilities to higher level of control (i.e. Level 1). The report identified a total of 46and 56 retrofit opportunities in the Town of <strong>Innisfil</strong> and the City of Barrie, respectively (thisnumber may differ slightly from the report as these totals include different scenarios). Thenumber of retrofit opportunities in the <strong>Innisfil</strong> <strong>Creeks</strong> subwatershed and the percentage ofphosphorus that will be prevented from entering the watercourses, and ultimately the lake, arepresented in Table 3-8 and illustrated in Figure 3-10.Table 3-8: Retrofit opportunities in the <strong>Innisfil</strong> <strong>Creeks</strong> subwatershed.<strong>Subwatershed</strong> City of Barrie Town of <strong>Innisfil</strong>*Percent (%) difference inphosphorus loading (kg/yr)<strong>Innisfil</strong> <strong>Creeks</strong> 0 31 13%*The remaining 15 retrofit opportunities in the Town of <strong>Innisfil</strong> are located in the Lovers Creek (13) and Hewitt’s Creek(2) subwatersheds.By design, stormwater ponds trap sediment, a feature which results in a reduction in pondvolume and thus reduced efficiency by which particulates (and phosphorus) are removed.Critical to maintaining this efficiency is the regular removal of the sediment accumulated in thepond. As part of a 2010 study the current volume of stormwater ponds in Barrie and <strong>Innisfil</strong> wereinvestigated and compared with design volumes. Without any stormwater controls, the 32stormwater catchments would contribute a total phosphorus load of 1,381 kg/yr. With theexisting stormwater controls all operating at designed efficiency, the total phosphorus load isreduced to 294 kg/yr (which is a reduction of 1,087 kg/yr). However, the study found manyponds were not operating at designed efficiency, due to a lack of maintenance, and the annualphosphorus load from these catchments is 552 kg/yr, a loss in efficiency of 258 kg/yr.Of the 13 ponds surveyed in the <strong>Innisfil</strong> <strong>Creeks</strong> subwatershed, 12 were originally designed tomeet Level 1 criteria and one to meet Level 2 criteria. When the ponds were surveyed in 2010,Chapter 3: Water Quality – Surface and Groundwater 94
The <strong>Innisfil</strong> <strong>Creeks</strong> <strong>Subwatershed</strong> <strong>Plan</strong>only three were still operating at Level 1, while four were operating at Level 2, three at Level 3and three had filled with sediment to the point where they no longer had a permanent poolvolume or a volume lower than Level 4 efficiency (Figure 3-8).Figure 3-8: <strong>Innisfil</strong> <strong>Creeks</strong> – pond design efficiency level vs. 2010 surveyed efficiency level,Full details of the study can be found in the report “2010 Stormwater Pond Maintenance andAnoxic Conditions Investigation” (LSRCA, 2011).Stormwater Pond – I-N74Chapter 3: Water Quality – Surface and Groundwater 95
The <strong>Innisfil</strong> <strong>Creeks</strong> <strong>Subwatershed</strong> <strong>Plan</strong>Table 3-9: Controlled vs. uncontrolled stormwater catchments in the Town of <strong>Innisfil</strong> and the City of Barrie.LocationTotalNumber ofCatchmentsTotalUrbanArea(ha)Used#Uncontrolled Quantity Level 1 Level 2 Level 3 Level 4Area(ha)%(area)#Area(ha)%(area)#Area(ha)%(area)#Area(ha)%(area)#Area(ha)%(area)#Area(ha)%(area)Controlled(Total of Levels 1to 4)#Area(ha)%(area)Town of<strong>Innisfil</strong>City ofBarrie181 2116.87 150 1417.9 67 12 289.1 14 15 371.5 18 2 38.4 2 0 0 0 0 0 0 17 409.87 19198 3957.42 136 2446.6 62 43 878.5 22 16 546.9 14 3 85.4 2 0 0 0 0 0 0 19 632.28 16Totals 379 6074.29 286 384.56 129 55 1168 36 31 918.4 32 5 124 4 0 0 0 0 0 0 36 1042.2 35Chapter 3: Water Quality – Surface and Groundwater 96
RDB A R R I E400 HWY NSIDERD 10BIG BAY PT RDLOCKHART RD10TH LINE9TH LINERIDGE RD WKempenfelt BayINNISFIL BEACH RD7TH LINE6TH LINEYONGE STSIDERD 25METRO RD N<strong>Lake</strong><strong>Simcoe</strong>BASELINE RDStormwater control inthe <strong>Innisfil</strong> <strong>Creeks</strong>subwatershed.Figure 3-9LegendRoadMunicipal Boundary!(1 Level 1 Pond!(2 Level 2 Pond3 Level 3 Pond!(!(!(!(4 Level 4 PondQ Quantity PondU Uncontrolled Pond!(O Stormwater OutletLevel 1 ControlLevel 2 ControlLevel 3 ControlWARDEN AVEWOODBINE AVESIDERD 5HWY 400 SSIDERD 105TH LINE4TH LINE3RD LINEG E O R G I N APOLLOCK RDLevel 4 ControlQuantity ControlUncontrolledI N N I S F I L2ND LINECOUNTY RD 8914TH LINELINE 13Cook'sBayGLENWOODS AVERAVENSHOE RD0 0.5 1 2 3 4 5KilometresKThis product was produced by the <strong>Lake</strong> <strong>Simcoe</strong> <strong>Region</strong> Conservation Authority andsome information depicted on this map may have been compiled from various sources.While every effort has been made to accurately depict the information,data / mapping errors may exist.This map has been produced for illustrative purposes only.LSRCA GIS Services DRAFT created July 2010.© LAKE SIMCOE REGION CONSERVATION AUTHORITY, 2010. All Rights ReservedThe following datasets roads, municipal boundaries and Oak Ridges Moraine are© Queens Printer for Ontario, 2010. Reproduced with Permission
B A R R I EBIG BAY PT RDRIDGE RD WKempenfelt Bay<strong>Lake</strong><strong>Simcoe</strong>Uncontrolled stormwater andretrofit opportunities in the<strong>Innisfil</strong> <strong>Creeks</strong> subwatershed.LegendFigure 3-10RoadMunicipal BoundarySIDERD 25LOCKHART RDWatercourseStorm Watersheds400 HWY NRD10TH LINE9TH LINEYONGE STControlledUncontrolled,Retrofit OpportunitySIDERD 10INNISFIL BEACH RD7TH LINE6TH LINEMETRO RD NBASELINE RDWOODBINE AVEUncontrolled,No Retrofit OpportunityWARDEN AVESIDERD 105TH LINESIDERD 5HWY 400 S4TH LINE3RD LINEG E O R G I N APOLLOCK RDI N N I S F I L2ND LINECOUNTY RD 8914TH LINELINE 13Cook'sBayGLENWOODS AVERAVENSHOE RD0 0.5 1 2 3 4 5KilometresKThis product was produced by the <strong>Lake</strong> <strong>Simcoe</strong> <strong>Region</strong> Conservation Authority andsome information depicted on this map may have been compiled from various sources.While every effort has been made to accurately depict the information,data / mapping errors may exist.This map has been produced for illustrative purposes only.LSRCA GIS Services DRAFT created July 2010.© LAKE SIMCOE REGION CONSERVATION AUTHORITY, 2010. All Rights ReservedThe following datasets roads, municipal boundaries and Oak Ridges Moraine are© Queens Printer for Ontario, 2010. Reproduced with Permission
The <strong>Innisfil</strong> <strong>Creeks</strong> <strong>Subwatershed</strong> <strong>Plan</strong>3.3.2.10.RecreationNatural areas such as streams and rivers are a popular location forrecreational activities such as hiking, boating and snowmobiling.These activities, if not managed correctly and undertaken in aresponsible manner, can negatively impact the surface water qualityin the area. Impacts from recreational activities can includeincreased bank erosion and instability, loss of riparian area resultingin an increase in input of total suspended solids (TSS) and pollution.Stresses on these sensitive areas may be increasing as a result ofincreasing population and diminishing natural heritage lands.3.3.2.11. Climate ChangeWhile difficult to predict direct results of climate change to waterquality within the <strong>Lake</strong> <strong>Simcoe</strong> watershed, it is likely that it willexacerbate the previously mentioned water quality stressors, creating cumulative, long-termimpacts.Warmer temperatures will lead to further thermal degradation of watercourses and create idealhabitat for bacteria and pathogens. An increase in the frequency and intensity of weather eventscan also have an impact on contaminants, including:• Causing the release of contaminants through damage to storage facilities, overflow ofretention areas and mobilization of surface contaminants that are normally immobile;• Transporting contaminants greater distances; and• Increasing the quantity of contaminants (such as road salt) that are required to deal withweather events (such as snowfall)Figure 3-11 illustrates two different climate scenarios (based on different models) and how theywill impact the total phosphorus loads in the coming years for <strong>Innisfil</strong> <strong>Creeks</strong>. The climatechange scenario outputs were initially reporting the base case phosphorus load (2004-2007). However, it was felt using the 2004-2007 loads in light of the other longer term scenariosdoes not provide a meaningful comparison and could be misleading given the small snap-shotof time. The rationale behind this reasoning is that the climate change scenarios use a muchgreater modelling period of 30 years (1961-1990) to develop the climate change precipitationand temperature projections. Thus, to have a meaningful comparison, model runs wereperformed using the original precipitation and temperature data spanning the period 1961-1990,comparing existing loads and future climate change loads using the same modelling period of30 years. Both scenarios show decreases in phosphorus loads to 2070, with the CGM scenarioshowing a slight increase that is still below baseline, while the GISS scenario also increases butpast the baseline load.Chapter 3: Water Quality – Surface and Groundwater 99
The <strong>Innisfil</strong> <strong>Creeks</strong> <strong>Subwatershed</strong> <strong>Plan</strong>Figure 3-11: Base case land use applied to climate change scenarios for total phosphorus loads inthe <strong>Innisfil</strong> <strong>Creeks</strong> subwatershedFurther information on how climate change will affect aquatic and terrestrial natural heritage canbe found in Chapter 5 – Aquatic Natural Heritage and Chapter 6 – Terrestrial NaturalHeritage.Chapter 3: Water Quality – Surface and Groundwater 100
The <strong>Innisfil</strong> <strong>Creeks</strong> <strong>Subwatershed</strong> <strong>Plan</strong>Key points – Factors Impacting Water Quality - Stressors:• No contaminants were identified as Drinking Water Issues or Conditions in the<strong>Innisfil</strong> Heights and Stroud Well Supplies.• The primary sources of total phosphorus in the <strong>Innisfil</strong> <strong>Creeks</strong> subwatershed areseptic systems (23%), crop land (22.8%) and high intensity development (21%).Under the approved growth scenario in the ACS modelling, there is a projectedincrease in total phosphorus loads of 29% if agricultural BMPs were notimplemented.• When comparing the phosphorus loads (kg/yr) per hectare of the subwatersheds inthe <strong>Lake</strong> <strong>Simcoe</strong> watershed, <strong>Innisfil</strong> <strong>Creeks</strong> is the 6 th largest contributor.• Most of the chloride in the subwatersheds comes from the use of road salt.Currently there is not enough data to accurately describe chloride load trends withinthe subwatersheds. It is expected that loads will increase into the future as theurban areas continue to expand.• Sediment sources include sites stripped for development, agricultural areas, andsand used on roads in the winter. Sediment itself is a pollutant, and also acts as avector for other pollutants, such as phosphorus.• Increasing surface water temperatures can be attributed to overland flow acrossimpervious surfaces and discharge from ponds. Stream temperature issues can beexpected to increase in the coming years as the amount of impervious areaincreases.• The emerging threat of climate change will interact with all of these threats, creatingadditive long-term impacts. In the <strong>Innisfil</strong> <strong>Creeks</strong>, based on climate changescenarios, phosphorus is expected to decrease up to 2070, at which point it willstart to increase.Chapter 3: Water Quality – Surface and Groundwater 101
The <strong>Innisfil</strong> <strong>Creeks</strong> <strong>Subwatershed</strong> <strong>Plan</strong>3.4 Current Management FrameworkVarious programs exist to protect and restore the water quality in the <strong>Lake</strong> <strong>Simcoe</strong> watershed,ranging from regulatory mechanisms, to funding and technical support provided to privatelandowners, to ongoing research and monitoring.Many of these programs already address some of the stresses to water quality in the <strong>Innisfil</strong><strong>Creeks</strong> subwatershed, as outlined below.3.4.1 Protection and PolicyThere are numerous acts, regulations, policies and plans aimed at maintaining or improvingwater quality. These include the <strong>Lake</strong> <strong>Simcoe</strong> Protection <strong>Plan</strong>, the Provincial Policy Statement,the Clean Water Act and municipal official plans. This management framework addresses manyof the stresses identified in these subwatersheds. In Table 3-10 we categorize nine suchstressors, recognizing that many of these overlap and that the list is by no mean complete. Thelegal effects of the various Acts, policies, and plans on the stressors are categorized as ‘existingpolicies in place’ (shown in green), or ‘no applicable policies’ (shown in red). The policiesincluded in the table include those which have legal standing and must be conformed to, orpolicies (such as some of those under the <strong>Lake</strong> <strong>Simcoe</strong> Protection <strong>Plan</strong>) which call for thedevelopment of further management tools, research or education programs.The intent of these regulations, policies and plans are summarized in Section 1.3 – CurrentManagement Framework. Readers interested in the details of these regulations, policies andplans are directed to read the original documents.Chapter 3: Water Quality – Surface and Groundwater 102
The <strong>Innisfil</strong> <strong>Creeks</strong> <strong>Subwatershed</strong> <strong>Plan</strong>Table 3-10: Summary of the current management framework as it relates to the protection andrestoration of water quality.Stressor affectingwater quality<strong>Lake</strong> <strong>Simcoe</strong> Protection <strong>Plan</strong>(2009)Growth <strong>Plan</strong> for the GreaterGolden Horseshoe (2006)Provincial Policy Statement(2005)Nutrient management Act(2002)Ontario Water Resources Act(1990)Environmental Protection Act(1990)Clean Water Act (2006) –Source Water Protection^LSRCA WatershedDevelopment Policies (2008)Comprehensive StormwaterManagement Master <strong>Plan</strong>Guidelines (2011)<strong>Simcoe</strong> County Official <strong>Plan</strong>(2007)Town of <strong>Innisfil</strong> Official <strong>Plan</strong>(2006)City of Barrie Official <strong>Plan</strong>(2009)Development andsite alterationApplication of roadsalt3 8Loss of naturalheritage featuresUncontrolledStormwaterImpervious surface7Discharge ofmaterialAgricultural runoff9Septic systems2 4 5Climate change6Existing PoliciesNo applicable policies1 Gives specifics of what stormwater management plans are to include, but these are very general (e.g. ‘protect water quality’)2 PPS specifies where private septic systems would be allowed, does not give details around inspections/restrictions3 General policy regarding the discharge of any material that may impair the quality of water (not specific to road salt)4 Septic systems >10,000 L/day are regulated under OWRA (smaller systems under building code)5One policy regarding replacement of septic systems that are in wetlands6Refers to the Climate Change Adaptation Strategy in the LSPP – Policy 7.117 Targets for impervious cover provided for the Oak Ridges Moraine Conservation <strong>Plan</strong> areas, but not subject area8Policies refer only to the storage of road salt, not application9Only mention is land use policy where non-intensive agriculture is permitted within Future Urban designation provided it does notjeopardize plans for urban developmentChapter 3: Water Quality – Surface and Groundwater 103
The <strong>Innisfil</strong> <strong>Creeks</strong> <strong>Subwatershed</strong> <strong>Plan</strong>Legislation and policy restrictions are the primary source of protection for water quality in the<strong>Lake</strong> <strong>Simcoe</strong> watershed, guided by the fundamental Provincial planning policies as articulatedin the Provincial Policy Statement (PPS) and <strong>Lake</strong> <strong>Simcoe</strong> Protection <strong>Plan</strong> (LSPP). However,some stressors are better suited to policy and regulation than others. For example, a waterquality stressor such as climate change is hard to regulate; however, stressors associated withsite alterations and stormwater are much easier to control and regulate.Policy tools to deal with these stressors can be found in Provincial Policy (such as PPS orLSPP), municipal official plans and zoning bylaws, and Conservation Authority Regulations.Together these documents are intended to provide protection to features that are significantboth locally and provincially, while providing clarity to private landowners, and accountability tothe electorate.Further to the guidelines provided by the PPS, the LSPP identifies additional targets to improveexisting water quality in the <strong>Lake</strong> <strong>Simcoe</strong> watershed. These targets call for the reduction ofphosphorus, pathogens (such as E. coli) and contaminants (i.e. heavy metals, organicchemicals, sediments and chlorides). To assist in achieving these targets, policies establishedunder the <strong>Lake</strong> <strong>Simcoe</strong> Protection <strong>Plan</strong> place firmer controls on sewage treatment plants(Policies 4.1-4.4), stormwater management (Policies 4.-5-4.12) , septic systems (Policies 4.13-4.15) and construction activities (Policies 4.16-4.21), as well as promoting better managementpractices throughout the various communities in the watershed (LSPP, 2009).Within the <strong>Lake</strong> <strong>Simcoe</strong> watershed and its tributaries, excessive phosphorus is considered themost significant cause of water quality impairment. Because of this, Policy 4.24-SA of the LSPPcommitted the Province, LSRCA, local stakeholders, municipalities and other partners todevelop a comprehensive Phosphorus Reduction Strategy within the first year of the <strong>Plan</strong>. InJune 2010, the <strong>Lake</strong> <strong>Simcoe</strong> Phosphorus Reduction Strategy (PRS) was completed. The PRSis an adaptive management tool that takes a watershed based approach to manage thephosphorus levels in <strong>Lake</strong> <strong>Simcoe</strong>. By looking at the problems and researching solutions for thelake and its tributaries, the PRS provides direction to achieve proportional reductions from eachmajor contributing source of phosphorus to reduce the current total load of 72 T/yr down to 44T/yr in the future. The goal of 44 T/yr is the annual phosphorus load required to achieve theLSPP deep water dissolved oxygen target of 7 mg/L, that research proposes is needed tosupport a naturally reproducing and self-sustaining cold water fishery in <strong>Lake</strong> <strong>Simcoe</strong>.The PRS is broken down into six key concepts, derived from the LSPP, to address the majorsources or sectors contributing phosphorus to the <strong>Lake</strong> <strong>Simcoe</strong> watershed. These include:• Adaptive Management;• Watershed Approach;• Stewardship and Community Action;• Source-specific Actions;• Monitoring and Compliance; and• Research, Modelling and Innovation.Each of these sections includes the ways in which that concept can address the stressors andhow they contribute the overall function of the PRS tool. Additionally, “strategic directions” havebeen incorporated into the PRS to set out actions to be taken to reach the goal of 44 T/yr. Manyof the gaps, related mostly to insufficient information available, are addressed in the “strategicdirections” to continue research efforts and link to the appropriate actions (such as stewardshipefforts, work with aggregate and development industries, etc). Related policies from the LSPPChapter 3: Water Quality – Surface and Groundwater 104
The <strong>Innisfil</strong> <strong>Creeks</strong> <strong>Subwatershed</strong> <strong>Plan</strong>have also been included in the source-specific actions to further the connection between thePRS and LSPP documents.The watershed based approach for protecting drinking water was first adopted in Ontario in2006, with the Clean Water Act to protect drinking water at its source, as part of the Province’soverall commitment to safeguard human health and the environment by using a multi-barrierapproach. The protection of sources of drinking water in the lakes, rivers, and undergroundaquifers of Ontario comprises the first barrier. Source Protection complements the othercomponents, which include effective water treatment, secure distribution systems, monitoringprograms, and responses to adverse test results, by reducing the risk that water iscontaminated in the first place. Participants in the Source Protection program include theMinistry of the Environment, Source Protection Authorities, Source Protection committees,municipalities, First Nations, consultants, and the public. The Proposed Source Protection <strong>Plan</strong>was submitted to the Ministry October 22, <strong>2012</strong> and is currently (<strong>2012</strong>) waiting for approval. TheSource Protection <strong>Plan</strong> is a document that focuses on preventing the overuse andcontamination of drinking water supplies across the SGBLS SPR. The plan includes policiesand strategies to protect drinking water by allowing municipalities to take a proactive approachin preventing, reducing, or eliminating significant threats to water resources (for example:chloride from road salt).In addition to the PPS, the LSPP, the Clean Water Act and the other acts and policies in Table3-10, the municipalities, in this case the City of Barrie and Town of <strong>Innisfil</strong>, municipal Official<strong>Plan</strong>s are key to preserving and improving water quality within the subwatersheds.The City of Barrie Official <strong>Plan</strong> has both goals and policies set around the preservation andimprovement of water quality for Kempenfelt Bay and the watercourses within the city.It touches on most of the stressors listed in Table 3-10, with the exception of application of salt,agricultural runoff, and climate change. Management of water resources, with respect to naturalheritage and resources (under General Policies), is to be looked at with an integrated watershedapproach when reviewing development proposals. The City is responsible for promoting waterconservation and maintaining the quality and sustainability of surface and groundwaterresources, protecting, improving and restoring them where possible (Policy 3.5.2.3). In terms ofwater and wastewater, there are policies to ensure the City make an effort “to use modern andcost effective water pollution abatement measures in order to provide safe, sanitary and efficientmethods of water treatment and waste water disposal” (Policy 5.2.2.1).Under the Barrie OP Policy 5.3.2.2 (policies for stormwater management) all majordevelopments are required to prepare stormwater management studies and plans;channelization is restricted (unless necessary for flood relief, erosion control, fisheries protectionor to environmentally enhance the site); development proposals are restricted from locatingstormwater management facilities on lands designated as Environmental Protection or OpenSpace (unless in accordance with provincial policy); and where necessary existing stormwaterponds should be retrofitted to the standards of the City and senior government legislation. Policy5.3.2.3 looks at the design criteria for development, directing new development away from floodprone areas; encouraging the creation of green roofs and ponding on flat roofs in areas of highdensity; and promoting best management practices for development occurring on aquifers orareas that may have groundwater recharge. There is also reference to policies set out for waterquality in the LSPP.Similarly, the Town of <strong>Innisfil</strong> Official <strong>Plan</strong> also addresses almost all the stressors listed in Table3-10, again with the exception of application of salt and climate change, with goals, objectivesand policies focused on protecting, improving and restoring water quality of the watercoursesand the groundwater found within the municipality. Natural heritage policies (2.4.1-2.4.7) focusChapter 3: Water Quality – Surface and Groundwater 105
The <strong>Innisfil</strong> <strong>Creeks</strong> <strong>Subwatershed</strong> <strong>Plan</strong>on strengthening linkages to protect and enhance surface and groundwater quality. Anaturalized riparian buffer adjacent to watercourses and the shoreline is encouraged in existingdevelopment and required in future development to improve water quality and fish habitat(Policy 2.7.10). Further, in terms of development, Policy 4.7.1 states “applications fordevelopment and large scale site alteration, including golf courses, within the Town must besupported by a Surface Water Quality Analysis demonstrating, to the satisfaction of the Town inconsultation with the applicable conservation authority and the Ministry of the Environment, thatthere will be no negative impacts on the water quality of <strong>Lake</strong> <strong>Simcoe</strong>, its tributaries…”.There are also a number of policies around maintaining and preventing degradation of the waterquality in <strong>Lake</strong> <strong>Simcoe</strong>, as a large portion of the <strong>Lake</strong> <strong>Simcoe</strong> shoreline is within themunicipality. These include providing full municipal sewer sources to portions of the shorelinethat are currently on individual septic systems (Policy 2.7.7).Lastly, on a smaller scale than the LSPP, the <strong>Subwatershed</strong> <strong>Plan</strong>s themselves are also animportant vehicle for highlighting the current conditions of the water quality, what the stressorsare, where the gaps are in current acts, regulations, policies and plans, and to providerecommendations that count on the involvement of various partners, as well as encouragingtheir incorporation into municipalities Official <strong>Plan</strong>s.3.4.2 Restoration and RemediationThere are a range of programs operating in these subwatersheds to assist private landownersimprove the environmental health of their land.The Landowner Environmental Assistance Program (LEAP) is a partnership between the <strong>Lake</strong><strong>Simcoe</strong> <strong>Region</strong> Conservation Authority, its member municipalities, and the York, Durham, and<strong>Simcoe</strong> chapters of the Ontario Federation of Agriculture. This program provides technical andfinancial support to landowners in the <strong>Lake</strong> <strong>Simcoe</strong> watershed wanting to undertakestewardship projects on their land. Project types which have traditionally been funded by theLEAP program include managing manure and other agricultural wastes, decommissioning wellsand septic systems, fencing and planting riparian areas, and increasing the amount of wildlifehabitat in the watershed, among others. Since 1989, LEAP has supported a number of projectsspecifically aimed at improving water quality in this subwatershed, including 54 septic systemupgrades, two stormwater pond retrofits, 10 well decommissionings and three wellheadprotection projects in the <strong>Innisfil</strong> <strong>Creeks</strong> subwatershed. The Ministry of Natural Resources hasalso completed two septic system upgrades.The Ontario Ministry of Agriculture, Food and Rural Affairs has also partnered with Agricultureand Agri-Food Canada and the Ontario Soil and Crop Improvement Association to provide theEnvironmental Farm Program to registered farm landowners throughout the province. Thisfarmer-focused program provides funding to landowners who have successfully completed anEnvironmental Farm <strong>Plan</strong> for projects including management of riparian areas, wetlands, andwoodlands. Through this program approximately 35 projects that would improve water qualityhave been implemented in the Town of <strong>Innisfil</strong>, while in the City of Barrie less than five havebeen completed.In 2008 and 2009, LSRCA field staff surveyed the majority of the watercourses in thissubwatershed, documenting the range of potential stewardship projects that could beimplemented to help improve water quality and fish habitat. This survey found 40 sites in thissubwatershed where runoff was entering creeks, potentially impacting water quality.Chapter 3: Water Quality – Surface and Groundwater 106
The <strong>Innisfil</strong> <strong>Creeks</strong> <strong>Subwatershed</strong> <strong>Plan</strong>3.4.3 Science and ResearchAn ongoing commitment to applied science and research is necessary to improve ourunderstanding of the water quality within the <strong>Lake</strong> <strong>Simcoe</strong> watershed. Ongoing monitoringprograms led by the MOE and the LSRCA, and periodic research studies conducted byacademics, are contributing to our understanding of these values.Since the 1980s, efforts have been made through the <strong>Lake</strong> <strong>Simcoe</strong> Environmental ManagementStrategy (LSEMS) to identify and measure sources of phosphorus in the watershed andrecommend remedial measures. As set out in the <strong>Lake</strong> <strong>Simcoe</strong> Protection Act (passedDecember 2008), objectives of the LSPP include reduction of phosphorus loads. Estimates oftotal phosphorus (TP) loads to the tributaries and lake are used to evaluate the progresstowards achieving the water quality-related objectives of LSEMS and the LSPP. Researchprojects aimed at understanding the links between phosphorus loading and biotic impairmentalso require estimates of phosphorus loading to the lake. Since the 1990s, annual TP loadshave been estimated from atmospheric deposition, tributary discharge, urban runoff, waterpollution control plants (WPCPs), septic systems, and vegetable polders. Total phosphorus lossfrom the lake through the outflow is also quantified. Quantitative hydrological data and lakewater balances are evaluated and used for the calculation and validation of the loads.The Ontario Ministry of the Environment, Environment Canada, Parks Canada, and LSRCAoperate monitoring sites throughout the watershed and information from these programs is usedfor load estimations. Ongoing research and monitoring will aid in detecting changes inwatershed conditions that affect phosphorus loads. The effectiveness of management effortsand understanding of issues, such as climate change and atmospheric deposition, will improvethrough research and monitoring and we will be better prepared to deal with future impacts.There is also a current monitoring project within the City of Barrie which includes the newly(2010) retrofitted Bryne Drive stormwater pond (located just north of Mapleview Dr) that istreating a relatively new industrial/commercial catchment. Prior to the retrofit, the pond wasundersized and not providing adequate treatment of stormwater runoff. As part of the retrofitproject, performance monitoring by the LSRCA of the facility pre- and post- construction wasrecommended examine water quality improvements of the receiving stream and see what theoverall benefits are. The post construction monitoring data will also be used to examine theperformance of the new pond by comparing flow and concentrations (for parameters such asphosphorus, chloride and suspended solids) at both the inlet and outlet of the pond. The ponds’ability to retain these parameters under a variety of storm intensities and durations will yieldvaluable information for not only this project but will also be useful in furthering the knowledgebase on urban stormwater management.In addition to these ongoing monitoring programs, numerous scientific and technical reportshave been published based on research conducted in the <strong>Lake</strong> <strong>Simcoe</strong> watershed. As a resultof this combined focus, <strong>Lake</strong> <strong>Simcoe</strong> is one of the most intensively studied bodies of water inOntario. The results of this research have been summarized, in part, in LSEMS (2008) andPhilpot et al (2010), and have informed the development of this subwatershed plan.The <strong>Lake</strong> <strong>Simcoe</strong> Protection <strong>Plan</strong> also commits the MOE, MNR, MAFRA, and LSRCA toresearch and monitoring related to water quality in <strong>Lake</strong> <strong>Simcoe</strong> and its tributaries. Anenhanced scientific water quality monitoring program is proposed to continue and build uponroutine monitoring of key parameters and of biological indicators linked to water quality, as wellas monitoring and reporting upon the effectiveness of measures put forth to improve waterquality (Policy 4.22). Additionally, scientific research projects that build on existing research andmonitoring programs for identifying emerging issues are to be promoted (Policy 4.23).Chapter 3: Water Quality – Surface and Groundwater 107
The <strong>Innisfil</strong> <strong>Creeks</strong> <strong>Subwatershed</strong> <strong>Plan</strong>3.5 Management Gaps and RecommendationsAs described in the previous sections, many regulations and municipal requirements aimed atprotecting water quality of the <strong>Innisfil</strong> <strong>Creeks</strong> subwatersheds already exist. Similarly thesesubwatersheds have been the focus of numerous restoration and remediation efforts, such asthose coordinated through the Landowners Environmental Assistance Program (LEAP) and theEnvironmental Farm <strong>Plan</strong>. Despite this strong foundation, there are a number of gaps in themanagement framework that need to be considered. This section identifies some of the gaps inexisting protection and restoration of the water quality in the <strong>Innisfil</strong> <strong>Creeks</strong> subwatershed, andoutlines recommendations to help fill these gaps.It is recognized that many of the undertakings in the following set of recommendations aredependent on funding from all levels of government. Should there be financial constraints, itmay affect the ability of the partners to achieve these recommendations. These constraints willbe addressed in the implementation phase.3.5.1 Groundwater (Hydrogeologic and Hydrologic)There is a need to maintain, and in some locations, enhance groundwater flow patterns in termsof volume and temperature in the tributaries that are dependant on baseflow contributions forthe ecological requirements of those systems, within the <strong>Innisfil</strong> <strong>Creeks</strong> subwatershed.Recommendation 3-1- That the LSRCA, with the support of the MOE, provide a whitepaper to subwatershed municipalities describing the range of LID technologies that couldpotentially be used to mitigate the impacts of development on surface and groundwaterquality and quantity. Further, that the LSRCA and subwatershed municipalities identifythe barriers associated with the uptake of LID technology and, with the support of MOE,develop recommendations for overcoming these barriers.Recommendation 3-2 - That the federal and provincial governments provide sufficientfinancial incentives, or otherwise address barriers identified in Recommendation #3-1, toensure subwatershed municipalities use Low impact Development (LID) practices andpromote the adoption of Smart Growth Urban Design Guidelines.3.5.2 Surface Water3.5.2.1.Urban - improving stormwaterWithin the Town of <strong>Innisfil</strong> (including the recently annexed lands) it has been calculated that67% of the urban area does not have any stormwater control, 14% has quantity control only,and the remaining 19% is controlled by Level 1, 2, 3 or 4 stormwater facilities. The general lackof stormwater control within the subwatershed provides many opportunities for retrofits and/ormore innovative Low Impact Design (LID) solutions. Significant reductions in phosphorus loadsto <strong>Lake</strong> <strong>Simcoe</strong>, in addition to improvements to the tributaries, would result from improvedstormwater control. While Secondary <strong>Plan</strong>s are in development for the annexed lands, thisclean slate could also be considered a unique opportunity to implement innovative solutions tostormwater control. Maintenance of existing stormwater facilities has also been identified as anissue within the watershed, with many facilities operating at one or more level below theirdesign.The LSPP already includes a number of polices related stormwater management, leading offwith the requirement for municipalities to prepare and implement comprehensive stormwaterChapter 3: Water Quality – Surface and Groundwater 108
The <strong>Innisfil</strong> <strong>Creeks</strong> <strong>Subwatershed</strong> <strong>Plan</strong>management master plans. The following recommendations build on the LSPP stormwatermanagement policies.Recommendation 3-3 - That the subwatershed municipalities, with the assistance of theLSRCA, promote the increased use of innovative solutions to address stormwatermanagement and retrofits such as:• enhanced street sweeping and catch basin maintenance, particularly in thoseareas currently lacking stormwater controls;• improving or restoring vegetation in riparian areas;• installation of rainwater harvesting; construction of rooftop storage and/or greenroofs; the use of bioretention areas and vegetated ditches along roadways;• the use of soakaway pits, infiltration galleries, permeable pavement and otherLID solutions, where conditions permit; and• the on-going inventory, installation, and proper maintenance of oilgrit/hydrodynamic separators combined with the use of technologies to enhancetheir effectiveness where appropriate.Recommendation 3-4 - That the Province of Ontario, through the implementation of the<strong>Lake</strong> <strong>Simcoe</strong> Phosphorus Reduction Strategy, provide significant incentive funding tothe relevant municipalities and/or the LSRCA to maintain, construct, and /or retrofitstormwater facilities as identified by the LSRCA Stormwater Rehabilitation program.Recommendation 3-5 - That the subwatershed municipalities routinely monitor andmaintain the design level of existing stormwater facilities. In addition to maintainingdesign level, criteria for maintenance should also include frequency and exposure tospills and other contaminant sources. Further, that the federal and provincialgovernments be requested to share in the cost of maintenance.Recommendation 3-6 - That the subwatershed municipalities complete the StormwaterManagement Master <strong>Plan</strong>s as outlined in the LSPP 2011 Comprehensive StormwaterManagement Master <strong>Plan</strong>s Guidelines document with particular emphasis onmaintenance of facilities, and the need for retrofits where appropriate.Recommendation 3-7 - That the LSRCA and its partners recognize that while theconstruction and/or retrofit of quality control facilities is extremely important, quantitycontrol is also an important consideration in some areas of the Barrie <strong>Creeks</strong>, LoversCreek, and Hewitt’s Creek subwatersheds; therefore, quantity control facilities should beconstructed in those areas where geographical space is limited or other LID options arenot feasible. In these situations, federal and provincial governments should providefinancial incentives to allow municipalities to complement quantity control stormwaterponds with an enhanced street sweeping program.Recommendation 3-8 - That Official <strong>Plan</strong>s be amended to contain policies that wouldhelp minimize impervious surface cover in the <strong>Innisfil</strong> <strong>Creeks</strong> subwatershed throughrequirements such as using low impact development solutions, limiting impervioussurface areas on new development, and/or providing stormwater rates rebates andincentives to residential and non-residential property owners demonstrating bestpractices for managing stormwater.Chapter 3: Water Quality – Surface and Groundwater 109
The <strong>Innisfil</strong> <strong>Creeks</strong> <strong>Subwatershed</strong> <strong>Plan</strong>3.5.2.2.Urban – construction practicesProjected growth within this subwatershed dictates that rate of construction is going to increase.Significant deterioration to tributary water quality can occur during construction phase asexposed soils are very susceptible to run-off and wind erosion if codes of practices are notfollowed. While site alteration by-laws, and policies in the LSPP (e.g. 4.20-DP) aim to minimizeconstruction phase impacts, further improvements could be made through use of current BMPand improved enforcement.Recommendation 3-9 - That the LSRCA and watershed municipalities promote andencourage the adoption of best management practices to address sedimentation anderosion controls during construction and road development.Recommendation 3-10 - That subwatershed municipalities and LSRCA improve currentmonitoring and enforcement of site alteration by-laws by undertaking a review of thecurrent program and ensuring that adequate resources are available for theimprovements.3.5.2.3.Urban – reducing salt (chloride)Currently there is insufficient long-term trend data for almost all of the creeks within the <strong>Innisfil</strong><strong>Creeks</strong> subwatershed. Only Leonard’s Creek is monitored, of which a large portion is located inmainly in rural and natural heritage cover, and therefore is currently not experiencing elevatedchloride levels. Continued monitoring is required to determine if there is an increasing trend, asis being found in the neighbouring subwatersheds (Lovers and Hewitt’s <strong>Creeks</strong> subwatersheds).As it is likely that the systems within the more urban areas of the Town of <strong>Innisfil</strong> areexperiencing increasing trends, that could be impacting the health of the aquatic communities,steps to reduce chloride are needed.Recommendation 3-11 - That the LSRCA, with the support of subwatershedmunicipalities, develop a program to determine relative contribution of chloride from roadsalt application, establish baseline indicators, and examine the effectiveness of currentprotocols on salt storage, application, and disposal, as outlined in their respective SaltManagement <strong>Plan</strong>s, adapting them as necessary.Recommendation 3-12 – That the LSRCA, with the support of subwatershedmunicipalities, identify areas within the Barrie <strong>Creeks</strong>, Lovers Creek, and Hewitt’s <strong>Creeks</strong>ubwatersheds which are vulnerable to road salt (as outlined by Environment Canada).This assessment may be refined through further examination of relative salt tolerance oflocal biota. As outlined in Environment Canada’s Code of Practice for the EnvironmentalManagement of Road Salt, municipalities should examine alternate methods ofprotecting public safety while reducing environmental impacts in these areas, onceidentified.Recommendation 3-13 - That subwatershed municipalities, with the assistance of theLSRCA, develop or adopt a program such as the <strong>Region</strong> of Waterloo’s “Smart aboutSalt” program, to educate snow removal contractors and property managers about bestpractices for reducing salt use while ensuring that public safety is not compromised.Further, that subwatershed municipalities examine the feasibility of adopting acertification program, wherein private contractors could become certified as “smart” saltapplicators, reflecting their understanding of the need to balance environmentalprotection and public safety in snow and ice management, and the feasibility of requiringall contractors working on municipal property to have such certification.Chapter 3: Water Quality – Surface and Groundwater 110
The <strong>Innisfil</strong> <strong>Creeks</strong> <strong>Subwatershed</strong> <strong>Plan</strong>Recommendation 3-14 - Recognizing that increasing concentrations of chloride inwatercourses is an emerging issue shared by all municipalities in the <strong>Lake</strong> <strong>Simcoe</strong>watershed, that the watershed municipalities, LSRCA, MOE, and MNR form a SaltWorking Group as a mechanism to share information on best practices for saltapplication, methods of increasing public awareness of the environmental impacts ofroad salt, and the effectiveness of municipal Salt Management <strong>Plan</strong>s.3.5.3 Agriculture<strong>Subwatershed</strong> modelling (that excludes atmospheric) indicates that 30% of phosphorus loadscan be attributed to agriculture in the <strong>Innisfil</strong> <strong>Creeks</strong> subwatershed. Recent water qualitymonitoring (2008 to 2010) within Leonard’s Creek has shown that 45% of the samples forphosphorus concentration exceed the provincial standards. Considering the currentconcentrations of phosphorus in Leonard’s Creek, and the large proportion that can beattributed to agricultural sources, actions leading to reduction in agricultural phosphorus loads tothis creek, as well as all the others within the <strong>Innisfil</strong> Creek subwatershed, are a priority.Within the current management framework, the Nutrient Management Act contains the moststringent policies related to agriculture, as it requires plans for the management of nutrientscreated and/or stored on farms. Other policies relate to the protection of agricultural resources,but few relate to the management of nutrients from agricultural areas, with only ‘have regard to’statements encouraging the use of agricultural BMPs.Although there are currently no requirements for farmers to undertake BMPs such as covercrops, conservation tillage, the planting of windrows, and leaving riparian buffers intact, thereare a number of available programs to assist farmers to implement these programs. Inparticular, the Environmental Farm <strong>Plan</strong> program and LSRCA’s Landowner EnvironmentalAssistance Program (LEAP) provides guidance and funding for a number of types of projects.Other gaps in current management include policies requiring livestock to be fenced and kept outof watercourses, an activity that causes numerous water quality issues as well as causing bankinstability.Recommendation 3-15 - That the subwatershed municipalities, through the LSRCA,create a roundtable made up of municipalities, LSRCA, MOE, MNR, OFA, NGOs, andrelated landowner representatives, or through existing frameworks such as the <strong>Lake</strong><strong>Simcoe</strong> Stewardship Network, to determine co-operative ways of implementingphosphorus reduction and improved water quality measures in Hewitt’s, Lovers, and<strong>Innisfil</strong> <strong>Creeks</strong>, and to develop an ‘action plan’ for their implementation within theagricultural and rural communities.Recommendation 3-16 - That the spatially-explicit tool to be developed underRecommendations 5-7 and 5-8 (Chapter 5 – Aquatic Habitat) be used to prioritizeallocation of stewardship resources, so that funds are provided in locations wheremaximum phosphorus reduction can be achieved.Note that unrestricted livestock access and its related impacts were reported on and remedialactions are recommended as part of the implementation of agricultural BMPs in Chapter 5 -Aquatic Habitat. Recommendations 5-7 and 5-8 are most relevant to the concern.Chapter 3: Water Quality – Surface and Groundwater 111
The <strong>Innisfil</strong> <strong>Creeks</strong> <strong>Subwatershed</strong> <strong>Plan</strong>3.5.4 Water Temperature – thermal degradationIncreases in stream temperature in the subwatersheds, whether they are due to impervioussurfaces, lack of riparian vegetation, reduction of groundwater contributions, or climate changenegatively affect the distribution and existence of coldwater resources like brook trout andmottled sculpin due to their restrictive thermal requirements.Recommendation 3-17– That, as new or retrofit stormwater facilities are constructed,LSRCA work with subwatershed municipalities to reduce potential thermal impacts ofthose stormwater ponds and to recognize the importance of LID uptake in relation tomaintaining stream temperature.Recommendation 3-18- That the LSRCA work with its federal, provincial, and municipalpartners to refine the anticipated impacts of climate change in the <strong>Lake</strong> <strong>Simcoe</strong>watershed. This information can then be used to develop management strategies toaddress these impacts. Emphasis at this time should be placed on building ecologicalresilience in vulnerable subwatersheds through stream rehabilitation, streambankplanting, barrier removal, and other BMP implementation in conjunction with theprotection of current hydrologic functions.Note that thermal issues associated with dams were also reported on and remedial actions arerecommended as part of the implementation of BMPs in Chapter 5 - Aquatic Habitat.Recommendation 5-7 and 5-9 assist in dealing with this specific concern.3.5.5 Monitoring and AssessmentCurrently there is only one surface water station within Leonard’s Creek representing the manysmaller creeks within the <strong>Innisfil</strong> <strong>Creeks</strong> subwatershed. Obviously there is a significant need toprovide improved and expanded information on temporal and spatial change in water qualitywithin the subwatersheds. The existing monitoring networks are not comprehensive enough anda review of the expectations of the program is required. More extensive and frequent samplingwill be required to meet future needs. In addition, potential issues related to new water qualitycontaminants such as pharmaceuticals will require further investigation.Recommendation 3-19- That the LSRCA enhance the existing monitoring network,through the comprehensive monitoring strategy, to address identified limitations andgaps of the current monitoring program. Review of potential enhancements shouldconsider:• Undertaking periodic monitoring of toxicants such as pesticides andpharmaceuticals• Spatial coverage of monitoring stations relative to addressing key monitoringquestions such as the relationship between changes in land use cover andchanges in water quality and quantity• Establishing water quality monitoring stations in the headwaters, in addition tothe mouths, of the tributaries• Monitoring additional parameters that are are key indicators of ecosystem healthand restoration progress such as brook trout spawning.Recommendation 3-20 – That the MNR, LSRCA, and MOE develop a framework toallow effective and efficient management and sharing of data before implementing theChapter 3: Water Quality – Surface and Groundwater 112
The <strong>Innisfil</strong> <strong>Creeks</strong> <strong>Subwatershed</strong> <strong>Plan</strong>comprehensive monitoring program. This framework may include the designation of oneagency as the curator of all monitoring data collected in the <strong>Lake</strong> <strong>Simcoe</strong> watershed.Recommendation 3-21 - That the LSRCA, MNR and MOE analyse and report theresults of the existing and proposed water quality, water quantity, and aquatic andterrestrial natural heritage monitoring programs annually, and that the information beused to update the LSRCA Watershed Report Card. Further, stakeholders should bemade aware when updates are available, and be provided access to the monitoring datacollected via a web portal, to increase distribution and communication of this data.Recommendation 3-22 – That the LSRCA, in collaboration with MNR, MOE, andMAFRA, develop a program for assessing efficacy of new stormwater facilities,stewardship best management practices, and restoration projects, to improveunderstanding of the effectiveness of stewardship efforts.Chapter 3: Water Quality – Surface and Groundwater 113
The <strong>Innisfil</strong> <strong>Creeks</strong> <strong>Subwatershed</strong> <strong>Plan</strong>4 Water Quantity – Surface and Groundwater4.1 Introduction and BackgroundThe effective management of water resources requires the accounting of the total quantity ofwater and its distribution within a watershed, known as a water budget. The input into thebudget is the total amount of precipitation within a watershed and the outputs includeevaporation, transpiration, infiltration (movement of water into the subsurface), and runoff (oroverland flow) into rivers and streams, which all make up components of the hydrologic cycle.Surface water quantity deals with components of the hydrologic cycle that move overland andare within lakes, streams and wetlands. Surface flow is comprised of groundwater dischargeinto rivers and streams, overland flow from rain, snow melt, and precipitation that falls directlyinto lakes, rivers, streams and wetlands.Groundwater quantity deals with components of the hydrologic cycle that are present below theearth’s surface, in the spaces between rocks and soil particles. The discharge of groundwater tolakes and streams remains relatively constant from season to season; it therefore forms animportant part of the surface water flow system, and is particularly important when surfacerunoff is at its lowest levels, when it can be the only source of water to streams.Many natural systems rely on a consistent supply of groundwater. Fish species that depend oncoldwater conditions for their survival require a very high ratio of cold, clean groundwater to totalstream flow. Many ponds and wetlands are maintained by groundwater flow during the drysummer months. In many areas throughout the subwatershed, humans are extremelydependent on a reliable supply of groundwater for many purposes including irrigation of fields,potable water, industry, and recreation.Targets set for water quantity under the <strong>Lake</strong> <strong>Simcoe</strong> Protection <strong>Plan</strong> include:• Maintenance of instream flow regimes that are protective of aquatic ecosystem needs,and;• Effective water conservation and efficiency plansThe physical properties of a watershed, such as drainage area, slope, geology, and land usecan influence the distribution of the water and the processes that function within it. This chapterquantifies the surface and groundwater components within the hydrologic cycle for thewatershed and also identifies how the rural and urban land uses in the <strong>Innisfil</strong> <strong>Creeks</strong>subwatershed have altered the hydrologic cycle (Figure 4-1), including changes to the surfaceflow volumes, annual flow patterns, and the risk of flooding.Chapter 4: Water Quantity – Surface and Groundwater 114
The <strong>Innisfil</strong> <strong>Creeks</strong> <strong>Subwatershed</strong> <strong>Plan</strong>Figure 4-1: Hydrologic cycle (USGS, 2008).4.1.1 Understanding the factors that affect water quantityThere are several factors that influence the quantity of surface and groundwater available withina subwatershed. They are climate, geology, land use, and water use.ClimateBoth surface and groundwater quantity can be influenced by a number of climatic factorsincluding precipitation, evaporation, and evapotranspiration. Precipitation is the main climatevariable that has a direct influence on the quantity of water available, since it is the main inputinto the system. The amount of precipitation that falls, particularly in one event, will have asignificant influence on how much infiltrates into the soil, and how much will run off. In southernOntario, relatively little precipitation runs over the land to watercourses, as a high percentage ofthe precipitation is either cycled back into the atmosphere through evapotranspiration orinfiltrates into the soil; although, in the case of an intense storm event where a large quantity ofprecipitation falls over a short period of time, most of the precipitation will be directed overland.This will also occur with a significant snowmelt event. These types of events are generallyobserved in March or April snowmelts or the onset of spring rains in April or May. Table 2-9,Chapter 2- Study Area and Physical Setting, shows the total mean annual precipitation at theBarrie WPCC climate station is 921mm.There are other variables associated with climate that will influence water quantity. In particular,evapotranspiration is strongly influenced by climate and, unlike precipitation, it is considered anoutput or loss to the system. Evapotranspiration is the water lost to the atmosphere by twoprocesses, evaporation and transpiration. Evaporation is the loss from open bodies of water,such as lakes and reservoirs, wetlands, bare soil, and snow cover; transpiration is the loss fromliving plant surfaces. Other factors that affect the evapotranspiration process include net solarradiation, surface area of open bodies of water, wind speed, density and type of vegetativecover, availability of snow moisture, root depth, reflective land surface characteristics, andseason.Chapter 4: Water Quantity – Surface and Groundwater 115
The <strong>Innisfil</strong> <strong>Creeks</strong> <strong>Subwatershed</strong> <strong>Plan</strong>Geology and physiographyThe geology and physiography also has a significant influence on water movement within thesubwatershed. The underlying geology and the type of soil present at the surface (surficialgeology) will determine how much water will be infiltrated during a precipitation event and howmuch water will flow overland to a watercourse. In addition, knowledge of the local geology andphysiography is needed to understand how water moves both on and beneath the ground insaturated and unsaturated zones. For example, coarse-grained and loosely packed soils, suchas sands and gravels, will promote groundwater recharge, whereas fine-grained or hard packedsoils, such as clay, will allow less water to infiltrate to recharge the groundwater system.Chapter 2 – Study Area and Physical Setting provides more information and figures relatedto the geology and physiography of the study area.Land use and land coverLand use and cover are important factors that can strongly influence both surface andgroundwater quantity because they will affect several aspects of the water budget includingsurface water runoff, evaporation, and infiltration. Developed land will often have a higherproportion of impervious surface, such as roadways, parking lots, and buildings roofs. Increasedrunoff rates result in erosion and reduced infiltration to recharge groundwater reserves. Inaddition, groundwater pathways may also be affected by development, which can result indecreased discharge to wetlands and streams.The main land use classifications present in the <strong>Innisfil</strong> <strong>Creeks</strong> subwatershed include urban,rural, natural cover (e.g. wetlands, woodlands, and grasslands), golf courses, and aggregateextraction (Figure 2-2 in Chapter 2 – Study Area). Wetlands are found in areas of topographiclows and the groundwater often intersects the surface in these areas. The intersection of thesurface with the groundwater table allows for a constant flow of surface water in these areas.As the population continues to grow, urban areas are expanding, resulting in widespread areasof impervious surfaces. These impervious surfaces lead to a decrease in the time it takes awatercourse to reach to peak flow following a rain event, as the ability to store and slowlyrelease water has been eliminated. Watercourses in the undeveloped areas of thesubwatershed exist under natural conditions making them less vulnerable to extreme changesin climatic events; for example the time it takes to reach peak flow is not as rapid as in urbanareas. As impervious surfaces increase in area, volume of peak flow can also increase as watercannot infiltrate into the ground, and therefore runs off into surface water bodies, which canincrease the risk of flooding, particularly during the spring freshet.Water useIn the <strong>Innisfil</strong> <strong>Creeks</strong> subwatershed both surface and groundwater are used for a variety ofpurposes, including municipal water supply, agriculture, commercial use, golf course irrigation,private water supplies, and by the native plants and animals. Many of these users withdrawlarge amounts of water and could potentially be putting stress on the system. Therefore, it isimportant to be able to identify the large water users by location, source of water (surface orgroundwater), type of water use, and volume of water taken to ensure the available watersupply within the subwatershed is managed in a sustainable manner. An effort to quantify thesewater withdrawals has been undertaken within studies required under the Clean Water Act andthe <strong>Lake</strong> <strong>Simcoe</strong> Protection <strong>Plan</strong> (discussed in Section 4.3).Chapter 4: Water Quantity – Surface and Groundwater 116
The <strong>Innisfil</strong> <strong>Creeks</strong> <strong>Subwatershed</strong> <strong>Plan</strong>4.1.2 Previous StudiesInformation from several groundwater and water budget studies was used to assess thehydrogeology of the <strong>Innisfil</strong> <strong>Creeks</strong> subwatershed. The following is a list of key studies andreports that have influenced the information provided in this chapter:South <strong>Simcoe</strong> Groundwater Management StudyThe MOE funded a series of groundwater studies across the province in the early 2000s to helpmunicipalities measure the quantity, quality, and location of groundwater in aquifers. A numberof these studies were completed within or overlapping the <strong>Lake</strong> <strong>Simcoe</strong> watershed, as outlinedbelow.The South <strong>Simcoe</strong> Groundwater Partnership, consisting of the Nottawasaga ValleyConservation Authority (NVCA), LSRCA, Canadian Forces Bases (CFB) Borden, the <strong>Simcoe</strong>County District Health Unit, the MOE, and the local municipalities within the study area, wasestablished in October 2001 to examine local groundwater resources across an area thatincluded the western portion of the <strong>Lake</strong> <strong>Simcoe</strong> watershed, adjacent to <strong>Lake</strong> <strong>Simcoe</strong>, andstretching west across much of the Nottawasaga River watershed. The work was completedby Golder Associates Ltd. (GAL) and Dixon Hydrogeology on behalf of the South <strong>Simcoe</strong>Groundwater Partnership (Golder Associates and Waterloo Hydrogeologic, 2004).The study delineated local aquifers, identified risks to groundwater quality and quantity, definedthe Wellhead Protection Areas (WHPAs) for all municipal water supplies and provided planningtools for protecting and managing groundwater.Source Water Protection water budget studies and modelling initiativesMuch of the information presented throughout this chapter has been extracted from and isconsistent with the information, data, and modelling results developed and reported throughseveral Source Water Protection (SWP) water budget studies. These studies were developedaccording to provincial direction provided by the Ministry of the Environment (MOE) in theTechnical Rules (MOE, 2008) prepared for the provincial Source Water Protection programunder the Clean Water Act (2006).A number of modelling initiatives have been undertaken in the <strong>Innisfil</strong> Area. These includegroundwater and surface water models developed for the SGBWLS Tier 2 Water Budget andWater Quantity Stress Assessment and the Barrie Tier 3 Water Budget and Water Quantity RiskAssessment that formed the basis for the <strong>Innisfil</strong> <strong>Creeks</strong> subwatershed Tier 2 Assessmentcompleted for the <strong>Lake</strong> <strong>Simcoe</strong> Protection <strong>Plan</strong> modelling work.• South Georgian Bay-<strong>Lake</strong> <strong>Simcoe</strong> Watershed Preliminary Conceptual Water BudgetReport (2007);• <strong>Lake</strong> <strong>Simcoe</strong> Watershed Tier One Water Budget and Water Quantity Stress AssessmentReport (LSRCA, 2009);• South Georgina Bay West <strong>Lake</strong> <strong>Simcoe</strong> Hydrostratigraphic Conceptual Model Report(AquaResource and Golder, 2010);• Tier 2 Water Budget and Water Quantity Stress Assessment Report (AquaResource andGolder, 2010);• South Georgina Bay West <strong>Lake</strong> <strong>Simcoe</strong> Tier 2 Water Budget and Water Quantity StressAssessment Report (AquaResource and Golder, 2010)• Water Balance Analysis of the <strong>Lake</strong> <strong>Simcoe</strong> Basin using the Precipitation-RunoffModelling System (PRMS) (Earthfx, 2010).• City of Barrie Tier Three Water Budget and Local Area Risk Assessment ConceptualUnderstanding Memorandum (AquaResource, Golder and IWC, 2010) – DRAFTChapter 4: Water Quantity – Surface and Groundwater 117
The <strong>Innisfil</strong> <strong>Creeks</strong> <strong>Subwatershed</strong> <strong>Plan</strong>• City of Barrie Tier Three Water Budget and Local Area Risk Assessment GroundwaterFlow Model (AquaResource, Golder and IWC, 2011) – DRAFT<strong>Lake</strong> <strong>Simcoe</strong> Protection <strong>Plan</strong> Water Budget and Ecologically Significant Groundwater RechargeArea AssessmentAs a requirement under the <strong>Lake</strong> <strong>Simcoe</strong> Protection <strong>Plan</strong>, a Tier 2 water budget was completedfor the <strong>Innisfil</strong> <strong>Creeks</strong> subwatershed. This study included revising models previously completedunder source water protection initiatives as mentioned above. The water budget and stressassessment results presented in this chapter are findings from this study.<strong>Lake</strong> <strong>Simcoe</strong> <strong>Region</strong> Conservation Authority surface water monitoring programInformation about water quantity is required by a wide audience, including research scientists,policy-makers, design engineers, and the general public. Water level and flow data are used bydecision makers to resolve issues related to sustainable use, infrastructure planning, and waterapportionment. Hydrological models use the data to improve the forecasting of floods and watersupplies, and to predict the impacts of changes in flow regimes to human and aquatic healthand economic activity.The <strong>Lake</strong> <strong>Simcoe</strong> <strong>Region</strong> Conservation Authority, in co-operation with Environment Canada andthe MOE, operates and maintains 16 hydrometric stations on the major tributaries of <strong>Lake</strong><strong>Simcoe</strong>. Data is collected, catalogued, and interpreted by the <strong>Lake</strong> <strong>Simcoe</strong> <strong>Region</strong>Conservation Authority using Kisters WISKI hydrologic software. This data is essential for floodforecasting,planning, nutrient budget estimation for <strong>Lake</strong> <strong>Simcoe</strong>, and to support the waterquantity information needs of our municipal partners.4.2 Current status4.2.1 Hydrogeologic settingThe hydrogeology of the <strong>Innisfil</strong> <strong>Creeks</strong> subwatershed is shaped by the stratigraphic frameworkdiscussed in Chapter 2 – Study Area and Physical Setting (Section 2.4). For numericalmodelling purposes, a hydrostratigraphic conceptual model and layer structure was developedin preparation for three-dimensional groundwater flow modelling. This work was completed byAquaResource and Golder (2010) and AquaResource et al., (2011) for the Tier 2 Water Budgetand Water Quantity Stress Assessment and further refined for the City of Barrie Tier 3 WaterBudget and Water Quantity Risk Assessment, both of which build upon previous modelsdeveloped for the South <strong>Simcoe</strong> Groundwater Studies (Golder, 2004). In addition, the <strong>Innisfil</strong><strong>Creeks</strong> Tier 2 study included a number of modelling refinements using the Tier 3 model andextending it to the entire <strong>Innisfil</strong> <strong>Creeks</strong> subwatershed.The hydrostratigraphic units refer to groups of geologic layers that possess similar hydrologiccharacteristics and that are considered to act together as an aquitard or aquifer unit at the scaleof the investigation. The subwatershed contains both overburden and bedrock aquifers that canbe utilized for water supply; however, the majority of the municipal supplies and all of the largecapacity wells are constructed in overburden. Within the subwatershed, the most transmissiveunits are the coarse-grained overburden deposits typically found at depth. Groundwater flowsrapidly through these deposits, and they act as excellent local and regional aquifers.The aquifer system contains four major sand and gravel aquifer units (from shallowest todeepest: A1, A2, A3, and A4). The shallowest units (A1 and A2) are generally unconfined in thesubwatershed, with A1 mainly constrained to upland areas. The aquifer system andChapter 4: Water Quantity – Surface and Groundwater 118
The <strong>Innisfil</strong> <strong>Creeks</strong> <strong>Subwatershed</strong> <strong>Plan</strong>hydrostratigraphy within the subwatershed were divided into the following 10 hydrostratigraphicunits and 14 layers model layers as outlined in Table 4-1 (AquaResource et al., 2010).Table 4-1: Hydrostratigraphic units within the subwatershed (Table has been modified fromAquaResources et al., 2011).ModelLayerLayer 1Layer 2, 3UnitNameSrfGUCDescriptionRepresents conductance in stream beds, mapped surficial geology.0.10-3 m in thickness.Represents confining layer over A1, mostly present in upland areas such as the Oro Moraine.Layer 4A1Layer 5 C1 Upper AquitardUpper most aquifer, present in upland areas. Frequently exists as surficial and unconfined,stratigraphically equivalent to the Oak Ridges Moraine, generally is associated with coarse andinterglacial sediments mapped as ice-contact stratified drift.Layer 6 A2Intermediate Aquifer, stratigraphically equivalent to interstadial unitswithin the Northern Till. Within the lowland areas it is often the uppermost coarse-grained unit,commonly used for private water supplies, as well as some of the smaller municipal water supplywells (i.e. <strong>Innisfil</strong>)Layer 7 C2 Intermediate Aquitard, providing protection to the municipal aquiferLayer 8,9, 10, 11A3 Main municipal production aquifer, stratigraphically equivalent to the Thorncliffe deposits in theUpland regions. Represents the bulk of the Barrie-Borden channel aquifer.Layer 12 C3 Lower AquitardLayer 13 A4 Lower Aquifer, thin and sometimes combined with A3 in the Barrie City Core, where C3 is thin orabsent.Layer 14 C4 Lower Aquitard, also represents weathered bedrock.4.2.2 Hydraulic PropertiesHydraulic properties such as hydraulic conductivity, specific storage (S s ), specific yield (S y )hydraulic gradients, and porosity characterize the amount, rate, and direction of groundwaterflow through soil and rock. Hydraulic conductivity is the primary variable that controls thecalculated hydraulic head distribution throughout a groundwater flow model. Coarse grainedmaterials (sands and gravels) are assigned a higher hydraulic conductivity than finer grainedmaterials (silts and clay). Specific storage and porosity are closely related hydraulic properties.Porosity refers to the volume of void space per unit volume of geologic materials, where specificstorage refers to volume of water stored within the geologic materials.Table 4-2 provides a summary of the average initial estimated aquifer parameters derivedmainly from pumping tests at the municipal wells. Further refinement of these estimates wascompleted during the calibration stage of model development, this is shown in (AquaResourceet al., 2011).Table 4-2: Average initial hydraulic conductivity estimates (AquaResource et al., 2011).UnitUCA1C1A2Mean Hydraulic Conductivity (m/s)1.66E-061.12E-042.43E-071.44E-04Chapter 4: Water Quantity – Surface and Groundwater 119
The <strong>Innisfil</strong> <strong>Creeks</strong> <strong>Subwatershed</strong> <strong>Plan</strong>UnitC2A3C3A4C4Mean Hydraulic Conductivity (m/s)3.4E-075.4E-033.68E-078.49E-051.75E-074.2.3 Groundwater flowGroundwater flow is controlled by the variation in aquifer transmissivity (i.e. hydraulicconductivity multiplied by aquifer thickness) taking into consideration hydraulic gradients.Groundwater moves continuously but at different rates based on the hydraulic properties of thehydrostratigraphy mentioned in Section 4.2.1. Groundwater will flow down a hydraulic gradientfrom points of higher to lower hydraulic heads. The direction of movement at any point within thesystem is dependent on the distribution of hydraulic potential (Funk, 1997). Within eachformation, groundwater can move in both the horizontal and vertical directions. Since theshallow water table commonly follows the ground surface topography, horizontal flow can betopographically mapped using water table data obtained from shallow wells. Figure 4-2 andFigure 4-3 illustrate the predicted shallow (A1 aquifer) and deep (A3 aquifer) water levelcontours produced in the steady state groundwater flow model. They can be used toapproximate groundwater flow directions. These figures were derived from the Draft <strong>Innisfil</strong> Tier2 Study and are based on observed water levels in observation and pumping wells(AquaResource, <strong>2012</strong>).As illustrated in Figure 4-2 shallow water levels throughout the subwatershed are shown tomimic the ground surface topography, and the flow converges towards the higher order streamsand <strong>Lake</strong> <strong>Simcoe</strong>. The groundwater elevation contours compare well with the observed waterlevel contours illustrated within the Barrie Tier 3 report (AquaResource et al., 2011), in that flowgradients are similar, both in terms of direction and magnitude, especially considering flowdriven toward Cooks Bay.As illustrated in Figure 4-3, the deep aquifer water level contours within the study area aresimilar to the shallow water levels, however they exhibit a more subdued expression. Althoughthe simulated equipotentials reflect the same flow gradients as the observed equipotentials,some local features within the simulated results are absent. The upgradient area between theLovers Creek and <strong>Innisfil</strong> <strong>Creeks</strong> subwatersheds is smaller in extent than that in the shallow,indicating that downward gradients are the strongest in this area.Chapter 4: Water Quantity – Surface and Groundwater 120
The <strong>Innisfil</strong> <strong>Creeks</strong> <strong>Subwatershed</strong> <strong>Plan</strong>Figure 4-2: Shallow water levels (AquaResource, <strong>2012</strong>).Chapter 4: Water Quantity – Surface and Groundwater 121
The <strong>Innisfil</strong> <strong>Creeks</strong> <strong>Subwatershed</strong> <strong>Plan</strong>Figure 4-3: Deep water levels (AquaResource et al., 2010).Chapter 4: Water Quantity – Surface and Groundwater 122
The <strong>Innisfil</strong> <strong>Creeks</strong> <strong>Subwatershed</strong> <strong>Plan</strong>4.2.4 StreamflowAt this point, there are no streamflow monitoring stations in this subwatershed and we aretherefore not able to characterize flow characteristics.Runoff/impervious surfaceStreamflow characteristics at a particular point in a river system reveal much of what isoccurring in the landscape upstream of that point. Streamflow integrates all aspects of thehydrologic cycle but is also influenced by the topography and size of the watershed; vegetativecover and associated transpiration rates; infiltration capacity of the soil; and anthropogenicactivities such as water withdrawals, dams and impoundments, discharge of wastewater, andland use changes such as increasing impervious surfaces. Much of the influence of thesefactors can be gleaned through an examination of a river hydrograph, which would show howthe river responds to precipitation events of various sizes and intensities. Systems with highgradients, high levels of impervious surfaces or low infiltration capacity soils, and a low percentcover of natural vegetation are characterized by a quick and short response to precipitationevents, and are considered ‘flashy’ systems. This can exacerbate erosion and water qualityissues through increased water volume and velocity, greater transport of contaminants, andgeomorphic changes to natural river form. These impacts will be greater where these factors areactively changing (i.e. an increasing amount of impervious surface) and the river system ischanging in response.Conversely, systems with low gradients, large catchment areas, low impervious surface cover,highly permeable soils, and high coverage of natural vegetation typically respond to aprecipitation event more slowly, for a longer duration, and with lower peak water levels. Artificialdams or impoundments can achieve the same result. Typically this type of system will be lessprone to flooding, will have lower levels of contaminants in transport due to slower velocity orchannel scour, and have a greater flow stability (i.e. will better maintain baseflow betweenprecipitation events). This type of system is commonly referred to as having greater storage.Still this storage in a system can be overwhelmed by a large spring freshet and/or high intensity,long duration, or frequent precipitation events, which cause the system to respond quickly anddramatically.As there are currently no flow monitoring stations in the <strong>Innisfil</strong> <strong>Creeks</strong> subwatershed, it is notpossible at this point to characterize the response of its watercourses to precipitation andsnowmelt events.BaseflowBaseflow is considered the portion of stream flow that is derived from groundwater discharge,from sources such as springs and seepages that release the cool groundwater. The baseflowcomponent within streams is vital for fish populations that require coldwater habitat. This habitatcan be affected by localized pumping as the aquifers are drawn down and less baseflow isreleased.While flow gauges are a very effective tool for examining baseflow, none are present in the<strong>Innisfil</strong> <strong>Creeks</strong> subwatershed to accurately describe baseflow across the subwatershed. For thisreason discrete baseflow measurements were conducted on the <strong>Innisfil</strong> <strong>Creeks</strong> in June 2005.The results for the 2005 survey conducted by the LSRCA are illustrated in the following Figure4-4.Figure 4-4 indicates that very little to no stream flow was observed 72 hours after precipitationevents, indicating that groundwater discharge is not a substantial contributor of flow to thetributaries of the <strong>Innisfil</strong> <strong>Creeks</strong> subwatershed. The small, relatively steep-sloped geographicform of the <strong>Innisfil</strong> <strong>Creeks</strong> subwatersheds, coupled with the ephemeral nature of the streams,Chapter 4: Water Quantity – Surface and Groundwater 123
The <strong>Innisfil</strong> <strong>Creeks</strong> <strong>Subwatershed</strong> <strong>Plan</strong>indicates a flashy, high energy system that is prone to considerable erosion and increasedflooding potential.Chapter 4: Water Quantity – Surface and Groundwater 124
B A R R I EBIG BAY PT RDRIDGE RD WKempenfelt Bay<strong>Lake</strong><strong>Simcoe</strong>Baseflow in the <strong>Innisfil</strong><strong>Creeks</strong> subwatershed.LegendFigure 4-4RoadMunicipal BoundarySIDERD 25LOCKHART RD<strong>Innisfil</strong> <strong>Creeks</strong><strong>Subwatershed</strong>400 HWY NA RDSIDERD 1010TH LINE9TH LINEYONGE STBase Flow (L/s/km)30Dry, Standing or Too LowNo DataI N N I S F I L2ND LINECOUNTY RD 8914TH LINELINE 13Cook'sBayGLENWOODS AVERAVENSHOE RD0 0.5 1 2 3 4 5KilometresKThis product was produced by the <strong>Lake</strong> <strong>Simcoe</strong> <strong>Region</strong> Conservation Authority andsome information depicted on this map may have been compiled from various sources.While every effort has been made to accurately depict the information,data / mapping errors may exist.This map has been produced for illustrative purposes only.LSRCA GIS Services DRAFT created July 2010.© LAKE SIMCOE REGION CONSERVATION AUTHORITY, 2010. All Rights ReservedThe following datasets roads, municipal boundaries and Oak Ridges Moraine are© Queens Printer for Ontario, 2010. Reproduced with Permission
The <strong>Innisfil</strong> <strong>Creeks</strong> <strong>Subwatershed</strong> <strong>Plan</strong>4.2.5 Groundwater dischargeIn areas where the static water table intersects the ground surface there is potential fordischarge to occur. Groundwater discharge areas are often in low topographic areas and can beobserved in and around watercourses in the form of springs and seeps, or as baseflow tostreams. These areas are characterized by upward vertical hydraulic gradients. The portion ofwater that is contributed from groundwater is referred to as baseflow and provides clean, coolwater to streams and wetlands.Groundwater discharge rates vary throughout the year due to seasonal and longer-termchanges in recharge and groundwater potentials. Hydrograph separation techniques (asdiscussed in the previous section) applied to long term surface water flow records are the bestmethods for quantifying the portion of streamflow derived from groundwater discharge tostreams. However, as discussed in Section 4.2.4 there are no gauges within the study area, andother than spot flow measurements stream tributaries are not monitored.The groundwater discharge areas produced from the Tier 2 model (AquaResource, <strong>2012</strong>) areshown on Figure 4-5. A comparison of the discharge mapping from the model with mapsproduced by LSRCA (2010) shows that most coldwater and coolwater fishery stream reaches,both of which are known to be groundwater discharge areas, are well represented within themodel. An exception would be in the extreme upper reaches of the streams, particularly thoseclose to or above the simulated water table, which are not as well represented due to a lack oflocal refinement (AquaResource et al., 2011).In addition, a potential discharge map was created (Figure 4-6) using the potentiometric surfaceproduced from shallow wells in the MOE water well database in conjunction with topographicmapping. Potential discharge zones are where the water levels are within two metres of theground surface. As seen from the figure, many of these potential discharge locations coincidewith know wetlands and coldwater streams.Chapter 4: Water Quantity – Surface and Groundwater 126
!RIDGE RD WStrahallan CreekGroundwater discharge to surfacewater simulated from the SGBWLSTier 2 FEFLOW model!ESSA RD!!!!!!! !!! ! !BARRIE400 HWY N!!!!!!Kempenfelt Bay!!BIG BAY PT RDLOCKHART RD10TH LINESandy CoveCreek!Leonard'sSIDERD 25AlconaCreek!!<strong>Lake</strong><strong>Simcoe</strong>LegendRoadMunicipal BoundaryWatercourse<strong>Innisfil</strong> <strong>Creeks</strong><strong>Subwatershed</strong>River Discharge (m3/day)! > 300Figure 4-5YONGE STSIDERD 10!!!!SIDERD 5!!!9TH LINE!INNISFIL BEACH RDSIDERD 107TH LINE6TH LINE!!5TH LINE4TH LINE!BanksBelle AireCarsonWilsonCreekCreekCreekLefroyCedarCreek!!!Creek!Moyer CreekSylvan CreekMETRO RD NWOODBINE AVEBASELINE RDWARDEN AVEGEORGINAPOLLOCK RD! 300 to 100! 100 to 0! < 0HWY 400 S!!!!!!INNISFIL!3RD LINE2ND LINECOUNTY RD 89!14TH LINELINE 13!White Birch!GilfordCreekGilfordUpper MarshCreek!!Creek!Cook'sBayGLENWOODS AVERAVENSHOE RD0 0.5 1 2 3 4 5KilometresKThis product was produced by the <strong>Lake</strong> <strong>Simcoe</strong> <strong>Region</strong> Conservation Authority andsome information depicted on this map may have been compiled from various sources.While every effort has been made to accurately depict the information,data / mapping errors may exist.This map has been produced for illustrative purposes only.LSRCA GIS Services DRAFT TF created November 2011.© LAKE SIMCOE REGION CONSERVATION AUTHORITY, 2010. All Rights ReservedThe following datasets roads, municipal boundaries and Oak Ridges Moraine are© Queens Printer for Ontario, 2010. Reproduced with Permission!!
RIDGE RD WPotential discharge in the<strong>Innisfil</strong> <strong>Creeks</strong> subwatershed.Kempenfelt Bay<strong>Lake</strong><strong>Simcoe</strong>Figure 4-6B A R R I EBIG BAY PT RDLegendRoadMunicipal BoundarySIDERD 25LOCKHART RD<strong>Innisfil</strong> <strong>Creeks</strong><strong>Subwatershed</strong>400 HWY NRD10TH LINEDischargeYONGE STSIDERD 109TH LINEINNISFIL BEACH RD7TH LINE6TH LINEMETRO RD NBASELINE RDWARDEN AVEWOODBINE AVESIDERD 105TH LINESIDERD 5HWY 400 S4TH LINE3RD LINEG E O R G I N APOLLOCK RDI N N I S F I L2ND LINECOUNTY RD 8914TH LINELINE 13Cook'sBayGLENWOODS AVERAVENSHOE RD0 0.5 1 2 3 4 5KilometresKThis product was produced by the <strong>Lake</strong> <strong>Simcoe</strong> <strong>Region</strong> Conservation Authority andsome information depicted on this map may have been compiled from various sources.While every effort has been made to accurately depict the information,data / mapping errors may exist.This map has been produced for illustrative purposes only.LSRCA GIS Services DRAFT created July 2010.© LAKE SIMCOE REGION CONSERVATION AUTHORITY, 2010. All Rights ReservedThe following datasets roads, municipal boundaries and Oak Ridges Moraine are© Queens Printer for Ontario, 2010. Reproduced with Permission
The <strong>Innisfil</strong> <strong>Creeks</strong> <strong>Subwatershed</strong> <strong>Plan</strong>Groundwater Monitoring• The static water levels measured in monitoring wells characterize the amountof water stored in an aquifer, aquifer complex, or saturated portion of thesubsurface system. Groundwater levels can fluctuate due to precipitation,barometric pressure, temperature, and water withdrawal.• Monitoring these ambient groundwater levels can enhance understanding ofbaseline conditions and assess how groundwater is affected by climatechange, seasonal fluctuation, and land and water use. Monitoring helps toidentify trends and emerging issues, and provides a basis for making informedresource management decisions. The data can also be used to measure theeffectiveness of the programs and policies that are designed to manage andprotect groundwater resources.• From 2004 to 2010, groundwater levels and quality were monitored from thewell location within the Town of <strong>Innisfil</strong> as part of the Provincial GroundwaterMonitoring Network. This well has since been abandoned and replaced in <strong>2012</strong>by the by another well located within the Town.4.2.6 Groundwater rechargeGroundwater is replenished as precipitation or snowmelt infiltrates into the ground surface.Precipitation is the primary source of groundwater recharge (i.e., the amount of water thatinfiltrates through the unsaturated zone and ultimately reaches the water table). However, therate and direction of groundwater movement is influenced by the distribution and thickness ofsurficial geology and associated soil properties, topography, vegetation, land cover and landuse. For example, water will move more readily through coarse loose material and bedrockfractures than through material such as clay or unfractured rock. In areas where there areimpervious surfaces, such as within urban areas, the amount of infiltration is reduced, while inareas of sands and sandy loam, particularly within the upland areas to the north of thesubwatershed, infiltration rates are increased. In addition, recharge is enhanced in areas wherethe ground surface is hummocky and water cannot move as easily to contribute as runoff tonearby creeks and rivers.The mapping of the recharge zones and the policies that protect them are necessary to ensurethe sustainability of groundwater supplies and a healthy subwatershed. The rate of groundwaterrecharge varies over the study area and is controlled by the factors listed above. Rates ofrecharge within the subwatershed were based on annual average recharge as predicted by thePRMS model completed by Earthfx (2010b) within the subwatershed contributing to the <strong>Lake</strong><strong>Simcoe</strong> basin. Recharge rates were also adjusted slightly to account for consumptive lossesdue to private water takings for agriculture and domestic supply. Simulated baseflows usinginitial estimates of recharge were analyzed and the recharge rates were adjusted until a goodmatch was achieved with values determined by baseflow separation. A map showing the final,calibrated recharge distribution for the study area is shown in Figure 4-7. The figure illustratesrates of recharge within the <strong>Innisfil</strong> <strong>Creeks</strong> subwatershed range from no recharge to greaterthan 350 mm/yr.As expected, groundwater recharge is higher in areas with highly permeable soils (i.e. sandsand gravels), and lower in compacted soils (i.e. silts/tills, and clays). Typically, urbanized areastend to show lower recharge rates due to the impervious area, which limits the volume of waterChapter 4: Water Quantity – Surface and Groundwater 129
The <strong>Innisfil</strong> <strong>Creeks</strong> <strong>Subwatershed</strong> <strong>Plan</strong>that can infiltrate. However, little of the subwatershed is occupied by urban areas and thereforewhere there is little to no recharge it is generally due to soil conditions. In groundwaterdischarge areas (i.e. wetlands), recharge is zero or very low as the water table is at or near theground surface. The integrated model also provides insight regarding areas with very highrecharge rates (e.g. > 350 mm/yr). These areas are along boundaries between soils of highpermeability (gravels and sands) and low permeability (silts/tills and clays). In these areas, thelow permeability soils generate overland runoff that flows onto high permeability soils, where itinfiltrates and recharges the groundwater system (AquaResource et al., 2011).Significant Groundwater Recharge AreasSignificant Groundwater Recharge Areas (SGRAs) can be described as areas that caneffectively move water from the surface through the unsaturated soil zone to replenish availablegroundwater resources. The mapping of these recharge zones is necessary to ensure thesustainability of groundwater supplies. In turn, land development plans should consider theprotection of these areas in order to maintain the quantity and quality of groundwater requiredby a healthy subwatershed.SGRAs were developed for the entire <strong>Lake</strong> <strong>Simcoe</strong> watershed to meet the technicalrequirements under the Clean Water Act, 2006. In 2008, the <strong>Lake</strong> <strong>Simcoe</strong> <strong>Region</strong> ConservationAuthority commissioned the development of a surface water model of the <strong>Lake</strong> <strong>Simcoe</strong> basin byEarthfx (2010b). This model, which covers the <strong>Innisfil</strong> <strong>Creeks</strong> subwatershed, was developedusing the PRMS, an open source model developed by the US Geological Survey (Leavesley etal., 1983). The model used precipitation, temperature, and other climate data from 28 long-termEnvironment Canada climate stations across the basin, along with land use, soil type,topography, and vegetation data to predict groundwater recharge, runoff, andevapotranspiration. The model was developed in a “fully-distributed” manner in which modelinputs and outputs were uniquely defined on a 100 by 100 m cell grid to fully represent spatialvariability in the study area. The model was calibrated to 28 years of streamflow data from 13Environment Canada HYDAT stream gauges.SGRAs within the <strong>Lake</strong> <strong>Simcoe</strong> watershed represent areas where the recharge rate is 15%greater than the average recharge (164 mm/yr) across the watershed. The shaded areas withinFigure 4-8 represent a recharge rate of 189 mm/yr. A comparison of Figure 2-13 indicates thatthe most significant areas for groundwater recharge within the <strong>Innisfil</strong> <strong>Creeks</strong> subwatershed areassociated with surficial sand and gravel deposits and range between 300-500 mm/yr.Ecologically Significant Groundwater Recharge AreasEcologically Significant Groundwater Recharge Areas (ESGRAs) are identified as areas of landthat are responsible for supporting groundwater systems that sustain sensitive features likecoldwater streams and wetlands. To establish the ecological significance of the recharge area, alinkage must be present between the recharge area and the ecologically significant feature(e.g., a reach of a coldwater stream, a wetland, or an area of natural or scientific interest(ANSI)). The identification of an ESGRA is not related to the volume of recharge that may beoccurring, rather they represent pathways in which recharge, if it occurred, would reach thatfeature. While delineating ESGRAs is an important task in establishing the linkage between arecharge area and an ecologically sensitive feature it is not a certainty that ESGRAs willcoincide with SGRAs, as they may not support high volumes of recharge. While ESGRAs andSGRAs are not mutually exclusive, the areas where they do coincide support high volumes ofrecharge and support ecologically sensitive features.ESGRAs are currently being delineated for the <strong>Innisfil</strong> <strong>Creeks</strong> subwatershed by AquaResourceInc. using the FEFLOW model developed by AquaResource et al. (2011) for the <strong>Innisfil</strong> Tier 2Water Budget. LSRCA identified a range of features deemed to be ecologically significant withinChapter 4: Water Quantity – Surface and Groundwater 130
The <strong>Innisfil</strong> <strong>Creeks</strong> <strong>Subwatershed</strong> <strong>Plan</strong>the <strong>Innisfil</strong> <strong>Creeks</strong> subwatershed. These include headwater streams, coldwater fisheries,wetlands, and other locations where sensitive species are found. From these features, reverseparticle tracking will be conducted by releasing virtual particles at a specified starting pointwithin the subwatershed (wetlands and coldwater stream reaches). The groundwater modelthen tracks the particles backward through the aquifer until the point of entry is reached at thesurface. The point of entry is an area that will be delineated as a recharge area for thosesensitive features for the purpose of identifying ESGRA.Chapter 4: Water Quantity – Surface and Groundwater 131
RIDGE RD WStrahallan CreekSimulated average annualgroundwater recharge (mm/yr)from the PRMS modelKempenfelt Bay<strong>Lake</strong><strong>Simcoe</strong>LegendFigure 4-7ESSA RDBARRIE400 HWY NSIDERD 5SIDERD 10BIG BAY PT RDLOCKHART RD10TH LINE9TH LINEINNISFIL BEACH RDSIDERD 107TH LINE6TH LINEYONGE ST5TH LINE4TH LINESandy CoveCreekMooselankaBanksLeonard'sAlcona!Bon Secours<strong>Innisfil</strong><strong>Creeks</strong>Belle AireCarsonWilson!LefroyCreekSIDERD 25CreekCreekCreekCreekCedarCreekCreekCreekMoyer CreekSylvan CreekMETRO RD NWARDEN AVEWOODBINE AVEBASELINE RDGEORGINAPOLLOCK RDRoadMunicipal BoundaryWatercourse<strong>Innisfil</strong> <strong>Creeks</strong><strong>Subwatershed</strong>Recharge (mm/yr)-1 - 3030 - 125125 - 250250 - 350350 - 675HWY 400 S3RD LINEINNISFIL2ND LINECOUNTY RD 8914TH LINELINE 13White BirchCreekUpper MarshGilford!GilfordCreekCreekCook'sBayGLENWOODS AVERAVENSHOE RD0 0.5 1 2 3 4 5KilometresKThis product was produced by the <strong>Lake</strong> <strong>Simcoe</strong> <strong>Region</strong> Conservation Authority andsome information depicted on this map may have been compiled from various sources.While every effort has been made to accurately depict the information,data / mapping errors may exist.This map has been produced for illustrative purposes only.LSRCA GIS Services DRAFT TF created November 2011.© LAKE SIMCOE REGION CONSERVATION AUTHORITY, 2010. All Rights ReservedThe following datasets roads, municipal boundaries and Oak Ridges Moraine are© Queens Printer for Ontario, 2010. Reproduced with Permission
RIDGE RD WKempenfelt Bay<strong>Lake</strong><strong>Simcoe</strong>Significant Groundwater RechargeAreas in the <strong>Innisfil</strong> <strong>Creeks</strong>subwatershedFigure 4-8B A R R I EBIG BAY PT RDLegendRoadMunicipal BoundarySIDERD 25LOCKHART RD<strong>Innisfil</strong> <strong>Creeks</strong><strong>Subwatershed</strong>400 HWY NRD10TH LINERechargeYONGE STSIDERD 109TH LINEINNISFIL BEACH RD7TH LINE6TH LINEMETRO RD NBASELINE RDWARDEN AVEWOODBINE AVESIDERD 105TH LINESIDERD 5HWY 400 S4TH LINE3RD LINEG E O R G I N APOLLOCK RDI N N I S F I L2ND LINECOUNTY RD 8914TH LINELINE 13Cook'sBayGLENWOODS AVERAVENSHOE RD0 0.5 1 2 3 4 5KilometresKThis product was produced by the <strong>Lake</strong> <strong>Simcoe</strong> <strong>Region</strong> Conservation Authority andsome information depicted on this map may have been compiled from various sources.While every effort has been made to accurately depict the information,data / mapping errors may exist.This map has been produced for illustrative purposes only.LSRCA GIS Services DRAFT created July 2010.© LAKE SIMCOE REGION CONSERVATION AUTHORITY, 2010. All Rights ReservedThe following datasets roads, municipal boundaries and Oak Ridges Moraine are© Queens Printer for Ontario, 2010. Reproduced with Permission
The <strong>Innisfil</strong> <strong>Creeks</strong> <strong>Subwatershed</strong> <strong>Plan</strong>4.2.7 Current Climatic ConditionsPrecipitation and temperaturePrecipitation in the form of rain or snow replenishes both the surface water and groundwatersystems within a subwatershed. Typically, precipitation will vary seasonally and from year toyear due to climatic factors. Precipitation is often measured at one or more meteorologicalstations within a subwatershed using precipitation gauges. Precipitation is an input value in thewater balance calculation accounting for a portion of the available water supply.Long-term climate data was obtained from Environment Canada stations shown on Figure 2-21,Chapter 2 – Study Area and Physical Setting, including daily maximum and minimumtemperature, daily rainfall and snowfall and hourly rainfall for the period of 1950-2005.EvapotranspirationAs previously mentioned, evapotranspiration (ET) is the water lost to the atmosphere by twoprocesses, evaporation and transpiration. Evaporation is the loss from open bodies of water,such as lakes and reservoirs, wetlands, bare soil, and snow cover; transpiration is the loss fromliving-plant surfaces. Several factors other than the physical characteristics of the water, soil,snow, and plant surfaces also affect the evapotranspiration process. Areas covered by plantswill have more evapotranspiration occurring than developed areas with impervious surfaces.Unlike precipitation, ET is accounted for as a loss to the system in the water budget calculation.Potential evapotranspiration (PET) was calculated using the simpler Hargreaves model(Hargreaves and Allen, 2003 and Wu, 1997) which requires only two climate parameters;temperature and incident radiation. The incident solar radiation is adjusted based on slope andslope aspect, vegetation type, winter/summer cover density, and winter transmission factor (i.e.,percentage of short-wave radiation passing through the winter vegetation canopy). PET wasadjusted to account for Actual Evapotranspiration (AET), which depends on the soil type and theamount of water in interception storage and in the recharge zone (upper part of the active soilzone) (Earthfx, 2010a). The average net annual ET occurring over the subwatershed isdisplayed on Figure 4-9.Chapter 4: Water Quantity – Surface and Groundwater 134
RIDGE RD WKempenfelt BayStrahallan Creek<strong>Lake</strong><strong>Simcoe</strong>Average net annualevapotranspiration (mm/yr)in the <strong>Innisfil</strong> <strong>Creeks</strong>subwatershedLegendFigure 4-10BARRIEBIG BAY PT RDSandy CoveCreekMooselankaCreekRoadMunicipal BoundaryWatercourseSIDERD 25ESSA RD400 HWY NSIDERD 5SIDERD 10LOCKHART RD10TH LINE9TH LINEINNISFIL BEACH RDSIDERD 107TH LINE6TH LINEYONGE ST5TH LINE4TH LINEBanksLeonard'sAlcona!Bon Secours<strong>Innisfil</strong><strong>Creeks</strong>Belle AireCarsonWilsonCreek!LefroyCreekCreekCreekCedarCreekCreekCreekMoyer CreekSylvan CreekMETRO RD NWARDEN AVEWOODBINE AVEBASELINE RDGEORGINAPOLLOCK RD<strong>Innisfil</strong> <strong>Creeks</strong><strong>Subwatershed</strong># Stream GaugesObserved Annual AverageEvapotranspiration (mm/yr)High : 747Low : 190HWY 400 S3RD LINEINNISFIL2ND LINECOUNTY RD 8914TH LINELINE 13White BirchCreekUpper MarshGilford!GilfordCreekCreekCook'sBayGLENWOODS AVERAVENSHOE RD0 0.5 1 2 3 4 5KilometresKThis product was produced by the <strong>Lake</strong> <strong>Simcoe</strong> <strong>Region</strong> Conservation Authority andsome information depicted on this map may have been compiled from various sources.While every effort has been made to accurately depict the information,data / mapping errors may exist.This map has been produced for illustrative purposes only.LSRCA GIS Services DRAFT TF created November 2011.© LAKE SIMCOE REGION CONSERVATION AUTHORITY, 2010. All Rights ReservedThe following datasets roads, municipal boundaries and Oak Ridges Moraine are© Queens Printer for Ontario, 2010. Reproduced with Permission
The <strong>Innisfil</strong> <strong>Creeks</strong> <strong>Subwatershed</strong> <strong>Plan</strong>4.3 Water budget estimatesA water budget characterizes the hydrologic conditions within a subwatershed by quantifying thevarious elements of the hydrologic cycle, including precipitation, interception, andevapotranspiration, as shown in Figure 4-10. It can therefore be used to identify areas where awater supply could be under stress, now or in the future. This will help protect the ecological andhydrological integrity of an area by establishing water supply sustainability targets andstrategies.Tier Two Water Budgets and Water Quantity Stress Assessments have been undertaken insupport of the Source Water Protection Program in those subwatersheds that were determinedto have a moderate or significant potential for stress in the Tier One Water Budget and WaterQuantity Stress Assessment. The goal of the Tier Two Water Budget and Water Quantity StressAssessment is to confirm or negate the stress assignment completed in the Tier One using amore detailed approach that includes detailed and complex modelling tools to estimate waterflow volumes to compare to the consumptive demand estimates (MOE, 2008a). The role of theTier Two is to refine the estimation of water budget components to facilitate a more reliablestress assessment and allow subwatersheds with marginal stress levels to avoid the detailedlocal assessments required in the Tier Three. Should the elevated stress levels be confirmed inthe Tier Two assessment, an even more detailed Tier Three Water Budget and Water QuantityRisk Assessment is required.Although the Tier One Water Budget was completed for <strong>Innisfil</strong> <strong>Creeks</strong> subwatershed throughthe source water protection initiatives, it did not have a stress assessment high enough totrigger a Tier Two assessment. Therefore, the Tier Two study completed by AquaResources(<strong>2012</strong>) was undertaken through the <strong>Lake</strong> <strong>Simcoe</strong> Protection <strong>Plan</strong> initiatives and the results arepresented in the following sections.Figure 4-10: Water budget componentsChapter 4: Water Quantity – Surface and Groundwater 136
The <strong>Innisfil</strong> <strong>Creeks</strong> <strong>Subwatershed</strong> <strong>Plan</strong>The general water budget may be expressed as an equation with water Inputs = Outputs +Change in Storage; orWhere:P + SW in + GW in + ANTH in = ET + SW out + GWout + ANTH out + ∆SP = PrecipitationSWin = surface water flow into the watershedGWin = groundwater flow into the watershedANTHin = anthropogenic or human inputs such as waste dischargesET = evapotranspirationSWout = surface water flow out (includes runoff)GWout = groundwater flow outANTHout = discharge to wells (i.e. drinking water supplies)∆S = change in storage (surface water, soil moist)Source: (OMOE, 2005b)The following section describes how the input and output values of the water budget equationwere determined for the <strong>Innisfil</strong> <strong>Creeks</strong> subwatershed. The findings of the water budget studyare discussed below.4.3.1 Water supply estimationWater supply is the amount of water available at any given instant for use as a drinking watersource, for recreational activities, or to support ecological functions. In surface water resources,available supply is considered to be a proportion of streamflow, which is monitored at a numberof stations across the <strong>Lake</strong> <strong>Simcoe</strong> basin. Determination of surface water supply thus involvesthe interpolation of gauge data to the outlets of subwatersheds in gauged systems, andinterpolation from similar subwatersheds for ungauged systems. Typically, surface water supplyhas been based on expected monthly flows (as determined through statistical analysis ofobserved flows or through surface water modelling). For groundwater, the available supply for asubwatershed is considered to be the sum of the recharge and subsurface inflows (lateral inflowor underflow in).The water supply component of the stress assessment was estimated using a numericalgroundwater flow model, which was originally developed for the Barrie Tier 3 study. Thisgroundwater model incorporated the enhanced knowledge of the geologic surface and subsurfacegained from the conceptual model discussed in the previous section.As part of the water budget process, estimates of the water budget component fluxes wereexamined across the study area. Table 4-3 summarizes the estimated overall groundwaterfluxes for the subwatershed. The table summarizes watershed inflows including recharge andgroundwater interbasin flow. Outflows include stream discharge, groundwater pumping, andgroundwater interbasin flow. The water budget parameters are calculated based on informationderived from both the surface water and groundwater flow models and are presented in units ofm 3 /d and mm/year. In addition to the potentiometric surface for the productions aquifer,Figure 4-11 illustrates the estimated cross-boundary groundwater flow between the <strong>Innisfil</strong><strong>Creeks</strong> subwatershed and adjacent subwatersheds (AquaResource, <strong>2012</strong>).Chapter 4: Water Quantity – Surface and Groundwater 137
The <strong>Innisfil</strong> <strong>Creeks</strong> <strong>Subwatershed</strong> <strong>Plan</strong>Average annual recharge in this area is approximately 216 mm/year. Average annualbase flow is 63 mm/year from all streams and wetlands across the subwatershed.Approximately 155 mm/yr of groundwater flows out of the subwatershed to thesubsurface under <strong>Lake</strong> <strong>Simcoe</strong>. This flow to Cook’s Bay is driven by the hydraulicgradient in the shallow layers of the model.As stated above, the <strong>Innisfil</strong> <strong>Creeks</strong> subwatershed was not incorporated within theSGBWLS Tier Two study (AquaResource, 2010). However, a comparison of waterbudget terms to the <strong>Lake</strong> <strong>Simcoe</strong> Tier One water budget show consistency betweenthe two studies, with slightly lower pumping quantities within the present study, due tothe shutdown of the Alcona Well field as well as using updated Water Taking reportingestimates, as opposed to applying assumptions based on the Permitted Rates ofprivately permitted wells. It should also be noted that groundwater cross boundaryflows between subwatersheds were not explicitly considered within the Tier One WaterBudget calculations.Table 4-3: Water budget summary by subwatershed (AquaResource, <strong>2012</strong>).FlowsInflow Components (m 3 /d) (L/s) (mm/yr)Groundwater Recharge 63,500 735 216Flow from <strong>Innisfil</strong> Creek <strong>Subwatershed</strong> 1,570 18 5.3Flow from Hewitts Creek <strong>Subwatershed</strong> 80 1 0.3Total Groundwater Inflow 65,150 754 221Outflow Components (m 3 /d) (L/s) (mm/yr)Surface Water Discharge 43,900 508 149Streams 9,150 106 31Wetlands 9,350 108 32<strong>Lake</strong> <strong>Simcoe</strong> (Top Slice) 25,400 294 86Permitted Wells 700 8 2Flow to Lovers Creek <strong>Subwatershed</strong> 40 0 0.1Flow to Cook’s Bay (Subsurface flow) 13,510 156 46Flow to Kempenfelt Bay (Subsurface flow) 7,000 81 24Total Groundwater Outflow 65,150 754 221Chapter 4: Water Quantity – Surface and Groundwater 138
The <strong>Innisfil</strong> <strong>Creeks</strong> <strong>Subwatershed</strong> <strong>Plan</strong>Figure 4-11: Water budget results from the Tier Two Assessment (AquaResource, <strong>2012</strong>).Chapter 4: Water Quantity – Surface and Groundwater 139
The <strong>Innisfil</strong> <strong>Creeks</strong> <strong>Subwatershed</strong> <strong>Plan</strong>4.3.2 Water demand estimationThe water demand has been estimated from a number of information sources, including thePermit to Take Water (PTTW) database, population estimates, and water well records. Thissection provides a summary of the consumptive groundwater demands for <strong>Innisfil</strong> <strong>Creeks</strong>subwatershed assessed as part of the Tier Two Stress Assessment (AquaResource, <strong>2012</strong>).Consumptive groundwater demand refers to water that is taken and not returned to its originalsource (i.e. aquifer) within a reasonable amount of time. Understanding this type of waterdemand is critical to the development of a water budget framework. An estimate of the extentand variability of water use throughout the study area is required to identify the subwatershedsthat may be under the highest degree of potential hydrologic stress, and to guide future effortsto refine water budget tools in those areas (AquaResource, <strong>2012</strong>).The total consumptive water demand is estimated based on thefollowing components (AquaResource, <strong>2012</strong>):• Municipal water demand: municipal water demand estimates were generatedbased on pumping rates reported by municipalities, where available;• Permitted water demand: the Province of Ontario issues Permits to Take Water(PTTW) for water takings greater than 50,000 litres per day (L/d). Permittedwater demand was estimated using reported pumping rates from the 2009Water Taking Reporting System (WTRS) or by combining the permitted ratewith the months of expected active pumping. Consumptive factors were thenapplied to determine the amount of pumped water that is not returned to theoriginal source in a reasonable amount of time; and,• Non-permitted water demand: pumping rates for non-permitted takings werepro-rated by area based on the Tier One Stress Assessments (LSRCA, 2009a,2009b, 2009c).Table 4-5 shows the number of water takings within the <strong>Innisfil</strong> <strong>Creeks</strong> subwatershed. Theseestimates are used to compute the stress assessment in the following section.Future consumptive demand was also estimated for the subwatersheds not identified aspotentially stressed under existing conditions. After the consumptive demand was estimated aconsumptive factor was applied to determine the proportion of groundwater not returned to theoriginal source within a reasonable amount of time.Permitted water demandSection 34 of the Ontario Water Resources Act (OWRA) states that any person or businesstaking more than 50,000 litres of surface or groundwater per day are required by law to obtain aPTTW from the Ministry of the Environment, excluding water used for domestic, livestockwatering, or firefighting purposes.The most important source of consumptive demand information is the Ministry of Environment’sPermit to Take Water database and actual municipal water use data. Information from theMinistry’s 2009 Water Taking and Reporting System (WTRS) was used to estimate actual waterdemands for this assessment.Only permits representing sustained water takings were used in the assessment; temporarypermits such as pumping tests were not included. The PTTW program is now requiring users toreport actual pumping rates; however, this updated information was not available for this study.Chapter 4: Water Quantity – Surface and Groundwater 140
The <strong>Innisfil</strong> <strong>Creeks</strong> <strong>Subwatershed</strong> <strong>Plan</strong>Since the actual pumping rates were unavailable some considerations were taken into accountwhen using the database:1) Permit holders often request a volume that exceeds their requirements to be listed onthe permit. This is often done to ensure compliance in dry years, or to secure sufficientwater for possible future expansion.2) The permitted volume is often derived from the capacity of the pumping equipmentrather than the requirements of the user, which can drastically overestimate the user’sdemand.3) The database does not maintain a record of whether the permit is just for seasonal use.4) Multiple sources may be included on a particular permit, and the total refers to allsources associated with the permit. To estimate the total demand, the total permittedrate should be logically divided amongst the active source locations.5) The spatial location of the water taking sources is not always accurate.6) The PTTW database is not current with respect to the MOE’s actual permitting activities.7) Historic water takings may be “grandfathered” and do not require a permit. As a result,there may be some significant water takers not accounted for.Municipal Water UseMunicipal water supplies shown in Figure 4-12 represent the majority of the permitted use withinthe <strong>Innisfil</strong> <strong>Creeks</strong> subwatershed. As such, accurate estimates of municipal water use are acritical component of the consumptive water demand estimate. For this Tier Two StressAssessment, 2011 reported municipal pumping rates were obtained from the municipalities andin some cases the 2009 Water Taking Reporting System was used to obtain rates.Table 4-4 summarizes the municipal systems within the Tier Two Stress Assessment, as well asthe source and year of the reported pumping rates. The most recent reported rates were utilizedwhere multiple reported rates were available.Table 4-4: Summary of municipal systems (AquaResource, <strong>2012</strong>).Community Well Name Source of Data Average Annual Pumping Rate(m 3 /day) (L/s) (mm/yr)Goldcrest 77-2 Reported 2011 28 0.3 0.1088-1 Reported 2011 24 0.3 0.08Sandy CoveAcres**communal systemWell 1 WTRS 2009 185 2.1 0.63Well 2 WTRS 2009 183 2.1 0.62Well 3 WTRS 2009 190 2.2 0.65Total 698 8 2.38Chapter 4: Water Quantity – Surface and Groundwater 141
The <strong>Innisfil</strong> <strong>Creeks</strong> <strong>Subwatershed</strong> <strong>Plan</strong>Table 4-5: Monthly consumptive demand (AquaResource, <strong>2012</strong>).Permit NumberWellConsumptive Demand (m 3 /day)Jan Feb Mar Apr May Jun Jul Aug Sep Oct Nov Dec Avg Max00-P-1381 Goldcrest Well 1 22 11 27 28 23 41 56 38 28 18 15 22 27 5600-P-1381 Goldcrest Well 2 21 30 15 20 27 30 37 22 21 26 30 24 25 370206-7HFH8Q Golf Course Well 0 0 0 9 9 9 9 9 9 0 0 0 5 987-P-3008 Sandy Cove Well 1 185 185 185 185 185 185 185 185 185 185 185 185 185 18587-P-3008 Sandy Cove Well 2 182 182 182 182 182 182 182 182 182 182 182 182 182 18287-P-3008 Sandy Cove Well 3 190 190 190 190 190 190 190 190 190 190 190 190 190 190Unserviced Domestic 553 553 500 553 536 553 536 553 553 536 553 536 543 553Nonpermitted Agricultural 0 0 0 0 0 137 137 137 137 0 0 0 46 137Total 1263 1263 1210 1274 1266 1493 1510 1602 1493 1327 1276 1238 1342 1602Table 4-6: Percentage of consumptive water demand by sector (AquaResource, <strong>2012</strong>).AgriculturalCommercialIndustrialMiscellaneousRecreationRemediationPrivate WaterSupplyMunicipal WaterSupplyLivestock andRural DomesticTotal EstimatedTotal ReportedEst. Rep. Est. Rep. Est. Rep. Est. Rep. Rep. Est. Rep. Rep. Est. Est. Rep.- - 0.3% - - - - - - 43% - 54% 4% 54% 46%Notes: Est. = Estimated; Rep. = Reported; Totals may differ slightly due to rounding.Chapter 4: Water Quantity – Surface and Groundwater 142
RIDGE RD WMunicipal groundwater supplysystem within the <strong>Innisfil</strong><strong>Creeks</strong> subwatershed.Kempenfelt Bay<strong>Lake</strong><strong>Simcoe</strong>LegendFigure 4-12B A R R I EBIG BAY PT RDRoadMunicipal BoundarySIDERD 25Watercourse400 HWY NESSA RDLOCKHART RD10TH LINE!( Municipal Well<strong>Innisfil</strong> <strong>Creeks</strong><strong>Subwatershed</strong>YONGE STSIDERD 109TH LINEINNISFIL BEACH RD7TH LINE6TH LINEMETRO RD NBASELINE RDWOODBINE AVESIDERD 105TH LINESIDERD 5HWY 400 S4TH LINE3RD LINEG E O R G I N APOLLOCK RDI N N I S F I L2ND LINECOUNTY RD 8914TH LINELINE 13Cook'sBayGLENWOODS AVE0 0.5 1 2 3 4 5RAVENSHOE RDKilometresKThis product was produced by the <strong>Lake</strong> <strong>Simcoe</strong> <strong>Region</strong> Conservation Authority andsome information depicted on this map may have been compiled from various sources.While every effort has been made to accurately depict the information,data / mapping errors may exist.This map has been produced for illustrative purposes only.LSRCA GIS Services DRAFT created July 2010.© LAKE SIMCOE REGION CONSERVATION AUTHORITY, 2010. All Rights ReservedThe following datasets roads, municipal boundaries and Oak Ridges Moraine are© Queens Printer for Ontario, 2010. Reproduced with Permission
The <strong>Innisfil</strong> <strong>Creeks</strong> <strong>Subwatershed</strong> <strong>Plan</strong>Other Permitted Water DemandNon-municipal permitted water taking types included in the assessment are: agriculture,commercial, dewatering, industrial, miscellaneous, recreational, and remediation activities.Non-permitted water demandIn addition to permitted water use, there are various types of non-permitted water uses, such aslivestock watering and un-serviced domestic use (typically rural residents). Non-permittedagricultural and un-serviced domestic water were estimated as part of the Tier One WaterBudget and Stress Assessment (LSRCA, 2009). These estimates were utilized to quantify nonpermittedwater use for the existing Tier Two Stress Assessment and are shown in Table 4-7.Legal non-permitted estimated agriculture water demand includes water used for livestockwatering, equipment washing, and any other agricultural water use excluding water used forirrigation. Non-permitted agriculture water demand was estimated as part of the Tier One WaterBudgets and Stress Assessments (LSRCA, 2009).It should also be noted that since the non-permitted agriculture demand was based on acensus-based estimation technique it is not possible to accurately determine the source of waterused. For the Tier Two assessment it was assumed that half of the water would be suppliedfrom a surface source and half would be supplied from a groundwater source. The consumptivenature of non-permitted agriculture water use is also hard to determine, as the water can beused for so many different things. To be on the conservative side all non-permitted agriculturewater takings were assumed to be 100% consumptive.The unserviced domestic water use includes any household water use that is not supplied by amunicipal water source. An estimate of the unserviced domestic water use was calculated aspart of the Tier One Water Budgets and Stress Assessments. The estimates from the Tier Onewere also area pro-rated to the boundaries of the subwatershed. The unserviced domesticwater use was assumed to be 20% consumptive in the Tier Two assessment. This assumptionwas made because the majority of unserviced domestic water use comes from rural areas,supplied by private wells. Since these takers are generally in rural areas the water taken wouldbe returned to the groundwater system through the septic system.Table 4-7: Non-permitted agriculture and unserviced domestic water use (AquaResource, <strong>2012</strong>).Water Use(m 3 /day)Demand(L/s) (mm/yr)Non-Permitted Agricultural 46 0.5 0.2Un-serviced Domestic 543 6.4 1.9Total 589 6.9 2.0Monthly correction factor and consumption correction factorMonthly Usage FactorsMonthly estimates of water use are required to represent the seasonal changes in total wateruse across a subwatershed. All water demand reported in the Tier 2 Stress Assessments havebeen adjusted per Table 4-8, where 1 designates the permit is active, and 0 designates it isinactive. This facilitates the estimate of actual water used in a subwatershed, as it recognizesthat many types of water taking operations only take water during a specific time period eachyear (e.g., snow making generally is active December, January, and February).Chapter 4: Water Quantity – Surface and Groundwater 144
The <strong>Innisfil</strong> <strong>Creeks</strong> <strong>Subwatershed</strong> <strong>Plan</strong>Consumptive Use FactorsWater consumption refers to the amount of water removed from a hydrological system and notreturned back to the same system in a reasonable time period. To assess the portion of pumpedwater that is being removed from the hydrologic system, estimates of water demand mustconsider consumptive use, as opposed to the total amount of water that may be pumped from asystem (AquaResource and Golder, 2010).Estimating consumptive water demand requires a proper consideration of scale, as well as thephysical water taking operation. Some water takers may have large extraction volumesassociated with their permits while actually consuming very little of that water. As an example,aggregate washing operations are permitted to pump large volumes of water between washingand settling ponds, and a relatively small percentage is lost to evaporation, or is removed offsitewithin the washed material. Another example is a dewatering activity where groundwater that ispumped to lower the water table is discharged to a nearby creek. At the scale of asubwatershed very little of this water is actually consumed; however, this water taking would befully consumptive with respect to the pumped aquifer (AquaResource and Golder, 2010).The percent water demand calculation requires the estimate of water which is consumed andnot returned to the original source within a reasonable amount of time. Therefore, for agroundwater assessment, if water is removed from the groundwater system and not returned tothe groundwater system, the taking is assumed to be 100% consumptive. Groundwater takingsare typically 100% consumptive, since wastewater is seldom returned to the groundwatersystem, but rather discharged to surface water systems. Exceptions would include irrigation,where a portion of the applied irrigation water would saturate surficial soils and percolatebeneath the evaporative root zone, returning to the groundwater system.Table 4-9 provides a list of consumptive use factors (MOE, 2007) that are used for water takingswhere water is returned to the same source from which it is taken. These values correspond tothe ‘Specific Purpose’ assigned by the MOE to each permit. Where water was not returned tothe same source, a consumptive factor of 1 is used. While these factors are generalized, theyprovide a consistent approach for the initial estimation of consumptive water use. It isrecognized that within a specific water use sector the proportion of pumped water consumedmay significantly vary between individual operations; the generalized factors, presented in Table4-9, represent a significant source of uncertainty. As such, they were modified as part of asensitivity analysis to ensure the uncertainty does not affect the stress level assignment.Table 4-8: Monthly demand adjustments based on active months of taking (MOE, 2007).GeneralPurposeAgriculturalSpecificPurposeField and PastureCropsJan Feb Mar Apr May Jun Jul Aug Sep Oct Nov Dec0 0 0 0 0 1 1 1 1 0 0 0Agricultural Fruit Orchards 0 0 0 0 0 1 1 1 1 0 0 0AgriculturalMarketGardens/Flowers0 0 0 0 0 1 1 1 1 0 0 0Agricultural Nursery 0 0 0 0 0 1 1 1 1 0 0 0Agricultural Other - Agricultural 0 0 0 0 0 1 1 1 1 0 0 0Agricultural Sod Farm 0 0 0 0 0 1 1 1 1 0 0 0Agricultural Tender Fruit 0 0 0 0 0 1 1 1 1 0 0 0Agricultural Tobacco 0 0 0 0 0 1 1 1 1 0 0 0Chapter 4: Water Quantity – Surface and Groundwater 145
The <strong>Innisfil</strong> <strong>Creeks</strong> <strong>Subwatershed</strong> <strong>Plan</strong>GeneralPurposeSpecificPurposeJan Feb Mar Apr May Jun Jul Aug Sep Oct Nov DecCommercial Aquaculture 1 1 1 1 1 1 1 1 1 1 1 1Commercial Bottled Water 1 1 1 1 1 1 1 1 1 1 1 1CommercialGolf CourseIrrigation0 0 0 0 0 1 1 1 1 0 0 0Commercial Mall / Business 1 1 1 1 1 1 1 1 1 1 1 1Commercial Other - Commercial 1 1 1 1 1 1 1 1 1 1 1 1Commercial Snowmaking 1 1 0 0 0 0 0 0 0 0 0 1ConstructionOther -Construction1 1 1 1 1 1 1 1 1 1 1 1Construction Road Building 1 1 1 1 1 1 1 1 1 1 1 1Dewatering Construction 1 1 1 1 1 1 1 1 1 1 1 1Dewatering Other - Dewatering 1 1 1 1 1 1 1 1 1 1 1 1Dewatering Pits and Quarries 1 1 1 1 1 1 1 1 1 1 1 1Industrial Aggregate Washing 0 0 0 0 1 1 1 1 1 1 1 0Industrial Cooling Water 1 1 1 1 1 1 1 1 1 1 1 1Industrial Food Processing 1 1 1 1 1 1 1 1 1 1 1 1Industrial Manufacturing 1 1 1 1 1 1 1 1 1 1 1 1Industrial Other - Dewatering 1 1 1 1 1 1 1 1 1 1 1 1Industrial Other - Industrial 1 1 1 1 1 1 1 1 1 1 1 1Industrial Pipeline Testing 1 1 1 1 1 1 1 1 1 1 1 1Institutional Other - Institutional 1 1 1 1 1 1 1 1 1 1 1 1Institutional Schools 1 1 1 1 1 1 0 0 1 1 1 1MiscellaneousDams andReservoirs1 1 1 1 1 1 1 1 1 1 1 1Miscellaneous Heat Pumps 1 1 1 1 1 1 1 1 1 1 1 1MiscellaneousOther -Miscellaneous1 1 1 1 1 1 1 1 1 1 1 1Miscellaneous Pumping Test 1 1 1 1 1 1 1 1 1 1 1 1MiscellaneousWildlifeConservation1 1 1 1 1 1 1 1 1 1 1 1Missing Missing 1 1 1 1 1 1 1 1 1 1 1 1RecreationalOther -Recreational1 1 1 1 1 1 1 1 1 1 1 1Recreational Wetlands 1 1 1 1 1 1 1 1 1 1 1 1Remediation Groundwater 1 1 1 1 1 1 1 1 1 1 1 1RemediationOther -Remediation1 1 1 1 1 1 1 1 1 1 1 1Water Supply Campgrounds 0 0 0 0 1 1 1 1 1 0 0 0Water Supply Communal 1 1 1 1 1 1 1 1 1 1 1 1Water Supply Municipal 1 1 1 1 1 1 1 1 1 1 1 1Water SupplyOther - WaterSupply1 1 1 1 1 1 1 1 1 1 1 1Chapter 4: Water Quantity – Surface and Groundwater 146
The <strong>Innisfil</strong> <strong>Creeks</strong> <strong>Subwatershed</strong> <strong>Plan</strong>Table 4-9: Consumptive use factors (MOE, 2007).CategoryAgriculturalSpecific PurposeConsumptiveFactorCategory Specific Purpose ConsumptiveFactorField and PastureCrops 0.80 Institutional Hospitals 0.25Agricultural Fruit Orchards 0.80 Institutional Other - Institutional 0.25Market Gardens /Agricultural Flowers 0.90 Institutional Schools 0.25Agricultural Nursery 0.90 Miscellaneous Dams and Reservoirs 0.10Agricultural Other - Agricultural 0.80 Miscellaneous Heat Pumps 0.10Agricultural Sod Farm 0.90 Miscellaneous Other - Miscellaneous 1.00Agricultural Tender Fruit 0.80 Miscellaneous Pumping Test 0.10Agricultural Tobacco 0.90 Miscellaneous Wildlife Conservation 0.25Commercial Aquaculture 0.10 Recreational Aesthetics 0.25Commercial Bottled Water 1.00 Industrial Manufacturing 0.25Golf CourseCommercial Irrigation 0.70 Industrial Other - Industrial 0.25Commercial Mall / Business 0.25 Industrial Pipeline Testing 0.25Other -Commercial Commercial 1.00 Industrial Power Production 0.10Commercial Snowmaking 0.50 Recreational Fish Ponds 0.25Other -Construction Construction 0.75 Recreational Other - Recreational 0.10Construction Road Building 0.75 Recreational Wetlands 0.10Dewatering Construction 0.25 Remediation Groundwater 0.50Dewatering Other - Dewatering 0.25 Remediation Other – Remediation 0.25Dewatering Pits and Quarries 0.25 Water Supply Campgrounds 0.20IndustrialAggregateWashing 0.10 Water Supply Communal 0.20IndustrialBrewing and SoftDrinks 1.00 Water Supply Municipal 0.20Industrial Cooling Water 0.25 Water Supply Other - Water Supply 0.20Industrial Food Processing 1.004.3.3 Water reserve estimationWithin the Technical Rules (MOE, 2008a) water reserve is defined as the water that is requiredto be “protected” to support other uses within the watershed including ecosystem needs andother human uses such as sewage assimilation, hydroelectric power production, and navigation.This reserve value is calculated as 10% of groundwater discharge. Ecological needs includesustaining groundwater discharge to sensitive coldwater fish habitat. The reserve quantity issubtracted from the total water source supply prior to evaluating the percent water demand. Forsurface water, within subwatershed that have gauged flow stations, the 10th percentile ofstream flow (Q90) was used as the reserve value. For surface water within ungaugedsubwatershed the Tessmann (1980) method was used to estimate instream flow, which isdocumented in the Guidance Module 7 (MOE, 2007).Chapter 4: Water Quantity – Surface and Groundwater 147
The <strong>Innisfil</strong> <strong>Creeks</strong> <strong>Subwatershed</strong> <strong>Plan</strong>Surface water reserve estimationThe methods recommended to estimate the water reserve include 10th percentile streamflow(Q90), which has been used within gauged subwatershed. This flow value is mostrepresentative for reserve, as it is the flow value that is exceeded 90 percent of the time.Within ungauged subwatershed, the Tessmann method has been applied to estimatestreamflow values. Tessmann (1980) adapted Tennant’s (1976) seasonal flowrecommendations to calibrate the percentage of monthly available flow to local hydrologic andbiologic conditions including monthly variability.As noted within the MOE Guidance Module 7 (MOE, 2007), when using the Tessmann methodthe estimated reserve value may be larger than the water supply calculated for summer lowflows. To mitigate this, a reserve value of 30% of the monthly streamflow would be applied inplace of the Tessmann equation. This has been done based on the MOE Guidance Module 7(MOE, 2007), which indicates that this reserve value is designed to add a buffer to alreadyconservative percent demand thresholds.Groundwater reserve estimationThe Guidance Module recognized that groundwater discharge to streams must be maintained tosustain baseflow throughout a watershed. Instream flow requirements are used to estimate theecological component of the surface water reserve term for the Tier 2 stress assessment. As itis difficult to separate out the groundwater and surface water components of the instreamrequirements, Technical Rule 3 (MOE, 2008a), indicates that 10% of the existing groundwaterdischarge should be considered as the groundwater reserve component for each subwatershed.Groundwater discharge has been calculated using a baseflow separation technique, for gaugedand simulated stream hydrographs. It is recognized that preserving 10% of baseflow is asimplified approach to preserving ecological requirements. Future work on determining instreamflow needs will have to focus on identifying a flow regime that captures the range of seasonalhigh and seasonal low flows.Chapter 4: Water Quantity – Surface and Groundwater 148
The <strong>Innisfil</strong> <strong>Creeks</strong> <strong>Subwatershed</strong> <strong>Plan</strong>Key points – Current Hydrogeologic and Water Quantity Status:• The physical properties of a watershed, such as drainage area, slope, geology,and land use can influence the distribution of the water and the processes thatfunction within a watershed.• Monitoring groundwater levels can characterize baseline conditions, and assesshow groundwater is affected by climate change, seasonal fluctuation, and land andwater use. Monitoring groundwater levels can help to identify trends and emergingissues, and can provide a basis for making informed resource managementdecisions, measure the effectiveness of the programs and policies that aredesigned to protect these groundwater resources.• A refined understanding of the aquifer systems and groundwater flow as part of thesubwatershed components and processes is vital in maintaining the ecologicalbalance and sustainability of resources within a watershed.• The water level maps for the subwatershed show that there are cross boundarygroundwater flows within the <strong>Innisfil</strong> <strong>Creeks</strong> subwatershed that support the aquifersystem.• Groundwater discharge is the main component of streamflow during dry periodsand as such maintains an environment that allows cold water fish to survive evenduring the dry summer months.• Groundwater recharge can be described as areas that can effectively move waterfrom the surface through the unsaturated soil zone to replenish availablegroundwater resources. The mapping of these recharge zones show that the mostsignificant recharge within the subwatershed occur within the western portion ofthe subwatershed and is associated with high permeability (sand & gravel)materials.4.4 Factors impacting status - stressorsLand use change, increased water use, short-term summer droughts and long-term climatechange can all result in stress on the quantity of water within a watershed. Potential impacts ofthese stressors include reduced groundwater recharge or discharge, increased surface waterrunoff, well interferences and changes to groundwater flow patterns and groundwater-surfacewater interaction.The purpose of completing a water budget and water quantity stress assessment is todetermine if the watershed can support current or future water takings without exhibiting acontinued long-term decline in groundwater levels or surface water flow. The most basicdefinition of stress is whether a watershed can support the current levels of pumping withoutexhibiting a continued long term decline in water levels.4.4.1 Water demandSeveral water budget initiatives have been undertaken to identify potential water quantity stresswithin the subwatershed. The indicators of stress presented in this report are based on thesestudies and more information can be obtained from AquaResource (<strong>2012</strong>).Chapter 4: Water Quantity – Surface and Groundwater 149
The <strong>Innisfil</strong> <strong>Creeks</strong> <strong>Subwatershed</strong> <strong>Plan</strong>Considerable effort was made in the Tier 1 (LSRCA, 2009), Tier 2 (AquaResource, <strong>2012</strong>), andongoing Tier 3 (AquaResources et al., 2010) water budgets discussed in previous sections todocument the various sources of water demand. Table 4-5 and Table 4-6 summarize themonthly consumptive demand by subwatershed and the percentage of Consumptive WaterDemand by Sector per subwatershed. The values contained within Table 4-5 are the sum of theconsumptive demand associated with PTTWs (municipal and non-municipal) as well as nonpermittedagricultural demand and un-serviced domestic demand.The subwatershed consumptive water demand is examined in more detail in Table 4-6, whichpresents the percent of average consumptive water demand used by water use sectors, brokendown by subwatershed. Also included in Table 4-6 is the proportion of consumptive demandthat is derived from reported values, as well as the portion that is estimated by informationcontained within the PTTW database.Municipal water supply is the water use sector with the largest consumptive water demand. Theonly other water use sectors are agricultural and a golf course.Water demand estimates generated through use of reported (actual) pumping rates from theWTRS provide more-reliable estimates of the consumptive demand. As shown in Table 4-6,nearly half of the consumptive water demand for the subwatershed is based on reported rates.Municipal Water SuppliesTable 4-4 discusses the municipal water supply systems found within the study area. There aretwo municipal and one communal groundwater supply systems within the study area thatservice the Goldcrest and Sandy Cove Acres communities. The municipal water takings accountfor approximately 54% of the estimated total groundwater taking within the <strong>Innisfil</strong> <strong>Creeks</strong>subwatershed. Municipal well locations are shown on Figure 4-12.Future municipal water demand was estimated from a variety of sources. In municipalities withlong term Water Supply <strong>Plan</strong>s, future average daily water demand was obtained directly frommunicipalities. For the <strong>Innisfil</strong> municipal water supply systems, projected average daily pumpingrates were not available, but projected maximum daily pumping rates were presented. Themaximum daily rates, however, do not represent typical long-term pumping conditions andtherefore are not appropriate for use in the stress assessment. For these systems, themaximum daily rate was scaled down by a peaking factor of 2.5 to obtain estimates of averagefuture demand. A peaking factor of 2.5 is the average peaking factor (i.e., ratio of maximum toaverage demand) for all municipal systems in the Tier Two Stress Assessment where bothaverage and maximum daily pumping rates were available.Where future water demand was not directly available, it was estimated by applying either futurepopulation growth estimates, or by applying residential development plans to existing averagedaily per capita water use for each municipal water system. Future population estimates wereavailable for the Town of <strong>Innisfil</strong>. It was assumed that each residential unit houses 2.6 personsas per Statistics Canada 2006 Census for Ontario, and that each person uses 348 L/day as perthe combined residential and commercial water use rate for the City of Barrie in theEnvironment Canada 2004 Municipal Water Use Database.Other Permitted UsesTable 4-6 outlines the permitted groundwater takings by subwatershed and by water use sector.For <strong>Innisfil</strong> <strong>Creeks</strong> subwatershed there are five non-municipal permits in the subwatershed.Chapter 4: Water Quantity – Surface and Groundwater 150
The <strong>Innisfil</strong> <strong>Creeks</strong> <strong>Subwatershed</strong> <strong>Plan</strong>4.4.2 Land UseIt is important to consider land cover within a water budget study because it affects severalaspects of the water budget including surface water runoff, evaporation, and infiltration.Developed land generally has a higher proportion of impervious surface, such as roadways,parking lots, and building roofs. Increased runoff rates result in erosion and reduced infiltrationto recharge groundwater reserves. The potential for the introduction of contaminants to bothgroundwater and surface water must be a consideration when a new land use is beingproposed. Each type of land use can affect the quantity of both ground and surface water in thesubwatershed.Natural land cover and land use was simulated in the water budget using Ecological LandClassification (ELC) data provided by the LSRCA. The land use data is used within the waterbudget analysis to provide a more accurate estimate of groundwater recharge within the studyarea. Land use has been discussed in more detail within Section 2.2.2The land use within the <strong>Innisfil</strong> <strong>Creeks</strong> subwatershed has been divided up into 12 classesincluding intensive and non-intensive agriculture, rural development, industrial, and naturalheritage features (Figures 2-2 and 2-3 in Chapter 2 – Study Area and Physical Setting). Landuses with less than 0% coverage of a subwatershed were not reported.Land use in the <strong>Innisfil</strong> <strong>Creeks</strong> subwatershed is currently dominated by agriculture (45%) andnatural heritage cover (33%). Urban areas account for 15% of the subwatershed land use,including commercial, estate residential, institutional, and other various land uses. Other landuses occupying smaller areas include commercial (0.3%), industrial (0.3%), aggregate (0.5%),institutional (0.5%), and manicured open space (0.5%).Land use and Significant Groundwater Recharge AreasSignificant Groundwater Recharge Areas (SGRAs) can be described as areas that caneffectively move water from the surface through the unsaturated soil zone to replenish availablegroundwater resources. These areas should be protected to maintain the quantity and quality ofgroundwater required by a healthy subwatershed. The mapping of these recharge zones canaid policy development required for land development applications. Future land developmentplans should focus on promoting land use activities that maintain and protect the rechargeoccurring within the SGRAs.Figure 4-13 shows the land use distribution within the SGRA portion of the <strong>Innisfil</strong> <strong>Creeks</strong>subwatershed. As shown on the figure the subwatershed contains very low levels of impervious(hardened) surfaces due the urban areas. Urban land uses (urban, institutional, industrial, andcommercial) comprise approximately 7% of the landuses within the SGRAs, most of which arewithin the Alcona area.Natural heritage features also comprise approximately 46% of the landuse within the SGRAs.The natural heritage features leave the landscape in a natural state promoting infiltration.Intensive and non-intensive agriculture account for approximately 38% of landuse within thesubwatershed.Future land use projectionsIn addition to future water demand estimates, future water supply was also estimated for waterbudget purposes. This was accomplished by modifying the recharge rates according toprojected changes in urban land use. Recharge modification for future conditions was assumedto be based on the change in urban area alone. For the subwatershed, the total rechargeChapter 4: Water Quantity – Surface and Groundwater 151
The <strong>Innisfil</strong> <strong>Creeks</strong> <strong>Subwatershed</strong> <strong>Plan</strong>volume was decreased, assuming that any additional urbanized area would have 50%impervious cover.Chapter 4: Water Quantity – Surface and Groundwater 152
RIDGE RD WKempenfelt BayStrahallan Creek<strong>Lake</strong><strong>Simcoe</strong>Spatial distribution of land usewithin Significant GroundwaterRecharge AreasLegendFigure 4-13BARRIEBIG BAY PT RDSandy CoveCreekMooselankaCreekRoadMunicipal BoundaryWatercourseSIDERD 25400 HWY NESSA RDSIDERD 5SIDERD 10LOCKHART RD10TH LINE9TH LINEINNISFIL BEACH RDSIDERD 107TH LINE6TH LINEYONGE ST5TH LINE4TH LINEBanksLeonard'sAlcona!Bon Secours<strong>Innisfil</strong><strong>Creeks</strong>Belle AireCarsonWilsonCreek!LefroyCreekCreekCreekCedarCreekCreekCreekMoyer CreekSylvan CreekMETRO RD NWARDEN AVEWOODBINE AVEBASELINE RDGEORGINAPOLLOCK RD<strong>Innisfil</strong> <strong>Creeks</strong><strong>Subwatershed</strong>Land UseUrbanRuralNatural CoverGolf CourseAggregateHWY 400 S3RD LINEINNISFIL2ND LINECOUNTY RD 8914TH LINELINE 13White BirchCreekUpper MarshGilford!GilfordCreekCreekCook'sBayGLENWOODS AVERAVENSHOE RD0 0.5 1 2 3 4 5KilometresKThis product was produced by the <strong>Lake</strong> <strong>Simcoe</strong> <strong>Region</strong> Conservation Authority andsome information depicted on this map may have been compiled from various sources.While every effort has been made to accurately depict the information,data / mapping errors may exist.This map has been produced for illustrative purposes only.LSRCA GIS Services DRAFT TF created November 2011.© LAKE SIMCOE REGION CONSERVATION AUTHORITY, 2010. All Rights ReservedThe following datasets roads, municipal boundaries and Oak Ridges Moraine are© Queens Printer for Ontario, 2010. Reproduced with Permission
The Barrie <strong>Creeks</strong>, Lovers Creek and Hewitt’s Creek <strong>Subwatershed</strong> <strong>Plan</strong>4.4.3 ClimateThe climate of the <strong>Innisfil</strong> <strong>Creeks</strong> subwatershed directly determines the quantity of surface andgroundwater present in the system. When the spring melt occurs, a large volume of water isreleased. This water will first infiltrate the ground. When the soil becomes supersaturated theremaining water will flow overland until it reaches the tributaries and main branch of the river.The temperature in the subwatershed can directly affect the quantity of water present in thesystem. In the cold winter months the water is frozen at the surface so the quantity of availablewater is reduced. In the hot summer months the water is flowing but an overall loss is occurringdue to the high rates of evaporation.4.4.4 Water Budget Stress AssessmentsPotential water quantity stress is being estimated on a subwatershed scale through the SourceProtection <strong>Plan</strong>ning process. Several water budget initiatives have been undertaken to identifypotential water quantity stress within the subwatershed. The indicators of stress presented inthis report are based on the <strong>Innisfil</strong> Tier 2 study by AquaResources (<strong>2012</strong>).The approach for conducting a Tier Two Stress Assessment is outlined in the Province’sGuidance Module for Water Budget and Water Quantity Risk Assessment (MOE, 2011). ThisGuidance Document prescribes an approach for estimating subwatershed stress based onestimates of water supply, water reserve, and water demand in each subwatershed. While theTechnical Rules (MOE, 2009) and the Guidance Module (MOE, 2011) provide a standardapproach for carrying out the Tier Two Stress Assessment, this approach was tailored for the<strong>Innisfil</strong> Tier 2 study within the context of the <strong>Lake</strong> <strong>Simcoe</strong> Protection <strong>Plan</strong>, in which theinterconnection of groundwater to surface water features are a priority (AquaResource, <strong>2012</strong>).The stress assessment evaluates the ratio of the consumptive demand for permitted and nonpermittedusers to water supplies, minus water reserves, within each subwatershed andcalculated using the equation shown in following blue text box. The major components of thewater budget have been estimated and tabulated as described in the preceding sections,including water supply, water demand, and water reserve.The percentage of quantity demand can be expressed as in the followingequation:% WaterDemand =Qwhere:SUPPLYQ− QDEMANDRESERVEQ Demand = amount of water consumed (pumped);Q Supply = recharge plus lateral groundwater inflow into the subwatershed(Qr + Qin); andQ Reserve = the portion of available surface water or groundwater reservedfor other needs such as navigation, assimilative capacity, andecosystem health. This is estimated as 10% of the modelChapter 4: Water Quantity – Surface and Groundwater 154
The Barrie <strong>Creeks</strong>, Lovers Creek and Hewitt’s Creek <strong>Subwatershed</strong> <strong>Plan</strong>For groundwater systems, the stress assessment calculation is carried out for the averageannual demand conditions and for the monthly maximum demand conditions; groundwatersupply is considered constant under both these conditions. The stress level for groundwatersystems is also categorized into three levels (significant, moderate, or low) according to thethresholds listed in Table 4-10.Table 4-10: Groundwater potential stress thresholdsGroundwater Potential Stress LevelAssignmentAverage AnnualPercent Water DemandMonthly MaximumPercent Water DemandSignificant > 25% > 50%Moderate > 10% > 25%Low 0 – 10% 0 – 25%The Tier 2 Water Budget for the <strong>Innisfil</strong> <strong>Creeks</strong> subwatershed (AquaResource, <strong>2012</strong>) conductedPercent Water Demand calculation for three different demand scenarios: 1) existing waterdemand; 2) planned water demand; and 3) future water demand estimates. Under eachscenario, the potential for stress is evaluated by comparing the amount of water consumed(consumptive water demand) with the amount of water available (water supply). Only thosesubwatersheds identified as having a low potential for stress under the existing demand requireassessment for the planned and future demand scenarios (i.e., once a subwatershed stressassessment is determined to be moderate or significant, further scenarios are not warranted).Once the existing, planned, and future demand scenarios have been completed, thesubwatersheds still classified as having a low potential for stress are subject to the droughtassessment scenario. Typically, the drought scenario involves evaluating the ability of theexisting or planned wells to maintain the ability to meet demand throughout potential droughtconditions (a two-year and ten-year period of drought). However, for the purposes of the LSPP,the Drought Assessment Scenario involves selecting short (two-year) periods of lowprecipitation, and assessing the impacts on discharge to surface water features.The two-year drought is a form of initial screening scenario to evaluate a short term droughtcondition. For simplicity, this drought period is simulated by removing all groundwater rechargeover a two-year period. If the screening scenario shows possible impacts on groundwater levelsover the two-year period, a drought scenario should be completed using a longer term (i.e., tenyears) climate period that represents historical drought conditions.The Percent Water Demand scenarios were based on subwatershed-wide demand and supply;whereas the drought assessment scenario is based on the available water supply to surfacewater features.Existing ConditionsThe percent water demand was calculated for the <strong>Innisfil</strong> <strong>Creeks</strong> subwatershed using estimatesof groundwater supply, reserve, and consumptive demand as discussed in previous sections.Table 4-11 shows these values and the results of the stress assessment calculation.As seen in Table 4.4, potential for stress levels using the Percent Water Demand under existingconditions is low. Therefore, further analysis under future conditions is warranted. A comparisonto the Tier One stress assessment shows that the level of risk is comparable. The groundwaterconsumption in 2011 compared to that in 2008 is slightly lower, due to the switch to a surfacewater drinking water supply within the town of Alcona.Chapter 4: Water Quantity – Surface and Groundwater 155
The Barrie <strong>Creeks</strong>, Lovers Creek and Hewitt’s Creek <strong>Subwatershed</strong> <strong>Plan</strong>Table 4-11: Stress assessment components and percent water demand – existing conditions(AquaResource, <strong>2012</strong>).Groundwater SupplyConsumptive DemandWater Demand %ComponentFlow (m 3 /day)Recharge 63,500Flow In 1,650Total 65,150Groundwater Reserve 4,390Annual Average 1,291Monthly Max 1,602Annual Average 2%Monthly Max 3%Future ConditionsThe future water demand scenario evaluates future consumptive water demand estimates for afuture population throughout each municipality’s planning horizon. The projected municipaldemand was obtained from the local municipalities. In areas where projections were unavailablefuture pumping rates were estimated from official growth plans and population estimates. Futuredemand estimates were estimated within the subwatershed using a peaking factor of 2.5. Thewater supply component was computed using future land use projections to estimate changesin groundwater recharge. Water reserve and groundwater inflows were assumed to remainunchanged from existing conditions.As the non-municipal demand remained unchanged from existing conditions, the futureconsumptive demand was estimated by combining the future municipal demand estimateswith the existing non- municipal demand estimates, under both average and monthly maximumconditions. The future maximum monthly municipal demand was estimated by applying amaximum-monthly factor of 1.5 to the average annual municipal demand. The maximummonthlyfactor of 1.5 is the average maximum- monthly factor for all municipal systems in thissubwatershed where actual (reported) monthly takings were available under existingconditions. In other words, on average under existing conditions, the monthly maximumpumping rate was 1.5 times the average annual pumping rate within the Study Area. This factoris assumed to be the same under future conditions. The future municipal and non-municipaldemand were added together to obtain overall future consumptive water demand estimates(AquaResource, <strong>2012</strong>).In addition to future water demand estimates, future water supply was also estimated. This wasaccomplished by modifying the recharge rates according to projected changes in urban land use.Recharge modification for future conditions was assumed to be based on the change in urbanarea alone. For this subwatershed, the total recharge volume was decreased by 4%, basedon estimates supplied in the SGBWLS project and assuming that any additional urbanizedarea would have a 50% impervious cover. The projected groundwater recharge rates wereused with the groundwater flow in under existing conditions as the water supply term for thePercent Water Demand under future conditions (AquaResource, <strong>2012</strong>).The results of the Percent Water Demand (Table 4-12) under future conditions indicate that the potential for stress is low.Chapter 4: Water Quantity – Surface and Groundwater 156
The Barrie <strong>Creeks</strong>, Lovers Creek and Hewitt’s Creek <strong>Subwatershed</strong> <strong>Plan</strong>Table 4-12: Stress assessment components and percent water demand – future conditions(AquaResource, <strong>2012</strong>).ComponentFlow (m 3 /day)Groundwater Supply Recharge 60,960Flow In 1,650Total 62,610Groundwater Reserve 4,390Consumptive Demand Future 1,642Monthly Max 2,540Water Demand % Annual Average 3%Monthly Max 4%Drought ScenarioAccording to the Technical Rules (MOE, 2009), subwatersheds can also be identified ashaving a potential for moderate stress if water levels at pumping wells (Rule 35.2.e) are notsufficient for either normal operation or requires shutdown. The Technical Rules identify a twoyearand a ten-year drought scenario (Rule 35.2.f/g) to identify these risks. These scenariosare designed to capture probable periods of drought conditions; both short- and long- durationdroughts. For the purpose of this study, the same scenarios were designed, but as a tool toanalyze the effect of drought on the health of local streams and wetlands, rather than atpumping wells (AquaResource, <strong>2012</strong>).The two-year drought scenario represents a situation where groundwater recharge is eliminatedfor a period of two years, while pumping is maintained at average conditions. Similarly, the tenyeardrought scenario involves transient groundwater flow modelling using estimated monthlyrecharge rates over a prolonged drought period. For both, initial conditions for the transientgroundwater flow model should be equal to the current steady-state calibrated conditions. Atthe end of the drought scenario period, baseflows are compared to current steady stateconditions to quantify a relative decrease in discharge to the streams from the groundwatersystem.Two Year Drought AnalysisThe two-year drought was performed by removing all recharge to the <strong>Innisfil</strong> <strong>Subwatershed</strong> (andsurrounding area) and running the model transiently for two years. Table 4-13 indicates thecurrent discharge conditions, the discharge condition after two years of decreased recharge andthe percent difference in each surface water feature within the Study Area. Figure 4.2 shows amap of where these impacts occur.As seen in the above results, all of the creeks and wetlands experienced drastic decreases indischarge throughout the two year drought scenario. However, a scenario in which rechargeis eliminated entirely for two years is unlikely, therefore, the ten-year drought scenario iswarranted to further quantify the impacts on surface water features.Chapter 4: Water Quantity – Surface and Groundwater 157
The Barrie <strong>Creeks</strong>, Lovers Creek and Hewitt’s Creek <strong>Subwatershed</strong> <strong>Plan</strong>Table 4-13: Two year drought results (AquaResource, <strong>2012</strong>).Water Body SteadyStateFlux Drought Flux Percent ReductionBanks Creek (#5) -200.30 -0.04 100%Belle Aire Creek (#7) -56.37 -0.17 100%Big Bay Point Wetland -9.31 0.00 100%Bon Secours Creek (#4) -957.88 -17.11 98%Carson Creek (#8) -76.09 -0.29 100%Gilford Creek -18.08 0.00 100%Holland Marsh Wetland -6,236.83 0.00 100%Leonard's Beach Swamp -1,747.29 0.00 100%Leonard's Creek (#3) -605.93 -16.99 97%Little Cedar Point Wetland -5,878.21 -356.19 94%Mooselanka Creek (#2) -18.10 -0.02 100%Sandy Cove Creek (#1) -6,738.34 -26.90 100%Unnamed <strong>Innisfil</strong> Wetland -477.27 0.00 100%Upper Marsh Creek -1.37 0.00 100%White Birch Creek (#10) -250.31 -0.20 100%Wilson Creek (#9) -223.34 -0.01 100%Wilson Creek Marsh -1,228.97 0.00 100%Ten Year Drought AnalysisThis section will be updated pending the completion of a revised report from the consultantswho are undertaking this analysis.Chapter 4: Water Quantity – Surface and Groundwater 158
The Barrie <strong>Creeks</strong>, Lovers Creek and Hewitt’s Creek <strong>Subwatershed</strong> <strong>Plan</strong>Figure 4-14: Two year drought analysis: impacts to streams and wetlands (AquaResource, <strong>2012</strong>).Chapter 4: Water Quantity – Surface and Groundwater 159
The Barrie <strong>Creeks</strong>, Lovers Creek and Hewitt’s Creek <strong>Subwatershed</strong> <strong>Plan</strong>Key points – Factors impacting Water Quantity status - stressors:• The water demand estimates for the <strong>Innisfil</strong> <strong>Creeks</strong> subwatershed suggest thatwater demand is relatively uniform over the year, within minor increases during thesummer months, due to the majority of water supply being used for municipal andcommercial purposes.• The average annual groundwater demand from all sources in the <strong>Innisfil</strong> <strong>Creeks</strong>subwatershed is 471,215 m 3 /yr.• Municipal water supply accounts for 54% of the consumption within the <strong>Innisfil</strong><strong>Creeks</strong> subwatershed, while livestock and rural domestic use accounts for 4% and43% respectively.• Within the significant groundwater recharge areas, the <strong>Innisfil</strong> <strong>Creeks</strong>subwatershed is dominated by agricultural activities and natural cover with a limitedamount of urban areas.• The Tier 2 water budget estimated the current groundwater use for the Barrie<strong>Creeks</strong> subwatershed is 471,215 m 3 /yr, which represents 3% of the availableannual groundwater supply.• The Tier 2 water budget confirmed the stress assessment completed for the Tier 1and indicated that the <strong>Innisfil</strong> <strong>Creeks</strong> subwatershed is not stressed from agroundwater perspective.• Initial work on setting targets for maintaining flow regimes that are sufficient to meetecological needs has been completed for the neighbouring Lovers Creek; howevermore work needs to be done to in Lovers Creek to fully understand the flowregimes and finalize the methodology before the process is initiated and targetscan be set in the <strong>Innisfil</strong> <strong>Creeks</strong> subwatershed.Chapter 4: Water Quantity – Surface and Groundwater 160
The <strong>Innisfil</strong> <strong>Creeks</strong> <strong>Subwatershed</strong> <strong>Plan</strong>4.5 Current Management Framework4.5.1 Protection and policyThere are numerous acts, regulations, policies and plans aimed at maintaining or improvingwater quantity. These include the Provincial Policy Statement, the Ontario Water ResourcesAct, the Growth <strong>Plan</strong> for the Greater Golden Horseshoe, the <strong>Lake</strong> <strong>Simcoe</strong> Protection <strong>Plan</strong>, andthe Clean Water Act.This management framework relates to many different stressors that can potentially affect waterquantity, ranging from the urban development to the demand for water resources. Table 4-15categorizes four such stressors, recognizing that many of these activities overlap and that thelist is by no means inclusive of all activities. The legal effects of the various Acts, policies, andplans on the stressors is categorized as ‘existing policies in place’, or ‘no applicable policies’.The policies included in the table include those which have legal standing and must beconformed to, or policies (such as some of those under the <strong>Lake</strong> <strong>Simcoe</strong> Protection <strong>Plan</strong>) whichcall for the development of further management tools, research or education programs.Readers interested in the details of these regulations, policies, and plans are directed to readthe original documents.Table 4-14: Summary of current regulatory framework as it relates to the protection andrestoration of water quantityStressor affectingwater quantity<strong>Lake</strong> <strong>Simcoe</strong> Protection<strong>Plan</strong> (2009)Growth <strong>Plan</strong> for theGreater GoldenHorseshoe (2006)Provincial PolicyStatement (2005)Ontario Water ResourcesAct (1990)Water Opportunities Act(2010)Clean Water Act (2006)DRAFT South GeorgianBay <strong>Lake</strong> <strong>Simcoe</strong> SourceProtection <strong>Plan</strong> (2011)LSRCA WatershedDevelopment Policies(2008)City of Barrie Official <strong>Plan</strong>(2009)<strong>Simcoe</strong> County Official<strong>Plan</strong> (2007)Town of <strong>Innisfil</strong> Official<strong>Plan</strong> (2006)ImpervioussurfacesAgricultural waterdemandCommercial andresidential waterdemandClimate change *Restrictive policies in placeNo applicable policies* No policies to prevent climate change, but policies include an assessment of possible impactsAs can be seen in Table 4-15, a number of Acts, plans, and policies already exist to protect thequantity of surface and groundwater in the <strong>Innisfil</strong> <strong>Creeks</strong> subwatershed. Most of these policytools are directed towards protecting and enhancing groundwater recharge and discharge, orpromoting water conservation.Chapter 4: Water Quantity – Surface and Groundwater 161
The <strong>Innisfil</strong> <strong>Creeks</strong> <strong>Subwatershed</strong> <strong>Plan</strong>Under the Provincial Policy Statement, municipalities are required to restrict development andsite alteration in or near vulnerable headwaters, seepage areas, recharge/discharge areas,springs, and wetlands in order to protect, improve or restore their hydrologic function. Under theLSPP, the Conservation Authority is to identify areas of ecologically significant groundwaterrecharge (i.e. areas where groundwater which eventually supports sensitive features such aswetlands or cold water streams, initially enters the system), and municipalities are to incorporatepolicies in their respective Official <strong>Plan</strong>s to protect, improve, and restore the function of these,as well as significant groundwater recharge areas previously identified under the SouthGeorgian Bay – <strong>Lake</strong> <strong>Simcoe</strong> Source Protection <strong>Plan</strong>.Under the 2009 Barrie Official <strong>Plan</strong>, the City has committed to identifying surface and groundwater features which are necessary for the hydrological integrity of the watershed, andincorporating them in the Official <strong>Plan</strong>, along with policies to protect, improve, or restore thehydrological functions of these features, including their contribution to aquatic habitat and baseflow.The Town of <strong>Innisfil</strong> Official <strong>Plan</strong> has identified significant groundwater recharge areas to beprotected from incompatible development and site alteration. Smaller areas, such as seepageareas and springs are protected indirectly, by their use in identifying significant woodland areas(which are then provided some protection from development).The flow of water outside these critical hydrologic areas is protected, in part, by requirements forstorm water development. In the City of Barrie, all major developments require the preparationof stormwater management studies and plans, which must be consistent with the City's MasterDrainage Studies and requirements of LSRCA.In new or expanded settlement areas in the Town of <strong>Innisfil</strong>, a Master Drainage <strong>Plan</strong> is to beundertaken, which will establish preliminary targets for storm water quantity, including ensuringno increase in flows from predevelopment levels, as well as developing a stormwatermanagement plan to manage urbanization impacts on surface and ground water quantity. Inareas where such a master drainage plan has been created, any proposed developments mustcomply with its targets and guidelines. In areas where a master drainage plan doesn’t exist, anyproposed development larger than five units is required to develop a stormwater managementplan that includes an assessment of pre and post development discharge, impacts on surfaceand ground water quantity, and how development will maintain or enhance baseflow.Under the <strong>Lake</strong> <strong>Simcoe</strong> Protection <strong>Plan</strong>, this threshold is to be reduced to four units (orindividual units larger than 500m 2 ). The LSPP also requires that stormwater management plansbe consistent with the Tier 2 water budgets developed under the South Georgian Bay-<strong>Lake</strong><strong>Simcoe</strong> Source Protection <strong>Plan</strong>, as well as minimizing anticipated changes in water flowbetween the pre-development and post-development period.Furthermore, the draft South Georgian Bay – <strong>Lake</strong> <strong>Simcoe</strong> Source Protection <strong>Plan</strong> prohibits anincrease in impervious cover in vulnerable areas around municipal wells, unless it can bedemonstrated pre-development recharge can be maintained, and also prohibits designating newland uses that result in recharge reduction that would create a ‘significant threat’, unless theproponent can demonstrate that post-development recharge will match pre-developmentrecharge.Water conservation is promoted through regulatory restrictions, education programs, andmunicipal water use efficiency plans.For example, under the Ontario Water Resources Act, any use of water which exceeds 50,000litres per day requires a Permit to Take Water from the Ministry of the Environment. Under theLSPP, results of Tier 2 water budgets may provide background information for decisions madeChapter 4: Water Quantity – Surface and Groundwater 162
The <strong>Innisfil</strong> <strong>Creeks</strong> <strong>Subwatershed</strong> <strong>Plan</strong>by the MOE related to these Permits. The LSPP also directs the MOE and MNR to develop instreamflow targets for water quantity stressed subwatershed, which include the <strong>Innisfil</strong> <strong>Creeks</strong>subwatershed. When completed, these targets are to be used to inform future strategies relatedto water taking, which may include policies that identify how much water can be allocatedamong users in a subwatershed, including setting aside an allocation to support the naturalfunctions of the ecosystem.Results of these Tier 2 water budgets and instream flow targets are also intended to informmunicipal water conservation plans, which the LSPP requires the City of Barrie and Town of<strong>Innisfil</strong> to prepare and implement. These plans are intended to establish targets for waterconservation and efficiency, identify water conservation measures such as the use of flowrestrictingdevices and other hardware, and practices and technologies associated with waterreuse and recycling, as well as methods for promoting water conservation including full-costpricing for residents on municipal water supplies, and public education and awarenessprograms for rural residents not on municipal water systems.Water conservation and stewardship is also to be promoted in the agricultural, recreational,commercial, and industrial sectors, through partnerships between government agencies and keyprivate stakeholders.4.5.2 Restoration and remediationAlthough neither the Provincial government (through the <strong>Lake</strong> <strong>Simcoe</strong> Community StewardshipProgram) nor the LSRCA (through the Landowner Environmental Assistance Program) havefunding for stewardship projects specific to issues related to water quantity, projects such asretrofitting on-line ponds and planting trees and shrubs which are supported by those programswill have benefits related to reducing evaporation, and increasing groundwater recharge. Theseprojects are described in more detail in chapters 3, 5 and 6.The Environmental Farm <strong>Plan</strong> program, which is a partnership between the Ontario Ministry ofAgriculture, Food and Rural Affairs, Agriculture and Agri-Food Canada, and the Ontario Soil andCrop Improvement Association does support projects specifically directed to managing wateruse on farms. Projects supported through the Environmental Farm <strong>Plan</strong> include infrastructure tosupport water use efficiency, including both in-barn and irrigation equipment, and support forestablishing off-line irrigation ponds to reduce water taking demands on surface water features.Several dozen such projects have been implemented on farmland in the Barrie and <strong>Innisfil</strong> area.4.5.3 Science and researchAs a result of the tragedy in Walkerton in 2000, and the subsequent Clean Water Act andSource Protection <strong>Plan</strong>ning process, the amount of research conducted on water quantity andgroundwater movement in the <strong>Lake</strong> <strong>Simcoe</strong> watershed increased exponentially.The development of the South Georgian Bay – <strong>Lake</strong> <strong>Simcoe</strong> Source Protection <strong>Plan</strong> wassupported by the establishment of a subwatershed-scale water budget, which described themovement of water among hydrologic elements in the watershed (e.g. wetlands, soils, aquifers),and the extractions of this water for human use. These budgets, and associated stressassessments also formed a significant part of the data used in drafting this subwatershed plan.Another important component of the Source Protection <strong>Plan</strong> was the identification of ‘SignificantGroundwater Recharge Areas’. These areas are locations where surficial geology and hydraulicgradient tend to support a relatively high volume of water recharging into aquifers. Morerecently, the LSPP has directed LSRCA to identify ‘Ecologically Significant GroundwaterChapter 4: Water Quantity – Surface and Groundwater 163
The <strong>Innisfil</strong> <strong>Creeks</strong> <strong>Subwatershed</strong> <strong>Plan</strong>Recharge Areas.’ This new class of recharge area is identified based on ecological interactions,rather than volume of water. To identify these areas, reverse particle tracking models havebeen developed based on groundwater models created as part of the Source Protection<strong>Plan</strong>ning process, to identify areas which contribute groundwater to sensitive surface featuressuch as wetlands and coldwater streams. ESGRAs are currently being delineated for the <strong>Innisfil</strong><strong>Creeks</strong> subwatershed by AquaResource Inc. using the FEFLOW model developed byAquaResource et al. (2011) for the <strong>Innisfil</strong> Tier 2 Water Budget.In order to support water budgeting and other watershed-scale modeling, LSRCA manages anetwork of 12 climate stations (including precipitation gauges), and 15 surface water flowstations (in partnership with the Water Survey of Canada). These stations provide monthlystream flow data, which can be used to monitor mean, median and baseflow conditions formany of <strong>Lake</strong> <strong>Simcoe</strong>’s subwatershed. For further information on research and monitoringrelated to water budgeting, see the Source Water Protection Assessment Report: <strong>Lake</strong>s <strong>Simcoe</strong>and Couchiching- Black River Source Protection Area (South Georgian Bay-<strong>Lake</strong> <strong>Simcoe</strong>Source Protection Committee, 2011).4.6 Management gaps and recommendationsAs described in the previous sections, a number of regulations and municipal requirementsaimed at protecting water quantity in the <strong>Innisfil</strong> <strong>Creeks</strong> subwatershed already exist. Despite thisstrong foundation, there are gaps in the management framework that need to be considered.This section identifies some of the gaps in the existing protection of the water quantity in the<strong>Innisfil</strong> <strong>Creeks</strong> subwatershed, and outlines recommendations to help fill these gaps.It is recognized that many of the undertakings in the following set of recommendations aredependent on funding from all levels of government. Should there be financial constraints, itmay affect the ability of the partners to achieve these recommendations. These constraints willbe addressed in the implementation phase4.6.1 Water DemandRecommendation 4-1 - That the LSRCA and subwatershed municipalities promote andsupport low impact design (LID) solutions such as rainwater harvesting, rain gardens,and grey water reuse to manage stormwater and supplement residential water use.Recommendation 4-2 - That the MOE be encouraged to continue to improve the WaterTaking Reporting System by integrating the Permit To Take Water (PTTW) databasewith the Water Well Information System (WWIS) database, and connecting those takingsto wells / aquifers to facilitate impact assessment (i.e. the PTTW database needs to beconnected to the WWIS database).4.6.2 Ecological FlowsRecommendation 4-3 - That the MNR and MOE, in partnership with LSRCA, develop amore detailed surface water budget for the <strong>Innisfil</strong> <strong>Creeks</strong> subwatershed that will providebasis of actions needed to determine ecological (instream) flow targets.Recommendation 4-4 – That the MOE, with assistance from LSRCA, MNR and theUniversity of Guelph, determine in-stream flow regime targets for Barrie, Lovers,Hewitt’s, and <strong>Innisfil</strong> <strong>Creeks</strong>. These targets should be based on the Guidance Documentframework (LSRCA 2010) which is being used for the Maskinonge River subwatershed.Chapter 4: Water Quantity – Surface and Groundwater 164
The <strong>Innisfil</strong> <strong>Creeks</strong> <strong>Subwatershed</strong> <strong>Plan</strong>Recommendation 4-5 – That the MOE and MNR, with assistance from LSRCA, developa strategy to achieve the instream flow regime targets. This strategy should addressboth high and low flow requirements and provide a plan for implementing strategyrecommendations.4.6.3 Reducing impacts of land use – groundwater recharge and dischargeRecommendation 4-6 - Municipalities shall only permit new development orredevelopment in significant recharge areas, where it can be demonstrated through thesubmission of a hydrogeological study and water balance, that the existing groundwaterrecharge will be maintained (i.e. there will be no net reduction in recharge).Recommendation 4-7 - Municipalities should amend their planning documents torequire that runoff in significant recharge areas meet the enhanced water quality criteriaoutlined in the MOE Stormwater Management Guidance Document, 2003, as amendedfrom time to time, prior to it being infiltrated.Recommendation 4-8 - That municipalities incorporate the requirement for the re-use ordiversion of roof top runoff (clean water diversion) from all new development insignificant recharge areas away from storm sewers and infiltrated to maintain the predevelopmentwater balance (except in locations where a hydrogeological assessmentindicates that local water table is too high to support such infiltration) in their municipalengineering standards.Recommendation 4-9 - The MOE should only issue Environmental ComplianceApprovals for new storm water management facilities within significant recharge areasthat maintain the pre-development groundwater recharge rates and meet the enhancedwater quality criteria outlined in the MOE Stormwater Management Guidance Document,2003, as amended from time to time.Recommendation 4-10 - The MOE shall only issue Environmental ComplianceApprovals for Stormwater Management Facility retrofits within significant recharge areas,that attempt to improve, maintain or restore the pre-development water balance, andmeet the enhanced water quality criteria outlined in the MOE Stormwater ManagementGuidance Document, 2003, as amended from time to time.Recommendation 4-11 – Municipalities, in collaboration with the <strong>Lake</strong> <strong>Simcoe</strong> <strong>Region</strong>Conservation Authority, shall undertake an education and outreach program focusing onthe importance of significant recharge areas, and the actions residents and businessescan take to maximize infiltration from impervious surfaces while minimizingcontamination such as salt.Recommendation 4-12 - The <strong>Lake</strong> <strong>Simcoe</strong> <strong>Region</strong> Conservation Authority shouldcreate eligibility for stormwater management retrofits and infiltration projects under theLEAP program within significant recharge areas.Recommendation 4-13 - Municipalities shall collaborate with the <strong>Lake</strong> <strong>Simcoe</strong> <strong>Region</strong>Conservation Authority to promote infiltration of clean water in significant rechargeareas, and prioritize stormwater retrofits utilizing water quality controls, and ultimatelyinfiltration devices for treated stormwater runoff.Recommendation 4-14 - The MOE should consider providing financial assistance toimplement stormwater management facility retrofits and infiltration projects withinsignificant recharge areas.Chapter 4: Water Quantity – Surface and Groundwater 165
The <strong>Innisfil</strong> <strong>Creeks</strong> <strong>Subwatershed</strong> <strong>Plan</strong>Recommendation 4-15 - Municipalities should include significant recharge areas in theirassessment of areas vulnerable to road salt, and modify their municipal SaltManagement <strong>Plan</strong>s and snow disposal plans as necessary.4.6.4 Climate ChangeRecommendation 4-16 –That the LSRCA, with the assistance of MOE and MNR,develop a fully integrated groundwater and surface water model, that is able to takeadvantage of real-time or near real-time flow data, to predict how stream flow volumeswill respond to the seasonal and ecological impacts of climate change, in terms ofincreased peak flows, reduced baseflows, and increased water demand.Recommendation 4-17- That the LSRCA work with its federal, provincial, and municipalpartners to refine the anticipated impacts of climate change in the <strong>Lake</strong> <strong>Simcoe</strong>watershed. This information can then be used to develop management strategies toaddress these impacts. Emphasis at this time should be placed on building ecologicalresilience in vulnerable subwatershed through stream rehabilitation, streambankplanting, barrier removal, and other BMP implementation in conjunction with theprotection of current hydrologic functions.Chapter 4: Water Quantity – Surface and Groundwater 166
The <strong>Innisfil</strong> <strong>Creeks</strong> <strong>Subwatershed</strong> <strong>Plan</strong>5 Aquatic Natural Heritage5.1 IntroductionHabitat can be described as a place where an animal or plant normally lives, oftencharacterized by a dominant plant form or physical characteristic. All living things have anumber of basic requirements in their habitats including space, shelter, food, and reproduction.In an aquatic system, good water quality is an additional requirement. In a river system, wateraffects all of these habitat factors; its movement and quantity affects the usability of the space inthe channels, it can provide shelter and refuge by creating an area of calm in a deep pool, itcarries small organisms, organic debris, and sediments downstream which can provide food formany organisms and its currents incorporate air into the water column which provides oxygenfor both living creatures and chemical processes in the water and sediments. Habitat featuresalso frequently affect and are affected by other features and functions in a system. For instance,the materials comprising a channel bed can affect the amount of erosion that will take placeover time; this in turn affects the channel shape and the flow dynamics of the water. Thecoarseness of the channel’s bed can also affect the suitability for fish habitat – some speciesrequire coarse, gravelly deposits for spawning substrates, while finer sediments in the shallowfringes of slow moving watercourses often support wetland plants that are required by otherspecies.All habitat features are impacted by changes in the system, both natural and anthropogenic innature. There are numerous causes of stress in an aquatic environment. Any type of land usechange from the natural condition will place a strain on the system, and can cause significantchanges to the aquatic community. The conversion of natural lands such as woodland andwetland to agriculture or urban uses eliminates the functions that these features perform, suchas improvement of water quality, water storage, and increasing the amount of infiltration togroundwater. This can result in impacts to water quality and a reduction in baseflow, resulting inwatercourses that are unable to support healthy communities of native biota.The following sections in this chapter highlight the current status (Section 5.2) of each of themain watercourses in the <strong>Innisfil</strong> <strong>Creeks</strong> subwatershed, as well as the stressors impacting them(Section 5.3), and the current management framework in place to protect and restore them(Section 5.4).5.2 Current StatusTo assess the environmental quality and the overall healthof the aquatic system, the <strong>Lake</strong> <strong>Simcoe</strong> Protection <strong>Plan</strong>has provided indicators to determine how well the aquaticecosystem is functioning. The indicators which arerelevant for the subwatersheds and their tributaries are:• Natural reproduction and survival of native aquaticcommunities;• Presence and abundance of key sensitive species,and;• Shifts in fish community composition.To address these indicators, a number of analyses havebeen done on the stream systems. The following sectionssummarize these results.LSRCA field crew - ElectrofishingChapter 5: Aquatic Natural Heritage 167
The <strong>Innisfil</strong> <strong>Creeks</strong> <strong>Subwatershed</strong> <strong>Plan</strong>5.2.1 Overview of aquatic communities – Tributaries5.2.1.1Fish communityStudying the health of the fish community of the <strong>Innisfil</strong> <strong>Creeks</strong> subwatershed provides animportant window into the health of the aquatic system as a whole. Fish are sensitive to a greatnumber of stresses including water quality, temperature, flow regimes, and the removal of instreamhabitat. While they are able to move quickly in response to a sudden change inconditions (e.g. a release of a chemical into the system) and are therefore not a good indicatorof these types of issues, prolonged stresses will eventually cause a shift in the fish communityfrom one that is sensitive and requires clean, cool water to survive to one that is more tolerantof lower quality conditions. Long term monitoring will identify changes and trends occurring inthe fish community the subwatershed, and will help to identify and guide restoration works.A total of 32 species have been captured from the <strong>Innisfil</strong> <strong>Creeks</strong> subwatershed since 1975(Table 5-1). Some of these species have only historic records (before 1990), some only current(after 1990) and others have both (1975-present). The fish communities in the subwatershedsrange from cold headwater communities featuring such species as brook trout (Salvelinusfontinalis) and mottled sculpin (Cottus bairdii) to diverse warm water systems containing suchspecies as creek chub (Semotilus atromaculatus) and brown bullhead (Ameiurus nebulosus).The water temperature of a system can dictate the composition of the fish community, as wellas determine the way systems are managed. Figure 5-1 illustrates the combination of maximumair temperatures versus water temperature at 4 pm (when water temperatures tend to reachtheir maximum) that makes a cold, cool or warm water stream. Typically, the average maximumsummer water temperatures for a cold water system is 14°C. Cool water is approximately 18°Cand warm water systems have an average summer maximum daily water temperature ofapproximately 23°C (Stoneman and Jones, 1996). This temperature rating system has beenused to classify the tributaries in the <strong>Lake</strong> <strong>Simcoe</strong> watershed.Figure 5-1: Cold, cool and warm water trout stream temperature ranges (Stoneman and Jones,1996).Chapter 5: Aquatic Natural Heritage 168
The <strong>Innisfil</strong> <strong>Creeks</strong> <strong>Subwatershed</strong> <strong>Plan</strong>Table 5-1: Fish species captured in the <strong>Innisfil</strong> <strong>Creeks</strong> subwatershed from 1975-2011.Common NameBrook Trout(Salvelinus fontinalis)Rainbow Smelt ^(Osmerus mordax)Northern Pike(Esox lucius)White Sucker(Catostomus commersoni)Central Mudminnow(Umbra limi)Northern RedbellyDace (Phoxinus eos)Finescale Dace(Phoxinus neogaeus)Emerald Shiner(Notropis atherinoides)Common Shiner(Luxilus cornutus)Blackchin Shiner(Notropis heterodon)Blacknose Shiner(Notropis heterolepis)Spotfin Shiner(Cyprinella spiloptera)Sand Shiner(Notropis stramineus)Bluntnose Minnow(Pimephales notatus)Fathead Minnow(Pimephales promelas)Blacknose Dace(Rhinichthys atratulus)Longnose Dace(Rhinichthys cataractae)Creek Chub(Semotilus atromaculatus)Pearl Dace(Margariseus margarita)StrathallanSandyCoveBurt’sDrain<strong>Innisfil</strong> <strong>Creeks</strong> subwatershedBelleLeonard’s McLean CedarAireCarsonWilsonWhiteBirchUpperMarshChapter 5: Aquatic Natural Heritage 169
The <strong>Innisfil</strong> <strong>Creeks</strong> <strong>Subwatershed</strong> <strong>Plan</strong>Common NameBrown Bullhead(Ameriurus nebulosus)Banded Killifish(Fundulus diaphanous)Brook Stickleback(Culaea inconstans)Rock Bass(Ambloplites rupestris)Pumpkinseed(Lepomis gibbosus)Smallmouth Bass(Micropterus dolomieu)Yellow Perch(Perca flavescens)Iowa Darter(Etheostoma exile)Johnny Darter(Etheostoma nigrum)Mottled Sculpin(Cottus bairdi)Slimy Sculpin(Cootus cognatus)StrathallanSandyCoveBurt’sDrain<strong>Innisfil</strong> <strong>Creeks</strong> subwatershedBelleLeonard’s McLean CedarAireCaptured historically (before 1990)Captured historically and present day (before and after 1990)Captured present day (after 1990)CarsonWilsonWhiteBirchUpperMarshNote: Not all of the main tributaries in the <strong>Innisfil</strong> <strong>Creeks</strong> subwatershed are shown here. Mooselanka, Bon Secours, Banks, Moyer, Sylvan andGilford <strong>Creeks</strong> do not have any LSRCA monitoring sites and as such have not been included in this table.^ = Not native to <strong>Lake</strong> <strong>Simcoe</strong> WatershedChapter 5: Aquatic Natural Heritage 170
The <strong>Innisfil</strong> <strong>Creeks</strong> <strong>Subwatershed</strong> <strong>Plan</strong>A general overview of the current fish communities is looked at first to see what type of fish areat a site (cold water species 1 , warm water species 2 , or no fish) and what the temperature of thecreek is at the site (cold, cool or warm water), as well as the location of dams that blockpassage for some fish species (Figure 5-2). This broad overview can show the general shifts inthe fish communities as coldwater fish communities either change into warm water fishcommunities or habitat absent of fish, as water temperatures rise or where dams are present.Figure 5-2 shows that temperature varies along the most of the watercourses where data isavailable. While the majority of these creeks are cold water systems, cold water species arepresent only in Strathallan, Sandy Cove, Burts Drain, Leonard’s, and White Birch <strong>Creeks</strong>. Thereare also a number of sites that either have only warm water species or no fish species at all.The dams depicted on Figure 5-2 show where the major barriers to fish are located.There are a few anomalies where cold water species are found within warm water habitat orwarm water species in cold water habitat. The most likely reason that cold water species arefound in warm water habitat is that there are small nearby temperature micro habitats, such asundercut banks and heavily shaded areas with cold water upwellings, springs, or seeps. It isalso possible that a species was passing through or leaving the warm water habitat at the timeof sampling, but this would be more unusual. Warm water species are habitat generalists andcan exist in warm, cool, or coldwater conditions.An Index of Biotic Integrity (IBI) was used to assess the ecological integrity of the creeksthrough an analysis of the composition of fish communities within the system (Figure 5-3). Fishpopulation and community composition surveys are valuable tools in examining the health andstability of streams and rivers. Over time, shifts in composition along with the presence orabsence of key species not only provides an indication of system health but can be used to helpidentify what ecosystem stressors, such as climate change and urbanization, are influencingaquatic habitats.With this method there are five rankings that can be assigned to a site:• Very good: Excellent diversity, top predators, trout present and high fish abundance• Good: Average diversity, top predators present, trout present, average abundance• Fair: Low/average diversity, some top predators, no trout, low/average abundance offish• Poor: Low diversity, no top predators, no trout, low abundance of fish• No Fish: No fish were captured at these sitesWhile the IBI is generally applicable to the <strong>Lake</strong> <strong>Simcoe</strong> watershed, there is potential forimprovement by including a greater range of top predators into the IBI calculations. Currentlyonly brook trout are weighed and measured individually. This may skew the results as warmwater predators are not included in the IBI calculations.Overall, Figure 5-3 shows that the ecological integrity of the systems vary spatially across thesubwatersheds, with many of the sites showing fair conditions. There are also several ‘good’ratings in the subwatershed, as well as a number of sites that were rated as having poorecological integrity. It must also be noted that 5 of the 29 sites recorded no fish captured.1 Cold water species are indicators of cold water habitat. Coldwater species found in these subwatersheds include:rainbow trout*, brook trout, rainbow smelt *, mottled sculpin and slimy sculpin (*not native to <strong>Lake</strong> <strong>Simcoe</strong>watershed). All others listed in Table 5-2 are either cool or warm water species.2 Warm water species are considered to be generalist species that are not coldwater indicators and can exist in warm,cool and coldwater sections of a stream.Chapter 5: Aquatic Natural Heritage 171
RDB A R R I E400 HWY NSIDERD 10BIG BAY PT RDLOCKHART RD10TH LINE9TH LINERIDGE RD WKempenfelt BayINNISFIL BEACH RD7TH LINE6TH LINEYONGE STSIDERD 25METRO RD N<strong>Lake</strong><strong>Simcoe</strong>BASELINE RDWARDEN AVEOccurence of fish communitiesin relation to measured in-streamwater temperature in the <strong>Innisfil</strong><strong>Creeks</strong> subwatershed.Legend#Fish!.!.!.DamColdNo FishWarmTemperature")")")ColdCoolRoadFigure 5-2WarmMunicipal BoundaryWatercourseWOODBINE AVESIDERD 105TH LINESIDERD 5HWY 400 S4TH LINE3RD LINEG E O R G I N APOLLOCK RDI N N I S F I L2ND LINECOUNTY RD 8914TH LINELINE 13Cook'sBayGLENWOODS AVERAVENSHOE RD0 0.5 1 2 3 4 5KilometresKThis product was produced by the <strong>Lake</strong> <strong>Simcoe</strong> <strong>Region</strong> Conservation Authority andsome information depicted on this map may have been compiled from various sources.While every effort has been made to accurately depict the information,data / mapping errors may exist.This map has been produced for illustrative purposes only.LSRCA GIS Services DRAFT created June2011.© LAKE SIMCOE REGION CONSERVATION AUTHORITY, 2011. All Rights ReservedThe following datasets roads, municipal boundaries and Oak Ridges Moraine are© Queens Printer for Ontario, 2011. Reproduced with Permission
RDB A R R I E400 HWY NSIDERD 10BIG BAY PT RDLOCKHART RD10TH LINE9TH LINERIDGE RD WKempenfelt BayYONGE STSIDERD 25<strong>Lake</strong><strong>Simcoe</strong>Ecological integrity of stream sitesbased on fish community conditionsassessed using an Index ofBiotic Intergrity (IBI)LegendIndex of Biotic IntegrityVery GoodGood!(!(!(!(!(FairPoorRoadFigure 5-3No FishINNISFIL BEACH RD7TH LINE6TH LINEMETRO RD NBASELINE RDWARDEN AVEWOODBINE AVEMunicipal BoundaryWatercourseSIDERD 105TH LINESIDERD 5HWY 400 S4TH LINE3RD LINEG E O R G I N APOLLOCK RDI N N I S F I L2ND LINECOUNTY RD 8914TH LINELINE 13Cook'sBayGLENWOODS AVERAVENSHOE RD0 0.5 1 2 3 4 5KilometresKThis product was produced by the <strong>Lake</strong> <strong>Simcoe</strong> <strong>Region</strong> Conservation Authority andsome information depicted on this map may have been compiled from various sources.While every effort has been made to accurately depict the information,data / mapping errors may exist.This map has been produced for illustrative purposes only.LSRCA GIS Services DRAFT created June2011.© LAKE SIMCOE REGION CONSERVATION AUTHORITY, 2011. All Rights ReservedThe following datasets roads, municipal boundaries and Oak Ridges Moraine are© Queens Printer for Ontario, 2011. Reproduced with Permission
The <strong>Innisfil</strong> <strong>Creeks</strong> <strong>Subwatershed</strong> <strong>Plan</strong>The historic and current presence of brook trout and mottled sculpin (both key indicator speciesfor cold water habitat) was mapped in Figure 5-4 and Figure 5-5. A comparison of past andcurrent habitat ranges can further show shifting of the cold water fish communities in the systemand where areas that used to be cold water habitat are possibly transitioning to cool or warmwater systems. Additionally, current data is available to compare the number of adults to youngof the year for brook trout populations, possibly indicating areas of successful naturalreproduction and survival of the species.Figure 5-4 shows the historic and current presence of brook trout in the <strong>Innisfil</strong> <strong>Creeks</strong>subwatershed, while Figure 5-5 shows the historic and current presence of mottled sculpin.These figures also point out that all streams with historic brook trout and mottled sculpinpopulations have maintained their cold water attributes, and have supported brook trout and/ormottled sculpin communities over the last 10-35 years (depending on the system). Mottledsculpin populations have seen an increase in their range in the subwatershed, expanding fromhistorically being found in one creek to being currently being found in four. Of the two creekswith historic brook trout, Banks Creek no longer has its population. It is also thought that in thepast, most of the creeks within this subwatershed had the necessary attributes to sustain brooktrout populations. But, by the time they were sampled, changes in surrounding land uses andstream alterations had impacted the creeks to a degree where they no longer provided suitablebrook trout habitat.The reasoning for selecting brook trout as a key indicator species is provided in the followingcase study.Significance of brook trout in the tributaries of <strong>Lake</strong> <strong>Simcoe</strong>The brook trout (Salvelinus fontinalis) is a native fish species that inhabits the <strong>Lake</strong> <strong>Simcoe</strong>watershed in cold, clear gravel-based tributaries. They are a member of the Char family, whichalso includes arctic char, bull trout and lake trout. Brook trout characteristically have fairlyspecific coldwater life history requirements. As they are considered the proverbial “canary in thecoal mine” indicator for local rivers and streams, the presence of brook trout in a local stream isan indicator of high quality water and habitat features. As a result, only the healthiest tributariesin the <strong>Lake</strong> <strong>Simcoe</strong> watershed can support brook trout.Because of their need for the cold water habitat, typicallycreated by spring stream bank seepage entering streamsat the surface or groundwater upwelling through thestreambed substrate, brook trout populations are closelylinked to the geology of the watershed. They arecommonly found in aquatic habitats with poroussubstrates, in the form of sands and gravels, and with thepresence of groundwater that reaches the surficial soillayers.Groundwater-based streams tend to be less variable Brook Trout (Salvelinus fontinalis)both in flow and temperature. Because groundwateroriginates below ground surface, it is not subject to the extremes in heat and cold that awatercourse would be. Typically the temperature of groundwater is cooler in the summer andwarmer in the winter than ambient surface stream temperatures. Groundwater adds to thevolume of flow of the stream as baseflow, and contributes to a significant moderating thermalinfluence on the system.Brook trout grow and survive best in stream temperatures between 13°C and 18°C, althoughthey are known to tolerate temperatures up to 23°C for short durations. This species is sensitiveto small increases in stream temperature and the resulting lower dissolved oxygen levels,Chapter 5: Aquatic Natural Heritage 174
The <strong>Innisfil</strong> <strong>Creeks</strong> <strong>Subwatershed</strong> <strong>Plan</strong>Brook trout spawning over groundwaterupwelling sitechanges in pH, and decreases in water quality.These changes are most often related to changesin land use through land development or intensiveagricultural practices, which can include: cutting ofstream bank vegetation, excess sedimentation,and the interception of close-to-surfacegroundwater, all of which contribute to cumulativechange in tributaries. On-stream dams or barriersare another significant factor impacting brooktrout, as they warm downstream temperatures, actas a silt trap for sediment moving downstream,and prevent movement of fish to colder upstreamreaches. The decrease in water quality also tendsto create a more suitable habitat for non-native fish species (such as brown trout and rainbowtrout) that may out-compete the native brook trout for resources.Successful brook trout reproduction has specific physical requirements. Between October andDecember, mature brook trout seek out areas of upwelling groundwater in the streambed tospawn. These sites may be distributed evenly throughout a tributary or there may be verylimited locations where upwelling can be detected. While they prefer to spawn over agravel/sand substrate, the size of the substrate is of less importance than the presence ofupwelling activity. Eggs deposited in a ‘nest’ (commonly known as a redd) are flushed byconstantly moving interstitial groundwater which is stable in temperature and normally slightlywarmer than ambient stream temperature during the winter months. This condition allows theeggs to develop more quickly, resulting in the emergence of larval brook trout in late March.Compared to other resident fish species and to the non-resident trout species, this is very earlyin the season and provides the young brook trout with a competitive advantage in terms of foodavailability and time to grow and mature.Despite their sensitivity to change, brook troutand their habitat respond well to streamrehabilitation. Efforts are focused primarily onreducing thermal and sediment impacts andimproving in-water habitat. Typical techniqueslike adding instream structures, such as bankstabilizers, deflectors, cedar sweepers,overhead cover, half logs, and strategic rockand gravel placement, are used. In addition,planting stream banks with appropriate nativevegetation, restricting livestock access withfencing, and protecting spring seeps adjacent tothe channel are often undertaken as part of astream rehabilitation plan. These methods areparticularly effective where groundwatercontinues to provide baseflow and where otherlocal biophysical features have not been impacted.Typical tributary that supports brook troutToday, it is important that we protect, restore and maintain current and historic brook trouthabitat, as these are areas that are, or have the potential to be, high quality aquatic habitats, interms of both water quality and habitat features. As such, additional efforts need to beundertaken to protect the tributaries of the <strong>Lake</strong> <strong>Simcoe</strong> watershed that support these nativefish.Chapter 5: Aquatic Natural Heritage 175
B A R R I E400 HWY NBIG BAY PT RDRIDGE RD WKempenfelt Bay<strong>Lake</strong><strong>Simcoe</strong>Historic and current presenceof brook trout in the <strong>Innisfil</strong><strong>Creeks</strong> subwatershed.LegendRoadFigure 5-4Municipal BoundarySIDERD 25LOCKHART RD")WatercourseCurrent Brook TroutRD10TH LINE#*Historic Brook TroutYONGE STSIDERD 109TH LINEINNISFIL BEACH RD7TH LINE6TH LINEMETRO RD NBASELINE RDWARDEN AVEWOODBINE AVESIDERD 105TH LINESIDERD 5HWY 400 S4TH LINE3RD LINEG E O R G I N APOLLOCK RDI N N I S F I L2ND LINECOUNTY RD 8914TH LINELINE 13Cook'sBayGLENWOODS AVERAVENSHOE RD0 0.5 1 2 3 4 5KilometresKThis product was produced by the <strong>Lake</strong> <strong>Simcoe</strong> <strong>Region</strong> Conservation Authority andsome information depicted on this map may have been compiled from various sources.While every effort has been made to accurately depict the information,data / mapping errors may exist.This map has been produced for illustrative purposes only.LSRCA GIS Services DRAFT created July 2010.© LAKE SIMCOE REGION CONSERVATION AUTHORITY, 2010. All Rights ReservedThe following datasets roads, municipal boundaries and Oak Ridges Moraine are© Queens Printer for Ontario, 2010. Reproduced with Permission
B A R R I E400 HWY NBIG BAY PT RDRIDGE RD WKempenfelt Bay<strong>Lake</strong><strong>Simcoe</strong>Historic and current presenceof mottled sculpin in the <strong>Innisfil</strong><strong>Creeks</strong> subwatershedLegendRoadFigure 5-5Municipal BoundarySIDERD 25LOCKHART RD")WatercourseCurrent Mottled SculpinRD10TH LINE#*Historic Mottled SculpinYONGE STSIDERD 109TH LINEINNISFIL BEACH RD7TH LINE6TH LINEMETRO RD NBASELINE RDWARDEN AVEWOODBINE AVESIDERD 105TH LINESIDERD 5HWY 400 S4TH LINE3RD LINEG E O R G I N APOLLOCK RDI N N I S F I L2ND LINECOUNTY RD 8914TH LINELINE 13Cook'sBayGLENWOODS AVERAVENSHOE RD0 0.5 1 2 3 4 5KilometresKThis product was produced by the <strong>Lake</strong> <strong>Simcoe</strong> <strong>Region</strong> Conservation Authority andsome information depicted on this map may have been compiled from various sources.While every effort has been made to accurately depict the information,data / mapping errors may exist.This map has been produced for illustrative purposes only.LSRCA GIS Services DRAFT created July 2010.© LAKE SIMCOE REGION CONSERVATION AUTHORITY, 2010. All Rights ReservedThe following datasets roads, municipal boundaries and Oak Ridges Moraine are© Queens Printer for Ontario, 2010. Reproduced with Permission
The <strong>Innisfil</strong> <strong>Creeks</strong> <strong>Subwatershed</strong> <strong>Plan</strong>5.2.1.2Benthic communityAquatic insects, or benthic invertebrates, are an ideal indicator of waterquality as different species have different tolerances to factors such asnutrient enrichment, dissolved solids, oxygen, and temperature. Thepresence or absence of certain species is used to determine waterquality at a given site. Of the indices developed to assess water qualityin relation to benthic invertebrate communities, the Hilsenhoff BioticIndex was selected as it provides a full spectrum of the different levelsof organic pollution within a watercourse, which enables watershed managers to documentdeclining watershed conditions by comparing years of data; whereas other indices (such asBioMAP) only provide an ‘impaired’ or ‘unimpaired’ rating.Benthic invertebrates have been collected from these subwatersheds since 2004 employing aconsistent and standard collection method (Jones et al., 2004). Figure 5-6 is an assessment ofthe ecological integrity of the creeks through the composition of the benthic invertebratecommunities within the system. This composition is dependent on the quality of the water andthe degree of organic pollution. With this method there are seven rankings that can be assignedto a site:• Excellent: No apparent organic pollution• Very good: Slight organic pollution• Good: Some organic pollution• Fair: Fairly significant organic pollution• Fairly poor: Significant organic pollution• Poor: Very significant organic pollution• Very poor: Severe organic pollutionFigure 5-6 shows that the ecological integrity of the watercourses, based on benthic analysis,varies from good to fairly poor across the <strong>Innisfil</strong> <strong>Creeks</strong> subwatershed. Only Sandy CoveCreek has an instance of having poor ecological integrity at a site.When using both fish and benthic indices to evaluate the ecological integrity of a system, it islikely that there will be some discrepancies between the data. For example, there may be apoor rating of a site by the IBI and a good rating by the Hilsenhoff index. A possible explanationmay be that while warm temperatures can limit the number of cold water indicator fish speciesat a site (resulting in a lower IBI score), some highly sensitive insects are not affected bytemperature. There may also be the opposite scenario where IBI gives a good rating andHilsenhoff a poor rating. This could possibly by explained by the fact that fish are more mobilethan benthic invertebrates. In times where habitat conditions have deteriorated (low oxygen, lowwater levels, high temperatures, or poor water quality), benthic invertebrates are unable tomove as quickly into better conditions and whole populations can bewiped out. If this occurs, benthic communities will likely not returnthe following year, whereas fish will if habitat conditions haveimproved. The last scenario is at sites where no fish have beencaught. Conditions at a site could include low flow, high gradient, orhave barriers to fish passage. While these conditions are notfavourable to fish, benthic invertebrates can still have healthypopulations at these sites, which will be reflected in a higherHilsenhoff rating.Chapter 5: Aquatic Natural Heritage 178
RIDGE RD WKempenfelt Bay<strong>Lake</strong><strong>Simcoe</strong>Ecological integrity of stream sitesbased on benthic community conditionsassessed using the HilsenhoffIndex of Biotic Intergrity (HBI)Figure 5-5B A R R I EBIG BAY PT RDLegendHilsenhof Biotic Index")ExcellentSIDERD 25400 HWY NLOCKHART RD")")Very GoodGoodA RDSIDERD 1010TH LINE9TH LINEINNISFIL BEACH RD7TH LINE6TH LINEYONGE STMETRO RD NBASELINE RDWARDEN AVEWOODBINE AVE")")")")FairFairly PoorPoorVery PoorRoadMunicipal BoundaryWatercourseSIDERD 105TH LINESIDERD 5HWY 400 S4TH LINE3RD LINEG E O R G I N APOLLOCK RDI N N I S F I L2ND LINECOUNTY RD 8914TH LINELINE 13Cook'sBayGLENWOODS AVERAVENSHOE RD0 0.5 1 2 3 4 5KilometresKThis product was produced by the <strong>Lake</strong> <strong>Simcoe</strong> <strong>Region</strong> Conservation Authority andsome information depicted on this map may have been compiled from various sources.While every effort has been made to accurately depict the information,data / mapping errors may exist.This map has been produced for illustrative purposes only.LSRCA GIS Services DRAFT created June2011.© LAKE SIMCOE REGION CONSERVATION AUTHORITY, 2011. All Rights ReservedThe following datasets roads, municipal boundaries and Oak Ridges Moraine are© Queens Printer for Ontario, 2011. Reproduced with Permission
The <strong>Innisfil</strong> <strong>Creeks</strong> <strong>Subwatershed</strong> <strong>Plan</strong>5.2.2 Overview of aquatic communities – <strong>Lake</strong> NearshoreIn addition to assessing the tributaries within thesubwatershed, the nearshore lake communities were alsoanalyzed, as the nearshore zones are critical areas thatare linked to both the terrestrial riparian area and to thetributaries and the aquatic communities within them. Thenearshore zone for <strong>Lake</strong> <strong>Simcoe</strong> is from the shoreline towhen the depth reaches 15-20m. This is an important fishfeeding, migration, and nursery area; and is also an areathat has undergone significant environmental change,including the introduction of a number of invasive species(including zebra and quagga mussels, plants, and zooplankton), changes in the aquatic plantcommunities, and the impacts of shoreline development and hardening. Part of the mandate ofthe LSRCA <strong>Lake</strong> Science Research and Monitoring Program is to assess the environmentalstatus of <strong>Lake</strong> <strong>Simcoe</strong> and track any ecological changes; the collected data is being used to setpublic policy, advise lake managers, and verify environmental guidelines. Included in thismandate are three areas of interest: aquatic plants, sediment phosphorus, and invasive species.In May 2008, LSRCA carried out a survey of aquatic plants across <strong>Lake</strong> <strong>Simcoe</strong> to set abaseline for future change. While previous studies focused on Cook’s Bay, an area of high plantbiomass, this new study identified four other areas of high biomass. In the <strong>Innisfil</strong> subwatershed,high plant biomass has been recorded in southern Cook’s Bay, and along the southern shore ofKempenfelt Bay (Figure 5-7a). While sandy substrates along the shore from northern Cook’sBay to Big Bay Point do not currently support a high plant biomass, the plant community in thisarea has been impacted by invasion by eurasian watermilfoil (Myriophyllum spicatum), but stillcontains a relict population of rare waterweed (Elodea nuttallii). Routine monitoring is requiredto detect future ecological changes and present baseline data for environmental managementplans.The second component being analyzed is the amount of phosphorus contained in lakesediments, which was poorly understood prior to the initiation of the LSRCA <strong>Lake</strong> ScienceResearch and Monitoring Program. Monitoring of sedimentphosphorus is undertaken because of the potential forphosphorus release under low dissolved oxygenconcentrations in the water (less than 2 mg/L) and this is,thus far, an undetermined source of phosphorus loading.Along the <strong>Innisfil</strong> shoreline, concentrations vary from totalphosphorus (TP) ~1.1 mg/g in Kempenfelt Bay, ~0.87 mg/gsouth of Big Bay Point to northern Cook’s Bay, ~0.85 mg/g innorthern Cook’s Bay, and ~0.35 mg/g in southern Cook’sBay (Figure 5-7c). These values differ due to substrate typewith mud in Kempenfelt Bay holding a higher concentrationof phosphorus than the sandy substrates along <strong>Lake</strong><strong>Simcoe</strong>’s western shore. In southern Cook’s Bay, very lowconcentrations are due to uptake by aquatic plants, whichacquire up to 97% of their nutrient requirements fromsediments. Across the lake concentrations range from TP~0.35 mg/g in Cook’s Bay to ~1.40 mg/g near Beaverton (fordetails on the total phosphorus within the tributaries pleaserefer to Chapter 3 - Water Quality)Two invasive mussel species in<strong>Lake</strong> <strong>Simcoe</strong>: (a) zebra mussel;(b) quagga mussel.Chapter 5: Aquatic Natural Heritage 180
The <strong>Innisfil</strong> <strong>Creeks</strong> <strong>Subwatershed</strong> <strong>Plan</strong>The last component of the LSRCA <strong>Lake</strong> Science Research andMonitoring Program is monitoring invasive species with the goals ofassessing the impact on native biological communities, tracking changesthrough time, and identifying new risks (a complete list of invasivespecies within the tributaries and within <strong>Lake</strong> <strong>Simcoe</strong> can be found in theStressors section of this chapter). While some exotic species are studiedunder other projects (e.g. eurasian milfoil (Myriophyllum spicatum) andcurly-leaf pondweed (Potomogeton crispus) with aquatic plantmonitoring, spiny waterflea (Bythotrephes longimanus) with ourzooplankton projects), a targeted survey was carried out in 2009-10 tosupplement the annual benthic invertebrate monitoring and determine theextent of dreissenid mussel (zebra mussel, Dreissenia polymorpha; quagga mussel, Dreisseniarostriformis bugensis) impact on <strong>Lake</strong> <strong>Simcoe</strong>. Since their initial invasions in 1995 (zebramussel) and 2004 (quagga mussel), these two species have colonized a large portion of thelake area and have caused significant ecological changes, in particular to native food webs,shifted energy flow from shallow to deep water, and increased the penetration of sunlight intothe water column. The changes have resulted in a hardening of substrate in shallow water dueto mussel shells, a decline in native bivalve species (16 species were recorded in 1926-9, fourspecies are recorded at present – the two invasive mussels and extremely low numbers of twonative species which are on the threshold of extirpation in <strong>Lake</strong> <strong>Simcoe</strong>), an increase in plantbiomass due to deeper light penetration into the water column and a larger area now availablefor plant colonization. In general, these mussels are limited to sandy or hard substrates in <strong>Lake</strong><strong>Simcoe</strong>, and limited to depths shallower than 20 m. While this trend is followed for most of the<strong>Innisfil</strong> shoreline (i.e. southern Cook’s Bay north to Big Bay Point), Kempenfelt Bay is aninteresting exception where living dreissenids have been recorded growing in clumps on softersubstrates (i.e. mud and silt) to a maximum depth of 31 m (Figure 5-7b). Further studies arebeing undertaken to determine a reason for this exception.Overall, the goal of the LSRCA <strong>Lake</strong> Science Research and Monitoring Program is to monitorfor environmental changes in <strong>Lake</strong> <strong>Simcoe</strong>, fill existing data gaps, target emergingenvironmental issues, and understand linkages between current ecological stressors. In termsof the aspects highlighted within this section, the use of biological indicators highlights a holisticecosystem approach to lake management. This approach, using diatoms as a rapid assessmenttool, evaluates the nutrient runoff to <strong>Lake</strong> <strong>Simcoe</strong> from individual tributaries and allowsmanagement strategies to be specifically applied. Monitoring of benthic invertebrate and fishcommunities not only allows the evaluation of ecosystem health in these habitats, but also theirdevelopment as biological indicators for oxygen levels, contaminants, and nutrients. Nutrientflux from the land to the tributaries to <strong>Lake</strong> <strong>Simcoe</strong> is reflected in both the plant biomass andsediment phosphorus levels (higher nutrient supply from tributaries equals more phosphorus insediments and more plant biomass). In addition, the work with zebra and quagga mussels notonly provides monitoring of these invasive species but suggests how they are impacting <strong>Lake</strong><strong>Simcoe</strong> (high amounts of zebra mussels equals highfiltering of particles from the water column, allowinggreater light penetration and in turn more plant biomassand more offshore nutrients pulled to shallow waterhabitats).In terms of rating the condition of the nearshorehabitats, based on the three components above, theshoreline along the Town of <strong>Innisfil</strong> is considered to bein fair condition.Chapter 5: Aquatic Natural Heritage 181
<strong>Lake</strong> nearshore habitat of the <strong>Innisfil</strong><strong>Creeks</strong> subwatershed.Figure 5-7LegendRoadMunicipal BoundaryWatercourse<strong>Innisfil</strong> <strong>Creeks</strong>@ASampling Location@A@A@A@A@A@A @A@A@A@A@A @A@A@A@A@A@A@A@A@A@A@A @A @A @A@A @A@A @A @A@A@A@A0 0.5 1 2 3KilometresThis product was produced by the <strong>Lake</strong> <strong>Simcoe</strong> <strong>Region</strong> Conservation Authority and some information depicted on this map may have been compiledfrom various sources.While every effort has been made to accurately depict the information, data / mapping errors may exist.This map has been produced for illustrative purposes only.LSRCA GIS Services DRAFT created July 2010. © LAKE SIMCOE REGION CONSERVATION AUTHORITY, 2010. All Rights ReservedThe following datasets roads, municipal boundaries are © Queens Printer for Ontario, 2010. Reproduced with Permission@A@A@A@A @A @A@A@A@A@A@A@A@A@A @A@A@A@A@A@A@A @A@A@A@A@A@A@A@A@A@A@A@A@A@A@A@AK@A@A@A@A@A@A@A@A@A@A@A@A@A@A @A @A @AKempenfelt Bay@A@A@A @A@A@A @A @A @A @A@A @A@A @A @A@A @A @A @A@A@A@A@A@A@A@A@A@A@A@A@A@A @A@A@A@A@A@A @A@A@A@A@A@A@A@A@A@A@A@A@A@A@A@A@A@A@A@A@A@A @A@A@A@A@A@A @A@A @A@A @A@A@A@A@ACook'sBay@A@A @A@A@A@A@AA - <strong>Plan</strong>tsTotal Biomass(g (dry wt) · m -20 -
The <strong>Innisfil</strong> <strong>Creeks</strong> <strong>Subwatershed</strong> <strong>Plan</strong>5.2.3 Rare and endangered speciesThere are no known aquatic Species at Risk within the <strong>Innisfil</strong> <strong>Creeks</strong> subwatershed.The nearshore habitat from northern Cook’s Bay to Big Bay Point, while currently not supportinga high plant biomass due to sandy substrates along its shores, contains a relict population ofrare waterweed (Elodea nuttallii).Key Points - Current Aquatic Natural Heritage Status:• The <strong>Innisfil</strong> <strong>Creeks</strong> subwatershed is a diverse area and has 15 maintributaries and two main drains spread throughout the subwatershed. Thecondition of the creeks varies, with most having fair to poor ecologicalintegrity based on fish and benthic invertebrates, where data is available.Both Strathallan and White Birch Creek have generally good conditions, whileCedar Creek has the poorest conditions.• While Figure 5-2 shows the general shifts in fish community compositionwithin a system – from sites with cold water species to the next sites with onlywarm water (generalist) species, currently sufficient data is not available topinpoint when shifts take place and what caused them to do so.• Only Sandy Cove and Banks <strong>Creeks</strong> have historical presence of brook trout(key indicator species), with Sandy Cove Creek being the only creek withcurrent brook trout populations. While no specific studies have been done onthe spawning of species for these subwatersheds, there is evidence thatbrook trout may be successfully spawning and surviving in Sandy CoveCreek. As Banks Creek does not currently have a monitoring station on it, it isunknown whether this population continues to exist today. White Birch Creekthough has historical populations of mottled sculpin, as well as currentpopulations. Sandy Cove Creek, Burts Drain, and Leonard’s Creek all havecurrent populations as well.• The condition of the benthic communities varies from good to fairly pooracross the <strong>Innisfil</strong> <strong>Creeks</strong> subwatershed. Only Sandy Cove Creek has a siterated as poor, indicating very significant organic pollution at that location.• Of the 15 creeks, six do not have monitoring stations. Additionally, many ofthe creeks are missing benthic invertebrate data or have sections of the creekthat were not covered. The addition of this data may provide further in-depthlook at the conditions• The lake nearshore community around the Town of <strong>Innisfil</strong> shoreline is inrelatively fair condition based on having only moderate plant biomass fromnorthern Cook’s Bay to Big Bay Point, moderate sediment nutrientconcentrations, and invasive mussel species being limited to depthsshallower than 20 m.Chapter 5: Aquatic Natural Heritage 183
The <strong>Innisfil</strong> <strong>Creeks</strong> <strong>Subwatershed</strong> <strong>Plan</strong>5.3 Factors impacting status - stressorsThere are a number of land uses, activities and other factors that can have an effect on thehealth of the aquatic community in the subwatershed. These include:• Municipal drains,• Removal of riparian vegetation,• Water quality and thermal degradation,• Barriers,• Bank hardening and channelization,• Enclosures,• Uncontrolled stormwater and impervious surfaces,• Loss of wetlands,• Invasive species, and• Climate change.These factors are discussed in detail below:5.3.1 Municipal drainsMunicipal drains are generally located in rural agricultural areas and are intended to improve thedrainage of the surrounding land. Typically they are ditches or closed systems (buried pipes ortiles) and can include structures such as buffer strips, grassed water ways, dykes, berms,stormwater detention ponds, bridges, culverts, and pumping stations. Nowadays, a number ofcreeks and small rivers have been designated as municipal drains (OMAFRA, 2001).As these are direct links to watercourses, there are a number of impacts on the aquaticcommunities. The inputs into the drain consist of both overland flow and tile outlets and cancarry contaminants, sediment, and debris into the drain. With little to no riparian vegetation,water temperature is increased and the drain therefore becomes a source of warm water in thewatercourse system. Additionally, these drains come to be used as fish habitat. The issue withthis is that municipal drains require maintenance to ensure they continue to work properly. Whilemaintenance work is in progress, fish migration can be blocked and water quality can decline.The work itself may either negatively change or destroy fish habitat through altering or removalof the little riparian vegetation present, disrupting and changing bottom substrate compositionand altering the width-to-depth ratio.The construction and maintenance of municipal drains is regulated under the Ontario DrainageAct, while the protection of fish habitat is regulated under the federal Fisheries Act. To ensurethat drains are properly maintained, while fish habitat is minimally impacted, the Department ofFisheries and Oceans (DFO) developed a Class Authorization System. Drains are classified intosix types (A, B, C, D, E and F) based on the sensitivity of fish and fish habitat found in the drainand the type of work completed. Types A, B and C are considered to contain fish and fishhabitat more resilient to drain maintenance, while Types D and E have fish and habitat that areless resilient and maintenance work is determined on a case by case basis. Type F drains areintermittent and are usually dry for at least two consecutive months in the year. As fish habitat isnot an issue here when dry, the only conditions for the maintenance work are that it becompleted when dry and that soil is stabilized upon completion of work.Chapter 5: Aquatic Natural Heritage 184
The <strong>Innisfil</strong> <strong>Creeks</strong> <strong>Subwatershed</strong> <strong>Plan</strong>Figure 5-8 illustrates the municipal drains in the <strong>Innisfil</strong> <strong>Creeks</strong> subwatershed, based on thedrain type classification. This map shows five of the creeks have sections that are designatedmunicipal drains. Forty two percent of Sandy Cove Creek, in the northern part of thesubwatershed, is municipal drain. From Sideroad 25 to Sideroad 20 the main branch has beendesignated as Type D drain, while west of Sideroad 20 it is Type E. In both cases the creekcontains sensitive aquatic communities. The main northern branch though, is dry for more thantwo consecutive months and is therefore classified as a Type F municipal drain. There is also asmall northern branch near the mouth that is designated as a Type A drain, where there are nosensitive species or communities.The other creeks include Burts Drain with 51% designated as Type A municipal drain, BanksCreek with a combined 19% designated as Type A (southern headwater branch) and Type F(northern headwater branch), Carson Creek 12% Type A, and lastly White Birch has 2% of itswatercourse designated as Type C municipal drain.Chapter 5: Aquatic Natural Heritage 185
B A R R I EBIG BAY PT RDRIDGE RD WKempenfelt Bay<strong>Lake</strong><strong>Simcoe</strong>Municipal drains in the<strong>Innisfil</strong> <strong>Creeks</strong>subwatershedFigure 5-8LegendRoadMunicipal BoundarySIDERD 25LOCKHART RDWatercourseDrain Class400 HWY NRD10TH LINEABYONGE STSIDERD 109TH LINECINNISFIL BEACH RD7TH LINE6TH LINEMETRO RD NBASELINE RDWARDEN AVEWOODBINE AVEDEF<strong>Innisfil</strong> <strong>Creeks</strong><strong>Subwatershed</strong>SIDERD 105TH LINESIDERD 5HWY 400 S4TH LINE3RD LINEG E O R G I N APOLLOCK RDI N N I S F I L2ND LINECOUNTY RD 8914TH LINELINE 13Cook'sBayGLENWOODS AVERAVENSHOE RD0 0.5 1 2 3 4 5KilometresKThis product was produced by the <strong>Lake</strong> <strong>Simcoe</strong> <strong>Region</strong> Conservation Authority andsome information depicted on this map may have been compiled from various sources.While every effort has been made to accurately depict the information,data / mapping errors may exist.This map has been produced for illustrative purposes only.LSRCA GIS Services DRAFT created July 2010.© LAKE SIMCOE REGION CONSERVATION AUTHORITY, 2010. All Rights ReservedThe following datasets roads, municipal boundaries and Oak Ridges Moraine are© Queens Printer for Ontario, 2010. Reproduced with Permission
The <strong>Innisfil</strong> <strong>Creeks</strong> <strong>Subwatershed</strong> <strong>Plan</strong>5.3.2 Loss of riparian vegetationWhile many policies now afford some protection to the riparian areas adjacent to thewatercourses, this has not always been the case. In many instances, vegetation in the riparianareas of the subwatershed’s watercourses has been removed to accommodate urbandevelopment and agricultural activities, leaving the bank vulnerable to erosion due to theremoval of the stabilizing influence of the roots of the vegetation. This can result in inputs ofsediment into the watercourse, which can settle and smother the substrate, thus eliminatingimportant habitat used by fish for spawning and inhabited by benthic invertebrates. Sediment insuspension in the water can also interfere with the feeding of those fish species that are visualfeeders.Riparian vegetation is also an important source of allochthonous material such as leaves andbranches that serve as a food source for benthic invertebrates, and can also provide cover forfish.In addition, riparian vegetation serves to enhance water quality – it filters the water flowingoverland, causing sediment and other contaminants to settle out or be taken up prior to reachingthe watercourses; and also helps to moderate water temperatures through the shade itprovides. Removal of this vegetation can have an influence on the type of aquatic communityable to inhabit the watercourse – a reach that may have been able to support a healthycoldwater community may no longer be able to do so, and the community may shift to cool orwarm water community containing less sensitive species.5.3.3 Water quality and thermal degradationInputs of contaminants, including high levels of chloride and suspended sediment, towatercourses can be harmful to many species of fish and benthic invertebrates, particularly themore sensitive species. It can force them to leave their habitats, inhibit their growth, or causedie-offs if concentrations of a contaminant get too high.Specific information on water quality issues pertaining to the <strong>Innisfil</strong> <strong>Creeks</strong> subwatershed canbe found in Chapter 3 - Water Quality.Thermal degradation of a system can be caused by a number of factors. The first is the removalof riparian vegetation and the shade that it creates. If large portions of a watercourse areshaded, these areas may be key in maintaining cold or cool water temperatures or may berefuges for cool or cold water aquatic species during the hot summer temperatures. Runoff canalso cause thermal degradation in a system. As impervious surfaces (such as pavement) heatup from the sun they easily warm any water running over them, creating a warm water sourceas the water drains into a watercourse, possibly rendering the surrounding waters uninhabitablefor coldwater species. Lastly, the detention of water in a pond creates a source of warm waterinto a system as it increases the surface area of the water that is exposed to sunlight, andkeeps it there for a prolonged period of time, leading to warming. Although online ponds are thegreatest concern due to their direct impact on the watercourse, offline ponds (includingstormwater ponds and detention ponds for irrigation) that discharge to watercourses are also aconcern.Figure 5-9 illustrates the OMNR approved temperature designation of the creeks (and thetemperature at which they are managed at based on timing restrictions for in-water works) withcurrent temperature ratings. Where the current ratings differ from OMNR designations (i.e. coolor warm water readings on cold water system) it indicates that the creek is experiencing thermaldegradation.Chapter 5: Aquatic Natural Heritage 187
B A R R I EBIG BAY PT RDRIDGE RD WKempenfelt Bay<strong>Lake</strong><strong>Simcoe</strong>Thermal degradation inthe <strong>Innisfil</strong> <strong>Creeks</strong>subwatershed.Figure 5-9LegendRoadMunicipal BoundarySIDERD 25RD400 HWY NLOCKHART RD10TH LINETiming RestrictionsOctober 1 to June 1March 1 to June 30April 1 to June 30SIDERD 109TH LINEINNISFIL BEACH RD7TH LINE6TH LINEYONGE STMETRO RD NBASELINE RDWARDEN AVEWOODBINE AVECurrent Temperature") Cold") Cool") WarmSIDERD 105TH LINESIDERD 5HWY 400 S4TH LINE3RD LINEG E O R G I N APOLLOCK RDI N N I S F I L2ND LINECOUNTY RD 8914TH LINELINE 13Cook'sBayGLENWOODS AVERAVENSHOE RD0 0.5 1 2 3 4 5KilometresKThis product was produced by the <strong>Lake</strong> <strong>Simcoe</strong> <strong>Region</strong> Conservation Authority andsome information depicted on this map may have been compiled from various sources.While every effort has been made to accurately depict the information,data / mapping errors may exist.This map has been produced for illustrative purposes only.LSRCA GIS Services DRAFT created July 2010.© LAKE SIMCOE REGION CONSERVATION AUTHORITY, 2010. All Rights ReservedThe following datasets roads, municipal boundaries and Oak Ridges Moraine are© Queens Printer for Ontario, 2010. Reproduced with Permission
The <strong>Innisfil</strong> <strong>Creeks</strong> <strong>Subwatershed</strong> <strong>Plan</strong>5.3.4 BarriersBarriers to fish movement in the form of dams, perched culverts, and enclosed watercoursesserve to fragment a fishery by preventing fish from accessing important parts of their habitat.The impoundments created by dams serve to increase water temperatures, raise bacterialevels, and disrupt the natural movement of fish, benthic invertebrates, sediment, and nutrients.The natural movement of each is imperative for a healthy aquatic system.The <strong>Lake</strong> <strong>Simcoe</strong> Basin Best Management Practice Inventory (LSRCA, 2009) looked at barriersto fish movement, which included dams, perched culverts, weirs, and other barriers, andsections of the bank that have been hardened or channelized. The BMP inventory covered 88%,of the watercourses in the <strong>Innisfil</strong> <strong>Creeks</strong> subwatershed.A total of 69 barriers to fish movement have been identified in the <strong>Innisfil</strong> <strong>Creeks</strong> subwatershedthus far (Figure 5-10).Chapter 5: Aquatic Natural Heritage 189
RIDGE RD WKempenfelt Bay<strong>Lake</strong><strong>Simcoe</strong>Barriers to fish movementin the <strong>Innisfil</strong> <strong>Creeks</strong>subwatershed.Figure 5-10B A R R I EBIG BAY PT RDLegendBarrierRoadSIDERD 25LOCKHART RDMunicipal BoundaryBMP Watercourse Surveyed400 HWY NRD10TH LINEWatercourseYONGE STSIDERD 109TH LINEINNISFIL BEACH RD7TH LINE6TH LINEMETRO RD NBASELINE RDWARDEN AVEWOODBINE AVESIDERD 105TH LINESIDERD 5HWY 400 S4TH LINE3RD LINEG E O R G I N APOLLOCK RDI N N I S F I L2ND LINECOUNTY RD 8914TH LINELINE 13Cook'sBayGLENWOODS AVERAVENSHOE RD0 0.5 1 2 3 4 5KilometresKThis product was produced by the <strong>Lake</strong> <strong>Simcoe</strong> <strong>Region</strong> Conservation Authority andsome information depicted on this map may have been compiled from various sources.While every effort has been made to accurately depict the information,data / mapping errors may exist.This map has been produced for illustrative purposes only.LSRCA GIS Services DRAFT created July 2010.© LAKE SIMCOE REGION CONSERVATION AUTHORITY, 2010. All Rights ReservedThe following datasets roads, municipal boundaries and Oak Ridges Moraine are© Queens Printer for Ontario, 2010. Reproduced with Permission
The <strong>Innisfil</strong> <strong>Creeks</strong> <strong>Subwatershed</strong> <strong>Plan</strong>5.3.5 Bank hardening and channelizationIn the past it has been common practice to straighten watercourses to accommodate variousland uses, and to harden banks as a way to prevent stream bank erosion and increase‘developable’ area. While we now know that these practices are harmful to the environment andcan cause more issues that they resolve, there are several areas in the subwatersheds wherethese practices have been utilized.Water generally flows more quickly through a channelized section of stream, particularly duringhigh flow events. This increase in flow can have several effects:• Unstable banks in the channelized section (if they are not hardened)• Flooding downstream of the channelized section (water is confined to the channel, whichresults in larger volumes of water flowing more rapidly than under natural conditionsbeing conveyed to downstream sections)• Changes to the migration patterns of fish (and wildlife)• Bank erosion downstream of the channelized section• Sediment deprivation in channelized sections• Sedimentation downstream of the channelized sections where the flow of water slowsThese effects result in the degradation of aquatic habitat. The riffle/pool sequences that occur innatural channels are lost in the channelized section as well as downstream. Much of the naturalcover in the watercourse can be lost. Fluctuating flow levels can place stress on the aquaticbiota, and in many cases can cause a shift from a more sensitive community to one that isbetter able to tolerate adverse conditions. Finally, the deposition of sediment as the water slowscoming out of the channelized section can blanket the substrate, interfering with spawningactivities and affecting the benthic invertebrate community.There were 183 instances of bank hardening and channelization along sections of streamidentified in the <strong>Innisfil</strong> <strong>Creeks</strong> subwatersheds through the BMP Inventory; these are depicted inFigure 5-11. Most sites in <strong>Innisfil</strong> <strong>Creeks</strong> were located along the main branches and closer tothe mouth, though there are a number of sites in the headwaters of most of the creeks.Of the number of sites identified to have bank hardening (106), 40 were failing. These failingsites should therefore be priorities for restoration activities, though the remaining sites are likelystill having habitat impacts and should also be explored as resources allow. As this inventorywas completed for the majority of the watercourses (88%) within the <strong>Innisfil</strong> <strong>Creeks</strong>subwatershed, the total number of river sections that have been channelized is relativelyaccurate, but could increase with the study of the sections of the watercourses that were notcovered in the first phases of the inventory.5.3.6 EnclosuresPast development practices allowed for the enclosure or piping of creeks. These enclosures notonly create barriers for fish migration and fragment the fish and wildlife populations but alsothreaten the public through the potential for flooding. While the enclosure of watercourses in the<strong>Innisfil</strong> <strong>Creeks</strong> subwatershed is not as prevalent as in the Barrie <strong>Creeks</strong> subwatershed (locatedat the west end of Kempenfelt Bay), there are a few instances of it, including a significantportion of Bon Secours Creek and Sylvan Creek.Chapter 5: Aquatic Natural Heritage 191
RDRIDGE RD WKempenfelt Bay<strong>Lake</strong><strong>Simcoe</strong>Bank hardening and /orchannelization in the<strong>Innisfil</strong> <strong>Creeks</strong> subwateshed.Figure 5-11B A R R I EBIG BAY PT RDLegendRoadMunicipal BoundarySIDERD 25Watercourse400 HWY NLOCKHART RDBank Hardening andor Channelization10TH LINEBMP Watercourse SurveyedYONGE STSIDERD 109TH LINEINNISFIL BEACH RD7TH LINE6TH LINEMETRO RD NBASELINE RDWARDEN AVEWOODBINE AVESIDERD 105TH LINESIDERD 5HWY 400 S4TH LINE3RD LINEG E O R G I N APOLLOCK RDI N N I S F I L2ND LINECOUNTY RD 8914TH LINELINE 13Cook'sBayGLENWOODS AVERAVENSHOE RD0 0.5 1 2 3 4 5KilometresKThis product was produced by the <strong>Lake</strong> <strong>Simcoe</strong> <strong>Region</strong> Conservation Authority andsome information depicted on this map may have been compiled from various sources.While every effort has been made to accurately depict the information,data / mapping errors may exist.This map has been produced for illustrative purposes only.LSRCA GIS Services DRAFT created July 2010.© LAKE SIMCOE REGION CONSERVATION AUTHORITY, 2010. All Rights ReservedThe following datasets roads, municipal boundaries and Oak Ridges Moraine are© Queens Printer for Ontario, 2010. Reproduced with Permission
The <strong>Innisfil</strong> <strong>Creeks</strong> <strong>Subwatershed</strong> <strong>Plan</strong>5.3.7 Uncontrolled stormwater and impervious surfacesUrban stormwater runoff occurs as rain or melting snow washes off streets, parking lots androoftops of dirt and debris, minor spills, and landscaping chemicals and fertilizers. In the past itwas common practice to route stormwater directly to streams, rivers, or lakes in the mostefficient manner possible. This practice typically has negative impacts on the receivingwatercourse. Over the last two decades these practices have changed and efforts are made tointercept and treat stormwater prior to its entering watercourses or water bodies. However, inmany older urban areas stormwater typically still reaches watercourses untreatedAs the amount of impervious area increases, the natural water balance is disrupted.Evapotranspiration is decreased as there is little vegetation and the permeable soil surface ispaved over; infiltration to groundwater is significantly reduced; and thus the runoffcharacteristics change. This results in increases in the frequency and magnitude of runoffevents, a decrease in baseflow, and an increase in flow velocities and energy (further changesto the hydrologic regime are discussed in greater detail in Chapter 4 - Water Quantity). Thesechanges further affect the form of the morphology of the stream, including channel widening,under cutting, sedimentation, and channel braiding.One of the most significant impacts of stormwater runoff though, is to water quality. Problemswith degraded water quality directly affect the aquatic ecosystem. This occurs as pollutants arewashed off of streets, parking lots, rooftops and roadways into storm drains or ditches whichdischarge to watercourses and lakes. Generally, concentrations of pollutants such as bacteria(e.g. Escherichia coli, faecal coliform, Pseudomonas aeruginosa, and faecal streptococci),nutrients (e.g. phosphorus, nitrogen), phenolics, metals, and organic compounds are higher inurban stormwater runoff than the acceptable limits established in the PWQO (MOE, 1994).Other associated impacts include increased water temperature and the collection of trash anddebris.All of these changes can cause considerable stress to aquatic biota, and can cause a shift froma community containing more sensitive species to one containing species more tolerant ofdegraded conditions (Figure 5-12).Chapter 5: Aquatic Natural Heritage 193
The <strong>Innisfil</strong> <strong>Creeks</strong> <strong>Subwatershed</strong> <strong>Plan</strong>Figure 5-12: Pathways by which impervious surfaces may impact aquatic biological communities(ORMCP Technical Paper Series, #13).5.3.8 Loss of wetlandsWhile the current status and stressors to wetlands are covered in more detail in Chapter 6 -Terrestrial Natural Heritage, it is important to highlight the significant relationship they havewith nearby aquatic systems. Wetlands are important to the aquatic natural heritage system asthey store water and reduce flooding, prevent erosion along banks and are a source ofgroundwater recharge and discharge. They also improve the quality of water that filters throughthem into the creeks by removing sediments, pathogens, nutrients, and pesticides.5.3.9 Invasive speciesThe traits possessed by non-native invasive species, including aggressive feeding, rapidgrowth, prolific reproduction, and the ability to tolerate and adapt to a wide range of habitatconditions enable them to outcompete native species for food, water, sunlight, nutrients, andspace. This may result in the eventual reduction in the number and abundance of nativespecies. The replacement of native species with introduced affects the balance of theecosystem, as species that relied on the native species for food, shelter and other functions noweither have to move to another area with these species, or must utilize another source that isperhaps less desirable. This cycle reverberates throughout the ecosystem, and can beexacerbated by the introduction of additional invasive species. Ecosystems that are alreadyunder stress are particularly vulnerable to invasion by non-native species, as the existingecosystem is not robust enough to maintain viable populations of native species as the invasivespecies become established. The process may happen more quickly in already disturbedsystems than it would in a healthy community.Chapter 5: Aquatic Natural Heritage 194
The <strong>Innisfil</strong> <strong>Creeks</strong> <strong>Subwatershed</strong> <strong>Plan</strong>There are no known invasive species within the <strong>Innisfil</strong> <strong>Creeks</strong> subwatershed. However, theround goby (Neogobius melanostomus), an invasive species native to Eurasia and transportedto the Great <strong>Lake</strong>s in ballast water was recently transplanted from <strong>Lake</strong> Erie to <strong>Lake</strong> <strong>Simcoe</strong>,most probably via a baitfish transfer. The species has already been noted within the PefferlawRiver and its mouth in <strong>Lake</strong> <strong>Simcoe</strong>, the Black River and is anticipated to occupy theMaskinonge River subwatershed (three subwatersheds to the east of <strong>Innisfil</strong> <strong>Creeks</strong>) within afew years. Additionally, during the 2011 sampling season, round goby were found at the mouthof both Lovers and Hewitt’s Creek (neighbouring subwatersheds to the west). Because of theaggressive and fertile characteristics of the round goby, as well as their recent introduction inneighbouring subwatersheds, it is thought to be likely this species will eventually reach thewatercourses in the <strong>Innisfil</strong> <strong>Creeks</strong> subwatersheds.In addition to the round goby, there are also a number of invasive species indentified in <strong>Lake</strong><strong>Simcoe</strong> that can impact the nearshore environments and the tributaries. These include:• Eurasian Watermilfoil (Myriophyllum spicatum),• Curly-leaf Pondweed (Potomogeton crispus),• Common Carp (Cyprinus carpio),• Rainbow Smelt (Osmerus mordax),• Spiny Waterflea (Bythotrephes longimanus),• Rusty Crayfish (Orconectes rusticus),• Zebra Mussel (Dreissenian polymorpha), and• Quagga Mussel (Dreissenian rostriformis begensis).The LSPP includes a number of polices (7.1-SA to 7.10SA) to prevent the introduction ofinvasive species into the <strong>Lake</strong> <strong>Simcoe</strong> watershed. Of most importance is Policy 7.4-SA thatrequires that a “watch list” be developed and that response plans for those species on the list beprepared. These response plans will detail the actions that should be taken if the species aredetected within the watershed. The following organisms are on the aquatic watch list:• Fanwort (Cabomba caroliniana): A submersed freshwater perennial plant that isextremely persistent and competitive. Under suitable environmental conditions, it canform dense stands, crowding out previously well-established plants.• European water chestnut (Trapa natans): Native to Europe, Asia, and Africa T. natans isan invasive aquatic plant that can form dense mats of floating vegetation.• Water soldier (Stratiotes aloides): An aquatic plant commonly sold in the aquarium andwater garden industry. The plant is native to Europe and Central Asia, but has beenidentified in the Trent Severn Waterway near the hamlet of Trent River. Water soldierforms dense large masses of plants which crowd other aquatic plants.Invasive plant species on aquatic ‘watch list’: (A) fanwort, (B) European water chestnut,and (C) water soldier. (Photo Credits: Ontario’s Invading Species Program)Chapter 5: Aquatic Natural Heritage 195
The <strong>Innisfil</strong> <strong>Creeks</strong> <strong>Subwatershed</strong> <strong>Plan</strong>• Asian carps: The term “Asian carps” refers to four invasive species (bighead, silver,grass, and black carp) that were brought to North America in the 1960s and 70s. Sincethen they have migrated north through U.S. waterways toward the Great <strong>Lake</strong>s,replacing native species in their path.• Viral hemorrhagic septicaemia: A deadly infectious fish disease caused by the viralhemorrhagic septicemia virus. The virus can be spread from fish to fish through watertransfer, as well as through contaminated eggs and bait fish from infected waters.5.3.10 Climate ChangeRecent work from an MOE Vulnerability Report for <strong>Lake</strong> <strong>Simcoe</strong> watershed wetlands, streamsand rivers (Chu, 2010) is suggesting that climate change over the next 90 years will increasestream temperatures 1.3°C above current conditions. This prediction essentially threatens mostcoldwater streams in the entire <strong>Lake</strong> <strong>Simcoe</strong> watershed. A model looked at the likelihood of thesubwatersheds being able to retain cold water species in 2055 using maximum air temperaturesand groundwater discharge potential (Table 5-2). Those with high groundwater dischargepotential could provide thermal refuge for cold water species, despite increasing airtemperatures. Long term monitoring will be needed to assess the impacts of climate change toaquatic communities, where the key shifts are taking place and how they might be mitigated.Table 5-2: Likelihood of watersheds to retain cold water species in 2055 using maximum airtemperature projections from the Canadian Global Model 2 A2 scenario andgroundwater discharge potential (Source: Chu et al., 2008).Likelihood to retain cold-water speciesLow Mid HighMaximum air temperature (°C) >29.34 28.49 – 29.34
The <strong>Innisfil</strong> <strong>Creeks</strong> <strong>Subwatershed</strong> <strong>Plan</strong>Studies like this highlight the importance of protecting and building more resilience throughinstream rehabilitation, barrier removal, stream bank planting, the use of natural channel designduring channel reconstruction, water quality protection in both urban and rural settings, andwetland protection. However, perhaps the most important way to address the risks of climatechange is through the protection and maintenance of the current groundwater rechargedischargesystem that supports this subwatershed.Key Points- Factors impacting Aquatic Habitat – stressors• There are many stressors to the aquatic natural heritage systems in thesesubwatersheds, many of which result in a cumulative impact.• As rural and agricultural land use surrounds the majority of the headwater area ofthe <strong>Innisfil</strong> <strong>Creeks</strong> subwatershed, and is also found along the length of many of itswatercourses, the most significant stressors include municipal drains, removal ofriparian vegetation, and water quality and thermal degradation.• Physical changes such as barriers, bank hardening, and channelization also playa large role in determining the current state of the aquatic community in thesystems.• Habitat quality and quantity is also impacted by changes in flow regime resultingfrom land use changes, stream alterations, municipal drains, loss of nearbywetlands, uncontrolled stormwater, and an increase in impervious surface cover.Increased flow degrades habitat through processes such as bank erosion.Decreased flow can lead to a temporary or permanent reduction in the amount ofaquatic habitat present. Poor water quality (indicated by poor benthic scores) andthermal degradation have also negatively impacted the aquatic communities.• The emerging threat of climate change will interact with all of these threats,creating additive long-term stresses on the aquatic systems. Although research inthis area is still emerging, initial predictions suggest the <strong>Innisfil</strong> <strong>Creeks</strong>subwatershed may be able to maintain cold water attributes.Chapter 5: Aquatic Natural Heritage 197
The <strong>Innisfil</strong> <strong>Creeks</strong> <strong>Subwatershed</strong> <strong>Plan</strong>5.4 Assessment of Tributaries5.4.1 <strong>Innisfil</strong> <strong>Creeks</strong> subwatershedAs the <strong>Innisfil</strong> <strong>Creeks</strong> subwatershed is a diverse area and there are 15 small tributaries (and anumber of even smaller creeks, two of which have monitoring stations on them) spread alongthe subwatershed, they are analyzed individually, where data is available, to give a closer lookat the conditions across the subwatershed. Nine of the tributaries and two small creeks (BurtsDrain and McLean Creek) are individually assessed based on the aforementioned analyses, aswell as incorporating land use and soil information from Figures 2-3 and 2-17, Chapter 2 –Study Area and the location of potential discharge and recharge areas on Figures 4-12 and 4-14, Chapter 4 – Water Quantity. Stressors in each of the creeks are also included to create acomplete picture of the system. The remaining six tributaries do not have fish or benthic dataavailable at this time, but a general analysis of surrounding conditions is included. Where itmentions ‘no data available’, there may be data on the watercourse collected by sources otherthan LSRCA (such as consultants), but it has not been collected to a standard to run the fishand benthic indices used within this report.Strathallan CreekStrathallan Creek is located at the northern end of the subwatershed, along the shore ofKempenfelt Bay. There is one monitoring site located near the mouth of this cold water system(Figure 5-2). The creek consists of two main branches and the entire system is located ingravelly sandy loam with high infiltration rates. Potential groundwater recharge areas arelocated along the whole creek, corresponding with the high infiltration rates and a potentialdischarge area at the headwaters of the western branch, contributing to the cold water attributesof the creek. Surrounding land use consists mainly of natural heritage cover with very smallportions of urban development scattered mostly along the eastern branch.The Index of Biotic Integrity (IBI) evaluation, done on the fish communities to evaluate theecological integrity of the creek, has assessed the site near the mouth as being in fair condition.Even though this creek has no historic or present record of brook trout (Figure 5-4), there arecurrently mottled sculpin present (Figure 5-5) indicating that this creek could provide suitablebrook trout habitat. Current cool water temperatures recorded at the monitoring sites indicatethat a degree of thermal degradation may be occurring (Figure 5-9) within this system. There isone known barrier that may be blocking fish migration upstream(Figure 5-10), but no bank hardening or channelization (Figure5-11). At present time no benthic invertebrate studies have beencompleted for this creek.Longnose dace(Rhinichthys cataractae)Overall, Strathallan Creek is only moderately stressed at the onemonitoring site at the mouth, based on the fish IBI, presence of acold water species (mottled sculpin), and the lack of bankhardening and channelization. Further studies, including benthicinvertebrates, may provide a better idea of the condition of thissystem.Sandy Cove CreekSandy Cove Creek is the northern most creek in the subwatershed, and drains east into <strong>Lake</strong><strong>Simcoe</strong>. It is a cold water creek with six monitoring stations distributed from the mouth along themain branch to the headwaters and one on a large northern branch. The soil type varies downChapter 5: Aquatic Natural Heritage 198
The <strong>Innisfil</strong> <strong>Creeks</strong> <strong>Subwatershed</strong> <strong>Plan</strong>the length of the creek, with the headwaters inloam and loamy sand with moderateinfiltration rates, down into the main branchthrough organics with slow infiltration rates.The northern branch stretches up throughorganics with both very slow infiltration rates(near confluence with main branch) and highinfiltration rates (near the headwaters of thebranch). The remainder of the main branch tothe mouth goes through fine sandy loam withmoderate infiltration rates. There are smallamounts of potential recharge areas along thelower main branch and surrounding theMouth of Sandy Cove Creekheadwaters. There are two potential largedischarge areas, one in the upper reaches of the main branch and one around the headwatersof the northern branch. The headwaters and two-thirds of the main branch run through naturalheritage cover and rural and agricultural land use. As the creek flows down to <strong>Lake</strong> <strong>Simcoe</strong> itgoes through both natural heritage cover and urban areas.Fish were captured at all sites except for one on a small northern tributary near the mouth. Twoof the monitoring sites (at the mouth and the 3 rd site upstream) had cold water species captured.One site had cold water temperatures recorded, while the other had cool water temperatures.The other four sites had only warm water species present in recorded warm and cold watersections of the creek (Figure 5-2). Based on the IBI analysis of the sites with fish, the ecologicalintegrity is good to fair near the mouth, good at the 3 rd site which has brook trout present,decreasing further upstream to fair at the confluence of the main branch and the northernbranch, and poor at the headwaters (Figure 5-3). Brook trout havebeen historically caught at the mouth and the 3 rd site upstream,but are now only found at the third site where there is coldwaterhabitat (Figure 5-4). Approximately equal numbers of adults andyoung of the year were caught at this site, suggesting that brooktrout are successfully spawning and surviving at this site. Mottledsculpin, while not historically found within this system, arecurrently found at the mouth and same site as the brook trout(Figure 5-5).The analysis of the benthic invertebrate communitiesBrook trout(Salvelinus fontinalus)(Hilsenhoff) was completed at five of the seven sites and rates theecological integrity of the creek as fairly poor at the mouth, fairlypoor to poor at the confluence of the northern branch, and goodat the headwaters (Figure 5-6). The discrepancy between the two indices in the headwaterratings is due to the fact that this area of the creek is narrow and has very little water in it,making it unsuitable habitat for most fish species, but it does have a pocket of wetland justupstream of the sampling site and tall riparian grasses filtering runoff from nearby agriculture,providing good water quality for benthics.As previously mentioned, this is a cold water creek, but current data show that only theheadwater site and one site midstream are still recording cold water temperatures, while the oneat the mouth has cool water temperatures. The sites at the mouth and the cold water sitemidstream are the only ones with cold water fish species present (Figure 5-2). The rest of themonitoring sites have warm water temperatures recorded (Figure 5-9) indicating stressors in thearea have lead to thermal degradation of this creek and may be limiting the habitat of cold waterfish species. It should be noted that the majority of the creek has also been designated as amunicipal drain and will experience maintenance work when necessary (Figure 5-8). FromChapter 5: Aquatic Natural Heritage 199
The <strong>Innisfil</strong> <strong>Creeks</strong> <strong>Subwatershed</strong> <strong>Plan</strong>Sideroad 25 to Sideroad 20 the main branch has been designated as Type D drain, while westof Sideroad 20 it is Type E. In both cases the creek has sensitive aquatic communities and anymaintenance work is determined on a case by case basis. The main northern branch though, isdry for more than two consecutive months and is therefore classified as a Type F municipaldrain. The drying up of this creek could be one of the reasons that the sites at its confluencewith the main branch are experiencing warmer temperatures. In addition, the small northernbranch near the mouth (with no fish present) is designated as a Type A municipal drain.Furthermore, there are two known barriers to fish movement in this system (Figure 5-10), one ofwhich is a dam along a southern branch. As there is no monitoring station beyond the dam, it isunclear what impacts it has on the aquatic communities. Bank hardening and channelizationhave occurred in various locations along the branches of the creek (Figure 5-11) and historicalstraightening can be seen by 90° angles of some of the creek branches (i.e. along Sideroad 25).Overall, aquatic communities are showing signs of being stressed as there is low abundanceand diversity of fish in the headwaters and down through the upper reaches, and the benthicinvertebrates indicate there is significant organic pollution (with the exception of the headwaters)through the system. The sites nearest the mouth are providing better quality habitat for coldwater species, which also happens to be where the creek is not designated as municipal drain.Mooselanka CreekMooselanka Creek, located just south of Sandy Cove Creek, is a coldwater creek and has nomonitoring sites (Figure 5-2). The creek flows through a variety of soils. Headwaters are in siltyclay loam with slow infiltration rates and flows down through loam (moderate infiltration), finesandy loam (high infiltration), loamy sand (high infiltration), gravelly sandy loam (moderateinfiltration), and finally fine sandy loam around the mouth with moderate infiltration rates. Thereare few potential recharge areas in the vicinity of the creek and potentially a small dischargearea in the headwaters. The majority of the creek is surrounded by urban land use and naturalheritage cover, with headwater branches bordered byagricultural and rural land use. There are a few knownbarriers to fish movement in the lower main branch(Figure 5-10) and bank hardening and channelizationhas occurred in only a couple locations in the mid andlower reaches (Figure 5-11).As there are currently no fish, benthic, or currenttemperature data (collected to LSRCA’s standards)available, the ecological integrity of this system was notrated.Portion of Mooselanka CreekBurts DrainBurts Drain, one of the smaller creeks that are not main tributaries, is a small cold water systemwith one monitoring station. The entire watercourse is located in organic soil with slow infiltrationrates. There is one potential recharge area near the mouth and no discharge areas. Land usealong the northern banks is natural heritage while the southern banks are within residentialareas.Despite warm water temperature readings, cold water fish species were captured at themonitoring site (Figure 5-2). While there is no historical or current record of brook troutinhabiting the drain (Figure 5-4), mottled sculpin, which require similar habitats, have beenChapter 5: Aquatic Natural Heritage 200
The <strong>Innisfil</strong> <strong>Creeks</strong> <strong>Subwatershed</strong> <strong>Plan</strong>caught in recent years (Figure 5-5). The IBI analysis ranks the ecological integrity of the systemas fair (Figure 5-3) and currently there are no benthic invertebrate studies available.Mottled sculpin(Cottus bairdi)There are no known barriers to fish movement and only twoinstances of bank hardening and channelization, which arealso apparent from the figure, as the branch of the drain arestraight and follow 90° angles (Figure 5-10, Figure 5-11).The straightened main branch is designated as a Type Amunicipal drain. As this indicates there are no sensitivecommunities here, maintenance work includes brushing ofthe side slope, clean out of the bottom of the bed, and cleanout of debris. Depending on the regularity of work done onthe creek, maintenance of the drain may be contributing tothe thermal degradation of the site from cold water to thecurrent warm water readings at the monitoring site (Figure5-9).Overall, the aquatic communities in Burts Drain are somewhat stressed. Coldwater fish arepresent, but the abundance and diversity of fish species is low. Additionally, if warm watertemperatures persist, this creek may no longer provide suitable habitat for mottled sculpin orother coldwater species. Further studies, including benthic invertebrates, may provide a betteridea of the condition of this system.Leonard’s CreekLeonard’s Creek is a cold water creek (with one warmwater branch) located just south of BurtsDrain and has four monitoring sites located along its branches. Soil type varies greatly along themany branches of this creek going from gravelly sandy loam (high infiltration) and fine sandyloam (moderate infiltration) in the headwaters,down through silty clay loam (slow infiltration),loam (moderate infiltration) and back through finesandy loam (moderate infiltration) and gravellysandy loam (moderate infiltration) at the mouth.There are small amounts of potential rechargeareas in the headwaters, where infiltration ratesare high to moderate, and no potential dischargeareas. The main southern branches go throughmainly urban land use and small patches ofnatural heritage cover. The northern branches gothrough similar land uses near the mouth buthave headwaters in primarily rural and agriculturalLeonard’s Creeklands.Despite being a cold water system, only the site closest to the mouth had cold water speciescaptured (the other three had warm water species) (Figure 5-2). The IBI analysis rated theecological integrity of the system as good at the site near the mouth, fair for the next siteupstream and poor at the headwaters of both the main branches (Figure 5-3). There is nohistorical or current record of brook trout occupying this creek, but current data show mottledsculpin to be present at the site closest to the mouth (Figure 5-4, Figure 5-5). The Hilsenhoffindex differs from the IBI ratings, with the two sites on the main branch and the northernheadwater site being rated as fair and the southern headwater site being good (Figure 5-6).Again, this is because the creeks in the headwaters are narrow with minimal water to supportChapter 5: Aquatic Natural Heritage 201
The <strong>Innisfil</strong> <strong>Creeks</strong> <strong>Subwatershed</strong> <strong>Plan</strong>Pumpkinseed(Lepomis gibbosus)many fish species. The fair ratings of the benthicsindicate that there is fairly significant organicpollution and that neighbouring land uses may beimpacting the water quality.As three of the sites record cool water temperaturesand only the fourth site on a northern branch hascold water, thermal degradation may be occurringalong the main branch (Figure 5-9) anddiscouraging cold water species. There are also fourknown barriers to fish movement (Figure 5-10), which may be preventing many species frommigrating upstream, and causing the poorer ratings in the IBI. There are only a few instances ofrecent bank hardening and channelization (Figure 5-11), but historical straightening of the creekcan be seen along the 9 th Line.Overall, aquatic communities are showing signs of being stressed as there is low abundanceand diversity of fish in the headwaters and benthics indicate there is fairly significant organicpollution (with the exception of the headwaters) through the system. The site closest to themouth is providing more adequate habitat for cold water species, but as the temperatureremains consistently cool to cold throughout the creek, it is unclear why these species are notmigrating further upstream.Bon Secours CreekBon Secours Creek consists of one main tributary, located south of Leonard’s Creek, and is oneof the few warm water creeks in the <strong>Innisfil</strong> <strong>Creeks</strong> subwatershed. There are no fish, benthic, ortemperature monitoring sites along this creek (Figure 5-2). The headwaters of the creek are ingravelly sandy loam and silty clay loam, with moderate and slow infiltration rates, respectively.The rest of the creek runs through fine sandy loam (moderate infiltration) and loamy sand (highinfiltration). A small section at the mouth is in organic soils with moderate infiltration rates. Thereare potentially small groundwater recharge areas along the upper reach and no discharge areasare identified in the vicinity of the creek.The headwaters of this creek are surrounded by bothgolf courses and natural heritage cover. The rest ofthe creek is surrounded by urban land uses with themouth located in <strong>Innisfil</strong> Beach Park. There are threeknown barriers to fish movement (Figure 5-10) andsubstantial bank hardening and channelization wherethe creek has been straightened and runs parallelwith <strong>Innisfil</strong> Beach Road (Figure 5-11).As there are currently no fish, benthic invertebrate, orcurrent temperature data (collected to LSRCA’sstandards) available, the ecological integrity of thissystem was not rated.Mouth of Bon Secours Creek into<strong>Lake</strong> <strong>Simcoe</strong>McLean CreekMcLean Creek, one of the smaller creeks which are not main tributaries, is a small cold watersystem with one monitoring station. The creek is entirely within loamy sand with high infiltrationChapter 5: Aquatic Natural Heritage 202
The <strong>Innisfil</strong> <strong>Creeks</strong> <strong>Subwatershed</strong> <strong>Plan</strong>rates. There are no groundwater recharge or discharge areas along the creek. Surrounding landuse is almost completely urban with headwaters located in a small patch of natural heritagefeatures.Bluntnose minnow(Pimephales notatus)Despite being a cold water system, only warm waterspecies have been captured at this site (Figure 5-2).There are also no historical or current record of coldwater indicator species, brook trout and mottled sculpin,being present within the creek (Figure 5-4, Figure 5-5).The IBI analysis ranks the ecological integrity of thesystem as fair (Figure 5-3) and currently there are nobenthic invertebrate studies available. The currenttemperature rating at the monitoring site is cool, indicatingthere may be thermal degradation of the system (Figure 5-9) that is discouraging cold waterspecies. There are no known barriers to fish movement (Figure 5-10) but channelization andbank hardening has occurred near the mouth (Figure 5-11).Overall, based on the fish IBI and stressors, the aquatic communities within this system aresomewhat stressed due to surrounding land uses. Further studies, including benthicinvertebrates, may provide a better idea of the condition of this system.Banks CreekBanks Creek is a large coldwater creek located to the south of McLean Creek, with nomonitoring sites (Figure 5-2). The creek flows through a variety of soils. The headwaters of thevarious branches are in organics (moderate infiltration), loamy sand (moderate infiltration), siltyclay loam (slow infiltration), and fine sandy loam with moderate infiltration rates. The creekcontinues to flow down through fine sandy loam into loamy sand with high infiltration rates.There are a few potential recharge areas in the upper branches and two large potentialdischarge areas at the headwaters of the southern branches corresponding to the low tomoderate infiltration rates. The headwaters of the creek and are in both natural heritage coverand surrounded by agricultural and rural land use. The section from mid way down the creek tothe mouth is almost entirely urban land use.There is historic record of Banks Creek having brook trout (Figure 5-4), but as there is nomonitoring station on the system, it is unknown whether this population continues to exist today.Banks Creek has five known barriers to fish movement in the mid to upper reaches of thesystem (Figure 5-10) and there are quite a few instances of bank hardening and channelizationin the mid to lower reaches (Figure 5-11). Additionally, part of the headwaters of the largenorthern branch is designated as a Type F municipal drain (is dry for two consecutive months)and the southern branch as a Type A municipal drain (no sensitive communities) (Figure 5-8).Again, without monitoring stations it is unclear how maintenance work on these sectionsinfluences the aquatic communities.As there are currently no fish, benthic invertebrate or current temperature data (collected toLSRCA’s standards) available, the ecological integrity of this system was not rated.Moyer CreekMoyer Creek is a small creek south of Banks Creek that flows north into <strong>Lake</strong> <strong>Simcoe</strong>. This is acoldwater system with no monitoring sites (Figure 5-2). The creek is in fine sandy loam andloam with moderate infiltration rates. There are no potential groundwater recharge or dischargeChapter 5: Aquatic Natural Heritage 203
The <strong>Innisfil</strong> <strong>Creeks</strong> <strong>Subwatershed</strong> <strong>Plan</strong>areas in the vicinity. The headwaters are surrounded mostly by natural heritage cover and a golfcourse, with urban land use entirely along its western banks. No known barriers to fishmovement or instances of bank hardening or channelization are present on this system (Figure5-10, Figure 5-11).As there are currently no fish, benthic invertebrate or current temperature data (collected toLSRCA’s standards) available, the ecological integrity of this system was not rated.Sylvan CreekSylvan Creek is another small system, located to the east of Moyer Creek and also drainingnorth into <strong>Lake</strong> <strong>Simcoe</strong>. This is a warm water system with no monitoring sites (Figure 5-2). Thecreek is located entirely within fine sandy loam with moderate infiltration rates and there are nopotential groundwater recharge or discharge areas in the vicinity. Land use in the area consistsof natural heritage cover at the headwaters and along the western bank, with urban land use onthe eastern shoreline. As this creek is piped there is no fish, benthic invertebrate, or currenttemperature data available.Cedar CreekCedar Creek, located south of Moyer and Sylvan Creek, drains to the east into the mouth ofCook’s Bay. This coldwater system has headwaters in organic soils with very slow infiltrationrates. The rest of the creek flows through loamy sand and fine sandy loam with moderateinfiltration rates. There are no potential recharge or discharge areas along the creek and thesurrounding land uses are natural heritage cover in the headwaters, transitioning to urban nearthe mouth.Despite being a coldwater system, only warm water species have been captured here (Figure5-2). The IBI analysis ranks the ecological integrity of the system as poor (Figure 5-3) and thereare no records of brook trout or mottled sculpin occupying this creek in the past (Figure 5-4,Figure 5-5). Currently there are no benthic invertebrate studies available for the system.Current temperature data shows the creek to have cool water temperature readings, indicatingthere may be thermal degradation of the system that has discouraged cold water species fromutilizing this creek (Figure 5-9). No known barriers to fish movement or instances of bankhardening or channelization were identified in the BMP inventory for the portion of the streamthat was inventoried (Figure 5-10, Figure 5-11).Overall, the aquatic communities in Cedar Creek are stressed, based on analysis of the fishcommunities. As water temperatures are still cool and there are no known barriers or instancesof bank hardening or channelization, it is unclear what is impacting the system. Further studies,including benthic invertebrates, may provide a better idea of the condition of this system.Belle Aire CreekBelle Aire Creek is coldwater system located just south ofCedar Creek and has four monitoring sites located along itsmain branch. Headwaters are located in loam and fine sandyloam with moderate infiltration rates. The creek continuesthrough the fine sandy loam, with small patches of gravellysandy loam (moderate infiltration) and organic soils (slowinfiltration rates). There are potential recharge areas in theBelle Aire CreekChapter 5: Aquatic Natural Heritage 204
The <strong>Innisfil</strong> <strong>Creeks</strong> <strong>Subwatershed</strong> <strong>Plan</strong>headwaters and along parts of the creek. A large potential discharge area is located at theconfluence of the two headwater branches and a very small area along the main branch whereinfiltration is slow. The majority of the creek is surrounded by rural and agricultural land use,with part of the lower reaches in natural heritage cover and the mouth is surrounded by urbanland use.Yellow perch(Perca flavescens)Of the four monitoring sites, only the two closest to themouth had any fish captured – all of which were warmwater species (Figure 5-2). There is no record of coldwater indicator species, brook trout and mottledsculpin, being present within this system in the past(Figure 5-4, Figure 5-5). The IBI analysis rated theecological integrity of the system as good at the siteclosest to the mouth and fair at the next site up. TheHilsenhoff analysis on the benthic invertebratecommunities is similar with the site closest to themouth being rated as fair and the next three sites beinggood, fair, and fairly poor (Figure 5-6). The two sites farthest upstream are surrounded byintensive agriculture and high conductivity readings. Additionally, these sections of the creek areless than 1 m wide and less than 200 mm deep. The high conductivity and low water levelsmake these sites uninhabitable by fish, as well as creating poor benthic invertebrate habitat.Two of the sites have cool water temperatures and two have warm water temperaturesrecorded, despite this historically being a cold water creek, indicating thermal degradation of thesystem that could be impacting the composition of the aquatic communities (Figure 5-9). Thereare nine known barriers to fish movement located along the watercourse, with over halfclustered in the lower reaches possibly preventing fish from accessing the upper reaches(Figure 5-10). Most of the bank hardening and channelization on the creek has occurred aroundthe mouth, along with a few areas in the upper reaches (Figure 5-11).Overall, the aquatic communities within Belle Aire Creek are stressed in the headwaters, with nofish present and significant organic pollution (as indicated by benthic scores). The mouth hasslightly better conditions for both fish and benthics, but a number of stressors are still impactingthe system in this area.Carson CreekCarson Creek, located to the south of Belle Aire Creek, is a coldwater system with twomonitoring sites near the mouth of the creek. Itsheadwaters are located in loam and fine sandy loam withmoderate infiltration rates, with thin pockets of loamysand along the creek with high infiltration rates. The creekflows through silty clay loam (slow infiltration) and gravellysandy loam (moderate infiltration), before going back tofine sandy loam at the mouth (moderate infiltration).There are potential recharge areas in the headwaters andscattered along the upper reaches, while there is onepotential discharge area at the headwaters of thesouthern branch and at the confluence of all the mainWhite sucker(Catostomus commersoni)branches. The majority of the creek is surrounded by rural and agricultural land use, with thelower reaches alternating between natural heritage cover and urban land use.Chapter 5: Aquatic Natural Heritage 205
The <strong>Innisfil</strong> <strong>Creeks</strong> <strong>Subwatershed</strong> <strong>Plan</strong>Despite coldwater temperatures, both monitoring sites had only warm water species captured(Figure 5-2). There is also no record of brook trout or mottled sculpin occupying the creek in thepast (Figure 5-4, Figure 5-5). The IBI analysis of the fish communities rated the ecologicalintegrity of the sites as good near the mouth and fair on the second site (Figure 5-3). Currentlythere are no benthic invertebrate studies available for the system.From the mouth to the confluence of the headwater branches, the main section of the creek isdesignated as a Type A municipal drain (Figure 5-8). This means that there are no sensitivespecies or communities and maintenance work can include brushing of the side slope, bottom(bed) cleanout, and debris clean out. While there are no sensitive species currently present,work on the creek, as well as other associated stressors with municipal drains, may bepreventing these species from utilizing the system. Additionally, there are two known barriers tofish movement in the middle reaches of the creek (Figure 5-10) and intense bank hardening andchannelization from the mouth to the confluence of the main branches (Figure 5-11).Overall, the aquatic communities are moderately stressed, based on fish data and the presenceof intense bank hardening and channelization. The inclusion of a benthic invertebrate analysis infuture studies may give a broader view of the condition of the creek.Wilson CreekWilson Creek is located south of Carson Creek and hasthree monitoring stations located along the main andsouthern branch. The majority of this coldwater creek islocated in silty clay loam with slow infiltration rates. Asmall portion of the headwaters is in loam (moderateinfiltration) and the mouth runs through organics withslow infiltration rates. There is a potential recharge areaaround the confluence of two headwater branches and alarge potential discharge area that encompasses theentire northern headwater branch. There is also aMouth of Wilson <strong>Creeks</strong>maller potential discharge area near the mouth. Landuse surrounding the creek is composed of agricultural and rural land use around the headwatersand natural heritage cover downstream of the confluence of the two main branches.Only warm water species were caught at the three monitoring sites (Figure 5-2) and there is nohistorical record of brook trout or mottled sculpin being present within the creek (Figure 5-4,Figure 5-5). The IBI analysis rated the ecological integrity of the system as good at the site nearthe mouth, fair at the confluence of the branches and poor on the southern headwater branch(Figure 5-3). Similarly, the Hilsenhoff analysis of the benthic communities rates the site near themouth as fair, and the following two sites as fairly poor (Figure 5-6).Creek chub(Semotilus atromaculatus)Despite being a cold water creek, two of the sites havecool water temperatures and the site at the mouth haswarm water temperatures recorded, indicatingstressors to the system are causing thermaldegradation (Figure 5-9). There are three knownbarriers to fish movement located near the mouth, justup the main northern branch and close to theheadwaters of the southern branch (Figure 5-10). Bankhardening and channelization has occurred near theChapter 5: Aquatic Natural Heritage 206
The <strong>Innisfil</strong> <strong>Creeks</strong> <strong>Subwatershed</strong> <strong>Plan</strong>mouth, at the confluences of the main branches and midway down the southern branch (Figure5-11). As the BMP inventory did not cover the entirety of the creek, there may be more barriersand stream alterations on the northern branch.Overall, the aquatic communities within Wilson Creek are under some stress near the mouth,with stream alterations and fairly significant organic pollution (as shown by the benthicinvertebrate analysis), but are under more severe stress up into the headwaters whereabundance and diversity of fish decrease and organic pollution increases.White Birch CreekWhite Birch Creek is a large system, with fivemonitoring sites, that drains to the east into Cook’sBay. This is a mainly coldwater system with a sectionnear the mouth up into a northern branch being warmwater. Headwaters are located mostly in loam(moderate infiltration) and silty clay loam (slowinfiltration). The main branch flows through finesandy loam with high to slow infiltration rates. Thereare large potential recharge areas in the southernheadwaters and narrow stretches of potentialdischarge areas along the main branch and two ofthe northern tributaries. Agricultural and rural landMouth of White Birch Creekuses surround all the headwaters, with naturalheritage cover and golf courses closer to the water front, into urban land use surrounding themouth.Of the five monitoring sites, cold water fish were captured only at two sites. Warm water specieswere captured at the two sites closest to the mouth and the northern headwater site had no fishcaptured (Figure 5-2). Although there are no historical or current records of brook trout in thecreek, there are both historic and current records of mottled sculpin (Figure 5-4, Figure 5-5).The IBI analysis of the fish communities in White Birch Creek rate the two cool water sitesclosest to the mouth as good, the warm water site as poor, and the cool water site on thesouthern branch as fair (Figure 5-3). The Hilsenhoff analysis of the benthic invertebratecommunities rates the ecological integrity of the system similarly, with the three sites closest tothe mouth as fair and good, the southern branch site as fair and the monitoring site at thenorthern branch headwaters (with no fish) as fairly poor (Figure 5-6).The northern headwaters site is classified as a Type C municipal drain (Figure 5-8), indicatingno sensitive species or communities are present, and maintenance work includes brushing ofside slope, bottom (bed) clean out and full clean out, which partially explains the poor benthiccommunities and absence of fish species. Additionally, while this is generally a cold watersystem, the majority of the stations record the creek as a cool water system, with cold watertemperatures in the headwaters and one warm water site (not on the warm water branch)between two cool water sites. Temperature difference indicates thermal degradation of thesystem that could be impacting the current cold water fish communities (Figure 5-9).There are a number of known barriers to fish movement in this system, the majority of which arealong the northern branches, possibly contributing to the lack of fish presence at the headwaterssite (Figure 5-10). Bank hardening and channelization has also occurred along much of themain creek and along its various branches (Figure 5-11).Chapter 5: Aquatic Natural Heritage 207
The <strong>Innisfil</strong> <strong>Creeks</strong> <strong>Subwatershed</strong> <strong>Plan</strong>Overall, aquatic communities are showing signs of being stressed in the headwaters andnorthern branch, where there are either no fish present or, where fish are found, there is a lowabundance and diversity; an analysis of the benthic invertebrates show significant organicpollution. Better conditions are found near the mouth, for the most part, with a higher diversity offish species and lower organic pollution (as indicated by the benthic invertebrate communities).Gilford CreekGilford Creek is a small system to the south of White Birch Creek, which also drains east intoCook’s Bay. This is a warm water system with no monitoring sites (Figure 5-2). Almost the entirecreek flows through loam (moderate infiltration), with the mouth in fine sandy loam with slowinfiltration rates. There is a large potential recharge area from the mouth to halfway up the creekand small areas of potential groundwater discharge at the headwaters. Land use in the areaconsists of rural and agricultural around the majority of the creek with natural heritage cover andurban land use at the mouth.There is one known barrier to fish movement at the mouth (Figure 5-10) and no bank hardeningor channelization was identified during the BMP inventory (Figure 5-11).LSRCA field staff visited this creek at the end of August, 2011 and the creek was dry. As such,the ecological integrity of the creek is deemed to be very poor and is unable to support anyaquatic communities during the summer months.Upper Marsh CreekUpper Marsh Creek is the southern most creek in the <strong>Innisfil</strong> <strong>Creeks</strong> subwatershed, and drainsto the east into Cook’s Bay. The headwaters of this warm water creek are in loam with moderateinfiltration rates. It continues to flow downstream through fine sandy loam (slow infiltration)before going into organic soils at the mouth with high infiltration rates. There are no potentialrecharge areas, but a large potential discharge area surrounds approximately ¾ of the creek.Agricultural and rural land use surround the headwaters but the main part of the creek andmouth are located in protected natural heritage cover (Greenbelt Protected Countryside).Only warm water species have been captured here (Figure 5-2) and the IBI analysis ranks theecological integrity of the system as fair (Figure 5-3). There is no record of brook trout or mottledsculpin occupying this creek in the past (Figure 5-4, Figure 5-5) and there are currently nobenthic studies available for the system.The one monitoring site located midway up creek has cool watertemperatures recorded, despite being designated a warm watersystem, this can possibly be attributed to the large potentialdischarge area surrounding much of the creek.The BMP inventory did not cover this creek, therefore thenumber of instances of barriers, bank hardening andchannelization and their impacts are unknown at this time.Overall, the aquatic communities of the system appear to beunder some stress as the fish IBI indicated a lower abundanceCentral mudminnow(Umbra limi)and diversity, but with only one monitoring site, no benthic invertebrate analysis and streamalterations unknown, it is difficult to assess the whole system. Further studies, including benthicinvertebrates and an inventory of stream alterations, may provide a better idea of the conditionof this system.Chapter 5: Aquatic Natural Heritage 208
The <strong>Innisfil</strong> <strong>Creeks</strong> <strong>Subwatershed</strong> <strong>Plan</strong>5.5 Current Management FrameworkVarious programs exist to protect and restore aquatic natural heritage values in the <strong>Lake</strong><strong>Simcoe</strong> watershed, ranging from regulatory mechanisms, to funding and technical supportprovided to private landowners, to ongoing research and monitoring.Many of these programs already address some of the stresses facing aquatic systems in the<strong>Innisfil</strong> <strong>Creeks</strong> subwatershed, as outlined below.5.5.1 Protection and policyThere are numerous acts, regulations, policies, and plans aimed at maintaining or improvingaquatic habitat. These include the Fisheries Act, Endangered Species Act, the <strong>Lake</strong> <strong>Simcoe</strong>Protection <strong>Plan</strong>, and municipal official plans. This management framework addresses many ofthe stresses identified in these subwatersheds. In Table 5-4 we categorize 12 such stressors,recognizing that many of these overlap and that the list is by no means complete. The legaleffects of the various Acts, policies, and plans on the stressors is categorized as ‘existingpolicies in place’ (shown in green), or ‘no applicable policies’ (shown in red). The policiesincluded in the table include those which have legal standing and must be conformed to, orpolicies (such as some of those under the <strong>Lake</strong> <strong>Simcoe</strong> Protection <strong>Plan</strong>) which call for thedevelopment of further management tools, research or education programs.The intent of these regulations, policies and plans are summarized in Section 1.3 – CurrentManagement Framework. Readers interested in the details of these regulations, policies andplans are directed to read the original documents.Mouth of small creek into Kempenfelt BayChapter 5: Aquatic Natural Heritage 209
The <strong>Innisfil</strong> <strong>Creeks</strong> <strong>Subwatershed</strong> <strong>Plan</strong>Table 5-4: Summary of current the current management framework as it relates to the protectionand restoration of aquatic natural heritageStressor affectingaquatic habitat<strong>Lake</strong> <strong>Simcoe</strong> Protection <strong>Plan</strong>(2009)Growth <strong>Plan</strong> for the GreaterGolden Horseshoe (2006)Provincial Policy Statement(2005)Endangered Species Act (2008)Ontario Water Resources Act(1990)Fisheries Act (1985)Ontario Fisheries Regulations(1989)LSRCA Watershed DevelopmentPolicies (2008)<strong>Simcoe</strong> County Official <strong>Plan</strong>(2007)Town of <strong>Innisfil</strong> Official <strong>Plan</strong>(2006)City of Barrie Official <strong>Plan</strong> (2009)Site alteration in wetlandsLoss of riparian areas /shoreline developmentStream alteration(including enclosures andflow diversion)Instream barriersBank hardening4 51 41 10 10 1010 10 10, 111 6 10 9Impervious surfacesMunicipal drainsUncontrolled stormwaterInterference withgroundwater recharge /dischargeDegradation of waterquality (including thermalimpacts)Introduction of invasivespeciesClimate change7122 83Existing policies in placeNo applicable policies1 Regulations only apply to those areas outside designated Settlement Areas2 Only contains specific policies and targets about phosphorus reduction, none about other contaminants3Discusses developing proposed regulations, conducting studies/risk assessments, developing response plans, educationprograms, but nothing banning use/etc4Related to those features that are part of SARO listed species’ habitat5 Restrictions apply only to direct or indirect fish habitat6 Not directly stated, but stream alteration policies would cover this7 Stormwater controls required, application must demonstrate every effort made to achieve pre-development hydrologic conditions8 Regulations pertain to development over shallow groundwater tables, and impacts to coldwater fish habitat9 Unless no net impact can be demonstrated10 References Fisheries Act (1985)11 Additional regulations apply to the shoreline of <strong>Lake</strong> <strong>Simcoe</strong>12 Within hydrologically defined Environmentally Significant AreasChapter 5: Aquatic Natural Heritage 210
The <strong>Innisfil</strong> <strong>Creeks</strong> <strong>Subwatershed</strong> <strong>Plan</strong>Legislation and policy restrictions are the primary source of protection for aquatic naturalheritage features in the <strong>Lake</strong> <strong>Simcoe</strong> watershed. However, some stresses are better suited topolicy and regulation than others. For example, stressors such as climate change and invasivespecies are hard to regulate; however, activities related to the loss of habitat, or capture andkilling of fish are much easier to define and enforce.The Federal Fisheries Act defines fish habitat as “spawning grounds and nursery, rearing, foodsupply and migration areas on which fish depend directly or indirectly in order to carry out theirlife process”. Thus, fish habitat includes not only the water itself, but also the physical structureof watercourses, the vegetation along their banks, and factors related to the quality of water.As such, the Fisheries Act prohibits (unless authorized), the installation of dams or otherstructures within watercourses that obstruct the passage of fish, the modification of a naturalwatercourse (e.g. straightening, enclosing, or hardening of the shoreline), or the removal ofvegetation along the shoreline.The Fisheries Act is further complemented by the <strong>Lake</strong> <strong>Simcoe</strong> Protection <strong>Plan</strong>, which (outsideof designated settlement areas) establishes restrictions to development or site alteration within100 m of the <strong>Lake</strong> <strong>Simcoe</strong> shoreline (30 m in already built-up areas, subject to a naturalheritage evaluation) (policies 6.1 and 6.2), or within 30 m of wetlands and watercourses, withnatural heritage evaluations necessary for development proposed within 120 m of the feature(policies 6.22 – 6.25). Exemptions to these policies are provided for existing uses, municipalinfrastructure, and aggregate operations. These activities will be required to demonstrate thatthey maintain or improve fish habitat in the watercourse, wetland, or riparian area.Within designated settlement areas, the Fisheries Act is complemented by municipal officialplans. The Town of <strong>Innisfil</strong> Official <strong>Plan</strong> protects aquatic habitats and ecosystem function byprohibiting development within Provincially Significant wetlands outright, as well as prohibitingdevelopment within 30 m of the <strong>Lake</strong> <strong>Simcoe</strong> shoreline and all watercourses and non-Provincially Significant wetlands, unless the proponent can demonstrate no negative impactswill occur to the feature or its functions (policy 3.1.1). The City of Barrie Official <strong>Plan</strong> protectssensitive surface water features and their related hydrological functions, by prohibitingdevelopment in Provincially Significant wetlands (and other wetlands larger than 0.5 ha), and invalley and stream corridors, with riparian vegetation zones required as necessary to supportresident cold water or warm water fish communities (policy 4.7.2.5).Beyond the protection of aquatic habitat features themselves, processes related to groundwaterflow (including both recharge and discharge) are also protected by a suite of policymechanisms. The <strong>Lake</strong> <strong>Simcoe</strong> Protection <strong>Plan</strong> requires LSRCA (in partnership with MOE andMNR) to define and map ecologically significant groundwater recharge areas throughout thewatershed. Ecologically significant groundwater recharge areas are those which are necessaryto support coldwater fish habitat or wetlands. Once identified, municipalities are required toincorporate these features into their official plans together with policies to protect, improve, orrestore the function of the recharge areas. Currently, LSRCA, in partnership with MNR andMOE, is conducting a pilot study in the Barrie <strong>Creeks</strong>, Lovers Creek, and Hewitt’s <strong>Creeks</strong>ubwatershed areas to test the sensitivity of the different methodologies to identify theseecologically significant groundwater recharge areas. Work on <strong>Innisfil</strong> <strong>Creeks</strong> will be completedin the coming years, based on the pilot study.The City of Barrie Official <strong>Plan</strong> has such a policy framework in place, to be triggered upon theidentification of ecologically significant groundwater recharge areas. These policies includecontrols over major development and expansion of designated settlement areas. Similarly, theTown of <strong>Innisfil</strong> Official <strong>Plan</strong> controls development in significant groundwater recharge areas, byChapter 5: Aquatic Natural Heritage 211
The <strong>Innisfil</strong> <strong>Creeks</strong> <strong>Subwatershed</strong> <strong>Plan</strong>requiring proponents to conduct detailed studies of the recharge area to ensure that thehydrological integrity of the feature is protected during development.Drainage works such as those permitted under the Provincial Drainage Act are exempt frommany of the policy provisions provided under the <strong>Lake</strong> <strong>Simcoe</strong> Protection <strong>Plan</strong> and municipalofficial plans, but are not exempt from the requirements of the Federal Fisheries Act.Maintenance of existing designated drains requires class authorization under the Fisheries Act,and proposed new drains are subject to full review to ensure no harmful alteration occurs to fishhabitat.For infrastructure or other works occurring in water, the Ontario Ministry of Natural Resources isresponsible for determining in-water work timing restrictions to ensure that fish and otheraquatic life are permitted to carry out critical life processes undisturbed. These restrictions arebased on the presence of warm and cold water thermal fish communities as determined bycontemporary thermal regime and fisheries studies.5.5.2 Restoration and remediationThere is a range of programs operating in these subwatersheds to assist private landowners inimproving the environmental health of its tributaries.The Landowner Environmental Assistance Program (LEAP) is a partnership between the <strong>Lake</strong><strong>Simcoe</strong> <strong>Region</strong> Conservation Authority, its member municipalities, and the York, Durham, and<strong>Simcoe</strong> chapters of the Ontario Federation of Agriculture. This program provides technical andfinancial support to landowners in the <strong>Lake</strong> <strong>Simcoe</strong> watershed wanting to undertakestewardship projects on their land. Project types which have traditionally been funded by theLEAP program include removing barriers from streams, adding bottom-draw structures to onlineponds, and fencing and planting riparian areas, among others. Since 1989, in addition toprojects focused specifically on protecting water quality, LEAP has supported six erosion controland riparian planting projects and three streambank fencing projects in the <strong>Innisfil</strong> <strong>Creeks</strong>subwatershed.The Ontario Ministries of Natural Resources, Environment, and Agriculture, Food and RuralAffairs provide the <strong>Lake</strong> <strong>Simcoe</strong> Community Stewardship Program for non-farm rurallandowners in the <strong>Lake</strong> <strong>Simcoe</strong> watershed. This program is intended to provide non-farm ruralresidents with financial and technical assistance in implementing projects such as shorelinestabilization, erosion control, and fish habitat improvements, among others. In the <strong>Innisfil</strong> <strong>Creeks</strong>subwatershed, this program is implemented in partnership with the Dufferin/South <strong>Simcoe</strong> LandStewardship Network and the South <strong>Simcoe</strong> Streams Network. The <strong>Lake</strong> <strong>Simcoe</strong> CommunityStewardship Program has implemented 19 shoreline improvement projects in the <strong>Innisfil</strong> <strong>Creeks</strong>subwatershed thus far.The Ontario Ministry of Agriculture, Food and Rural Affairs has also partnered with Agricultureand Agri-Food Canada and the Ontario Soil and Crop Improvement Association to provide theEnvironmental Farm Program to registered farm landowners throughout the province. Thisfarmer-focused program provides funding to landowners who have successfully completed anEnvironmental Farm <strong>Plan</strong> for projects including management of riparian areas, streambankfencing, and nutrient management. Through this program less than five projects that woulddirectly improve aquatic habitat have been implemented in the Town of <strong>Innisfil</strong>, while none havebeen completed in the City of Barrie.In 2008 and 2009, LSRCA field staff surveyed and reported on the majority of the watercoursesin this subwatershed, documenting the range of potential stewardship projects that could beChapter 5: Aquatic Natural Heritage 212
The <strong>Innisfil</strong> <strong>Creeks</strong> <strong>Subwatershed</strong> <strong>Plan</strong>implemented to help improve water quality and fish habitat. The <strong>Lake</strong> <strong>Simcoe</strong> Basin BestManagement Practice Inventory (LSRCA, 2009) found over 300 places where additional riparianplanting could be introduced, nearly 70 barriers that should be removed to improve fishpassage, several locations along creeks that require additional fencing, and over 200 locationswhere the streambank was eroding into a creek.The forthcoming shoreline management strategy, and wetland and riparian area prioritizationexercise, will identify and prioritize stewardship opportunities in this subwatershed, specific tothe shoreline and inland riparian and headwater areas respectively.These ongoing stewardship programs will soon be complemented by a forthcoming VoluntaryAction Program. Initially, the <strong>Lake</strong> <strong>Simcoe</strong> Protection <strong>Plan</strong> proposed the development of aregulation to prohibit activities that would adversely affect the ecological health of the <strong>Lake</strong><strong>Simcoe</strong> watershed (policy 6.16). Feedback during the initial rounds of consultation indevelopment of this regulation raised concerns about its enforceability, and the need to educatethe public on best management practices before taking a regulatory approach. As a result, theMOE reframed the Shoreline Regulation as a Shoreline Voluntary Action Program.The Shoreline Voluntary Action Program is intended to increase the extent of native vegetationalong shorelines, and reduce the use of phosphate-containing fertilizer in the watershed,through a combination of surveys which areaimed at understanding the current range ofpublic knowledge, attitudes, and practices, andoutreach to summer camps, landowners, andgarden centres.This voluntary action program is being run as atwo year pilot program, with ongoing monitoringto determine the rate of uptake, impacts onphosphorus levels, and impacts on nativevegetation along the shoreline. After the pilotprogram is complete, these results will bereviewed to determine if a voluntary program issufficient, or if a regulatory approach isnecessary.Riparian buffer planting – Banks Creek5.5.3 Science and researchAn ongoing commitment to applied science and research is necessary to improve ourunderstanding of the extent, character, and function of the fish and other aquatic naturalheritage values within the <strong>Lake</strong> <strong>Simcoe</strong> watershed. Ongoing monitoring programs led by theMNR and the LSRCA, and periodic research studies conducted by academics, are contributingto our understanding of these values.The Ministry of Natural Resources has been studying the structure and function of <strong>Lake</strong><strong>Simcoe</strong>’s ecosystem, including internal energy dynamics, food web interactions, and theimpacts of invasive species and climate change since 1951 when the <strong>Lake</strong> <strong>Simcoe</strong> FisheriesAssessment Unit was created. This unit uses a series of research and monitoring programs,including creel surveys, index netting, angler diaries, spawning studies, and water level andtemperature monitoring, among others, to meet the needs of fisheries resource managers (asoutlined in Philpot et al., 2010).Chapter 5: Aquatic Natural Heritage 213
The <strong>Innisfil</strong> <strong>Creeks</strong> <strong>Subwatershed</strong> <strong>Plan</strong>The <strong>Lake</strong> <strong>Simcoe</strong> <strong>Region</strong> Conservation Authority monitors fish communities, benthicinvertebrates, and temperature at a network of sites throughout the watershed. Some of thesesites are visited only once, to describe the aquatic system, and some are visited annually todocument changes in the health of the tributaries (monitoring sites in these three watershedsare displayed in Figure 5-2).More recently, the LSRCA began a nearshore monitoring program in the lake, to betterunderstand the connection between watershed land use and the health of the <strong>Lake</strong> <strong>Simcoe</strong>ecosystem. This monitoring program includes a study of the aquatic plants, benthicinvertebrates, and sediment chemistry in this nearshore zone, some results of which are shownin Figure 5-7.In addition to these ongoing monitoring programs,numerous scientific and technical reports have beenpublished based on research conducted in the <strong>Lake</strong><strong>Simcoe</strong> watershed. As a result of this combinedfocus, <strong>Lake</strong> <strong>Simcoe</strong> is one of the most intensivelystudied bodies of water in Ontario. The results ofthis research have been summarized, in part, inLSEMS (2008) and Philpot et al. (2010), and haveinformed the development of this subwatershedplan.The <strong>Lake</strong> <strong>Simcoe</strong> Protection <strong>Plan</strong> commits theMNR, MOE, LSRCA and others to continue to investin research and monitoring related to aquatic communities of <strong>Lake</strong> <strong>Simcoe</strong> and its tributaries.Ongoing research is proposed to examine the biological components of the ecosystem, theirprocesses, and linkages, to build on existing knowledge, or address knowledge gaps (policy3.5). The proposed monitoring program is intended to build on the existing monitoring describedabove, to describe the fish communities, benthic communities, macrophytes, and/or fishingpressure in the lake, its tributaries, and other inland lakes within the watershed (policy 3.6).Chapter 5: Aquatic Natural Heritage 214
The <strong>Innisfil</strong> <strong>Creeks</strong> <strong>Subwatershed</strong> <strong>Plan</strong>5.6 Management Gaps and RecommendationsIt is recognized that many of the undertakings in the following set of recommendations aredependent on funding from all levels of government. Should there be financial constraints, itmay affect the ability of the partners to achieve these recommendations. These constraints willbe addressed in the implementation phase.5.6.1 Stewardship implementation – increasing uptakeIn addition to protecting existing aquatic habitat, programs which support the stewardship,restoration, or enhancement of aquatic habitat will be critical to meet the targets and objectivesof the <strong>Lake</strong> <strong>Simcoe</strong> Protection <strong>Plan</strong>. To that end, <strong>Lake</strong> <strong>Simcoe</strong> Stewardship Network has beenestablished to provide a forum that helps identify priorities and coordinate efforts between themultiple organizations undertaking stewardship in the watershed. The Stewardship Networkincludes the Ministry of Natural Resources, Ministry of the Environment, Ministry of Agriculture,Food and Rural Affairs, Ontario Federation of Agriculture, Ontario Soil and Crop ImprovementAssociation, <strong>Lake</strong> <strong>Simcoe</strong> <strong>Region</strong> Conservation Authority, South <strong>Simcoe</strong> Streams Network, andwatershed municipalities.Recommendation 5-1 – That the MNR, MOE, MAFRA, and LSRCA continue toimplement stewardship projects in these subwatersheds, and encourage other interestedorganizations to do the same.Recommendation 5-2 – That governmental and non-governmental organizationscontinue to improve coordination of programs to: (1) avoid inefficiencies andunnecessary competition for projects, and: (2) make it easier for landowners to knowwhich organization they should be contacting for a potential project, using tools such asa simple web portal.Recommendation 5-3 – That the MOE, MNR, LSRCA, and other members of the <strong>Lake</strong><strong>Simcoe</strong> Stewardship Network be encouraged to document completed stewardshipprojects in a common tracking system to allow efficient tracking, coordinating, andreporting of stewardship work accomplished.Recommendation 5-4 – That the Federal, Provincial, and Municipal governmentsprovide consistent and sustainable funding to ensure continued delivery of stewardshipprograms.Recommendation 5-5 – That the MOE, MNR, MAFRA, LSRCA, and other interestedmembers of the <strong>Lake</strong> <strong>Simcoe</strong> Stewardship Network support research to determinebarriers limiting uptake of stewardship programs in these subwatersheds and sharethese results with other members of the <strong>Lake</strong> <strong>Simcoe</strong> Stewardship Network, to enableagencies and stakeholders to modify their stewardship programming as relevant. Thisresearch should include a review of successful projects to determine what aspects led totheir success, and how these may be emulated.Recommendation 5-6 – That the MOE, MNR, MAFRA, and LSRCA continue toinvestigate new and innovative ways of reaching target audiences in the local communityand engage them in restoration programs and activities (e.g. high school environmentalclubs, through Facebook groups, hosting a <strong>Lake</strong> <strong>Simcoe</strong> Environment Conference forhigh schools/science community interaction). The results of these efforts should beshared with the <strong>Lake</strong> <strong>Simcoe</strong> Stewardship NetworkChapter 5: Aquatic Natural Heritage 215
The <strong>Innisfil</strong> <strong>Creeks</strong> <strong>Subwatershed</strong> <strong>Plan</strong>5.6.2 Stewardship implementation – prioritize projectsStewardship programs play an important role in meeting the goals and objectives of thesubwatershed plans. However, in order to ensure that they are both effective and efficient,stewardship projects should be selected in the context of the priority needs of the <strong>Lake</strong> <strong>Simcoe</strong>watershed, and its subwatersheds. An analysis of aquatic habitat has identified bank hardening,barriers, and insufficient riparian cover as some of the most important factors impactinginstream habitat. Analogous to terrestrial natural heritage stewardship requirements, a tool isneeded to help prioritize stewardship projects. Ideally a single prioritization tool, addressing bothaquatic and terrestrial stewardship activities, should be developed.Recommendation 5-7 – That the LSRCA, with the assistance of the MNR and MOE,develop a spatially-explicit decision support tool to assist in targeting aquatic habitatstewardship projects in the <strong>Lake</strong> <strong>Simcoe</strong> watershed. In the context of the Barrie <strong>Creeks</strong>,Lovers Creek, and Hewitt’s Creek subwatersheds, this prioritization tool should take intoaccount factors including:• The need to incorporate each major type of aquatic habitat stressorincluding bank hardening, barriers, riparian cover, and on-line ponds;• The use of best available datasets to identify potential restoration sites,including LSRCA BMP inventory and riparian assessment;• Expected improvements to aquatic habitat and therefore fish andbenthic community condition, including improved water temperature,increased connectivity for movement within and between tributaries,and shelter.• Opportunities to reduce phosphorus loadings in the tributaries in thesesubwatersheds• The relative cost of implementing projects in urban, urbanizing, and agriculturalareas, particularly with respect to the cost of implementing retrofit projects in therelatively heavily urbanized City of Barrie.Recommendation 5-8 – That prioritized restoration areas be integrated into astewardship plan that ensures prioritized restoration opportunities are undertaken assoon as feasible. This stewardship plan should incorporate the outcomes ofrecommendations to improve uptake identified in Recommendations 5-1 through 5-6.5.6.3 Impacts to Hydrologic RegimeIn addition to the stressors on aquatic habitat identified above (barriers, channelization, etc.),the condition of the fish and benthic communities in the <strong>Innisfil</strong> <strong>Creeks</strong> subwatershed are alsolikely being impacted by stream hydrology, including both high or peak flows, and low flowcondition. While water quantity and associated recommendations are discussed in detailedwithin Chapter 4 – Water Quantity, the following recommendations are specific to aquatichabitat:Recommendation 5-9 – That the MOE, with assistance from LSRCA, MNR and theUniversity of Guelph, determine in-stream flow regime targets for Barrie, Lovers,Hewitt’s, and <strong>Innisfil</strong> <strong>Creeks</strong>. These targets should be based on the Guidance Documentframework (LSRCA 2010) which is being used for the Maskinonge River subwatershed.Chapter 5: Aquatic Natural Heritage 216
The <strong>Innisfil</strong> <strong>Creeks</strong> <strong>Subwatershed</strong> <strong>Plan</strong>Recommendation 5-10 – That the MOE and MNR, with assistance from LSRCA,develop a strategy to achieve the instream flow regime targets. This strategy shouldaddress both high and low flow requirements and provide a plan for implementingstrategy recommendations.Recommendation 5-11 – That the LSRCA work with subwatershed municipalities andMAFRA to examine innovative forms of municipal drain maintenance, or opportunities tocreate new drains using principles of natural channel design. Furthermore, that theLSRCA work with subwatershed municipalities and MAFRA to decommission municipaldrains when the land use changes, removing the need for their use.5.6.4 Water Quality and Water TemperatureBased on the generally fair to fairly poor benthic invertebrate community scores, water quality in<strong>Innisfil</strong> <strong>Creeks</strong> can be considered degraded in some areas. Similarly, the assessment of fish IBIand water temperature indicate that the thermal regime of the creeks is being affected by factorssuch as loss of riparian cover, increased imperious surfaces and barriers. Recommendationsaddressing water quality are presented in Chapter 3 – Water Quality, and recommendationspertaining to increased water temperature are described in Recommendations 3-17 and 3-18.5.6.5 EnclosuresPast development practices allowed for the enclosure or piping of various creeks throughout thestudy area. These enclosures not only create barriers for fish migration and fragment the fishand wildlife populations but also threaten the public through the potential for flooding. In thecase of both Bon Secours and Sylvan <strong>Creeks</strong>, the enclosure of significant parts of the creekmouths has unfortunately curtailed fish migration from <strong>Lake</strong> <strong>Simcoe</strong> to the headwaterscompletely and in the case of the latter, has lead to a complete absence of fish within thesystem.Recommendation 5-12 - That the Town of <strong>Innisfil</strong>, in partnership with the LSRCA,complete an inventory of enclosed or buried streams from which removal of enclosuresor “day lighting” can be prioritized.Recommendation 5-13 - That the Town of <strong>Innisfil</strong> continue its efforts to day lightenclosed streams and establish a funded program based on prioritized list of restorationopportunities, as resources permit.5.6.6 Monitoring and AssessmentLong term monitoring is required to identify changes and trends occurring in the aquaticcommunity. These on-going annual surveys of fish, invertebrates, stream temperatures, waterquality, baseflow, and channel morphology are also intended to provide information that willdirect future rehabilitation efforts. Additional environmental characteristics such as brook troutspawning (redd) surveys, field confirmation of groundwater inputs, algae/diatom sampling, lake/tributary interface assessment, as well as an expanded water quality and quantity network willneed to be considered to provide the information to look at the system in an integrated andholistic way. A renewed need for regular reporting of the results and a systematic re-evaluationof the program is also required.Chapter 5: Aquatic Natural Heritage 217
The <strong>Innisfil</strong> <strong>Creeks</strong> <strong>Subwatershed</strong> <strong>Plan</strong>Recommendation 5-14 – That LSRCA, with support from Municipalities and theProvince, aim for improved spatial and temporal resolution in annual monitoring ofaquatic habitat, including water quality, fish and benthic indicators.Chapter 5: Aquatic Natural Heritage 218
The <strong>Innisfil</strong> <strong>Creeks</strong> <strong>Subwatershed</strong> <strong>Plan</strong>6 Terrestrial Natural Heritage6.1 IntroductionTerrestrial natural heritage features are extremely important components of subwatershedhealth, as they not only provide habitat for many of the species residing in the subwatershed,but also influence subwatershed hydrology. They are among the most important parts of theecosystem, and are the most likely to be directly impacted by human activities.A terrestrial natural heritage system is composed of natural cover (features), natural processes(functions), and the linkages between them. The matrix of agricultural, rural, urban, and naturalareas within the <strong>Innisfil</strong> <strong>Creeks</strong> subwatershed’s terrestrial system interacts with otherhydrological and human systems, and serves as habitat for flora and fauna throughout thesubwatershed. The system includes not only large tracts of natural features, but also the smallfeatures that can be found within urban and agricultural areas. Measuring the quantity, quality,and distribution of natural heritage features within the subwatershed can tell us a great dealabout its health. Figure 6-1 details the distribution of natural features in the subwatershed.Currently, natural heritage features constitute approximately 33% of the <strong>Innisfil</strong> <strong>Creeks</strong>subwatershed. This includes 17.1% upland forest, 11.3% wetland, and 5.2% grassland.Chapter 6: Terrestrial Natural Heritage 219
B A R R I E400 HWY NBIG BAY PT RDRIDGE RD WKempenfelt Bay<strong>Lake</strong><strong>Simcoe</strong>Terrestrial natural heritagefeatures in the <strong>Innisfil</strong><strong>Creeks</strong> subwatershed.LegendRoadFigure 6-1Municipal BoundarySIDERD 25LOCKHART RDWatercourseGrasslandA RDSIDERD 1010TH LINE9TH LINEYONGE STWetlandWoodlandINNISFIL BEACH RD7TH LINE6TH LINEMETRO RD NBASELINE RDWARDEN AVEWOODBINE AVESIDERD 105TH LINESIDERD 5HWY 400 S4TH LINE3RD LINEG E O R G I N APOLLOCK RDI N N I S F I L2ND LINECOUNTY RD 8914TH LINELINE 13Cook'sBayGLENWOODS AVERAVENSHOE RD0 0.5 1 2 3 4 5KilometresKThis product was produced by the <strong>Lake</strong> <strong>Simcoe</strong> <strong>Region</strong> Conservation Authority andsome information depicted on this map may have been compiled from various sources.While every effort has been made to accurately depict the information,data / mapping errors may exist.This map has been produced for illustrative purposes only.LSRCA GIS Services DRAFT created July 2010.© LAKE SIMCOE REGION CONSERVATION AUTHORITY, 2010. All Rights ReservedThe following datasets roads, municipal boundaries and Oak Ridges Moraine are© Queens Printer for Ontario, 2010. Reproduced with Permission
The <strong>Innisfil</strong> <strong>Creeks</strong> <strong>Subwatershed</strong> <strong>Plan</strong>6.2 Current statusTerrestrial natural heritage features, as described by the Provincial Policy Statement, includewoodlands, wetlands, valleylands, Areas of Natural and Scientific Interest, habitat forendangered species, and wildlife habitat. The Provincial Policy Statement provides direction forthe protection of significant natural heritage features throughout the Province.The <strong>Lake</strong> <strong>Simcoe</strong> Protection <strong>Plan</strong> (LSPP) provides further targets for the <strong>Lake</strong> <strong>Simcoe</strong>watershed, to:• Ensure no further loss of natural shorelines on <strong>Lake</strong> <strong>Simcoe</strong>;• Achieve a greater proportion of natural vegetative cover in large high quality patches;• Achieve a minimum 40 percent high quality natural vegetative cover in the watershed;• Achieve protection of wetlands;• Achieve naturalized riparian areas on <strong>Lake</strong> <strong>Simcoe</strong> and along streams;• Restore natural areas or features, and;• Achieve increased ecological health based on the status of indicator species andmaintenance of natural biodiversityThe current state of natural heritage features in the <strong>Innisfil</strong> <strong>Creeks</strong> subwatershed can bedescribed, relative to these targets, where data permits.At 33%, the total natural cover in this subwatershed is slightly below average for the <strong>Lake</strong><strong>Simcoe</strong> watershed, and below the target of 40% high quality natural areas for the entire <strong>Lake</strong><strong>Simcoe</strong> watershed set by the <strong>Lake</strong> <strong>Simcoe</strong> Protection <strong>Plan</strong>. Nearly half of this subwatershedhas been converted to agricultural land use, with approximately 15% composed of urban landuses (Figure 2-2). There are clear patterns in development in this subwatershed, with thehigher, better drained soils associated with the Peterborough Drumlin Field in the headwatersprimarily converted to agriculture, and natural heritage preservation and development focusedprimarily along the lakeshore, in the <strong>Lake</strong> <strong>Simcoe</strong> Lowlands physiographic region (Figure 2-3).6.2.1 WoodlandsThe Natural Heritage Reference Manual (OMNR, 2010) lists a variety of important functionsassociated with woodlands and Larson et al. (1999) summarize the importance of woodlots.These important functions can generally be described as follows:• Economic Services and Values: oxygen production, carbon sequestration, climatemoderation, water quality and quantity improvements, woodland products, economicactivity associated with cultural values• Cultural/Social Values: education, recreation, tourism, research, spiritual and aestheticworth• Ecological Values: diversity of species, structural heterogeneity, energy(photosynthesis), nutrient and energy cycling.• Hydrological Values: interception of precipitation, reduction of intensity of rainfallrunoff, slower release of meltwater from snowpack, shade to water coursesChapter 6: Terrestrial Natural Heritage 221
The <strong>Innisfil</strong> <strong>Creeks</strong> <strong>Subwatershed</strong> <strong>Plan</strong>Woodlands include all treed communities, whether upland or wetland. The Ecological LandClassification (ELC) communities that were considered to represent woodlands are forest,swamp, plantation, and cultural woodland (the breakdown of these woodland types is displayedin Figure 6-3 and Table 6-1). Some woodlands in this section are also counted as wetlands laterin the chapter (e.g. wooded swamp), as the two terms are not mutually exclusive.The ecological function of woodlands tends to be influenced by factors relating to fragmentation(the splitting of larger woodlands into ever smaller pieces), patch size (the requirement ofwoodland pieces to be of a certain area for the maintenance of some functions), woodlandquality (such as shape, interior habitat, age, composition, structure, and the presence ofinvasive species), and total woodland cover (i.e., the woodland area within a jurisdiction orwatershed).Of these factors there is increasing scientific evidence to show that the total woodland cover ofa landscape may exert the most important influence on biodiversity. Obviously, the loss ofwoodland cover results in a direct loss of habitat of that type. This reduction in habitat can resultin proportionally smaller population sizes, and animals in habitat remnants may experiencealtered dispersal rates, decreased rates of survival, decreased productivity, altered foragingbehaviours, and decreased mating opportunities (Fahrig, 2003). Research that has examinedthe independent effects of habitat loss and habitat fragmentation suggests that habitat loss hasa greater effect than habitat fragmentation on the distribution and abundance of birds (Fahrig,2002) and there is now substantive evidence that total woodland cover is a critical metric (e.g.,Austen et al., 2001; Golet 2001; Fahrig 2002; Lindenmayer et al., 2002; Trzcinski et al., 1999;Friesen et al., 1998, 1999; Rosenburg et al., 1999; Radford et al., 2005).Prior to European settlement the dominant land cover type of Southern Ontario was woodland.Estimates of total pre-settlement woodland cover in <strong>Simcoe</strong> County, including thissubwatershed was 83% (Larson et al., 1999). The distribution of this woodland cover, asindicated by notes collected during the first survey ofthis area is shown in Figure 6-2. By 1955 this haddecreased to 32.4%, then increased to 40.2% by 1978(Larson et al., 1999). As of 2009, woodland cover inthe <strong>Innisfil</strong> <strong>Creeks</strong> subwatershed was 25.7% (Table6-1).The <strong>Lake</strong> <strong>Simcoe</strong> Protection <strong>Plan</strong> sets a target of theretention of a minimum of 40% high quality naturalvegetative cover in the entire <strong>Lake</strong> <strong>Simcoe</strong> watershed,which would include forest, native grassland, and nonforestwetland ecosystems. Clearly, this amount ofnatural cover cannot be achieved uniformly throughoutthe watershed, as development pressures aredistributed unevenly throughout the watershed.LSRCA’s Integrated Watershed Management <strong>Plan</strong>allows for uneven distribution of woodland cover, whilestill setting a target of a minimum of 25% forest coverwithin each of <strong>Lake</strong> <strong>Simcoe</strong>’s subwatersheds. Forestcover within the <strong>Innisfil</strong> <strong>Creeks</strong> subwatershed planmeets this target set by the Integrated WatershedManagement <strong>Plan</strong>, and contributes substantially tomeeting the subsequent, and higher, target set by theLSPP.Chapter 6: Terrestrial Natural Heritage 222
B A R R I EBIG BAY PT RDRIDGE RD WKempenfelt Bay<strong>Lake</strong><strong>Simcoe</strong>Pre-settlement vegetationin the <strong>Innisfil</strong><strong>Creeks</strong> subwatershedFigure 6-2LegendRoadMunicipal BoundarySIDERD 25LOCKHART RDWatercourseWoodland Type400 HWY NA RDSIDERD 1010TH LINEConiferous ForestConiferous SwampYONGE ST9TH LINECultural <strong>Plan</strong>tationINNISFIL BEACH RD7TH LINE6TH LINEMETRO RD NBASELINE RDWARDEN AVEWOODBINE AVECultural WoodlandDeciduous ForestDeciduous SwampMixed Forest5TH LINEMixed SwampSIDERD 10SIDERD 5HWY 400 S4TH LINE3RD LINEG E O R G I N APOLLOCK RDI N N I S F I L2ND LINECOUNTY RD 8914TH LINELINE 13Cook'sBayGLENWOODS AVERAVENSHOE RD0 0.5 1 2 3 4 5KilometresKThis product was produced by the <strong>Lake</strong> <strong>Simcoe</strong> <strong>Region</strong> Conservation Authority andsome information depicted on this map may have been compiled from various sources.While every effort has been made to accurately depict the information,data / mapping errors may exist.This map has been produced for illustrative purposes only.LSRCA GIS Services DRAFT created March <strong>2012</strong>.© LAKE SIMCOE REGION CONSERVATION AUTHORITY, 2011. All Rights ReservedThe following datasets roads and municipal boundaries are© Queens Printer for Ontario, <strong>2012</strong>. Reproduced with Permission
B A R R I EBIG BAY PT RDRIDGE RD WKempenfelt Bay<strong>Lake</strong><strong>Simcoe</strong>Woodland types in the<strong>Innisfil</strong> <strong>Creeks</strong>subwatershed.Figure 6-3LegendRoadMunicipal BoundarySIDERD 25LOCKHART RDWatercourseWoodland Type400 HWY NA RDSIDERD 1010TH LINE9TH LINEYONGE STConiferous ForestConiferous SwampCultural <strong>Plan</strong>tationINNISFIL BEACH RD7TH LINE6TH LINEMETRO RD NBASELINE RDCultural WoodlandDeciduous ForestDeciduous SwampMixed ForestWARDEN AVEWOODBINE AVESIDERD 105TH LINEMixed SwampSIDERD 5HWY 400 S4TH LINE3RD LINEG E O R G I N APOLLOCK RDI N N I S F I L2ND LINECOUNTY RD 8914TH LINELINE 13Cook'sBayGLENWOODS AVERAVENSHOE RD0 0.5 1 2 3 4 5KilometresKThis product was produced by the <strong>Lake</strong> <strong>Simcoe</strong> <strong>Region</strong> Conservation Authority andsome information depicted on this map may have been compiled from various sources.While every effort has been made to accurately depict the information,data / mapping errors may exist.This map has been produced for illustrative purposes only.LSRCA GIS Services DRAFT created July 2011.© LAKE SIMCOE REGION CONSERVATION AUTHORITY, 2011. All Rights ReservedThe following datasets roads, municipal boundaries and Oak Ridges Moraine are© Queens Printer for Ontario, 2011. Reproduced with Permission
The <strong>Innisfil</strong> <strong>Creeks</strong> <strong>Subwatershed</strong> <strong>Plan</strong>Table 6-1: Woodland cover types in the <strong>Innisfil</strong> <strong>Creeks</strong> subwatershed.Upland forestWoodland TypeWoodland CoverArea (ha) Area (%)Cultural <strong>Plan</strong>tation (CUP) 66.6 0.6Cultural Woodland (CUW) 122.3 1.1Conifer Forest (FOC) 110.0 1.0Deciduous Forest (FOD) 824.9 7.7Mixed Forest (FOM) 708.0 6.6Conifer Swamp (SWC) 76.4 0.7Deciduous Swamp (SWD) 360.6 3.4Mixed Swamp (SWM) 480.3 4.5Total upland forest 1831.8 17.1Total forest (including both upland and swamp) 2749.1 25.7Target (LSPP) 1 4286.0 40Target (LSRCA IWMP) 2 2678.75 25SwampforestThe most common forest types in this subwatershed are deciduous and mixed forests, whichare typically found on well drained sandy or loamy sites. Deciduous forests are widespread inthis subwatershed, and can be found in a variety of topographic positions. Mixed forests aretypically found on the edges of deciduous forests, in swamps, or in areas with a slighttopographic slope. It is these slightly cooler microclimatic conditions that allow for theestablishment of coniferous trees. As these forests tend to be relatively large, they providehabitat for a range of area-sensitive species such as ovenbird (Seiurus aurocapillus), winterwren (Troglodytes troglodytes), and wood thrush (Hylocichla mustelina) (Bird Studies Canada etal., 2008).Less common are coniferous forests (including plantations) and coniferous swamps, whichaccount for only 9% of the total woodland in this subwatershed. Coniferous forests can befound on well drained sandy or loamy sites, similar to deciduous forests, but tend to beassociated with north facing slopes. Coniferous swamps are typically found in low lying andimperfectly drained sites. The dominance of conifer trees in these woodland types provideshabitat for conifer loving species such as red-breasted nuthatch (Sitta canadensis), whitebreastednuthatch (Sitta carolinensis), and black-capped chickadees (Poecile atricapillus) (BirdStudies Canada et al., 2008).Structural diversity of habitat is a key driver of biodiversity. In woodlands, habitat niches canrange from microhabitats such as the surfaces of fissured trunks, leaves and rotting logs tomacrohabitat features such as the horizontal layers within the woodland (e.g., supercanopy,canopy, subcanopy). In addition, woodlands are present in a wide variety of topographicsettings and soil and moisture regimes. For all of these reasons it is not surprising that manywoodland species are obligates (i.e., they are only found in woodlands), or that woodlands1 The <strong>Lake</strong> <strong>Simcoe</strong> Protection <strong>Plan</strong> sets a target of 40% high quality natural vegetative cover (which includes, but isnot restricted to, woodlands) for the entire <strong>Lake</strong> <strong>Simcoe</strong> watershed2 LSRCA’s Integrated Watershed Management <strong>Plan</strong> recommends a target of 25% woodland cover per subwatershedChapter 6: Terrestrial Natural Heritage 225
The <strong>Innisfil</strong> <strong>Creeks</strong> <strong>Subwatershed</strong> <strong>Plan</strong>provide habitat for a wide range of flora and fauna. They form important building blocks of thenatural heritage system.The summary statistics reflecting the percentage of the watershed under forested cover cannotaddress these more detailed issues related to the diversity and ecological integrity of individualforest patches. These issues relate typically to factors such as forest size, forest age, proximityto other natural areas, topographic heterogeneity, and structural diversity within the forest.Policy 6.48 of the LSPP requires the MNR (in collaboration with the LSRCA, First Nations andMétis communities) to map and identify `high quality` natural areas in the <strong>Lake</strong> <strong>Simcoe</strong>watershed. When this policy has been developed and the mapping is completed, more could besaid about the distribution of these site-specific quality measures in this study area.Although the total extent of forest cover in a subwatershed is the primary driver for many forestdependentecological processes, some species are also sensitive to the size of remnant forestpatches (Robbins et al., 1989; Lee et al., 2002), the amount of ‘interior’ forest habitat (Burke andNol, 1998a; Burke and Nol, 2000), and the proximity or connectivity between remnant forestpatches (Nupp and Swihart, 2000).Contiguous woodland areas have been calculated and the distribution of woodland patch sizesis displayed in Figure 6-4. While the total area of woodland represents the amount of forestcompletely within the subwatershed, the number of patches also includes any patches touchingthe subwatershed boundary. This methodology was used to avoid underestimating the numberof large patches.Beyond issues of habitat size however, is the issue of amount of interior habitat available. Manyspecies and ecological functions have been shown to be influenced by forest edges, a symptomknown as ‘edge effect’. These effects can extend up to 20 m into the woodlot for climatic factorssuch as light, temperature, moisture levels and wind speed (Burke and Nol, 1998b), up to 40 mfor the prevalence of non-forest plant species (Matlack, 1994), and 100m or greater for the rateof predation on nesting birds (Burke and Nol, 2000). Although this research has typically beeninterpreted such that 100m becomes the rule of thumb for differentiating between ‘edge’ and‘interior’ forest habitats, more recent research (Falk et al., 2010) suggests that the impacts ofedge effect on predation rates and nest survival in forest-dwelling songbirds may extend over300m into woodlots.The bulk of the forest area in the <strong>Innisfil</strong> <strong>Creeks</strong> subwatershed isfound in large forest blocks (i.e. larger than 10ha) (Figure 6-3,Figure 6-4), including three that are larger than 100 ha in size.There is also a substantial amount of core habitat (defined by thatrelatively conservative measure of 100m), including one forestwhich has over 70ha of this ‘core’ habitat. The three largestareas of woodland that contribute to the bulk of this cover includethe mixed swamp at the south end of the subwatershed whichforms the northern margin of the Provincially Significant HollandMarsh wetland complex, the large mixed forest at DeGrassiPoint, and the large forest complex near Big Bay Point. This lastfeature is a combination of deciduous and mixed forests, withscattered inclusions of swamp (Figure 6-3).Despite this prevalence of large forests, 209 of the total 253woodland patches (i.e. 83%) in the <strong>Innisfil</strong> <strong>Creeks</strong> subwatershedare relatively small (
The <strong>Innisfil</strong> <strong>Creeks</strong> <strong>Subwatershed</strong> <strong>Plan</strong>Figure 6-4: Woodland patch size distribution in the <strong>Innisfil</strong> <strong>Creeks</strong> subwatershed.Despite the recent evidence of the importance of total forest area for the preservation of wildlife,the importance of maintaining connectivity between woodlands should not be overlooked.Some forest-dwelling species, particularly small mammals, amphibians, and plants, requirecontiguous forested habitat to allow them to move from one habitat patch to another. Specieswhich are unable to disperse in this way are vulnerable to local extinction, caused by factorssuch as inbreeding depression, disease epidemic, or mere chance.6.2.2 WetlandsThe Provincial Policy Statement defines wetlands as lands that are seasonally or permanentlycovered by shallow water, as well as lands where the water table is close to or at the surface. Ineither case the presence of abundant water has caused the formation of hydric soils and hasfavoured the dominance of either hydrophytic or water tolerant plants. The four major types ofwetlands are swamps, marshes, bogs and fens.Wetlands provide numerous functions for an ecosystem. These include (OMNR, 2010):• Natural water filtration: by removing contaminants, suspended particles, and excessivenutrients, wetlands improve water quality and renew water suppliesChapter 6: Terrestrial Natural Heritage 227
The <strong>Innisfil</strong> <strong>Creeks</strong> <strong>Subwatershed</strong> <strong>Plan</strong>• Habitat: wetlands provide nesting, feeding and staging ground for several species ofwaterfowl and other wildlife including reptiles and amphibians, as well as spawninghabitat for fish• Natural shoreline protection: these vegetated areas protect shorelines from erosion• Natural flood control: by providing a reservoir, wetlands help to control and reduceflooding through water storage and retention• Contribution to natural cycles: wetlands provide a source of oxygen and watervapour, thus playing a role in the natural atmospheric and climatic cycles• Opportunities for recreation: these include hiking, birdwatching, fishing, and huntingIn its ‘How Much Habitat Is Enough?’ guidelines (2004), Environment Canada recommends thatat least 10% of a watershed be in wetland cover, and that these wetlands should be welldispersed through the area. <strong>Subwatershed</strong>s that meet these characteristics experience greatlyreduced flood frequencies, and more stable base flow. The additional benefits of wetland cover,listed above, are also maintained. In addition, improvements to water quality have been foundwhen wetlands occupy more than 18% of a given watershed, and amphibian and fishcommunities are more persistent when wetlands occupy more than 30% and 50% of the totalwatershed area respectively (Detenbeck et al., 1993; Gibbs, 1998; Brazner et al., 2004).Although the <strong>Lake</strong> <strong>Simcoe</strong> Protection <strong>Plan</strong> does not set a quantitative target for wetland coverwithin the watershed, it identifies the “protection of wetlands” as a target, implying no furtherloss of wetland beyond that in existence when the LSPP came into force.It has been estimated that, prior to Europeansettlement, 11.2% of <strong>Innisfil</strong>, and 2.6% ofBarrie were wetlands (DUC, 2010). Wetlandswere lost as settlement occurred, reducingtheir relative cover to 5.6% and 0.7% of <strong>Innisfil</strong>and Barrie respectively by 1982. Since 1982,wetland loss has slowed considerably (DUC,2010), presumably as a result of protectionmeasures provided by the Provincial PolicyStatement, Conservation Authorityregulations, and other mechanisms, althoughit still occurs at an average rate of 1.5 and 0.5ha per year in <strong>Innisfil</strong> and Barrie respectively(DUC, 2010). It should be noted that theDucks Unlimited study derives their estimatesof wetland distribution from soil maps, andunderestimates the current extent of wetlands.Thus, they may also underestimate theamount of wetland lost since the time ofsettlement.According to data available from the MNR andLSRCA (current as of 2009), there are1202.8ha of wetland remaining in the <strong>Innisfil</strong><strong>Creeks</strong> subwatershed (Figure 6-5, Table 6-2).Chapter 6: Terrestrial Natural Heritage 228
B A R R I EBIG BAY PT RDRIDGE RD WKempenfelt Bay<strong>Lake</strong><strong>Simcoe</strong>Wetland types in the<strong>Innisfil</strong> <strong>Creeks</strong>subwatershed.Figure 6-5LegendRoadMunicipal BoundarySIDERD 25LOCKHART RDWatercourseWetland Type400 HWY NA RD10TH LINE9TH LINEYONGE STConiferous SwampDeciduous SwampFloating-leaved Shallow AquaticMeadow MarshSIDERD 10INNISFIL BEACH RD7TH LINE6TH LINEMETRO RD NBASELINE RDWARDEN AVEWOODBINE AVEMixed Shallow AquaticMixed SwampShallow MarshSubmerged Shallow AquaticThicket SwampSIDERD 105TH LINESIDERD 5HWY 400 S4TH LINE3RD LINEG E O R G I N APOLLOCK RDI N N I S F I L2ND LINECOUNTY RD 8914TH LINELINE 13Cook'sBayGLENWOODS AVERAVENSHOE RD0 0.5 1 2 3 4 5KilometresKThis product was produced by the <strong>Lake</strong> <strong>Simcoe</strong> <strong>Region</strong> Conservation Authority andsome information depicted on this map may have been compiled from various sources.While every effort has been made to accurately depict the information,data / mapping errors may exist.This map has been produced for illustrative purposes only.LSRCA GIS Services DRAFT created July 2011.© LAKE SIMCOE REGION CONSERVATION AUTHORITY, 2011. All Rights ReservedThe following datasets roads, municipal boundaries and Oak Ridges Moraine are© Queens Printer for Ontario, 2011. Reproduced with Permission
The <strong>Innisfil</strong> <strong>Creeks</strong> <strong>Subwatershed</strong> <strong>Plan</strong>Table 6-2: Distribution of wetland types in the <strong>Innisfil</strong> <strong>Creeks</strong> subwatershed.Wetland typeWetland CoverArea (ha) Area (%)Meadow marsh (MAM) 42.5 0.4Shallow marsh (MAS) 47.1 0.4Floating leaved shallow aquatic(SAF)0.3 0.003Mixed shallow aquatic (SAM) 6.5 0.06Submerged shallow aquatic (SAS) 13.2 0.1Coniferous swamp (SWC) 76.4 0.7Deciduous swamp (SWD) 360.6 3.4Mixed swamp (SWM) 480.3 4.5Thicket swamp (SWT) 165.3 1.5Other* 10.7 0.2Total marsh 109.6 1.0Total swamp 1082.6 10.1Total 1202.8 11.3* ‘Other’ are areas mapped by MNR as being wetlands, but which have not been classified as a wetland communityby LSRCA’s Ecological Land Classification mapLike forests, wetland size and proximityto other natural areas has a significantinfluence on some wildlife species andecological functions (e.g. Detenbeck etal, 1993; Gibbs 1998; Guadagnin &Maltchik, 2006). Contiguous wetlandareas have been calculated and thedistribution of wetland patch sizes isdisplayed in Figure 6-6. While the totalarea of wetland represents the amountof wetland completely within thesubwatershed, the number of patchesalso includes any patches touching thesubwatershed boundary. Thismethodology was used to avoidunderestimating the number of largepatches.There are approximately 1202.8 ha ofWhat is a Provincially Significant Wetland?The Ontario Wetland Evaluation System was developed bythe Ontario Ministry of Natural Resources (1993). It wasimplemented in a response to an increasing concern for theneed to conserve wetland habitats in Ontario. The wetlandevaluation system aims to evaluate the value or importanceof a wetland based on a scoring system where four principalcomponents each worth 250 points make a total of 1000possible points.The four principal components that are considered in awetland evaluation are the biological, social, hydrological,and special features. Wetlands which score 600 or moretotal points (or 200 points in the biological or special featurecomponents) are classified as being Provincially Significant.The Province of Ontario, under the Provincial PolicyStatement (PPS) protects wetlands that rank as ProvinciallySignificant. The PPS states that “Development and sitealteration shall not be permitted in significant wetlands.”Chapter 6: Terrestrial Natural Heritage 230
The <strong>Innisfil</strong> <strong>Creeks</strong> <strong>Subwatershed</strong> <strong>Plan</strong>wetland in the <strong>Innisfil</strong> <strong>Creeks</strong> subwatershed, or approximately 11.3% of the landscape. Wetlandtypes in this subwatershed include large blocks of deciduous and mixed swamp near thelakeshore, in the relatively flat and fine grained mineral soils laid down by glacial <strong>Lake</strong>Algonquin, and in the headwaters of Banks and Wilson <strong>Creeks</strong>, and scattered narrow riparianmarshes in the mid reaches of many of the creeks (Figure 6-5). Wetland patches in thissubwatershed include a few large examples, and many medium and small ones, with each sizeclass contributing roughly equally to the total wetland cover in this subwatershed (Figure 6-6).There are four wetlands designated as “Provincially Significant” in this subwatershed: theLeonard’s Beach Swamp (a complex of mixed and deciduous swamp near Leonard’s Beach),the Little Cedar Point wetland (which is a complex of several wetland types near Belle Ewart),the Wilson Creek Marsh (which is a mix of swamp and marsh near the mouth of Wilson Creek),and the northern edge of the much larger Holland Marsh Wetland complex (Table 6-3).Table 6-3: Status of wetlands in the <strong>Innisfil</strong> <strong>Creeks</strong> subwatershed.StatusWetland CoverArea (ha) Area (%)Provincially Significant Wetlands(PSWs)521.7 4.9Evaluated Non-ProvinciallySignificant Wetlands*0 0Additional wetlands identified usingEcological Land Classification (ELC)681.1 6.4Total 1202.8 11.3Chapter 6: Terrestrial Natural Heritage 231
The <strong>Innisfil</strong> <strong>Creeks</strong> <strong>Subwatershed</strong> <strong>Plan</strong>Figure 6-6: Wetland patch size distribution in the <strong>Innisfil</strong> <strong>Creeks</strong> subwatershed.Again, like woodlands, the physical connections between individual wetland patches areextremely important for some species. In the case of wetlands specifically, many species ofturtles, frogs, and salamanders require both upland and wetland habitat to meet the needs oftheir breeding cycle. Preserving these species in a rural-urban landscape like that of the <strong>Innisfil</strong><strong>Creeks</strong> subwatershed requires both habitat types, as well as the physical connectivity betweenthem, be protected.6.2.3 ValleylandsA valleyland is a natural depression in the landscape that is often, but not always, associatedwith a river or stream. Valleylands are an important part of the framework of a watershed as thelandscape is generally a mosaic of valleylands and tablelands.Valleylands provide numerous functions for an ecosystem. These include (OMNR, 2010):• Ecological Values: dispersal and migration of wildlife, microclimate for plantcommunities• Hydrological Values: movement of surface water, ground water discharge areas,transport of sediment and nutrients, often associated with floodplains• Cultural values: location of aboriginal travel routes, influence current developmentpatternsThere are approximately 98.3 hectares within the <strong>Innisfil</strong> <strong>Creeks</strong> subwatershed that meet thedefinition of valleyland under the draft definitions of Key Natural Heritage Features (MNR, 2011)(Figure 6-7), of which 47.5 ha (or 48.3% is forested). The largest extent of forested ravines inthis subwatershed occur in the mid reaches of White Birch Creek, and the headwaters and midreaches of Carson Creek. Valleylands which aren’t forested are either currently under row crop,or had been managed under row crop agriculture, but have since been abandoned and arestarting to revert to old field or thicket type communities.Chapter 6: Terrestrial Natural Heritage 232
B A R R I E400 HWY NBIG BAY PT RDRIDGE RD WKempenfelt Bay<strong>Lake</strong><strong>Simcoe</strong>Key valleyland featuresin the <strong>Innisfil</strong> <strong>Creeks</strong>subwatershed.Figure 6-7LegendRoadMunicipal BoundarySIDERD 25LOCKHART RDWatercourseValleylandYONGE STA RD10TH LINESIDERD 109TH LINEINNISFIL BEACH RD7TH LINE6TH LINEMETRO RD NBASELINE RDWARDEN AVEWOODBINE AVESIDERD 105TH LINESIDERD 5HWY 400 S4TH LINE3RD LINEG E O R G I N APOLLOCK RDI N N I S F I L2ND LINECOUNTY RD 8914TH LINELINE 13Cook'sBayGLENWOODS AVERAVENSHOE RD0 0.5 1 2 3 4 5KilometresKThis product was produced by the <strong>Lake</strong> <strong>Simcoe</strong> <strong>Region</strong> Conservation Authority andsome information depicted on this map may have been compiled from various sources.While every effort has been made to accurately depict the information,data / mapping errors may exist.This map has been produced for illustrative purposes only.LSRCA GIS Services DRAFT TF created January <strong>2012</strong>.© LAKE SIMCOE REGION CONSERVATION AUTHORITY, 2011. All Rights ReservedThe following datasets roads, municipal boundaries and Oak Ridges Moraine are© Queens Printer for Ontario, 2011. Reproduced with Permission
The <strong>Innisfil</strong> <strong>Creeks</strong> <strong>Subwatershed</strong> <strong>Plan</strong>6.2.4 Riparian and shoreline habitatThe term riparian refers to the area of land adjacent to a stream, river, or lake. These areasprovide important fish and wildlife habitats, such as natural linkages among different habitatfeatures that create critically important wildlife migration corridors (Environment Canada, 2004).Riparian vegetation contributes to ecological function within a watershed in a number of ways:• The flow of stormwater is slowed, causing sediment to be deposited on land rather thanin the river or stream• The slower moving stormwater has increased opportunity for infiltration into thegroundwater, replenishing aquifers and helping to maintain baseflow• The roots of the plants absorb some of the contaminants contained in stormwater,preventing them from reaching the waterway• Erosion of the streambank is prevented, as the roots help to keep the soil in place• Vegetation provides shade, helping to maintain cool stream temperatures• Falling debris (branches, leaves) from the riparian vegetation provide food and shelterfor benthic invertebrates and fish• The linear nature of these features are extremely important to migrating birds and otherterrestrial wildlife travelling throughout the watershed• The seasonally flooded to hydric nature of most riparian areas provide habitat tospecialized plant communities that may not be found elsewhere in the watershedThe <strong>Lake</strong> <strong>Simcoe</strong> Integrated Watershed Management <strong>Plan</strong> (LSRCA, 2008) aspires to have allstreams within the watershed naturally vegetated, with a 30 metre buffer containing naturalvegetation on either side of the watercourse. Although the <strong>Lake</strong> <strong>Simcoe</strong> Protection <strong>Plan</strong> doesnot specify a quantitative target, it sets a target of “naturalized riparian areas on <strong>Lake</strong> <strong>Simcoe</strong>and along streams”, referring at a minimum to a 30 m width along watercourses and the <strong>Lake</strong><strong>Simcoe</strong> shoreline. The <strong>Innisfil</strong> <strong>Creeks</strong> subwatershed is approximately halfway towards that goal,with 49.7% of the 30m riparian zone existing under natural cover (Table 6-4, Figure 6-9).The second most commonland use within the 30mbuffer of <strong>Innisfil</strong> <strong>Creeks</strong>watercourses is agriculture.As distance increases awayfrom the watercourse,natural heritage coverdecreases and agricultureincreases, indicative of effortmade to preserve naturalvegetation alongwatercourses in thissubwatershed. Both low andhigh intensity developmentremains constant withdistance from thewatercourse (Figure 6-8).Chapter 6: Terrestrial Natural Heritage 234
The <strong>Innisfil</strong> <strong>Creeks</strong> <strong>Subwatershed</strong> <strong>Plan</strong>Figure 6-8: Riparian cover percentage per buffer distance.Although neither the <strong>Lake</strong> <strong>Simcoe</strong> Protection <strong>Plan</strong> nor the <strong>Lake</strong><strong>Simcoe</strong> Integrated Watershed Management <strong>Plan</strong> identify aquantitative target for natural cover along the <strong>Lake</strong> <strong>Simcoe</strong> shoreline,the LSPP identifies “no further loss of natural shorelines” as amanagement target. As of 2009, only 17.7% of the <strong>Lake</strong> <strong>Simcoe</strong>shoreline in this subwatershed remained under natural cover.Table 6-4: Extent of natural vegetation along riparian areas in the <strong>Innisfil</strong> <strong>Creeks</strong> subwatershed.Riparian zone characteristicsType of riparian zoneLength(km)Natural vegetationcover(%)Stream banks 149.1 49.7<strong>Lake</strong> <strong>Simcoe</strong> shoreline 46.6 17.7Both 195.7 45.0Chapter 6: Terrestrial Natural Heritage 235
B A R R I EBIG BAY PT RDRIDGE RD WKempenfelt Bay<strong>Lake</strong><strong>Simcoe</strong>Riparian and shorelinehabitat in the <strong>Innisfil</strong><strong>Creeks</strong> subwatershed.Figure 6-9LegendRoadMunicipal BoundarySIDERD 25LOCKHART RDRiparianNatural Vegetation400 HWY NRD10TH LINENo VegetationYONGE STSIDERD 109TH LINEINNISFIL BEACH RD7TH LINE6TH LINEMETRO RD NBASELINE RDWARDEN AVEWOODBINE AVESIDERD 105TH LINESIDERD 5HWY 400 S4TH LINE3RD LINEG E O R G I N APOLLOCK RDI N N I S F I L2ND LINECOUNTY RD 8914TH LINELINE 13Cook'sBayGLENWOODS AVERAVENSHOE RD0 0.5 1 2 3 4 5KilometresKThis product was produced by the <strong>Lake</strong> <strong>Simcoe</strong> <strong>Region</strong> Conservation Authority andsome information depicted on this map may have been compiled from various sources.While every effort has been made to accurately depict the information,data / mapping errors may exist.This map has been produced for illustrative purposes only.LSRCA GIS Services DRAFT created July 2011.© LAKE SIMCOE REGION CONSERVATION AUTHORITY, 2011. All Rights ReservedThe following datasets roads, municipal boundaries and Oak Ridges Moraine are© Queens Printer for Ontario, 2011. Reproduced with Permission
The <strong>Innisfil</strong> <strong>Creeks</strong> <strong>Subwatershed</strong> <strong>Plan</strong>6.2.5 Areas of Natural and Scientific InterestTo encourage the protection of unique natural heritage features and landscapes in southernOntario, the Ontario Ministry of Natural Resources developed the provincial Areas of Naturaland Scientific Interest (ANSI) program.There are two types of ANSIs, life science and earth science. Life science ANSIs are based onbiological and ecological characteristics. Earth science ANSIs are based on geological landformcharacteristics.The selection criteria used by the MNR to define ANSIs are:1. Representation;2. Diversity;3. Condition;4. Ecological function; and5. Special features.Candidate sites of each of a list of landform types within each ecodistrict are evaluated andranked using the criteria above. Those scoring the highest are deemed to be the ‘best’ exampleof that landform type in that ecodistrict, and are classified as a Provincially Significant ANSI, andare protected under the Provincial Policy Statement. Candidates with the second highest scoreare identified as a <strong>Region</strong>ally Significant ANSI, and are afforded protection in some parts of theprovince.There are two life science ANSIs in this subwatershed: a portion of the Holland River Marsh,and the entire DeGrassi Point Prairie Relict (Table 6-5).The DeGrassi Point Prairie Relict is located in the vicinity of one of the largest forest complexesin the subwatershed. This tallgrass prairie fragment is a relict of a series of such small prairieson the Native portage route between <strong>Lake</strong> Ontario and the Georgian Bay (Reznicek, 1983).When rediscovered in the early 1970s it consisted of a 1.6 ha open prairie dominated by Indiangrass (Sorghastrum nutans), and little bluestem (Schizachyrium scoparium), surrounded by astand of red oak and white pine. In recent years, the owners have been quite active aboutrestoring the prairie, through the use of controlled burns. Unfortunately, dog-strangling vine(Cynanchum rossicum) has become an extremely invasive at this site, limiting their success inrestoration.The Holland River Marsh is located in theextreme south east corner of thissubwatershed, and forms part of one ofthe largest woodland and wetland featuresin this subwatershed. The entire ANSI,which also occurs in the East Holland andWest Holland subwatersheds, is a largecomplex formed of fen, marsh, and swampcommunities. The portion of the ANSI thatoccurs in the <strong>Innisfil</strong> <strong>Creeks</strong> subwatershedis a mixed swamp on the slightly higherand drier northern margin of the wetland.Chapter 6: Terrestrial Natural Heritage 237
The <strong>Innisfil</strong> <strong>Creeks</strong> <strong>Subwatershed</strong> <strong>Plan</strong>Table 6-5: ANSIs found in the <strong>Innisfil</strong> <strong>Creeks</strong> subwatershed.ANSI NameSignificanceLevelStatusLifeScience/EarthScienceTotal Area(ha)Area inwatershed(ha)DeGrassi PointPrairie RelictHolland RiverMarshProvincial Confirmed Life 30.9 30.9Provincial Confirmed Life 2412.1 172.16.2.6 Species of conservation concernThe frequency of occurrence of all native species of plants, mammals, birds, amphibians,reptiles, and fish in Ontario have been documented by the Ministry of Natural Resources using aseries of S-ranks (or Sub-national ranks). Those designated as being provincially rare (i.e.ranked S1-S3) are those which are typically considered as being of ‘conservation concern.’Other species may be further protected by designation as being Endangered, Threatened, or ofSpecial Concern under the Federal Species at Risk Act or Provincial Endangered Species Act.Species of conservation concern in the <strong>Innisfil</strong> <strong>Creeks</strong> subwatershed include:• Yellow-rattle (Rhinanthus minor; S3), a semi-parasitic plant that takes its name from itsdry fruit which contains loose seeds, sounding like a rattle when shaken;• Butternut (Juglans cinerea; Endangered) a relatively common tree in the <strong>Lake</strong> <strong>Simcoe</strong>watershed which has been heavily impacted by a fungal disease which typically kills thetrees as they reach maturity;• Red-headed woodpecker (Melanerpes erythrocephalus; Special Concern) a cavitydweller that is dependent on relatively open savannah-like habitats;• Chimney swift (Chaetura pelagica; Threatened) a bird which nests in unused chimneys,church steeples and other structures;• Canada warbler (Wilsonia canadensis; Special Concern), a bird of dense forests,including early successional forests and swamps;• Common nighthawk (Chordeiles minor; Special Concern), bobolink (Dolichonyxoryzivorus; Threatened), and whip-poor-will (Caprimulgus vociferus; Threatened) all ofwhich require grassland habitats;• Snapping turtles (Chelydra serpentina; S3; Special Concern) which inhabit largewetlands;• Blandings turtle (Emydoidea blandingii; S3; Threatened), a turtle of shallow weedyponds;• Milksnake (Lampropeltis triangulum; S3; Special Concern) which, although difficult tofind, exist in a wide variety of habitats, and;• Monarch butterfly (Danaus plexippus; Special Concern) a species which is vulnerable toextinction due to its need to migrate to Mexico during the winter months.Chapter 6: Terrestrial Natural Heritage 238
The <strong>Innisfil</strong> <strong>Creeks</strong> <strong>Subwatershed</strong> <strong>Plan</strong>6.2.7 GrasslandsIn addition to these rare and at-risk species, are rare ecosystems. There is one documentedtallgrass prairie remnant in the <strong>Innisfil</strong> <strong>Creeks</strong> subwatershed, near DeGrassi Point, dominatedby Indian grass (Sorghastrum nutans), and little bluestem (Schizachyrium scoparium) and whichis currently home to eastern meadowlark (Sturnella magna; recommended by COSEWIC, notyet listed) (Bird Studies Canada et al, 2008). Historic records provide a more detailed plant listof this remnant, including 21 plant species which are rare in the <strong>Lake</strong> <strong>Simcoe</strong> watershed, andtwo which are provincially rare (Ecologistics, 1982; Reznicek, 1983).Even grasslands dominated by non-native plants (i.e. hayfields or old-field ecosystems) can behome to a number of at-risk species including monarch butterflies, bobolinks, and easternmeadowlark. In fact, grassland-dependent wildlife is experiencing significant populationdeclines in Ontario (McCracken, 2005). There are a number of grasslands scattered throughoutthis subwatershed, including abandoned agricultural land in ravines near the headwaters, andearly successional and old-field type ecosystems adjacent to wetlands or woodlands. In all,documented grasslands represent 5.2% of the <strong>Innisfil</strong> Creek subwatershed (Figure 6-1, Table6-6). In addition to the species of conservation concern listed above, other birds inhabitinggrasslands in the <strong>Innisfil</strong> <strong>Creeks</strong> subwatershed include savannah sparrow (Passerculussandwichensis), vesper sparrow (Pooecetes gramineus), common yellowthroat (Geothlypistrichas), gray catbird (Dumetella carolinensis) and indigo bunting (Passerina cyanea) (BirdStudies Canada et al., 2008).Table 6-6: Distribution of grassland types in the <strong>Innisfil</strong> <strong>Creeks</strong> subwatershed.Grassland typeGrassland CoverArea (ha) Area (%)Cultural meadow (CUM) 179.2 1.7Cultural thicket (CUT) 371.2 3.5Open tallgrass prairie (TPO) 2.9 0.03Total 553.3 5.2Chapter 6: Terrestrial Natural Heritage 239
The <strong>Innisfil</strong> <strong>Creeks</strong> <strong>Subwatershed</strong> <strong>Plan</strong>Key Points - Current Terrestrial Natural Heritage Status:• Natural heritage features represent approximately 33% of the <strong>Innisfil</strong> <strong>Creeks</strong>subwatershed. This includes 17.1% of upland forest, 11.3% wetland, and 5.2%grassland• Natural cover remains along 49.7% of the inland streams and 17.7% of thelakeshore in this subwatershed• Some of the most significant natural areas in this subwatershed include the HollandMarsh wetland complex (the northern margin of which is within this subwatershed),the forest and prairie complex at DeGrassi Point, and the large forest and wetlandcomplex at Big Bay Point• The natural heritage component of the assessments of these subwatersheds isrelatively data-poor, particularly as it relates to the distribution of flora and faunathroughout the subwatershed6.3 Factors impacting natural heritage status – stressorsThere are numerous factors that can affect terrestrial natural heritage features. They range fromnatural factors such as floods, fires, and droughts; to human influences, such as land useconversion, water use, the introduction of invasive species, and climate change. Natural factorsare generally localized and short in duration, and a natural system is generally able to recoverwithin a relatively short period. Some degree of natural disturbance is often a part of the lifecycle of natural systems. Conversely, human influences are generally much more permanent –a forest can not regenerate after it has been urbanized, natural communities have a great dealof difficulty recovering from the introduction of an invasive species, and wetlands may be unableto survive when their water source has been drawn down.6.3.1 Land use changePrior to European settlement, the <strong>Innisfil</strong> <strong>Creeks</strong> subwatershed was almost entirely covered byupland and wetland forest (Larson et al., 1999; DUC, 2010). The loss of natural habitat and itsconversion to agriculture and urban land use began almost immediately upon Europeansettlement, and has been ongoing. This habitat conversion represents the single mostsignificant threat to terrestrial natural heritage features in this subwatershed. By the mid 1950s,roughly two-thirds of the original forest cover had been lost, and converted to agricultural andurban land uses. Since the 1950s, the amount of natural habitat in this subwatershed haschanged little, however there has been a gradual increase in urban, and decrease in rural, landuses (Figure 2-2).Natural heritage features within settlement areas are those most susceptible to land usechange, as these areas are experiencing the greatest relative growth pressure, and aren’tsubject to the higher level of protection provided by policies under the <strong>Lake</strong> <strong>Simcoe</strong> Protection<strong>Plan</strong>. As much of the <strong>Lake</strong> <strong>Simcoe</strong> shoreline in <strong>Innisfil</strong> has been designated settlement area(Figure 2-8), it has the potential to experience some of the greatest growth pressures in thissubwatershed.Notwithstanding the above, the greatest change expected in this subwatershed will be asignificant shift from agricultural land uses to more intensive land uses including residential,Chapter 6: Terrestrial Natural Heritage 240
The <strong>Innisfil</strong> <strong>Creeks</strong> <strong>Subwatershed</strong> <strong>Plan</strong>commercial, and industrial. Thus, the greatest impacts to natural heritage features may beindirect in nature, through changes to the landscape matrix within which extant natural heritagefeatures are situated.Forests in urban settings are subject to stresses that forests in more rural or agricultural settingsaren’t, including an increase in predator pressure from house cats and racoons, increased noiselevels, increased light pollution, increased levels of ground level ozone, and an increaseddensity of invasive non-native species. As a result, forest-dwelling songbirds and amphibiansliving in primarily urban landscapes tend to be much less common, and restricted from smallerforests, than those living in primarily rural landscapes (Austen et al., 2001; Homan et al., 2004).Similarly, wetland-dependent wildlife face additional challenges in primarily urban landscapes.As natural areas are converted to farmland, amphibians make increasing use of irrigation pondsas replacement breeding habitat for lost wetlands, making these ponds critical wildlife habitat insome regions (Hecnar and M'Closkey, 1998). As landscapes convert to urban land uses,amphibians make similar shifts to storm water ponds. However, storm water ponds in manycases can be detrimental to amphibian populations, particularly if they are hypoxic, aresurrounded by unsuitable upland habitat, are located near roads, or have high concentrations ofpetrochemicals. In those cases, storm water ponds can act to suppress amphibian populationsbeyond the suppression caused by wetland habitat loss alone (Hamer and McDonnell, 2008).Both Barrie and <strong>Innisfil</strong> havebeen identified as `growthcentres` under the ProvincialGrowth <strong>Plan</strong> for the GreaterGolden Horseshoe (OMI,<strong>2012</strong>). As such, they havebeen designated to receive anincrease in population of74,300 (55%) and 23,000(69%) respectively over thenext 20 years (OMI, <strong>2012</strong>). Asthis development proceeds, thestresses associated with theloss and fragmentation ofnatural habitat will onlycontinue.6.3.2 Habitat fragmentationThe conversion of natural vegetation to other land uses is perhaps the most obvious stressrelated to land use change, but the perforation or fragmentation of extant natural areas can be asignificant stress as well. One issue of particular concern in urban or suburban areas is theencroachment of estate residential development into forests, and the related decline in forestinterior conditions. In some parts of North America, exurban development (also known asestate residential development or non-farm rural land use) is becoming a significant proportionof all development. Many people prefer to locate their houses in or near natural heritagefeatures for the aesthetic appeal, the privacy, and the access to outdoor recreationalopportunities. As demonstrated in Figure 6-10, this type of development not only reduces theamount of habitat on the landscape, but can have disproportionate effects on interior foresthabitat (i.e. that area more than 100 m from a forest edge).Chapter 6: Terrestrial Natural Heritage 241
AExample loss of forest interiorresulting from estateresidential developmentFigure 6-10LegendEstate ResidentialWoodlandsInterior ForestBµ0 50 100 200 300MetresThis product was produced by the <strong>Lake</strong> <strong>Simcoe</strong> <strong>Region</strong> Conservation Authority andsome information depicted on this map may have been compiled from various sources.While every effort has been made to accurately depict the information,data / mapping errors may exist.This map has been produced for illustrative purposes only.LSRCA GIS Services DRAFT DC created August 2011.© LAKE SIMCOE REGION CONSERVATION AUTHORITY, 2011. All Rights Reserved© J.D. Barnes Limited, 2009 Orthophotography”
The <strong>Innisfil</strong> <strong>Creeks</strong> <strong>Subwatershed</strong> <strong>Plan</strong>Based upon studies of birds and mammals, it has been found that this type of developmentincreases habitat that supports human-adapted species at the expense of more sensitivespecies (Odell and Knight, 2001). Findings by Friesen (1998) found that that the number ofhouses surrounding a forest undermined its suitability for Neotropical migrants. These speciesconsistently decreased in diversity and abundance as the level of adjacent developmentincreased. Similarly, non-native vegetation is much more common in woodlots near exurbandevelopment than in woodlots in more rural or forested landscapes (Hansen et al., 2005).In the <strong>Lake</strong> <strong>Simcoe</strong> watershed as a whole, this type of development has a significant impact oninterior forest habitat, with an estimated loss of about 8% of this highly productive wildlife habitatto estate residential development (LSRCA, 2008). A similar pattern is seen in the <strong>Innisfil</strong> <strong>Creeks</strong>subwatershed, where approximately 6.5% of the potential interior forest habitat has been lost toestate residential development (Table 6-7).Table 6-7: Cumulative impact of estate residential development in the <strong>Innisfil</strong> <strong>Creeks</strong>subwatershed.Woodland typeWoodland CoverPre-estateresidential (ha)Current (ha)Woodland 1839.2 1831.9Woodland interior 243.8 228.16.3.3 Shoreline developmentThe <strong>Lake</strong> <strong>Simcoe</strong> shoreline has long been a draw for cottage and housing development, but thistype of development has impacts on native species and habitats as well. The impacts ofshoreline development on fish and aquatic habitats (as described in Chapter 5 – AquaticNatural Heritage) is perhaps best documented, but the clearing of vegetation along shorelineshas also been associated with a decline in native songbirds (Clark et al., 1984; Henning andRemsburg 2009), amphibians (Henning and Remsburg 2009), and small mammals (Racey andEuler, 1982), and an increase in non-native species.Currently, only 17.7% of the shoreline along the <strong>Innisfil</strong> <strong>Creeks</strong> subwatershed remains undernatural vegetative cover (Table 6-4). This is particularly concerning, as this subwatershed hasone of the greatest extents of shoreline of any of <strong>Lake</strong> <strong>Simcoe</strong>’s subwatersheds (representingnearly one-fifth of the total lakeshore).Furthermore, the <strong>Simcoe</strong> County soil map identifies much of theeast shore of the <strong>Innisfil</strong> <strong>Creeks</strong> subwatershed as being underlainby imperfectly to poorly drained fine-grained mineral soils, whichsuggests that, before settlement, much of this area was probablycomposed of wetlands, a suggestion which is also confirmed byreports of early surveyors (Figure 6-2). These wetlandspresumably would have had substantial hydrological and naturalheritage influences on the <strong>Lake</strong>, including influences to nutrientcycling, flood regimes, wildlife habitat and food resources foroffshore fisheries.Chapter 6: Terrestrial Natural Heritage 243
The <strong>Innisfil</strong> <strong>Creeks</strong> <strong>Subwatershed</strong> <strong>Plan</strong>6.3.4 Road developmentIn addition to the loss and fragmentation of habitat associated with land use change, thedevelopment and use of roads can have impacts on natural heritage values as well. Roads canhave significant impacts on wildlife communities and the ability of wildlife to move throughouttheir home ranges. Direct mortality of animals related to roads can be particularly significant forspecies such as frogs, turtles and salamanders, which are relatively slow moving but need totravel from wetland to upland areas to fulfil the requirements of their breeding cycle (Fahrig andRytwinski, 2009). Even more mobile animals such as mammals (Findlay and Houlahan, 1997)and birds (Kociolek et al., 2011) can be subject to increased mortality along roads. Apreliminary assessment of the risks to wildlife associated with road mortality suggests that manyof the roads that bisect forests and wetlands along the <strong>Innisfil</strong> <strong>Creeks</strong> lakeshore are associatedwith a heightened risk of road mortality.In addition to the direct impacts associated with mortality, roads can decrease the value ofadjacent natural areas as breeding habitat, by increasing noise levels and increasingillumination at night (Kociolek et al., 2011), and by acting as a source of chloride orpetrochemicals to amphibian breeding ponds (Fahrig and Rytwinski, 2009). Conversely, somescavenger species such as American crows and red-tailed hawks respond positively to thepresence of roads, as roads provide a consistent food source for them. Research in the UnitedStates and Europe suggests that this ‘road effect zone’ can extend for hundreds of metres fromroads (Forman and Deblinger, 2000). If this is true, the roughly 1 km grid of concession roads inthe <strong>Innisfil</strong> <strong>Creeks</strong> subwatershed may be impacting all remnant natural heritage areas.Road development proposed as part of thedevelopment in Big Bay Point (as shown onSchedule C of the <strong>Innisfil</strong> Official <strong>Plan</strong>) may havesubstantial impacts to wildlife. This forest is amongthe largest in the subwatershed, and is composedof a mix of upland and wetland compartments.Amphibians and turtles migrating between thesetwo habitat types are particularly susceptible toroad mortality. As part of the developmentprocess though, the proponent has been requiredto identify mitigation measures to protectamphibians, including aligning a proposedcollector road to avoid amphibian breeding habitat.6.3.5 Changes to hydrologic regimeAlthough the current status of, and stressors on, surface water hydrology are dealt with morefully in Chapter 4 – Water Quantity, changes to the hydrological regime in the subwatershedcan have impacts on the extent and quality of natural heritage features as well, particularlywetland and riparian ecosystems. These ecosystems and their associated vegetation aredependent upon natural variations in hydrologic conditions such as baseflow rates, seasonalflooding and drainage. Any alteration to the hydrologic regime can lead to loss or changes in thecondition of these ecosystem types. Factors leading to changes in hydrologic regime includeloss of upland and wetland natural heritage features, and their conversion to impervious cover.This relationship is discussed more fully in Chapter 4 – Water Quantity.Perhaps less obvious, but also important from a natural heritage standpoint, is the introductionof agricultural drains, particularly in remnant natural heritage features. When agricultural drainsChapter 6: Terrestrial Natural Heritage 244
The <strong>Innisfil</strong> <strong>Creeks</strong> <strong>Subwatershed</strong> <strong>Plan</strong>are introduced to swamps or mesic forests, the water table drops. This lowering of the watertable changes the infiltration rate of surface water; in some cases, enough to change thehydroperiod of vernal pools. These small shallow and temporary water bodies are criticalbreeding habitat for a range of frog and salamander species, as well as stopover habitat formigratory waterfowl. In some areas, the lowering of the water table caused by agriculturaldrains causes the vernal pools to dry up more quickly, exposing the eggs and tadpoles.As soil moisture is a major determining factor for the presence or absence of many plantspecies, lowering the water table can also have significant impacts on plant communities inremnant natural areas. Further, in areas with relatively high levels of residential developmentsuch as this subwatershed, many of the plants which colonize rapidly changing areas such asthis are non-natives.There are a number of municipal drains that bisect, and may impact, wetlands in the <strong>Innisfil</strong><strong>Creeks</strong> subwatershed, including the Big Bay Point drain, the Redfern drain, and the 9 th Linedrain (Figure 5-8).6.3.6 Invasive speciesNon-native species can be a significant threat to biodiversity as well. Some species, when inthe absence of predators or disease to check the growth of their populations, can becomeextremely abundant. This is particularly the case with species which aren’t native to NorthAmerica. Many of these species, when introduced as garden plants or house pets, orinadvertently through international shipping, can become extremely aggressive invasives. Themost aggressive of these can reduce biodiversity – by outcompeting native species for food(e.g. red-eared slider), breeding habitat (e.g. house sparrow), sunlight (e.g. dog-strangling vine),or through direct consumption (e.g. emerald ash borer).Documentation of terrestrial invasive species in this subwatershed is currently limited to:• Purple loosestrife (Lythrum salicaria), a escaped cultivated species which has becomewidespread in wetlands, and is suspected of decreasing the diversity of native wetlandplants• European starling (Sturnus vulgaris), initially released into the wild in Central Park, thisspecies has spread across North America, and outcompetes native species for nestingcavities;• House sparrow (Passer domesticus), another species of European bird introduced toNorth America by early settlers, and has since become widespread, and;This short list is no doubt reflective more of a lack of documentation than a lack of invasivespecies in this subwatershed. The <strong>Lake</strong> <strong>Simcoe</strong> Protection <strong>Plan</strong> recommends the developmentand implementation of a monitoring program which will document the presence and extent ofterrestrial invasive species in the <strong>Lake</strong> <strong>Simcoe</strong> watershed. This monitoring program has thepotential to make significant contributions to filling this data gap.The <strong>Lake</strong> <strong>Simcoe</strong> Protection <strong>Plan</strong> has also developed a ‘watch list’ of invasive species whichare not yet in the <strong>Lake</strong> <strong>Simcoe</strong> watershed, but which, if they do appear here, are expected tohave significant negative impacts on natural areas. Terrestrial species on that list are: kudzu(Pueraria lobata), emerald ash borer (Agrilus planipennis), Asian long-horned beetle(Anoplophora glabripennis), chronic wasting disease, oak wilt, and white nose syndrome.Chapter 6: Terrestrial Natural Heritage 245
The <strong>Innisfil</strong> <strong>Creeks</strong> <strong>Subwatershed</strong> <strong>Plan</strong>Within five years of the release of the LSPP (i.e. 2014), the MNR is to develop response plansto address invasive species in the watershed, and those on the watch list.6.3.7 Trophic cascadesLand use changes can not only affect wildlife populations directly through the loss ordisturbance of habitat, they can also be affected indirectly as significant decreases or increasesin populations of one species affect species elsewhere in the food web, through processesknown as “trophic cascades.”An example of such a trophic cascade is the decrease in songbirds that has been observed astop carnivore populations decrease (Crooks and Soulé, 1999). This trophic cascade occurredbecause the loss of top predators (in that case coyotes), allowed populations of mid-levelpredators such as housecats, skunks, and racoons to increase. Although these species aren’t atthe top of the food chain, they are extremely effective predators, so an increase in theirpopulations led to a significant decline in the populations of their prey (in that case, songbirds).Similar trophic cascades have been observed in wildflowers, nesting songbirds, butterflies, andother invertebrates, by high levels of selective grazing of woodland vegetation as populations ofwhite-tailed deer increase (Cote et al., 2004).A similar trophic cascade that has recently come to light in Ontario is the decline of songbirdsthat feed on flying insects. This group, which includes species as diverse as swifts, swallows,nighthawks, and flycatchers, has seen population declines of up to 70% in the past twodecades. Although there are a lot of stresses facing these species, the only attribute they sharethat best explains their concurrent decline is their reliance on flying insects such as bees,wasps, butterflies and moths as a food source. There are a number of factors contributing tothe decline of these insects, including light pollution, loss of wetlands and other naturalvegetation, declines in water quality, climate change, and increased use of insecticides in urbanand rural settings (McCracken, 2008).6.3.8 RecreationDespite the social values related to outdoor recreation, if these activities are not properlymanaged, recreation itself can become a stressor on natural heritage features. Impacts fromrecreational activities can include increased soil erosion (e.g. Marion and Cole, 1996),destruction of vegetation (Cole, 1995), introduction of invasive species (Potito and Beatty,2005), and disturbance to resident wildlife (Miller et al., 1998).These impacts can be largely mitigated with the appropriate designand location of trails and other recreational features, and themanagement of recreational users, to ensure that motorized vehiclesand off-leash dogs are prohibited from sensitive sites.As these subwatersheds develop, these types of impacts will nodoubt increase, as the combination of larger populations and smalllot sizes will tend to increase the numbers of people looking foropportunities for outdoor recreation. Further, as developmentproceeds, accessible upland natural areas may become even rarer,concentrating this pressure into increasingly rare remnant habitats.As a result, as development proceeds, the need to manage theimpacts associated with outdoor recreation will only intensify.Chapter 6: Terrestrial Natural Heritage 246
The <strong>Innisfil</strong> <strong>Creeks</strong> <strong>Subwatershed</strong> <strong>Plan</strong>6.3.9 Climate changeProjections suggest that climate change will have significant impacts on terrestrial naturalheritage features in the <strong>Lake</strong> <strong>Simcoe</strong> watershed. Recent modeling work was completed for the<strong>Lake</strong> <strong>Simcoe</strong> watershed, examining the response of tree species to climate change, asinfluenced through factors such as the current range of the species, its current local abundance,phenology, and seed production (Puric-Mladenovic et al., 2011). As climates change, the modelpredicts that balsam fir (Abies balsamea), red maple (Acer rubrum), yellow birch (Betulaalleghaniensis), and eastern hemlock (Tsuga canadensis) will all exhibit slight decreases in theiroccurrence in the forests of the <strong>Innisfil</strong> <strong>Creeks</strong> subwatershed. In fact, the projected shifts inclimate may cause some species which are currently relatively widely distributed to becomemore narrowly restricted to remaining habitat, including red maple becoming restricted towetlands, as they shift to areas with moister soil, and yellow birch becoming restricted toravines, as they shift to areas with cooler and moister microclimates. Other species, notably redoak (Quercus rubra), are anticipated to become more common as a result of the warmingclimate.Modeling results suggest that forests in cooler microclimates in ravines and north facing slopes,which tend to have a relatively high dominance of eastern hemlock, yellow birch, and Americanbeech, may be among the most sensitive ecosystem to the changing climate. Sadly though, thespecies which the model suggests are the most vulnerable to climate change are those whichwe think of as being proto-typically Canadian. Both sugar maple (Acer saccharum) (Canada’snational symbol), and white pine (Pinus strobus) (Ontario’s provincial tree) are predicted toexperience severe declines in the <strong>Innisfil</strong> <strong>Creeks</strong> subwatershed (Puric-Mladenovic et al., 2011).A separate set of models, developed to assess the vulnerability of wetland ecosystems, suggestthat a ‘worst case’ climate change scenario would have catastrophic impacts on wetlands in the<strong>Lake</strong> <strong>Simcoe</strong> watershed. The increases in average annual temperature and decreases inaverage annual precipitation that are projected to occur by the year 2100 are estimated to make90% of the swamps and 84% of the marshes in the <strong>Lake</strong> <strong>Simcoe</strong> watershed vulnerable todrying. As drying occurs, it is expected that marshes would shift in composition to becomeswamp (or thicket swamp) type communities, and treed swamps would shift to become mesicforests (Chu, 2011).In sum, these models suggest that there will be a shift in community composition in the naturalareas in the <strong>Innisfil</strong> <strong>Creeks</strong> subwatershed, and a net loss of tree species diversity.Unfortunately, natural areas lacking in species diversity tend to be more vulnerable to otherthreats such as insects, disease, and invasive species, suggesting that the impacts seen toterrestrial natural heritage features may become cumulative in nature.This loss in native tree species diversity may be mitigated somewhat by the ability of speciesnot currently found here to thrive in the expected new climate. Species found in southernOntario (such as black maple (Acer nigrum)) or the southeastern US (such as black hickory(Carya texana)) may become relatively common in forests in these subwatersheds, furtherinfluencing the shift in plant community composition. However, the fragmented nature of thelandscape that these species would need to cross will no doubt limit their ability to colonizeforest remnants, without assisted migration (i.e. planting) (Puric-Mladenovic et al., 2011).Other, less desirable, species may also be able to respond positively to changing climates aswell. Some invasive species are projected to experience a northward range expansion (e.g.kudzu (Pueraria lobata), an extremely invasive vine), or experience increased growth rates andbiomass (e.g. Eurasian water milfoil (Myriophyllum spicatum), a widespread invasive aquaticplant) (Sager and Hicks, 2011).Chapter 6: Terrestrial Natural Heritage 247
The <strong>Innisfil</strong> <strong>Creeks</strong> <strong>Subwatershed</strong> <strong>Plan</strong>Predicted impacts of climate change on wildlife are less clear. Some authors (e.g. Walpole andBowman, 2011) suggest that as average annual temperature increases, more species of bothbirds and mammals will be able to inhabit the <strong>Lake</strong> <strong>Simcoe</strong> watershed. Others caution that, forsome species, the disadvantages of climate change may outweigh the advantages. Forexample, wetland-dependent species may suffer significant population declines as wetlands dryup (Chu, 2011). Similarly, although some migratory birds have been able to take advantage ofwarmer springs and are migrating earlier, other species appear less able to adapt theirbehaviour to changing temperature and are vulnerable to not being able to find sufficient foodresources or suitable nesting sites later in the season (Burke et al., 2011). These relationshipsmay be even more complicated in these subwatersheds however, as the interacting effects ofclimate change, landscape fragmentation, and urbanization may constrain the ability of wildlifeto colonize habitat areas, and to persist within them.Key Points – Factors Impacting Terrestrial Natural Heritage - stressors• There are multiple stressors to natural heritage systems in this subwatershed, manyof which interact.• Over the short term, the greatest stress to natural heritage values is expected to bedue to changes in land use. This stress can only be expected to increase as thepopulation in this subwatershed increases.• In addition to the direct loss of natural areas, development is typically associatedwith an increase in roads (which can cause mortality in wildlife and disturbance toremaining nearby natural areas), an increase in impervious surfaces (which canaffect the hydrology of remnant natural areas), and the loss of natural habitat alongshoreline and other riparian areas (which tend to be disproportionately important towildlife).• Remnant natural areas in heavily settled landscapes typically face more intensestresses as well, including an increase in the number and diversity of invasivespecies, increased pressure from recreational users, and trophic cascades causedby changes in food webs and other inter-species relationships.• The emerging threat of climate change will interact with all of these threats, creatingadditive long-term stresses on natural areas and wildlife populations. Althoughresearch in this area is still emerging, initial predictions suggest a loss of wetlandsand wetland-dependent species, and a loss of some of our most-loved species ofnative trees.Chapter 6: Terrestrial Natural Heritage 248
The <strong>Innisfil</strong> <strong>Creeks</strong> <strong>Subwatershed</strong> <strong>Plan</strong>6.4 Current Management FrameworkVarious programs exist to protect and restore terrestrial natural heritage features in the <strong>Lake</strong><strong>Simcoe</strong> watershed, ranging from regulatory mechanisms, to education programs, to funding andtechnical support provided to private landowners.Many of these programs already address some of the stresses facing terrestrial natural heritagein the <strong>Innisfil</strong> <strong>Creeks</strong> subwatershed, as outlined below.6.4.1 Protection and policy6.4.1.1 Land use planning and policySeveral acts, regulations, policies, and plans have shaped the identification and protection ofthe terrestrial natural heritage of the <strong>Innisfil</strong> <strong>Creeks</strong> subwatershed. Those having most impact onnatural heritage features are summarized in Table 6-8. This management framework relates tomany different stressors that can potentially affect natural heritage, ranging from direct impactsassociated with habitat loss and urban development, to stresses such as climate change andinvasive species which are more global in nature.Table 6-8 categorizes eight such stressors, recognizing that many of these activities overlapand that the list is by no means inclusive of all activities. The legal effects of the various Acts,policies, and plans on the stressors is categorized as ‘existing policies in place’, or ‘noapplicable policies’. The policies included in the table include those which have legal standingand must be conformed to, or policies (such as some of those under the <strong>Lake</strong> <strong>Simcoe</strong>Protection <strong>Plan</strong>) which call for the development of further management tools, research oreducation programsThe intent of these regulations, policies and plans are summarized in Section 1.3 – CurrentManagement Framework. Readers interested in the details of these regulations, policies andplans are directed to read the original documents.Chapter 6: Terrestrial Natural Heritage 249
The <strong>Innisfil</strong> <strong>Creeks</strong> <strong>Subwatershed</strong> <strong>Plan</strong>Table 6-8 : Summary of the current management framework as it relates to the protection ofterrestrial natural heritage.Stressor affecting theprotection and restorationof terrestrial naturalheritage<strong>Lake</strong> <strong>Simcoe</strong> Protection <strong>Plan</strong>(2009)Growth <strong>Plan</strong> for the GreaterGolden Horseshoe (2006)Provincial Policy Statement(2005)Endangered Species Act(2008)LSRCA WatershedDevelopment Policies (2008)<strong>Simcoe</strong> County Official <strong>Plan</strong>(2007)Town of <strong>Innisfil</strong> Official <strong>Plan</strong>(2006)City of Barrie Official <strong>Plan</strong>(2009)Site alteration in uplandnatural heritage features1,4 6 2,4 2,4 2,4Site alteration in wetlands1,4 6 4 4 4 4Shoreline development4 6Loss of connectivitybetween natural heritagefeatures8Impervious areas7Climate changeIntroduction of invasivespeciesProtection of species ofconservation concern310 6 10 6, 10 6, 10 9, 10Existing policies in placeNo applicable policies1Regulations specific to those areas outside settlement areas2 Development not permitted in wetlands, significant forests, significant valleylands (e.g. other than wetlands, features notconsidered significant are not afforded the same protection)3 Discusses developing proposed regulations (to be considered by federal government under fisheries act), conducting studies/riskassessments, developing response plans, education programs, but nothing banning use/etc4Includes the feature plus a designated set back (or ‘buffer’ or ‘adjacent lands’)5 “Species of conservation concern” identified as an indicator, but not defined or regulated6 Specific to Endangered and Threatened species7 Targets for impervious cover provided for the Oak Ridges Moraine Conservation <strong>Plan</strong> area, but not the subject area8 “Connectivity” not identified, but if identified would be designated as EP9“Rare species including unique plants”, plus Endangered and Threatened10 In the context of “Significant Wildlife Habitat”Chapter 6: Terrestrial Natural Heritage 250
The <strong>Innisfil</strong> <strong>Creeks</strong> <strong>Subwatershed</strong> <strong>Plan</strong>Legislation and policy restrictions are the primary source of protection for natural heritagefeatures in the <strong>Lake</strong> <strong>Simcoe</strong> watershed, guided by the fundamental Provincial planning policiesas articulated in the Provincial Policy Statement (PPS). However, some stresses are bettersuited to policy and regulation than others. For example, natural heritage stressors such asclimate change and invasive species are hard to regulate; however, stresses associated withthe loss of habitat and conversion to residential or industrial land uses are much easier tocontrol and regulate.Policy tools to deal with those stresses can be found in Provincial policy (such as the PPS orLSPP), municipal official plans and zoning bylaws, and Conservation Authority Regulations.Together, these documents are intended to provide protection to features that are significantboth locally and provincially, while providing clarity to private landowners, and accountability tothe electorate.Further to the guidelines provided by the PPS, the LSPP identifies additional targets for theretention of natural heritage features in the <strong>Lake</strong> <strong>Simcoe</strong> watershed. Targets which wouldconstrain development or other land use change include: ensuring no further loss of naturalshorelines on <strong>Lake</strong> <strong>Simcoe</strong>, achieving protection of wetlands, and achieving naturalized riparianareas on <strong>Lake</strong> <strong>Simcoe</strong> and along streams.Policies established under the <strong>Lake</strong> <strong>Simcoe</strong> Protection <strong>Plan</strong> will assist in achieving these targetsby establishing restrictions to development or site alteration within 100m of the <strong>Lake</strong> <strong>Simcoe</strong>shoreline (30m in already built-up areas, subject to a natural heritage evaluation), or within 30mof a key natural heritage feature (i.e. wetlands, significant woodlands, significant valleylands, ornatural areas adjacent to <strong>Lake</strong> <strong>Simcoe</strong>), with natural heritage evaluations necessary fordevelopment proposed within 120m of the feature.Draft definitions of Key Natural Heritage Features protected by the LSPP include all areas thatmeet the definition of wetland provided by either the Ontario Wetland Evaluation System or theEcological Land Classification manual, all woodlands larger than 10 ha in size (or larger than 4ha in size if they contain late successional tree species more than 100 years old, or are nearother Key Natural Heritage Features) and all valleylands that meet specific dimensionalrequirements (Figure 6-11).However, the communities of SandyCove, Alcona, Lefroy-Belle Ewart,Gilford and Fennell’s Corners, as wellas the City of Barrie (as described inthe 2009 Official <strong>Plan</strong>) have beendesignated ‘settlement areas’ under the<strong>Lake</strong> <strong>Simcoe</strong> Protection <strong>Plan</strong> (Figure 2-8). Policies identified under the <strong>Lake</strong><strong>Simcoe</strong> Protection <strong>Plan</strong> to protect KeyNatural Heritage Features are notapplicable within settlement areas, andas such, natural heritage protectionpolicies developed under the municipalofficial plans and zoning bylawsprovide the guidelines on protection ofthese features within settlement areas.Chapter 6: Terrestrial Natural Heritage 251
B A R R I E400 HWY NBIG BAY PT RDLOCKHART RDRIDGE RD WKempenfelt BaySIDERD 25<strong>Lake</strong><strong>Simcoe</strong>Preliminary interpretation ofKey Natural HeritageFeatures in the <strong>Innisfil</strong><strong>Creeks</strong> subwatershedLegendFigure 6-11Designated by Official<strong>Plan</strong> (DRAFT)Designated by Official<strong>Plan</strong>Key Natural HeritageFeaturesESSA RDSIDERD 1010TH LINE9TH LINEINNISFIL BEACH RD7TH LINE6TH LINEYONGE STMETRO RD NBASELINE RDWOODBINE AVENatural HeritageSettlement AreaRoadMunicipal BoundaryWatercourseWARDEN AVESIDERD 10SIDERD 5HWY 400 S5TH LINE4TH LINE3RD LINEG E O R G I N APOLLOCK RDI N N I S F I L2ND LINECOUNTY RD 8914TH LINELINE 13Cook'sBayGLENWOODS AVERAVENSHOE RD0 0.5 1 2 3 4 5KilometresKThis product was produced by the <strong>Lake</strong> <strong>Simcoe</strong> <strong>Region</strong> Conservation Authority andsome information depicted on this map may have been compiled from various sources.While every effort has been made to accurately depict the information,data / mapping errors may exist.This map has been produced for illustrative purposes only.LSRCA GIS Services DRAFT created February <strong>2012</strong>.© LAKE SIMCOE REGION CONSERVATION AUTHORITY, 2011. All Rights ReservedThe following datasets roads, municipal boundaries and Oak Ridges Moraine are© Queens Printer for Ontario, 2011. Reproduced with Permission
The <strong>Innisfil</strong> <strong>Creeks</strong> <strong>Subwatershed</strong> <strong>Plan</strong>The Town of <strong>Innisfil</strong> identifies wetlands, ANSIs, valleylands, significant woodlands, significantwildlife habitat, significant habitat of endangered and threatened species, the <strong>Lake</strong> <strong>Simcoe</strong>shoreline, and stream corridors as being Environmental Protection Areas under its Official <strong>Plan</strong>.Development is prohibited in Provincially Significant wetlands or Significant habitat ofendangered or threatened species, and development in other Environmental Protection Areaswill be subject to an Environmental Impact Statement which must demonstrate that thedevelopment will have no negative impacts on the natural feature or its ecological functionbefore development is approved. Thus, the difference between settlement areas and the rest ofthe Town of <strong>Innisfil</strong> is that development is restricted, rather than prohibited, in natural heritagefeatures other than Provincially Significant wetlands and habitat of endangered and threatenedspecies.The City of Barrie has developed a draft Natural Heritage Strategy under their Official <strong>Plan</strong>,which prohibits development in provincially significant wetlands, habitat of endangered andthreatened species, and watercourse and vegetation protection zones. Furthermore,development is prohibited in valleylands, rare vegetation communities, and woodlands largerthan 4 ha, unless no negative impact can be demonstrated.The LSRCA is assisting municipalities in identifying natural heritage systems for inclusion inOfficial <strong>Plan</strong> policies with the Natural Heritage System for the <strong>Lake</strong> <strong>Simcoe</strong> Watershed (Beaconand LSRCA, 2007). This planning tool interprets and applies the Provincial Policy Statement(PPS) to the <strong>Lake</strong> <strong>Simcoe</strong> watershed, which when paired with the Natural Heritage ReferenceManual (OMNR, 1999), provides comprehensive science-based criteria to identify significantnatural heritage features. The Natural Heritage System applies these criteria to the <strong>Lake</strong><strong>Simcoe</strong> watershed to provide specific recommendations to LSRCA staff to guide plan review,and to municipalities to assist with Official <strong>Plan</strong> development.An additional layer of regulatory control is afforded to wetlands under Ontario Regulation 179/06(Regulation of development, interference with wetlands and alterations to shorelines andwatercourses). Watershed development policies established by LSRCA under that Regulationprohibit development in Provincially Significant wetlands, and restrict development in all otherwetlands in the <strong>Lake</strong> <strong>Simcoe</strong> watershed.The end result of these legislation, policy and regulatoryrestrictions is that 83% of the natural heritage features in the<strong>Innisfil</strong> <strong>Creeks</strong> subwatershed has some level ofdevelopment restrictions applied to them (Table 6-9, Figure6-11). Remaining exceptions include some small (
The <strong>Innisfil</strong> <strong>Creeks</strong> <strong>Subwatershed</strong> <strong>Plan</strong>Table 6-9: Extent of natural heritage protection policies in the <strong>Innisfil</strong> <strong>Creeks</strong> subwatershed.Natural heritage featureTotal existing (ha)Natural heritage coverTotal withdevelopmentrestrictions (ha)Upland forests 1831.8 1725.9Wetlands 1192.1 1192.1Grasslands 553.3 8.8Total 3577.2 2926.8An assessment of the “extreme-case scenario” for development in these subwatersheds isshown in Figure 6-12. This assessment assumes full build-out in the settlement areas (i.e. allnatural heritage features not protected by LSPP, municipal official plan, or ConservationAuthority regulation, and all agricultural lands converted to urban land use), and all unprotectednatural heritage features outside settlement areas converted to agricultural land use.This scenario results in a slight increase in the amount of urban land use to support expectedpopulation growth in these municipalities, and a slight increase in agricultural land as well. Itmight be argued that this increase in agricultural land would be necessary to offset farm landlost during build-out of settlement areas, but given the relatively minor contribution thatagriculture makes to the local economy (Table 2-4), and our ability to offset lost production withincreased agricultural imports, this increase in agricultural land is likely over estimated. Thisscenario also results in a net loss of natural heritage features in these subwatersheds, to offsetthese gains in urban and agricultural land use. As mentioned above, natural heritage featuresvulnerable to development include grasslands and small isolated forests. It should be notedthat even under this worst-case scenario, with relatively unrealistic assumptions, existing naturalheritage protection policies reduce the loss of existing natural heritage features to a smallpercentage (Figure 6-12). As such, the greatest impact to natural heritage features in the <strong>Innisfil</strong><strong>Creeks</strong> subwatershed may be those which are more indirect in nature, such as impactsassociated with adjacent road traffic, an increase in invasive species, trophic cascades, andother stresses outlined in Sections 6.3.2 to 6.3.9. Unfortunately, these indirect effects are moredifficult to control through mechanisms such as municipal Official <strong>Plan</strong>s.Chapter 6: Terrestrial Natural Heritage 254
The <strong>Innisfil</strong> <strong>Creeks</strong> <strong>Subwatershed</strong> <strong>Plan</strong>Figure 6-12: Extreme-case scenario of possible land use change in the <strong>Innisfil</strong> <strong>Creeks</strong>subwatershed.6.4.1.2 Acquisition of natural heritage features by public agenciesSeveral mechanisms exist for the acquisition of natural heritage features by the <strong>Lake</strong> <strong>Simcoe</strong><strong>Region</strong> Conservation Authority and municipal governments.The LSRCA has a land securement program which aims to acquire significant natural heritagefeatures in the <strong>Lake</strong> <strong>Simcoe</strong> watershed, on a willing buyer – willing seller basis. LSRCA hasdeveloped a Natural Heritage System Land Securement Project, which focuses LSRCA’ssecurement efforts by identifying nine land securement priority areas (LSRCA, 2010) which willbe actively pursued. One of the priority areas identified in that strategy is the Holland Marshwetland complex, which extends into the southern extremity of this subwatershed. As describedin section 6.2, this wetland complex is one of the largest and most significant natural heritagefeatures in this subwatershed. The LSRCA may also consider receiving donations of relativelylarge parcels of land elsewhere in the subwatershed, if they meet the criteria of theConservation Land Tax Incentive Program.Similarly, <strong>Simcoe</strong> County has a land acquisition program intended to increase the amount ofCounty Forest holdings. Priority acquisition of land for the County Forest program is given toproperties adjacent to existing county forests, and that contribute to both forestry and naturalheritage purposes.Chapter 6: Terrestrial Natural Heritage 255
The <strong>Innisfil</strong> <strong>Creeks</strong> <strong>Subwatershed</strong> <strong>Plan</strong>The City of Barrie and Town of <strong>Innisfil</strong>also have parkland dedication targetsin their Official <strong>Plan</strong>s. These targetsare intended to ensure that as thepopulation grows, opportunities foroutdoor recreation grow as well.Although parkland targets areprimarily geared towards ‘traditional’municipal parks (e.g. soccer fields,baseball diamonds, playgrounds andother manicured greenspace), larger‘regional’ parks sometimes includenatural heritage features within them.With projected growth in Barrie and<strong>Innisfil</strong>, by 2031 these municipalitiesshould see an additional 159 ha and50 ha of ‘regional’ park establishedrespectively.6.4.2 Restoration and remediationThere is a range of programs operating in these subwatersheds to assist private landowners inimproving the environmental health of their land.The Landowner Environmental Assistance Program (LEAP) is a partnership between the <strong>Lake</strong><strong>Simcoe</strong> <strong>Region</strong> Conservation Authority, its member municipalities, and the York, Durham and<strong>Simcoe</strong> chapters of the Ontario Federation of Agriculture. This program provides technical andfinancial support to landowners in the <strong>Lake</strong> <strong>Simcoe</strong> watershed wanting to undertakestewardship projects on their land. Project types which are funded by the LEAP programinclude managing manure and other agricultural wastes, decommissioning wells and septicsystems, fencing and planting riparian areas, and increasing the amount of wildlife habitat in thewatershed, among others. Since 1989, in addition to projects focussed specifically onprotecting water quality, LEAP has supported six riparian buffer and five upland tree plantingprojects in this.The Ontario Ministries of Natural Resources, Environment, and Agriculture, Food and RuralAffairs provide the <strong>Lake</strong> <strong>Simcoe</strong> Community Stewardship Program for non-farm rurallandowners in the <strong>Lake</strong> <strong>Simcoe</strong> watershed. This program is intended to provide non-farm ruralresidents with financial and technical assistance in implementing projects such as shorelinestabilization, septic system upgrades, wetland creation, and forest management, among others.In the <strong>Innisfil</strong> <strong>Creeks</strong> subwatershed, this program is implemented in partnership with theDufferin/South <strong>Simcoe</strong> Land Stewardship Network and the South <strong>Simcoe</strong> Streams Network.The <strong>Lake</strong> <strong>Simcoe</strong> Community Stewardship Program has supported 19 shoreline naturalizationprojects in the <strong>Innisfil</strong> <strong>Creeks</strong> subwatershed thus far.The Ontario Ministry of Agriculture, Food and Rural Affairs has also partnered with Agricultureand Agri-Food Canada and the Ontario Soil and Crop Improvement Association to provide theEnvironmental Farm Program to registered farm landowners throughout the province. Thisfarmer-focused program provides funding to landowners who have successfully completed anEnvironmental Farm <strong>Plan</strong> for projects including management of riparian areas, wetlands, andwoodlands. Through this program, less than five projects that would directly improve terrestrialChapter 6: Terrestrial Natural Heritage 256
The <strong>Innisfil</strong> <strong>Creeks</strong> <strong>Subwatershed</strong> <strong>Plan</strong>natural heritage have been implemented in the Town of <strong>Innisfil</strong>, while none have beencompleted in the City of Barrie.In 2008 and 2009, LSRCA field staff surveyed the majority of the watercourses in thesesubwatersheds, documenting the range of potential stewardship projects that could beimplemented to help improve water quality and fishhabitat. This survey found over 500 additionalplaces where additional riparian planting could beintroduced to the tributaries in this subwatershed.The forthcoming shoreline management strategy,and wetland and riparian area prioritizationexercise, will identify and prioritize stewardshipopportunities in this subwatershed, specific to theshoreline and inland riparian and headwater areasrespectively.These ongoing stewardship programs will soon becomplemented by a forthcoming Voluntary ActionProgram. Initially, the <strong>Lake</strong> <strong>Simcoe</strong>Protection <strong>Plan</strong> proposed thedevelopment of a regulation to prohibitactivities that would adversely affectthe ecological health of the <strong>Lake</strong><strong>Simcoe</strong> watershed (policy 6.16).Feedback during the initial rounds ofconsultation in development of thisregulation raised concerns about itsenforceability, and the need toeducate the public on bestmanagement practices before taking aregulatory approach. As a result, theMOE reframed the ShorelineRegulation as a Shoreline VoluntaryAction Program.The Shoreline Voluntary Action Program is intendedto increase the extent of native vegetation alongshorelines, and reduce the use of phosphatecontainingfertilizer in the watershed, through acombination of surveys which are aimed atunderstanding the current range of publicknowledge, attitudes, and practices, and outreach tosummer camps, landowners, and garden centres.This voluntary action program is being run as a twoyear pilot program, with ongoing monitoring todetermine the rate of uptake, impacts on phosphorusNatural Buffer Zone restoration projectBon Secours Creeklevels, and impacts on native vegetation along the shoreline. After the pilot program iscomplete, these results will be reviewed to determine if a voluntary program is sufficient, or if aregulatory approach is necessary.Chapter 6: Terrestrial Natural Heritage 257
The <strong>Innisfil</strong> <strong>Creeks</strong> <strong>Subwatershed</strong> <strong>Plan</strong>6.4.3 Science and researchAn ongoing commitment to applied research and science is necessary to improve ourunderstanding of the extent, character, and function of the terrestrial natural heritage featuresand wildlife within the <strong>Lake</strong> <strong>Simcoe</strong> watershed. Applied science and research can includeformal scientific studies, citizen scientist-based monitoring programs, and Traditional EcologicalKnowledge.Comparatively less research is being done on terrestrial natural heritage systems, values, andfeatures than is being done on water quality or aquatic habitats, however MNR researchscientists are undertaking studies related to characterizing the natural heritage features andecological processes in the watershed. As with water quality and aquatic research, the <strong>Lake</strong><strong>Simcoe</strong> Science Committee plays a role in reviewing this research and makingrecommendations to the Minister.In addition to these specific research projects, the MNR, LSRCA and MOE are developing aterrestrial natural heritage monitoring program which will track the condition of the <strong>Lake</strong> <strong>Simcoe</strong>watershed with respect to the targets and indicators set by the <strong>Lake</strong> <strong>Simcoe</strong> Protection <strong>Plan</strong>(and described in Section 6.2). When this data becomes available, and trends become evident,it will help to revise and refine this subwatershed plan at its five year review period.Ontario, as a Province, is fortunate in that much terrestrial natural heritage monitoring isundertaken by volunteer citizen scientists, which has the potential to complement these otherstudies. Programs such as the Marsh Monitoring Program, and Breeding Bird Surveycoordinated by Bird Studies Canada provide information on long-term trends in wildlifepopulations throughout Ontario. Unfortunately, neither of these programs have establishedroutes in the <strong>Innisfil</strong> <strong>Creeks</strong> subwatershed.Chapter 6: Terrestrial Natural Heritage 258
The <strong>Innisfil</strong> <strong>Creeks</strong> <strong>Subwatershed</strong> <strong>Plan</strong>6.5 Management Gaps and RecommendationsAs can be seen in the above section, there are a number of programs in place to protect andenhance the natural heritage features in the <strong>Innisfil</strong> <strong>Creeks</strong> subwatershed. Despite this strongfoundation, there are a number of gaps and limitations in the current management frameworkthat could be improved upon in the future of subwatershed management.Listed below is an initial ‘long list’ of recommendations for improving the state of natural heritagevalues in the <strong>Innisfil</strong> <strong>Creeks</strong> subwatershed, for discussion.It is recognized that many of the undertakings in the following set of recommendations aredependent on funding from all levels of government. Should there be financial constraints, itmay affect the ability of the partners to achieve these recommendations. These constraints willbe addressed in the implementation phase.6.5.1 Official <strong>Plan</strong> conformityUnder Policy 8.4 of the <strong>Lake</strong> <strong>Simcoe</strong> Protection <strong>Plan</strong>, municipalities must amend their officialplans to ensure that they are consistent with the recommendations of this subwatershed plan,upon their five-year official plan review.Recommendation 6-1 - That the LSRCA, MOE and MNR assist subwatershedmunicipalities in ensuring official plans are consistent with the recommendationspresented in the <strong>Innisfil</strong> <strong>Creeks</strong> subwatershed plan, as approved by the LSRCA Board ofDirectors. This approval will be subsequent to consultation with municipalities, thesubwatershed plan working group, and the general public, as outlined in the Guidelinesfor developing subwatershed plans for the <strong>Lake</strong> <strong>Simcoe</strong> watershed (May, 2011).6.5.2 Revisions in Key Natural Heritage Protection PoliciesPolicy 6.50 of the LSPP requires the MNR. MOE and LSRCA to establish a monitoring programin relation to the targets and indicators established by that plan for natural heritage andhydrologic features, which includes an indicator related to ‘habitat quality’. Although there iscurrently no site level definition for “high quality” natural vegetation, when this definitionbecomes available, it has the potential to complement existing natural heritage protectionpolicies in Provincial plans and municipal official plans to ensure that the most high qualitynatural areas in the <strong>Lake</strong> <strong>Simcoe</strong> watershed are protected from incompatible development andsite alterationRecommendation 6-3 – That the MNR, MOE, and LSRCA review theterrestrial natural heritage data provided by the comprehensive monitoringprogram, when it becomes available, to define site level characteristics orindicators of ‘high quality’ natural heritage features, and provide policyrecommendations to subwatershed municipalities (as necessary) to ensurehigh quality natural heritage features are adequately protected fromdevelopment and site alteration.6.5.3 Grassland protectionGrassland habitats are an often overlooked natural heritage feature, and unprotected by naturalheritage protection policies. For example, neither the LSPP nor the Provincial Policy Statementaccounts for “grasslands” as a type of natural heritage feature. However, as outlined in sectionChapter 6: Terrestrial Natural Heritage 259
The <strong>Innisfil</strong> <strong>Creeks</strong> <strong>Subwatershed</strong> <strong>Plan</strong>6.2.6, they are disproportionately important for species of conservation concern. Nativegrasslands are recognized by the Natural Heritage Reference manual, and recommended forinclusion in natural heritage systems designated under municipal official plans as ‘rarevegetation communities’. There is one documented tallgrass prairie remnant in thissubwatershed near DeGrassi Point.However, on their own, native grasslands will likely be insufficient to protect grassland dwellingwildlife. There are only three identified native grasslands (i.e. tallgrass prairies or alvars) in the<strong>Lake</strong> <strong>Simcoe</strong> watershed, five including the two small remnants listed in the Barrie <strong>Creeks</strong>,Lovers Creek and Hewitt’s Creek <strong>Subwatershed</strong> <strong>Plan</strong>. These features are each less than 25 hain size, and together are less than 30ha in total size. Features this small will be insufficient forthe long-term persistence of grassland birds and insects. The protection of non-nativegrasslands is difficult however, as many of these are abandoned lots or vacant or non-intensiveagricultural land, and as such they are often temporary in nature.The concern in these subwatersheds related to the preservation of habitat for grasslanddependentwildlife is one that is widespread throughout the Province. Within the past year, thebobolink was listed under the Provincial Endangered Species Act as being a Threatenedspecies, triggering a protection to its habitat. Because of the conflict that creates with farmoperations however, the Provincial government has instituted a three-year exemption forfarmers while they study other options for protecting both grassland-dependent birds, and farmbusinessesRecommendation 6-4 – That the MNR, MAFRA, LSRCA, subwatershedmunicipalities, and interested members of the agricultural community reviewthe results of the studies being conducted on methods and policy tools toprotect grassland dependent wildlife on active agricultural land as theybecome available, to determine if they provide solutions for the conservationof grassland habitat which would be applicable for these subwatersheds.Recommendation 6-5 – That the City of Barrie and Town of <strong>Innisfil</strong>, with theassistance of the MNR and LSRCA, give consideration to including policies intheir respective Official <strong>Plan</strong>s to contribute to the protection of grasslandhabitats, as necessary, based on the results of Recommendation #6-6, andrecognize the need for balance in the approach to development in urbanareas.6.5.4 Infrastructure as a Key Natural Heritage Feature gapInfrastructure projects, including roads, sewers, and municipal drains, aren’t subject to the<strong>Plan</strong>ning Act, and as such are exempt from natural heritage protection policies developed undermunicipal Official <strong>Plan</strong>s, and are also exempt from natural heritage protection policies under the<strong>Lake</strong> <strong>Simcoe</strong> Protection <strong>Plan</strong>. Protection for natural heritage features with respect toinfrastructure projects is provided through the Environmental Assessment process.Recommendation 6-6 – That reviewers of Environmental Assessments formunicipal infrastructure in the <strong>Lake</strong> <strong>Simcoe</strong> watershed, includingsubwatershed municipalities, and LSRCA and MOE (when reviewing suchdocuments), give due consideration to the preservation of barrier-freeconnectivity for wildlife between nearby wetland and upland habitats. Thisshould include due consideration of alternate route configuration, the use ofChapter 6: Terrestrial Natural Heritage 260
The <strong>Innisfil</strong> <strong>Creeks</strong> <strong>Subwatershed</strong> <strong>Plan</strong>wildlife crossing structures, and/or the use of traffic calming measures incritical locations.Recommendation 6-7 – That subwatershed municipalities and the MOEensure that all Environmental Assessments for municipal infrastructure in the<strong>Lake</strong> <strong>Simcoe</strong> watershed give due consideration to the preservation of barrierfreeconnectivity for wildlife between nearby wetland and upland habitats. Thisshould include due consideration of alternate route configuration, the use ofwildlife crossing structures, and/or the use of traffic calming measures incritical locations.6.5.5 Land securement by public agenciesThe protection of a system of natural heritage features by public bodies plays an important rolein ensuring the protection of significant and highly vulnerable sites, and in providing naturalareas for public use and enjoyment. The provision of publicly-owned natural areas is perhapsparticularly important in municipalities with high population densities.Recommendation 6-8 – That the LSRCA and subwatershed municipalitiesshould continue to secure outstanding natural areas for environmentalprotection and public benefit, through tools such as land acquisition orconservation easements, and should support the work of Land Trusts doingsimilar work.Recommendation 6-9 – That the LSRCA and subwatershed municipalitiesshould continue to refine their land securement decision processes to ensurethat they are securing natural areas that are critical to the health of thewatershed (or securing and restoring areas which have the potential tobecome critical to the health of the watershed), but which are otherwisevulnerable to loss through incompatible land uses.Recommendation 6-10 – That the Federal, Provincial, and Municipalgovernments provide consistent and sustainable funding to supportsecurement of outstanding natural areas.6.5.6 Stewardship implementation – increasing uptakeIn addition to protecting existing natural heritage features, programs which support thestewardship, restoration, or enhancement of private lands will be critical to meet the targets andobjectives of the <strong>Lake</strong> <strong>Simcoe</strong> Protection <strong>Plan</strong>. To that end, programs are provided throughpartnerships with the Ministry of Natural Resources, Ministry of the Environment, Ministry ofAgriculture, Food and Rural Affairs, Ontario Federation of Agriculture, Ontario Soil and CropImprovement Association, <strong>Lake</strong> <strong>Simcoe</strong> <strong>Region</strong> Conservation Authority, South <strong>Simcoe</strong> StreamsNetwork and watershed municipalities. Despite this range of players, the uptake of profferedstewardship programs is limited by the number of private landowners who voluntarily participate.Recommendation 6-11 – That the MNR, MOE, MAFRA, and LSRCA continue toimplement stewardship projects in these subwatersheds, and encourage other interestedorganizations to do the same.Recommendation 6-12 – That governmental and non-governmental organizationscontinue to improve coordination of programs to: (1) avoid inefficiencies andunnecessary competition for projects, and: (2) make it easier for landowners to knowChapter 6: Terrestrial Natural Heritage 261
The <strong>Innisfil</strong> <strong>Creeks</strong> <strong>Subwatershed</strong> <strong>Plan</strong>which organization they should be contacting for a potential project, using tools such asa simple web portal.Recommendation 6-13 – That the Federal, Provincial, and Municipal governmentsprovide consistent and sustainable funding to ensure continued delivery of stewardshipprograms.Recommendation 6-14 – That the MOE, MNR, LSRCA, and other members of the <strong>Lake</strong><strong>Simcoe</strong> Stewardship Network be encouraged to document completed stewardshipprojects in a common tracking system to allow efficient tracking, coordinating, andreporting of stewardship work accomplished.Recommendation 6-15 – That the MOE, MNR, MAFRA, LSRCA, and other interestedmembers of the <strong>Lake</strong> <strong>Simcoe</strong> Stewardship Network support research to determinebarriers limiting uptake of stewardship programs in these subwatersheds and sharethese results with other members of the <strong>Lake</strong> <strong>Simcoe</strong> Stewardship Network, to enableagencies and stakeholders to modify their stewardship programming as relevant. Thisresearch should include a review of successful projects to determine what aspects led totheir success, and how these may be emulated.Recommendation 6-16 – That the MOE, MNR, MAFRA, and LSRCA continue toinvestigate new and innovative ways of reaching target audiences in the local communityand engage them in restoration programs and activities (e.g. high school environmentalclubs, through Facebook groups, hosting a <strong>Lake</strong> <strong>Simcoe</strong> Environment Conference forhigh schools/science community interaction). The results of these efforts should beshared with the <strong>Lake</strong> <strong>Simcoe</strong> Stewardship Network.6.5.7 Stewardship implementation – prioritize projectsStewardship programs play an important role in meeting the goals and objectives of thesubwatershed plans. However, in order to ensure that they are both effective and efficient,stewardship projects should be selected in the context of the priority needs of the <strong>Lake</strong> <strong>Simcoe</strong>watershed, and its subwatersheds. An analysis of natural heritage and hydrological priorities,and an assessment of barriers to uptake as listed above, would allow improved targeting ofprograms to areas of relatively high need.Recommendation 6-17 – That the MNR, with the assistance of the MOE andLSRCA, develop a spatially-explicit decision support tool to assist in targetingterrestrial stewardship projects in the <strong>Lake</strong> <strong>Simcoe</strong> watershed. In the contextof the Barrie <strong>Creeks</strong>, Lovers Creek, and Hewitt’s Creek subwatershed, thisdecision tool should take into account factors including:• the need to increase natural vegetation cover along the <strong>Lake</strong> <strong>Simcoe</strong>shoreline• protecting and restoring ecologically significant groundwater rechargeareas, to help mitigate the expected impacts of climate change• opportunities to restore lost wetlands, particularly in the east half of thesubwatershed, where the topography has minimal slope, and the areais underlain by fine-grained, poorly-drained soilsChapter 6: Terrestrial Natural Heritage 262
The <strong>Innisfil</strong> <strong>Creeks</strong> <strong>Subwatershed</strong> <strong>Plan</strong>• opportunities to increase connectivity across the subwatersheds fordispersing flora and fauna• the potential for non-forested valleylands, particularly in agriculturalareas, as features which could improve wildlife connectivity• the need to protect and restore grassland habitat, particularly rarenative grasslandsRecommendation 6-18 – That the members of the <strong>Lake</strong> <strong>Simcoe</strong> StewardshipNetwork be encouraged to build into their projects relevant provisions for theanticipated impacts of climate change, such as the need to recommendspecies which are suitable for future climate conditions, and the possibility ofan increase in invasive plants, pests, and diseases which may further limit thesuccess of traditional stewardship approaches.6.5.8 Dealing with indirect impactsDespite the gaps in existing natural heritage protection policies as noted above, 79% of currentnatural heritage features in the <strong>Innisfil</strong> <strong>Creeks</strong> subwatershed have some level of protection fromdevelopment or site alteration. As such, the greatest impacts to natural heritage values in thissubwatershed in coming years may be indirect, rather than direct, in nature. Forests in urbanareas are typically under more stress from invasive species, feral cats, unmanaged recreation,and indirect impacts associated with nearby roads.Recommendation 6-19 – That the LSRCA, County of <strong>Simcoe</strong>, City of Barrie,and Town of <strong>Innisfil</strong> conduct natural heritage inventories, and develop andimplement management plans for publicly accessible natural areas that theyown, to mitigate potential threats related to invasive species and increasedrecreation pressure.Recommendation 6-20 – That the MOE and its partners provide outreach togarden centres, landscapers, and garden clubs regarding the danger of usinginvasive species in ornamental gardens.Recommendation 6-21 – That the City of Barrie, the Town of <strong>Innisfil</strong> and theCounty of <strong>Simcoe</strong>, with support from LSRCA, make information available toresidents on the impact of human activities on natural areas. Priority issuesinclude the dangers of invasive species, the importance of keeping pets undercontrol, and the importance of staying on trails while in natural areas.6.5.9 Filling data gapsOur understanding of the status and pressures related to terrestrial natural heritage featuresand processes in the <strong>Lake</strong> <strong>Simcoe</strong> watershed is relatively limited. Policy 6.50 of the LSPPrequires the MNR, LSRCA and MOE to develop a monitoring program for natural heritagefeatures and values in the <strong>Lake</strong> <strong>Simcoe</strong> watershed which should contribute significantly toaddressing this data gap. This monitoring program could be complemented by the followingrecommendations to more fully fill data gaps.Recommendation 6-22 – That the MNR, with the assistance of LSRCA and MOE,complement the proposed monitoring strategy with standardized surveys of theChapter 6: Terrestrial Natural Heritage 263
The <strong>Innisfil</strong> <strong>Creeks</strong> <strong>Subwatershed</strong> <strong>Plan</strong>distribution and abundance of terrestrial species at risk throughout the <strong>Lake</strong> <strong>Simcoe</strong>watershed.Recommendation 6-23 – That the MNR, LSRCA, and MAFRA continue to maintain anup-to-date seamless land cover map for the watershed, as defined by the LSPP, withnatural heritage features classified using Ecological Land Classification, managed insuch a way as to allow change analysis.Recommendation 6-24 – That the MNR and LSRCA take advantage of data that isalready available, by developing a biodiversity database that can collate informationreported in EIS and EA reports, information reported in natural area inventories, plotbaseddata collected in the watershed-wide Vegetation Survey Protocol that isunderway, plot-based data collected by citizen-scientists for the Breeding Bird Atlas, andother data as may be available.Recommendation 6-25 – That the MNR, with the assistance of the LSRCA, takeadvantage of this soon-to-be compiled data, and develop lists of watershed-rare taxa,and policies to support their protection.6.5.10 Improving data managementThe forthcoming monitoring program identified by the LSPP has the potential to exponentiallyincrease the amount of data on the extent and condition of natural heritage values and featuresin the <strong>Lake</strong> <strong>Simcoe</strong> watershed. However, the number of government agencies contributing to,and utilizing, this database will make data management a significant challenge.Recommendation 6-26 – That the MNR, LSRCA, and MOE develop a framework toallow effective and efficient management and sharing of data before implementing thecomprehensive monitoring program. This framework may include the designation of oneagency as the curator of all monitoring data collected in the <strong>Lake</strong> <strong>Simcoe</strong> watershed.6.5.11 Terrestrial Natural Heritage Research NeedsThe <strong>Lake</strong> <strong>Simcoe</strong> watershed, including the <strong>Innisfil</strong> <strong>Creeks</strong> subwatershed, is one of the mostrapidly urbanizing watersheds in Ontario. Although there is a substantial suite of policies inplace to protect existing natural heritage features from development and site alteration, theeffects on those features resulting from intensified development in the surrounding landscape isless well understood.Recommendation 6-27 – That the <strong>Lake</strong> <strong>Simcoe</strong> Science Committee, otherlevels of government, and academia support research to better understand thestresses to wildlife and wildlife habitat associated with urban development, toallow management responses to be refined. Important questions of interestinclude: the use of stormwater ponds as amphibian breeding habitat, theimportance of remnant natural areas to quality of life for local residents, theindirect impacts of roads on resident and migratory wildlife, and the impacts ofhigh density and low density development on wildlife communities in naturalareas. This research may include literature reviews, analysis of data availablethrough the monitoring program, or original, innovative, peer-reviewedresearch.Chapter 6: Terrestrial Natural Heritage 264
The <strong>Innisfil</strong> <strong>Creeks</strong> <strong>Subwatershed</strong> <strong>Plan</strong>7 Integration and Implementation7.1 IntroductionThis subwatershed plan has been developed with technical chapters arranged thematically, toallow us to examine each theme in detail, and to allow this document to address the specificissues identified in <strong>Lake</strong> <strong>Simcoe</strong> Protection <strong>Plan</strong>. This integration chapter, however, is intendedto highlight the interactions between water quantity, water quality, terrestrial ecosystems, andaquatic ecosystems, and to describe some of the natural processes supporting biodiversity andwatershed health in the <strong>Innisfil</strong> <strong>Creeks</strong> subwatersheds. An understanding of how these factorsinteract is important to gain a full understanding of the watershed ecosystem, and to designconservation programs which are both effective and cost-efficient. To help build thisunderstanding, this chapter examines how some of the key points highlighted in Chapters 3 to 6interact, through the use of conceptual diagrams. Conceptual diagrams are useful tools whichcan synthesize complex, detailed information, in a form that is attractive and informative.Conceptual diagrams are ‘thought drawings’ that provide representations of ecosystems orwatersheds, and highlight key attributes and interactions, in a form that is readilyunderstandable by a wide range of audiences (Longstaff et al., 2010).7.2 Groundwater interactions - land cover, groundwater, and aquatic habitatsThe amount of precipitation that infiltrates through the soil to contribute to groundwater dependson the permeability of the soil. Groundwater recharge is most significant in areas with coarsehighly permeable soils such as sandy or gravelly sites on heights of land, and is often found inthe headwaters of watersheds. In the case of the <strong>Innisfil</strong> <strong>Creeks</strong> subwatershed, the height ofland along its western boundary, as well as the south shore of Kempenfelt Bay, providessignificant groundwater recharge (Figure 4-12). When these types of areas are forested, theamount of rainfall that infiltrates into groundwater tends to be greater. Forests promoteinfiltration by intercepting the rain and reducing the force at which it strikes the soil, and byincreasing soil porosity through the actions of root growth and decomposition, and the actions ofsmall mammals and other burrowing wildlife.The trend in groundwater flow in these subwatersheds parallels that of surface water; fromrecharge areas in the headwaters, to outflow in Cook’s Bay or along the lake shore just north ofCook’s Bay. Much of this groundwater flows in either a lower aquifer (a 10-40 m thick layer ofcoarse sand and gravel deposited in a pre-glacial river channel), an upper aquifer (composed offine to medium grained sand and gravel near the ground surface, deposited along the shores ofglacial <strong>Lake</strong> Algonquin), or an intermediate aquifer (a 10-30 m deep lens of sandy soilsgenerally lying between the other two, and extending out into Kempenfelt Bay).This groundwater can be discharged to the surface and become available for use in aquatic orwetland ecosystems, through the process of groundwater discharge. This discharge happens inareas with similarly coarse soil, but where the ground surface lies below the water table, often indepressional areas or in ravines, and can take the form of groundwater seepage or springs. Inthe <strong>Innisfil</strong> <strong>Creeks</strong> subwatershed, many of the river valleys are associated with groundwaterdischarge from the upper and intermediate aquifers. In such cases, the groundwater dischargemakes an important contribution to creek ecosystems, and to riparian wetlands. In fact, many ofthe wetlands remaining in the <strong>Innisfil</strong> <strong>Creeks</strong> subwatershed, including the Provincially SignificantHolland Marsh wetland complex and Wilson Creek Marsh, are fed by this groundwaterChapter 7: Integration and Implementation 265
The <strong>Innisfil</strong> <strong>Creeks</strong> <strong>Subwatershed</strong> <strong>Plan</strong>discharge (Figures 4-11 and Figure 6-5). The deep aquifer discharges in Kempenfelt Bay, and(historically) along the lakeshore as well.This groundwater recharge – discharge relationship can happen over relatively large distances,and is easily overlooked as it happens below ground. While there are only few coldwaterstream reaches in the subwatershed, this relationship is a significant link between upland andaquatic features in watersheds, and preserving this relationship is critical to preserving thefunctioning of surface water features such as watercourses and wetlands.For some watercourses, particularly small ones, groundwater discharge can be the maincontributor to flow during times of limited rainfall. In such cases, the addition of thisgroundwater obviously plays a role in protecting fish habitat, but even in larger systems, thetypically cold discharged groundwater can decrease the temperature of the creek, in somecases maintaining it below the critical temperature needed for healthy reproduction of sensitivespecies such as brook trout and mottled sculpin. When temperatures exceed their criticalmaximums, it causes physiological stress on these species, and make may them moresusceptible to being outcompeted by species such as suckers, minnows, and brown trout. Evenwhen groundwater discharge is not able to decrease the overall water temperature of the creekbelow that threshold, it may create small ‘refugia’ habitats in the discharge zone, providingsensitive species a small area of cold water where they can take refuge in during the hottestdays of the year. This refugia habitat may explain the continued persistence of mottled sculpinin sections of White Birch Creek where water temperature appears to be too high to meet theirhabitat requirements (Figure 5-2). With brook trout particularly, groundwater discharge isthought to be a critical habitat factor. Brook trout will only spawn in areas where they can laytheir eggs on gravelly substrate that is continually flushed by groundwater. As such, thepreservation of groundwater recharge and discharge, even at relatively large distances fromcreeks, is critical to preserving breeding populations of brook trout.In areas that have been built up, this groundwater relationship can be interrupted, as morewater tends to flow over the surface and less through the ground. This is less of an issue in the<strong>Innisfil</strong> <strong>Creeks</strong> subwatershed, as much of the development in this subwatershed has avoidedareas of significant groundwater recharge or discharge (Figure 2-3, Figure 4-11, Figure 4-12)One important measure to ensure the continued protection of this hydrological-ecologicalrelationship is with the identification and protection of Ecologically Significant GroundwaterRecharge Areas, which are those areas of groundwater recharge that support the flow ofgroundwater to ecologically sensitive features such as wetlands and creeks providing habitat forcold water fish species. Once identified, the <strong>Lake</strong> <strong>Simcoe</strong> Protection <strong>Plan</strong> directs municipalitiesto develop policies in their Official <strong>Plan</strong>s to protect, improve, or restore these features. TheseESGRAs are currently being developed for the <strong>Innisfil</strong> <strong>Creeks</strong> subwatershed, based onmethodologies used in the Barrie <strong>Creeks</strong> subwatershed.Chapter 7: Integration and Implementation 266
The <strong>Innisfil</strong> <strong>Creeks</strong> <strong>Subwatershed</strong> <strong>Plan</strong>7.3 Agricultural interactions - land use, streams, and aquatic wildlifeWhen rain falls and flows over exposed soils on agricultural land, it can cause more erosionthan in natural areas due to the lack of vegetation, and to picking up contaminants not presentin natural areas. Soil particles eroded by stormwater in agricultural areas often havephosphorus adsorbed to them, particularly if the storm event happens relatively soon after asurface application of fertilizer. As such, agricultural stormwater can contribute both thesediment loads and phosphorus loads in receiving water bodies. In fact historically, theconversion of much of the <strong>Lake</strong> <strong>Simcoe</strong> watershed to agricultural land in the mid 1800s causeda spike in phosphorus loadings to the lake (Wilson and Ryan, 1988). Agriculture remains asignificant contributor of phosphorus to <strong>Lake</strong> <strong>Simcoe</strong>, including from the <strong>Innisfil</strong> <strong>Creeks</strong>subwatershed (Louis Berger Group, Inc., 2010). Other contaminants, such as nitrates andmetals can also be washed off of agricultural lands and into nearby watercourses.The addition of contaminant-laden sediment to watercourses can have significant deleteriousimpacts to aquatic ecosystems. The addition of suspended sediment to watercourses increasesthe amount of sunlight that is absorbed by the water, and thus can increase water temperature.At high levels, it can also clog or abrade fish gills, impeding their ability to breathe, or cloud thewater, reducing the hunting efficiency of visual predators. As the sediment settles out of thewater column, it can blanket the substrate, covering important spawning habitat for species suchas brook trout, mottled sculpin, white sucker, and others. The addition of the phosphorusadsorbed to sediment contributes to the eutrophication cycle, which is of great concern in the<strong>Lake</strong> <strong>Simcoe</strong> watershed. Phosphorus acts as a fertilizer in aquatic ecosystems, causingincreased growth of aquatic plants, and most significantly in streams, algae. As the algaedecompose, bacteria involved in the decomposition process take dissolved oxygen from thewater column. At high levels of algae, this respiration can cause critical declines in the amountof dissolved oxygen in watercourses, making them less suitable as habitat for fish and otheraquatic organisms. As an example, phosphorus loading in White Birch Creek could explain whyaquatic communities are degraded in its headwaters (Figures 5-3 and 5-6), where agriculture isthe predominant land use, and groundwater discharge is limited.An issue which is specific to the management of agricultural watersheds are agricultural drains.These drains include both open ditches and tile drains which typically are installed in areas withpoor natural drainage, to improve agricultural productivity. Ditches, or open drains, are typicallystraightened to quickly remove water from the area and have limited riparian vegetation. Toensure they continue work properly, they require maintenance that can lead to the alteration orremoval of remaining vegetation, and disruption and change to the substrate. In addition, theirintended function of rapidly draining wet soil has the unintended consequences of changing therate and timing of peak flows, and increasing the rate at which phosphorus and sediment travelfrom agricultural fields to <strong>Lake</strong> <strong>Simcoe</strong>. In cases where these drains bisect wetlands, they cancause the water table to drop, decreasing the extent and hydroperiod of ephemeral wetlandpools, which can lead to a loss of breeding habitat for frogs and salamanders, and migratoryhabitat for waterfowl (Figure 7-1)Another issue particular to agricultural lands is the degradation of water quality and riparianareas where livestock have access to watercourses. The input of urine and manure directly intothe water and onto low lying nearby fields, where it can be washed into the watercourse, affectswater quality. The livestock can also trample streambanks, which contributes to instability anderosion, and sedimentation in the stream; while livestock in the stream can destroy spawninghabitat (Figure 7-1).In addition to these issues from various farm practices, sewage from the majority of residencesin rural areas is treated by private septic systems. As they age, these systems can malfunctionChapter 7: Integration and Implementation 267
The <strong>Innisfil</strong> <strong>Creeks</strong> <strong>Subwatershed</strong> <strong>Plan</strong>and fail, and can be a considerable source of nutrient and bacteria contamination to surface andgroundwater (Figure 7-1).A combination of all of these factors help to explain why the majority of fish communities arepoor in the headwaters of many of the creeks, particularly in the southern portion of thesubwatershed where creeks are lacking in fish, and only provide habitat for aquatic insectswhich are tolerant of organic pollution (Figure 5-3, Figure 5-6).Figure 7-1: Influences of agricultural land use on subwatershed health.The release of sediment and phosphorus from farm fields can be reduced with the use of covercrops, through minimizing fertilizer application, by fencing streams to prevent livestock access,by providing access to alternate sources of water for livestock, and with the preservation ofremnant wetlands and forests. The release of phosphorus and other contaminants from barnyards can be reduced through the proper storage and spreading of manure, and the properstorage and disposal of milkhouse waste. The impacts associated with agricultural drains canbe minimized by reducing the frequency of maintenance or by designing them to mimic naturalchannels. Perhaps the most important and cost effective tool in agricultural landscapes thoughis the establishment and preservation of riparian buffers along watercourses (Figure 7-2).Riparian buffers act as an important last line of defence between farm fields and watercourses,slowing the velocity of stormwater, allowing sediment to be deposited within the buffer ratherthan in the creek, taking up phosphorus and nitrogen by the plants growing in the buffer, andbinding the soil on the banks of the river, slowing the rate of erosion caused by stormwaterChapter 7: Integration and Implementation 268
The <strong>Innisfil</strong> <strong>Creeks</strong> <strong>Subwatershed</strong> <strong>Plan</strong>runoff. Unfortunately, in cases like the headwaters for many of the creeks within thissubwatershed, such as White Birch and Belle Aire <strong>Creeks</strong>, where riparian buffers are lacking(Figure 6-9), agricultural impacts on watercourses can be most significant, and are associatedwith a shift in tributary fish communities.Figure 7-2: An agricultural landscape with appropriate best practices implemented to protectsubwatershed health.A number of stewardship programs have been provided by various government agencies, withthe intent of engaging private landowners in undertaking these types of stewardship projects,through increasing awareness of the importance of these actions, and by providing technicaland financial assistance to help these voluntary actions. Through such programs, the <strong>Lake</strong><strong>Simcoe</strong> <strong>Region</strong> Conservation Authority, Ontario Soil and Crop Improvement Association, andtheir partners have implemented extensive projects in the agricultural areas of the <strong>Innisfil</strong><strong>Creeks</strong> subwatershed, primarily related to stream bank fencing, establishment of riparianbuffers, and repairs to failing septic systems (Figure 7-3).Despite this effort, many more opportunities to increase the amount of stream bank vegetation,reduce barnyard runoff, and restrict livestock access still remain in this subwatershed, and thereare many more septic systems which could contribute phosphorus to groundwater as they age,which will require repairs or upgrades (Figure 7-3, Figure 7-4).Chapter 7: Integration and Implementation 269
The <strong>Innisfil</strong> <strong>Creeks</strong> <strong>Subwatershed</strong> <strong>Plan</strong>Figure 7-3: Approximate number of stewardship projects completed and stewardshipopportunities in the <strong>Innisfil</strong> <strong>Creeks</strong> subwatershed. Graph includes projects done bothin agricultural and urban settingsChapter 7: Integration and Implementation 270
RIDGE RD WKempenfelt Bay<strong>Lake</strong><strong>Simcoe</strong>Best Management Practicesproject opportunities in the<strong>Innisfil</strong> <strong>Creeks</strong> subwatershedFigure 7-4B A R R I EBIG BAY PT RDLegendRoadMunicipal BoundarySIDERD 25WatercourseLOCKHART RDBMP Opportunities400 HWY NRD10TH LINEBMP Watercourse SurveyedYONGE STSIDERD 109TH LINEINNISFIL BEACH RD7TH LINE6TH LINEMETRO RD NBASELINE RDWARDEN AVEWOODBINE AVESIDERD 105TH LINESIDERD 5HWY 400 S4TH LINE3RD LINEG E O R G I N APOLLOCK RDI N N I S F I L2ND LINECOUNTY RD 8914TH LINELINE 13Cook'sBayGLENWOODS AVERAVENSHOE RD0 0.5 1 2 3 4 5KilometresKThis product was produced by the <strong>Lake</strong> <strong>Simcoe</strong> <strong>Region</strong> Conservation Authority andsome information depicted on this map may have been compiled from various sources.While every effort has been made to accurately depict the information,data / mapping errors may exist.This map has been produced for illustrative purposes only.LSRCA GIS Services DRAFT created July 2010.© LAKE SIMCOE REGION CONSERVATION AUTHORITY, 2010. All Rights ReservedThe following datasets roads, municipal boundaries and Oak Ridges Moraine are© Queens Printer for Ontario, 2010. Reproduced with Permission
The <strong>Innisfil</strong> <strong>Creeks</strong> <strong>Subwatershed</strong> <strong>Plan</strong>7.4 Urban interactions - land use, streams, and aquatic wildlifeWhen stormwater flows over urban areas, it is susceptible to picking up even morecontaminants than in other types of land use. <strong>Innisfil</strong> <strong>Creeks</strong> is currently the sixth largestcontributor of phosphorus per-hectare to the <strong>Lake</strong> <strong>Simcoe</strong> ecosystem (Figure 3-5). As asubwatershed which is expecting significant growth and development, particularly in theheadwaters of Sandy Cove Creek, which have recently been annexed by the City of Barrie,many of the stresses associated with urban land use may become more extensive, including aprojected increase in loading of phosphorus and chloride in watercourses, and an increase inwater temperature. In the near future, when most of this development is expected to occur,these impacts may be more pronounced. Development sites are often stripped of vegetationwell in advance of development in an effort to reduce costs as the development is built inphases. These bare soils are then subject to erosion by both wind and water.As in agricultural landscapes, the contribution of sediment and phosphorus can have deleteriousimpacts on species living in nearby streams by increasing water temperatures, decreasinglevels of dissolved oxygen, and disturbing spawning sites. Other contaminants that occur instormwater runoff from the urban parts of this subwatershed however include phenolics, metals,and organic compounds (Figure 7-5). At high levels, these contaminants can interfere withenzyme activity in aquatic organisms, leading to changes in behaviour, movement, predatoravoidance, feeding rates, reproduction, reduced growth rates or even death.Complicating matters further is our management of snow. Where, historically, snow wouldaccumulate in the forest, to melt and form a spring freshet, providing flooded areas along thebanks of rivers which act as spawning sites for species such as northern pike, it is now diligentlycleared from city streets, parking lots and sidewalks, and often relocated to designated disposalsites to improve mobility and decrease risk of injury or car accidents. In many cases, salt is alsoapplied to roads and parking lots to decrease the temperature at which ice freezes. The result ofthis snow removal however is a significant change to the timing, location, and chemicalcomposition of the spring freshet (Figure 7-5). Increasing concentrations of chloride inwatercourses can decrease feeding and growth rates in fish, and in extreme cases, can lead tomortality in fish and other aquatic organisms.Additionally, as stormwater flows over urban areas, it tends to reach creeks more quickly than itwould when flowing over natural areas. As a result, streams can exhibit both a decrease inbaseflow levels, and an increase in flow rate and volume during high flow events. The level ofurban area in the subwatershed is currently low, and mostly concentrated in the Alcona area;however, there is a significant amount of urban growth slated for the subwatershed, which couldlead to these issues being seen in the subwatershed if measures to prevent them are notundertaken. Decreasing baseflows and flashy storm flows can make aquatic environments lesssuitable as habitat for resident fish, due to a loss of habitat during low flow periods, and anincrease in the energy necessary to manoeuvre through the creek during high flow events. Thisincreased velocity can also increase the rate of erosion of exposed soil or streambanks,increasing the amount of sediment that gets deposited in the creek. The flow of stormwater overhardened urban surfaces such as roads, parking lots, and asphalt shingles also tends toincrease its temperature. As such, urban stormwater can increase the thermal regime of urbancreeks, making them unsuitable habitat for cold water species like brook trout (Figure 7-5).As in agricultural landscapes, the preservation of native vegetation along watercourses plays animportant role in slowing the velocity of stormwater, collecting sediment, capturing phosphorusand nitrogen, and binding the soil on the banks of the river (Figure 7-6). The preservation ofnative vegetation along roadsides also plays an important role in protecting the health of urbanChapter 7: Integration and Implementation 272
The <strong>Innisfil</strong> <strong>Creeks</strong> <strong>Subwatershed</strong> <strong>Plan</strong>watersheds as well, as windbreaks of this sort help reduce the accumulation of blowing snow onhighways, thus reducing the need to apply sand or salt to roads (Figure 7-6).Other methods of reducing salt application on roads including carefully calibrating theapplication of salt to the temperature of the road, ensuring that snow disposal sites drain intostormwater management ponds, or to use treatment measures other than chloride in areas thatare particularly sensitive to contamination.One of the standard ways of addressing the concerns associated with urban stormwater runoffis with the use of stormwater ponds. Stormwater ponds are designed to trap sediments, toimprove the quality of water which is ultimately released back into the watershed. Withoutproper maintenance however, stormwater ponds can operate well below their designedefficiency, and contain sediments which are high in concentrations of phosphorus, chloride,heavy metals, and petrochemicals. In extreme cases, during high flow events, someunmaintained stormwater ponds can actually act as a source of contaminants to nearbywatercourses. As well, the large surface area of stormwater ponds tends to increase watertemperature. As such, stormwater ponds have the potential to negatively impact the thermalregime of nearby watercourses, decreasing habitat values for sensitive fish species (Figure 7-5).Poorly maintained stormwater ponds can also be detrimental to bird and amphibian populations,who often utilize them as breeding habitat as wetlands are lost from urbanizing landscapes.However, if the stormwater ponds are hypoxic, surrounded by unsuitable habitat or roads, orhave high concentrations of other contaminants, they can cause reductions in reproductionrates and overall survival for these species. A survey completed in 2010 found that the majorityof the stormwater ponds in the <strong>Innisfil</strong> <strong>Creeks</strong> subwatershed were operating below theirdesigned efficiency, capturing less phosphorous and sediment from stormwater than intended(Figure 3-8).Figure 7-5: Influences of urban land use on subwatershed health.Chapter 7: Integration and Implementation 273
The <strong>Innisfil</strong> <strong>Creeks</strong> <strong>Subwatershed</strong> <strong>Plan</strong>The best way to manage stormwater runoff in urban areas is to reduce the volume of run-offthrough the use of Low Impact Development. Low Impact Development (LID) is a term thatrefers to a suite of innovative design solutions that can be incorporated into new developments,to increase the amount of stormwater than infiltrates into the ground, and decrease the amountthat flows over land. Tools in the LID toolbox include green roofs, infiltration swales, permeablepavement, and a greater focus on retaining urban forest cover. Other, secondary treatmentsinclude proper site control during construction, ongoing maintenance of stormwater ponds, theupgrade of stormwater ponds built with earlier technology, and the establishment andpreservation of riparian buffers (Figure 7-6). Despite the challenges to watershed healthassociated with projected development in this subwatershed, that development also provides asignificant opportunity to implement innovative low impact development techniques, as well asto use innovative design of stormwater management ponds.A number of urban stewardship projects have already been implemented in thesesubwatersheds, on both private and municipal lands, including an increase in the extent ofnative vegetation along urban watercourses and upgrades to outdated stormwater managementponds (Figure 7-3). Like the agricultural areas in these subwatersheds though, many moreopportunities still exist to increase the extent of riparian buffers and upgrade stormwater ponds(Figure 7-3, Figure 7-4, Figure 3-10).Figure 7-6: An urban landscape with appropriate best management practices implemented toprotect subwatershed health.Chapter 7: Integration and Implementation 274
The <strong>Innisfil</strong> <strong>Creeks</strong> <strong>Subwatershed</strong> <strong>Plan</strong>7.5 In-stream interactions - activities in and near creeks, water quality, andaquatic wildlifeIn addition to actions happening across the watershed as whole, actions in or near creeks canhave even more direct impacts to hydrologic and ecologic systems. The preservation of riparianbuffers along the edges of watercourses or the lake make important contributions to aquaticwildlife, as the plant debris that is dropped into the water body provides an important foodsource for aquatic invertebrates, which form the base of aquatic food webs, and the shade itprovides is important for maintaining cooler water temperature in mid-summer, which is aparticularly important factor in providing habitat for species such as brook trout or mottledsculpin. Riparian vegetation also makes an important contribution to terrestrial wildlife as well,acting as a productive source of food for many species, and acting as a migration corridorthrough landscapes that are often otherwise lacking in native vegetation. When this vegetationis cleared, these benefits are lost.These impacts can be exacerbated however, when the removal of vegetation is accompaniedby other more extreme interventions such as bank hardening, stream channelization, orconverting free-flowing streams to underground pipes (Figure 7-7), activities which have beenwidespread in the <strong>Innisfil</strong> <strong>Creeks</strong> subwatershed (Figure 5-11). These types of interventionsremove habitat for aquatic species, and increase the velocity of water, causing an increase inerosion downstream of the hardened or enclosed site, or in areas where the hardening beginsto fail, which in turn increases sedimentation and phosphorus inputs. In the case of agriculturaldrains, periodic maintenance intended to promote efficient draining prohibits the establishmentof trees along one (or both) sides of the drain, and causes disturbance to fish habitat whilemaintenance is occurring.These impacts can also be exacerbated in ponds or reservoirs created by barriers on creeks.Ponds behind barriers increase the amount of area exposed to the sun, and as such increasewater temperature, causing potential for further increases in growth of aquatic plants and algae,as well as bacteria, and a decrease in oxygen levels when the plants and algae decompose.Barriers erected on creeks also fragment fish habitat, impeding the seasonal travel of migrantspawners such as white sucker, and impeding the ability of other species to disperse throughthe drainage network (Figure 7-7). Over time, barriers can lead to a loss in fish biodiversity, asisolated stream reaches become more vulnerable to local extinctions.Chapter 7: Integration and Implementation 275
The <strong>Innisfil</strong> <strong>Creeks</strong> <strong>Subwatershed</strong> <strong>Plan</strong>Figure 7-7: Influences of riparian land use on subwatershed health.Creek-based stewardship activities beyond the establishment of additional riparian vegetationcan be difficult however, as projects related to channel restoration can be extremely expensive,and options to establish a naturally meandering channel can be extremely constrained in heavilysettled areas. Despite that, the Town of <strong>Innisfil</strong> and <strong>Lake</strong> <strong>Simcoe</strong> <strong>Region</strong> Conservation Authorityhave been able to ‘daylight’ a number of streams in Gilford, replacing corrugated steel culvertswith vegetated open channels. Many more opportunities to remove barriers from creeks, ornaturalize creeks which have been channelized, remain in this subwatershed (Figure 7-3, Figure7-4).Chapter 7: Integration and Implementation 276
The <strong>Innisfil</strong> <strong>Creeks</strong> <strong>Subwatershed</strong> <strong>Plan</strong>Figure 7-8: Riparian area with appropriate best management practices implemented to protectsubwatershed health.7.6 Shoreline interactions - activities in and near the lakeshore, water quality,and aquatic wildlifeOf particular importance to this subwatershed is the role played by the <strong>Lake</strong> <strong>Simcoe</strong> shoreline.In the <strong>Innisfil</strong> <strong>Creeks</strong> subwatershed there are, generally speaking, two types of waterfrontsettings. The first is a relatively urban one, close to amenities, with increased amounts ofimpervious surfaces, hardened banks, and increased traffic to and from marinas (Figure 7-9).The second is a more rural one, where cottages or permanent residences border the lakefront.While there is less pedestrian and vehicle traffic in this area, there are still instances of bankhardening, and concrete or solid docks (Figure 7-10). In both cases, much of the nativevegetation has been removed, and what is left is often mowed right to the water’s edge. Septicsystems, which support many of the older cottages and houses along the shore, can also be asource of phosphorus to the lake, if not properly maintained.The loss of this shoreline vegetation has negative impacts on nearshore aquatic communities,through an increase in water temperature and sediment input, and a decrease in input of woodydebris (which is an important component of habitat for many aquatic organisms). These impactscan be exacerbated when the shoreline development is accompanied by the installation ofconcrete, steel, or gabion baskets as retaining walls to prevent erosion or to make the shorelinemore conducive for recreation. This loss of natural shoreline and associated aquatic vegetationrepresents a loss of spawning and feeding habitat for native fish.This type of shoreline development, in combination with an increase in impervious surfaces,also increases the amount of contaminants in runoff. Increased nutrients and an increase intemperature create an ideal growing situation for algae and aquatic plants, which can be anuisance to swimmers and boaters, and can also create anoxic conditions for aquaticChapter 7: Integration and Implementation 277
The <strong>Innisfil</strong> <strong>Creeks</strong> <strong>Subwatershed</strong> <strong>Plan</strong>communities. Shoreline areas are also disproportionately important for terrestrial wildlife as well,as the clearing of shoreline areas for cottages or homes leads to loss of habitat for songbirds,amphibians, turtles and small mammals (Figure 7-9, Figure 7-10).Although the development of individual shoreline properties may seem small in nature, thecumulative effect of all of these small developments can add up to significant impacts. The<strong>Innisfil</strong> <strong>Creeks</strong> shoreline, which represents 18% of the total lakeshore, has already had 82% ofits length developed in such a way. The significance of the extent of this development isexacerbated by the fact that historically much of the <strong>Innisfil</strong> lakeshore was an extensive wetland(Figure 6-2), which would have played a role in buffering the lake from any upstream impacts tothe creeks, and may have provided spawning and nursery habitat for fish such as muskellunge,perch, and largemouth bass, as well as providing extensive breeding habitat for waterfowl,herons, and other wetland birds.Figure 7-9: Influences of urban shoreline land use on subwatershed health.Chapter 7: Integration and Implementation 278
The <strong>Innisfil</strong> <strong>Creeks</strong> <strong>Subwatershed</strong> <strong>Plan</strong>Figure 7-10: Influences of rural shoreline use on subwatershed health.Stewardship options for shoreline properties are quite similar to those for riparian areas, andinclude septic system repairs, shoreline naturalization, erosion control projects, and treeplanting. Financial and technical support for these types of projects is provided by the MNR andLSRCA.Chapter 7: Integration and Implementation 279
The <strong>Innisfil</strong> <strong>Creeks</strong> <strong>Subwatershed</strong> <strong>Plan</strong>Figure 7-11. Urban shoreline area with appropriate best management practices implemented toprotect subwatershed healthChapter 7: Integration and Implementation 280
The <strong>Innisfil</strong> <strong>Creeks</strong> <strong>Subwatershed</strong> <strong>Plan</strong>Figure 7-12. Rural shoreline area with appropriate best management practices implemented toprotect shoreline healthChapter 7: Integration and Implementation 281
The <strong>Innisfil</strong> <strong>Creeks</strong> <strong>Subwatershed</strong> <strong>Plan</strong>7.7 Developing an implementation planThe <strong>Innisfil</strong> <strong>Creeks</strong> <strong>Subwatershed</strong> <strong>Plan</strong> includes an assessment of the current state of theenvironment in that subwatershed, the stressors upon its health, and the current managementframework to address those stressors. As a result of that assessment, the subwatershed planhas developed a list of recommended actions which, if implemented, would provide additionalguidance on the protection and restoration of that subwatershed.Achieving these recommendations will require the coordinated response of multiple governmentagencies, and many individual landowners, working together in a multifaceted approach toprotecting and improving subwatershed health. To ensure these actions are fostered andcoordinated, this subwatershed plan will be complemented with a <strong>Subwatershed</strong>Implementation <strong>Plan</strong>, as well as a <strong>Subwatershed</strong> Working Group.The <strong>Subwatershed</strong> Implementation <strong>Plan</strong> is a brief document, intended to provide the necessarysupport and direction to achieve a short list of priority recommendations within five years of thecompletion of this subwatershed plan. To meet that goal, the implementation plan has beenwritten with more specific detail on timelines, deliverables, and the specific steps necessary toachieve those priority recommendations.This implementation plan will also form the basis of periodic meetings of the <strong>Subwatershed</strong>Implementation Working Group, which will be made up of the Town of <strong>Innisfil</strong>, County of<strong>Simcoe</strong>, City of Barrie, provincial Ministries of the Environment, Natural Resources, andAgriculture, Food and Rural Affairs, as well as the <strong>Lake</strong> <strong>Simcoe</strong> <strong>Region</strong> Conservation Authority,and other relevant stakeholders. These groups, who are the primary lead agencies on therecommendations developed in this plan, will meet periodically to coordinate and report onimplementation of the priority recommendations. This group will also assist in periodic reviewand updates to this subwatershed plan.Chapter 7: Integration and Implementation 282
The <strong>Innisfil</strong> <strong>Creeks</strong> <strong>Subwatershed</strong> <strong>Plan</strong>8 Combined RecommendationsThis chapter provides a compiled list of the recommendations identified in the detailed technicalchapters of this subwatershed plan. These recommendations will be brought forward andprioritized in the development of an implementation plan for the <strong>Innisfil</strong> <strong>Creeks</strong> subwatershed.The recommendations in this chapter have been grouped into categories of similar issues.Thus, for example, recommendations derived from the terrestrial natural heritage chapter maybe grouped with recommendations derived from the water quality chapter, in cases where theyaddress shared issues. In such cases, the numbering system will allow the reader to trace therecommendation back to the chapter where it originated.Recommendations in the following list are numbered as chapter number – recommendationnumber. In cases where a recommendation originated from more than one chapter, it isnumbered based on its first occurrence, with all other occurrences listed in parentheses.It is recognized that many of the undertakings in the following set of recommendations aredependent on funding from all levels of government. Should there be financial constraints, itmay affect the ability of the partners to achieve these recommendations. These constraints willbe addressed more fully in the implementation phase.Chapter 8: Combined Recommendations 283
The <strong>Innisfil</strong> <strong>Creeks</strong> <strong>Subwatershed</strong> <strong>Plan</strong>8.1 Protection and Policy8.1.1 Official <strong>Plan</strong> consistencyRecommendation 6-1 – That the LSRCA, MOE and MNR assist subwatershedmunicipalities in ensuring official plans are consistent with the recommendationspresented in the <strong>Innisfil</strong> <strong>Creeks</strong> subwatershed plan, as approved by the LSRCA Board ofDirectors. This approval will be subsequent to consultation with municipalities, thesubwatershed plan working group, and the general public, as outlined in the Guidelinesfor developing subwatershed plans for the <strong>Lake</strong> <strong>Simcoe</strong> watershed (May, 2011).8.1.2 The adaptive watershed planning processRecommendation 8-1 – That the LSRCA and other relevant and interestedstakeholders establish an implementation working group to assist in coordinating theimplementation priority recommendations to address the most significant threats in thesesubwatersheds.Recommendation 8-2 (3-21) - That the LSRCA, MNR and MOE analyse and report theresults of the existing and proposed water quality, water quantity, and aquatic andterrestrial natural heritage monitoring programs annually, and that the information beused to update the LSRCA Watershed Report Card. Further, stakeholders should bemade aware when updates are available, and be provided access to the monitoring datacollected via a web portal, to increase distribution and communication of this data.Recommendation 8-3 – That the LSRCA, with the assistance of the other governmentagencies and stakeholder groups involved in implementing the recommendations of thissubwatershed plan, report on the progress of this implementation annually.Recommendation 8-4 – Within five years of the completion of this subwatershed plan,that the LSRCA, in collaboration with MOE, MNR, subwatershed municipalities, andother interested and relevant stakeholders, review and update this subwatershed plan.8.1.3 Protecting Natural HeritageRecommendation 6-3 – That the MNR, MOE, and LSRCA review the terrestrial naturalheritage data provided by the comprehensive monitoring program, when it becomesavailable, to define site level characteristics or indicators of ‘high quality’ natural heritagefeatures, and provide policy recommendations to subwatershed municipalities (asnecessary) to ensure high quality natural heritage features are adequately protectedfrom development and site alteration.Recommendation 6-4 – That the MNR, MAFRA, LSRCA, subwatershed municipalities,and interested members of the agricultural community review the results of the studiesbeing conducted on methods and policy tools to protect grassland dependent wildlife onactive agricultural land as they become available, to determine if they provide solutionsfor the conservation of grassland habitat which would be applicable for thesesubwatersheds.Recommendation 6-5 – That the City of Barrie and Town of <strong>Innisfil</strong>, with the assistanceof the MNR and LSRCA, give consideration to including policies in their respectiveOfficial <strong>Plan</strong>s to contribute to the protection of grassland habitats, as necessary, basedChapter 8: Combined Recommendations 284
The <strong>Innisfil</strong> <strong>Creeks</strong> <strong>Subwatershed</strong> <strong>Plan</strong>on the results of Recommendation #6-6, and recognize the need for balance in theapproach to development in urban areas.8.1.4 Reducing impact of land use – groundwater recharge and dischargeRecommendation 4-6 - Municipalities shall only permit new development orredevelopment in significant recharge areas, where it can be demonstrated through thesubmission of a hydrogeological study and water balance, that the existing groundwaterrecharge will be maintained (i.e. there will be no net reduction in recharge).Recommendation 4-7 - Municipalities should amend their planning documents torequire that runoff in significant recharge areas meet the enhanced water quality criteriaoutlined in the MOE Stormwater Management Guidance Document, 2003, as amendedfrom time to time, prior to it being infiltrated.Recommendation 4-8 - That municipalities incorporate the requirement for the re-use ordiversion of roof top runoff (clean water diversion) from all new development insignificant recharge areas away from storm sewers and infiltrated to maintain the predevelopmentwater balance (except in locations where a hydrogeological assessmentindicates that local water table is too high to support such infiltration) in their municipalengineering standards.Recommendation 4-9 - The MOE should only issue Environmental ComplianceApprovals for new storm water management facilities within significant recharge areasthat maintain the pre-development groundwater recharge rates and meet the enhancedwater quality criteria outlined in the MOE Stormwater Management Guidance Document,2003, as amended from time to time.Recommendation 4-10 - The MOE shall only issue Environmental ComplianceApprovals for Stormwater Management Facility retrofits within significant recharge areas,that attempt to improve, maintain or restore the pre-development water balance, andmeet the enhanced water quality criteria outlined in the MOE Stormwater ManagementGuidance Document, 2003, as amended from time to time.Recommendation 4-11 – Municipalities, in collaboration with the <strong>Lake</strong> <strong>Simcoe</strong> <strong>Region</strong>Conservation Authority, shall undertake an education and outreach program focusing onthe importance of significant recharge areas, and the actions residents and businessescan take to maximize infiltration from impervious surfaces while minimizingcontamination such as salt.Recommendation 4-12 - The <strong>Lake</strong> <strong>Simcoe</strong> <strong>Region</strong> Conservation Authority shouldcreate eligibility for stormwater management retrofits and infiltration projects under theLEAP program within recharge areas.Recommendation 4-13 - Municipalities shall collaborate with the <strong>Lake</strong> <strong>Simcoe</strong> <strong>Region</strong>Conservation Authority to promote infiltration of clean water in significant rechargeareas, and prioritize stormwater retrofits utilizing water quality controls, and ultimatelyinfiltration devices for treated stormwater runoff.Recommendation 4-14 - The MOE should consider providing financial assistance toimplement stormwater management facility retrofits and infiltration projects withinsignificant recharge areas.Chapter 8: Combined Recommendations 285
The <strong>Innisfil</strong> <strong>Creeks</strong> <strong>Subwatershed</strong> <strong>Plan</strong>Recommendation 4-15 - Municipalities should include significant recharge areas in theirassessment of areas vulnerable to road salt, and modify their municipal SaltManagement <strong>Plan</strong>s and snow disposal plans as necessary.8.1.5 Incorporating LSPP objectives in Environmental AssessmentsRecommendation 6-6 – That reviewers of Environmental Assessments for municipalinfrastructure in the <strong>Lake</strong> <strong>Simcoe</strong> watershed, including subwatershed municipalities, andLSRCA and MOE (when reviewing such documents), give due consideration to thepreservation of barrier-free connectivity for wildlife between nearby wetland and uplandhabitats. This should include due consideration of alternate route configuration, the useof wildlife crossing structures, and/or the use of traffic calming measures in criticallocations.Recommendation 6-7 – That subwatershed municipalities and the MOE ensure that allEnvironmental Assessments for municipal infrastructure in the <strong>Lake</strong> <strong>Simcoe</strong> watershedgive due consideration to the preservation of barrier-free connectivity for wildlife betweennearby wetland and upland habitats. This should include due consideration of alternateroute configuration, the use of wildlife crossing structures, and/or the use of trafficcalming measures in critical locations.8.1.6 Promoting Low Impact DevelopmentRecommendation 3-1-That the LSRCA, with the support of the MOE, provide a whitepaper to subwatershed municipalities describing the range of LID technologies that couldpotentially be used to mitigate the impacts of development on surface and groundwaterquality and quantity. Further, that the LSRCA and subwatershed municipalities identifythe barriers associated with the uptake of LID technology and, with the support of MOE,develop recommendations for overcoming these barriers.Recommendation 3-2 - That the federal and provincial governments provide sufficientfinancial incentives, or otherwise address barriers identified in Recommendation #3-1, toensure subwatershed municipalities use Low impact Development (LID) practices andpromote the adoption of Smart Growth Urban Design Guidelines.8.1.7 Improving stormwater managementRecommendation 3-3 - That the subwatershed municipalities, with the assistance of theLSRCA, promote the increased use of innovative solutions to address stormwatermanagement and retrofits such as:• enhanced street sweeping and catch basin maintenance, particularly in thoseareas currently lacking stormwater controls;• improving or restoring vegetation in riparian areas;• installation of rainwater harvesting; construction of rooftop storage and/or greenroofs; the use of bioretention areas and vegetated ditches along roadways;• the use of soakaway pits, infiltration galleries, permeable pavement and otherLID solutions, where conditions permit;Chapter 8: Combined Recommendations 286
The <strong>Innisfil</strong> <strong>Creeks</strong> <strong>Subwatershed</strong> <strong>Plan</strong>• the on-going inventory, installation, and proper maintenance of oilgrit/hydrodynamic separators combined with the use of technologies to enhancetheir effectiveness where appropriate;• Recommendation 3-6 - That the subwatershed municipalities complete the StormwaterManagement Master <strong>Plan</strong>s as outlined in the LSPP 2011 Comprehensive StormwaterManagement Master <strong>Plan</strong>s Guidelines document with particular emphasis onmaintenance of facilities, and the need for retrofits where appropriate.Recommendation 3-8 - That Official <strong>Plan</strong>s be amended to contain policies that wouldhelp minimize impervious surface cover in the <strong>Innisfil</strong> <strong>Creeks</strong> subwatershed throughrequirements such as using low impact development solutions, limiting impervioussurface areas on new development, and/or providing stormwater rates rebates andincentives to residential and non-residential property owners demonstrating bestpractices for managing stormwater.8.1.8 Managing thermal degradationRecommendation 3-17– That, as new or retrofit stormwater facilities are constructed,LSRCA work with subwatershed municipalities to reduce potential thermal impacts ofthose stormwater ponds and to recognize the importance of LID uptake in relation tomaintaining stream temperature.8.1.9 Improving construction practicesRecommendation 3-9 - That the LSRCA and watershed municipalities promote andencourage the adoption of best management practices to address sedimentation anderosion controls during construction and road development.Recommendation 3-10 - That subwatershed municipalities and LSRCA improve currentmonitoring and enforcement of site alteration by-laws by undertaking a review of thecurrent program and ensuring that adequate resources are available for theimprovements.8.1.10 Land securement by public agenciesRecommendation 6-8 – That the LSRCA and subwatershed municipalities shouldcontinue to secure outstanding natural areas for environmental protection and publicbenefit, through tools such as land acquisition or conservation easements, and shouldsupport the work of Land Trusts doing similar work.Recommendation 6-9 – That the LSRCA and subwatershed municipalities shouldcontinue to refine their land securement decision processes to ensure that they aresecuring natural areas that are critical to the health of the watershed (or securing andrestoring areas which have the potential to become critical to the health of thewatershed), but which are otherwise vulnerable to loss through incompatible land uses.Recommendation 6-10 – That the Federal, Provincial, and Municipal governmentsprovide consistent and sustainable funding to support securement of outstanding naturalareas.Chapter 8: Combined Recommendations 287
The <strong>Innisfil</strong> <strong>Creeks</strong> <strong>Subwatershed</strong> <strong>Plan</strong>8.2 Restoration and remediation8.2.1 Improving stormwater managementRecommendation 3-4 - That the Province of Ontario, through the implementation of the<strong>Lake</strong> <strong>Simcoe</strong> Phosphorus Reduction Strategy, provide significant incentive funding tothe relevant municipalities and/or the LSRCA to maintain, construct, and /or retrofitstormwater facilities as identified by the LSRCA Stormwater Rehabilitation program.Recommendation 3-5 - That the subwatershed municipalities routinely monitor andmaintain the design level of existing stormwater facilities. In addition to maintainingdesign level, criteria for maintenance should also include frequency and exposure tospills and other contaminant sources. Further, that the federal and provincialgovernments be requested to share in the cost of maintenance.Recommendation 3-7 - That the LSRCA and its partners recognize that while theconstruction and/or retrofit of quality control facilities is extremely important, quantitycontrol is also an important consideration in some areas of the Barrie <strong>Creeks</strong>, LoversCreek, and Hewitt’s Creek subwatersheds; therefore, quantity control facilities should beconstructed in those areas where geographical space is limited or other LID options arenot feasible. In these situations, federal and provincial governments should providefinancial incentives to allow municipalities to complement quantity control stormwaterponds with an enhanced street sweeping program.8.2.2 Managing water demandRecommendation 4-1 -That the LSRCA and subwatershed municipalities promote andsupport low impact design (LID) solutions such as rainwater harvesting, rain gardens,and grey water reuse to manage stormwater and supplement residential water use.8.2.3 Managing agricultural impactsRecommendation 3-15 - That the subwatershed municipalities, through the LSRCA,create a roundtable made up of municipalities, LSRCA, MOE, MNR, OFA, NGOs, andrelated landowner representatives, or through existing frameworks such as the <strong>Lake</strong><strong>Simcoe</strong> Stewardship Network, to determine co-operative ways of implementingphosphorus reduction and improved water quality measures in Hewitt’s, Lovers, and<strong>Innisfil</strong> <strong>Creeks</strong>, and to develop an ‘action plan’ for their implementation within theagricultural and rural communities.Recommendation 5-11 –That the LSRCA work with subwatershed municipalities andMAFRA to examine innovative forms of municipal drain maintenance, or opportunities tocreate new drains using principles of natural channel design. Furthermore, that theLSRCA work with subwatershed municipalities and MAFRA to decommission municipaldrains when the land use changes, removing the need for their use.8.2.4 Dealing with enclosed watercoursesRecommendation 5-12 - That the Town of <strong>Innisfil</strong>, in partnership with the LSRCA,complete an inventory of enclosed or buried streams from which removal of enclosuresor “day lighting” can be prioritized.Chapter 8: Combined Recommendations 288
The <strong>Innisfil</strong> <strong>Creeks</strong> <strong>Subwatershed</strong> <strong>Plan</strong>Recommendation 5-13 - That the Town of <strong>Innisfil</strong> continue its efforts to day lightenclosed streams and establish a funded program based on prioritized list of restorationopportunities, as resources permit.8.2.5 Dealing with indirect impacts to natural areasRecommendation 6-19 – That the LSRCA, County of <strong>Simcoe</strong>, City of Barrie, and Townof <strong>Innisfil</strong> conduct natural heritage inventories, and develop and implement managementplans for publicly accessible natural areas that they own, to mitigate potential threatsrelated to invasive species and increased recreation pressure.Recommendation 6-20 – That the MOE and its partners provide outreach to gardencentres, landscapers, and garden clubs regarding the danger of using invasive speciesin ornamental gardens.Recommendation 6-21 – That the City of Barrie, the Town of <strong>Innisfil</strong> and the County of<strong>Simcoe</strong>, with support from LSRCA, make information available to residents on theimpact of human activities on natural areas. Priority issues include the dangers ofinvasive species, the importance of keeping pets under control, and the importance ofstaying on trails while in natural areas.8.2.6 Increasing uptake of stewardship programsRecommendation 5-1 (6-11) – That the MNR, MOE, MAFRA, and LSRCA continue toimplement stewardship projects in these subwatersheds, and encourage other interestedorganizations to do the same.Recommendation 5-2 (6-12) – That governmental and non-governmental organizationscontinue to improve coordination of programs to: (1) avoid inefficiencies andunnecessary competition for projects, and: (2) make it easier for landowners to knowwhich organization they should be contacting for a potential project, using tools such asa simple web portal.Recommendation 5-3 (6-14) – That the MOE, MNR, LSRCA, and other members of the<strong>Lake</strong> <strong>Simcoe</strong> Stewardship Network be encouraged to document completed stewardshipprojects in a common tracking system to allow efficient tracking, coordinating, andreporting of stewardship work accomplished.Recommendation 5-4 (6-13) – That the Federal, Provincial, and Municipal governmentsprovide consistent and sustainable funding to ensure continued delivery of stewardshipprograms.Recommendation 5-5 (6-15) – That the MOE, MNR, MAFRA, LSRCA, and otherinterested members of the <strong>Lake</strong> <strong>Simcoe</strong> Stewardship Network support research todetermine barriers limiting uptake of stewardship programs in these subwatersheds andshare these results with other members of the <strong>Lake</strong> <strong>Simcoe</strong> Stewardship Network, toenable agencies and stakeholders to modify their stewardship programming as relevant.This research should include a review of successful projects to determine what aspectsled to their success, and how these may be emulated.Recommendation 5-6 (6-16) – That the MOE, MNR, MAFRA, and LSRCA continue toinvestigate new and innovative ways of reaching target audiences in the local communityand engage them in restoration programs and activities (e.g. high school environmentalclubs, through Facebook groups, hosting a <strong>Lake</strong> <strong>Simcoe</strong> Environment Conference forChapter 8: Combined Recommendations 289
The <strong>Innisfil</strong> <strong>Creeks</strong> <strong>Subwatershed</strong> <strong>Plan</strong>high schools/science community interaction). The results of these efforts should beshared with the <strong>Lake</strong> <strong>Simcoe</strong> Stewardship Network.8.2.7 Prioritizing stewardship projectsRecommendation 6-17 – That the MNR, with the assistance of the MOE andLSRCA, develop a spatially-explicit decision support tool to assist in targetingterrestrial stewardship projects in the <strong>Lake</strong> <strong>Simcoe</strong> watershed. In the contextof the Barrie <strong>Creeks</strong>, Lovers Creek, and Hewitt’s Creek subwatershed, thisdecision tool should take into account factors including:• the need to increase natural vegetation cover along the <strong>Lake</strong> <strong>Simcoe</strong>shoreline• protecting and restoring ecologically significant groundwater rechargeareas, to help mitigate the expected impacts of climate change• opportunities to restore lost wetlands, particularly in the east half of thesubwatershed, where the topography has minimal slope, and the areais underlain by fine-grained, poorly-drained soils• opportunities to increase connectivity across the subwatersheds fordispersing flora and fauna• the potential for non-forested valleylands, particularly in agriculturalareas, as features which could improve wildlife connectivity• the need to protect and restore grassland habitat, particularly rarenative grasslandsRecommendation 5-7 – That the LSRCA, with the assistance of the MNR and MOE,develop a spatially-explicit decision support tool to assist in targeting aquatic habitatstewardship projects in the <strong>Lake</strong> <strong>Simcoe</strong> watershed. In the context of the Barrie <strong>Creeks</strong>,Lovers Creek, and Hewitt’s Creek subwatersheds, this prioritization tool should take intoaccount factors including:• The need to incorporate each major type of aquatic habitat stressorincluding bank hardening, barriers, riparian cover, and on-line ponds;• The use of best available datasets to identify potential restoration sites,including LSRCA BMP inventory and riparian assessment;• Expected improvements to aquatic habitat and therefore fish andbenthic community condition, including improved water temperature,increased connectivity for movement within and between tributaries,and shelter.• Opportunities to reduce phosphorus loadings in the tributaries in thesesubwatershedsChapter 8: Combined Recommendations 290
The <strong>Innisfil</strong> <strong>Creeks</strong> <strong>Subwatershed</strong> <strong>Plan</strong>• The relative cost of implementing projects in urban, urbanizing, andagricultural areas, particularly with respect to the cost of implementingretrofit projects in the relatively heavily urbanized City of Barrie.Recommendation 5-8 – That prioritized restoration areas be integrated into astewardship plan that ensures prioritized restoration opportunities are undertaken assoon as feasible. This stewardship plan should incorporate the outcomes ofrecommendations to improve uptake identified in Recommendations 5-1 through 5-6.Recommendation 3-16 - That these spatially-explicit decision support tools be used toprioritize allocation of stewardship resources, so that funds are provided in locationswhere maximum benefit can be achieved.8.2.8 Reducing salt useRecommendation 3-13 - That subwatershed municipalities, with the assistance of theLSRCA, develop or adopt a program such as the <strong>Region</strong> of Waterloo’s “Smart aboutSalt” program, to educate snow removal contractors and property managers about bestpractices for reducing salt use while ensuring that public safety is not compromised.Further, that subwatershed municipalities examine the feasibility of adopting acertification program, wherein private contractors could become certified as “smart” saltapplicators, reflecting their understanding of the need to balance environmentalprotection and public safety in snow and ice management, and the feasibility of requiringall contractors working on municipal property to have such certification.Recommendation 3-14 - Recognizing that increasing concentrations of chloride inwatercourses is an emerging issue shared by all municipalities in the <strong>Lake</strong> <strong>Simcoe</strong>watershed, that the watershed municipalities, LSRCA, MOE, and MNR form a SaltWorking Group as a mechanism to share information on best practices for saltapplication, methods of increasing public awareness of the environmental impacts ofroad salt, and the effectiveness of municipal Salt Management <strong>Plan</strong>s.Chapter 8: Combined Recommendations 291
The <strong>Innisfil</strong> <strong>Creeks</strong> <strong>Subwatershed</strong> <strong>Plan</strong>8.3 Applied science8.3.1 Reducing salt useRecommendation 3-11 - That the LSRCA, with the support of subwatershedmunicipalities, develop a program to determine relative contribution of chloride from roadsalt application, establish baseline indicators, and examine the effectiveness of currentprotocols on salt storage, application, and disposal, as outlined in their respective SaltManagement <strong>Plan</strong>s, adapting them as necessary.Recommendation 3-12 - That the LSRCA, with the support of subwatershedmunicipalities, identify areas within the Barrie <strong>Creeks</strong>, Lovers Creek, and Hewitt’s <strong>Creeks</strong>ubwatersheds which are vulnerable to road salt (as outlined by Environment Canada).This assessment may be refined through further examination of relative salt tolerance oflocal biota. As outlined in Environment Canada’s Code of Practice for the EnvironmentalManagement of Road Salt, municipalities should examine alternate methods ofprotecting public safety while reducing environmental impacts in these areas, onceidentified.8.3.2 Establishing instream flow targetsRecommendation 4-3 - That the MNR and MOE, in partnership with LSRCA, develop amore detailed surface water budget for the Barrie <strong>Creeks</strong>, Lovers Creek, and Hewitt’sCreek subwatersheds that will provide basis of actions needed to determine ecological(instream) flow targets.Recommendation 4-4 (5-9) –That the MOE, with assistance from LSRCA, MNR and theUniversity of Guelph, determine in-stream flow regime targets for Barrie, Lovers,Hewitt’s, and <strong>Innisfil</strong> <strong>Creeks</strong>. These targets should be based on the Guidance Documentframework (LSRCA 2010) which is being used for the Maskinonge River subwatershed.Recommendation 4-5 (5-9) – That the MOE and MNR, with assistance from LSRCA,develop a strategy to achieve the instream flow regime targets. This strategy shouldaddress both high and low flow requirements and provide a plan for implementingstrategy recommendations.8.3.3 Increasing our understanding of climate changeRecommendation 3-18 (4-17) -That the LSRCA work with its federal, provincial, andmunicipal partners to refine the anticipated impacts of climate change in the <strong>Lake</strong><strong>Simcoe</strong> watershed. This information can then be used to develop managementstrategies to address these impacts. Emphasis at this time should be placed on buildingecological resilience in vulnerable subwatersheds through stream rehabilitation,streambank planting, barrier removal, and other BMP implementation in conjunction withthe protection of current hydrologic functions.Recommendation 6-18 – That the members of the <strong>Lake</strong> <strong>Simcoe</strong> StewardshipNetwork be encouraged to build into their projects relevant provisions for theanticipated impacts of climate change, such as the need to recommendspecies which are suitable for future climate conditions, and the possibility ofan increase in invasive plants, pests, and diseases which may further limit thesuccess of traditional stewardship approaches.Chapter 8: Combined Recommendations 292
The <strong>Innisfil</strong> <strong>Creeks</strong> <strong>Subwatershed</strong> <strong>Plan</strong>Recommendation 4-16 –That the LSRCA, with the assistance of MOE andMNR, develop a fully integrated groundwater and surface water model that isable to take advantage of real-time or near real-time flow data, to predict howstream flow volumes will respond to the seasonal and ecological impacts ofclimate change, in terms of increase peak flows, reduced baseflows, andincreased water demand8.3.4 Monitoring and assessmentRecommendation 3-19 - That the LSRCA enhance the existing monitoring network,through the comprehensive monitoring strategy, to address identified limitations andgaps of the current monitoring program. Review of potential enhancements shouldconsider:• Undertaking periodic monitoring of toxicants such as pesticides andpharmaceuticals• Spatial coverage of monitoring stations relative to addressing key monitoringquestions such as the relationship between changes in land use cover andchanges in water quality and quantity• Establishing water quality monitoring stations in the headwaters, in addition tothe mouths, of the tributaries• Monitoring additional parameters that are are key indicators of ecosystem healthand restoration progress such as brook trout spawning.Recommendation 5-14 – That LSRCA, with support from Municipalities and theProvince, aim for improved spatial and temporal resolution in annual monitoring ofaquatic habitat, including water quality, fish and benthic indicators.Recommendation 6-22 – That the MNR, with the assistance of LSRCA and MOE,complement the proposed monitoring strategy with standardized surveys of thedistribution and abundance of terrestrial species at risk throughout the <strong>Lake</strong> <strong>Simcoe</strong>watershed.Recommendation 6-23 – That the MNR, LSRCA, and MAFRA continue to maintain anup-to-date seamless land cover map for the watershed, as defined by the LSPP, withnatural heritage features classified using Ecological Land Classification, managed insuch a way as to allow change analysis.Recommendation 6-24 – That the MNR and LSRCA take advantage of data that isalready available, by developing a biodiversity database that can collate informationreported in EIS and EA reports, information reported in natural area inventories, plotbaseddata collected in the watershed-wide Vegetation Survey Protocol that isunderway, plot-based data collected by citizen-scientists for the Breeding Bird Atlas, andother data as may be available.Recommendation 6-25 – That the MNR, with the assistance of the LSRCA, takeadvantage of this soon-to-be compiled data, and develop lists of watershed-rare taxa,and policies to support their protection.Recommendation 3-22 – That the LSRCA, in collaboration with MNR, MOE, andMAFRA, develop a program for assessing efficacy of new stormwater facilities,Chapter 8: Combined Recommendations 293
The <strong>Innisfil</strong> <strong>Creeks</strong> <strong>Subwatershed</strong> <strong>Plan</strong>stewardship best management practices, and restoration projects, to improveunderstanding of the effectiveness of stewardship efforts.8.3.5 Improving data managementRecommendation 4-2 - That the MOE be encouraged to continue to improve the WaterTaking Reporting System by integrating the Permit To Take Water (PTTW) databasewith the Water Well Information System (WWIS) database, and connecting those takingsto wells / aquifers to facilitate impact assessment (i.e. the PTTW database needs to beconnected to the WWIS database).Recommendation 6-26 (3-20) – That the MNR, LSRCA, and MOE develop a frameworkto allow effective and efficient management and sharing of data before implementing thecomprehensive monitoring program. This framework may include the designation of oneagency as the curator of all monitoring data collected in the <strong>Lake</strong> <strong>Simcoe</strong> watershed.8.3.6 Additional research needsRecommendation 6-27 – That the <strong>Lake</strong> <strong>Simcoe</strong> Science Committee, other levels ofgovernment, and academia support research to better understand the stresses to wildlifeand wildlife habitat associated with urban development, to allow management responsesto be refined. Important questions of interest include: the use of stormwater ponds asamphibian breeding habitat, the importance of remnant natural areas to quality of life forlocal residents, the indirect impacts of roads on resident and migratory wildlife, and theimpacts of high density and low density development on wildlife communities in naturalareas. This research may include literature reviews, analysis of data available throughthe monitoring program, or original, innovative, peer-reviewed research.Chapter 8: Combined Recommendations 294