The H-R Diagram - High Point University
The H-R Diagram - High Point University
The H-R Diagram - High Point University
- No tags were found...

You also want an ePaper? Increase the reach of your titles
YUMPU automatically turns print PDFs into web optimized ePapers that Google loves.
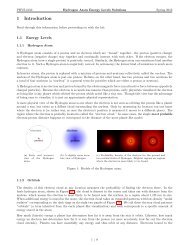
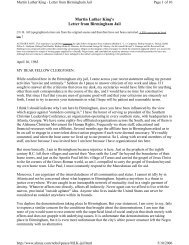
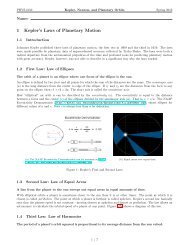
PHYS-1050 Hertzsprung-Russell <strong>Diagram</strong> Spring 2013(a) Basic plot. Here × marks the sun.(b) Same plot but with isoradius curves.Figure 3: A basic HR diagram and an HR diagram with isoradius curves.1.3.3 A Closer LookStellar luminosity, or a stars “brightness,” depends on two things: its surface area and its temperature. UsingEquation (1), the Stefan-Boltzmann Law, we can see that stars above the main sequence on the H-R diagram (higherluminosity), with the same temperature as cooler main sequence stars, have greater surface areas (larger radii). Also,stars that have the same luminosity as dimmer main sequence stars, but are to the left of them (hotter) on the H-Rdiagram, have smaller surface areas (smaller radii).Bright, cool stars are therefore necessarily very large. <strong>The</strong>se enormous stars are called Red Giants and lie above themain sequence line. Antares is a good example of a red giant. Its temperature is a cool 3548 K (the Sun is about5770 K), while its luminosity is about 50,000 times brighter than the Sun. This must mean that it has a very largeradius, in fact about 600 times larger than the solar radius! Similarly, stars that are very hot and yet still dim musthave small surface areas. <strong>The</strong>se small, hot stars are called White Dwarfs and lie below the main sequence. <strong>The</strong>y canhave radii as small as the Earth, having temperatures around 10,000 K.Looking back at Equation (1) we may notice that by holding R constant and plotting the luminosity as the temperaturevaries, we generate a set of diagonal lines. <strong>The</strong>se constant radius lines go from the upper left to the lower right(negative slope) of the diagram. Figure 3(b) shows these constant radius lines on the H-R diagram. Stars fall intothree general categories. <strong>The</strong>se categories are main sequence stars, red giants, and white dwarfs. It is important tonote that the location of a star on the H-R diagram does NOT relate to its position in space. In fact, many of thebrighter stars on the diagram are not among the closest to Earth.1.3.4 Mass Luminosity Relation<strong>The</strong>re is a correlation between a main sequence star’s mass and its luminosity. Stars that are higher up (brighter)on the main sequence are more massive. This correlation is known as the Mass Luminosity relation. It says that thestars luminosity is proportional to the cube of its mass.L ∝ M 3.5 (3)where L is luminosity and M is stellar mass. Main sequence stars more massive than this relative to their luminositywould be in danger of collapsing under their own gravitational force. Stars less massive would be blown apart byradiation pressure from the intense luminosity.4 / 9
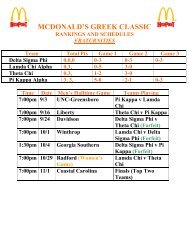
PHYS-1050 Hertzsprung-Russell <strong>Diagram</strong> Spring 20131.3.5 Spectral and Luminosity ClassesStars may be split up even more than just into Giants, Dwarfs, and Main Sequence stars. <strong>The</strong> spectral class of a staris closely related to its temperature. This class is actually determined by the lines in the star’s spectrum, which areheavily dependent on temperature. Spectral classification can place a star on the horizontal axis H-R diagram, butwhat the vertical axis? We need to classify stars according to their luminosity. Doing this would allow us to conveya lot of information about a star by its spectral and luminosity classification, including placing it fairly well on theH-R diagram. One way to classify by luminosity is to look at the star’s spectrum. This time instead of looking atwhich lines are present, as we do to get the temperature or spectral class, we look at the width of the lines. It turnsout that more luminous stars have narrower spectral lines than less luminous ones of the same spectral class. Forexample, in Figure 4 the lines of the class Ia star are much narrower than the class IV star.<strong>The</strong> luminosity classes are labeled I, II, III, IV, and V, where I is the brightest and is split up into Ia and Ib stars.Our Sun is classified as spectral class G2 and luminosity class V, placing it on the main sequence nearly in themiddle.Figure 4: Two A2 stars. <strong>The</strong> top is luminosity class Ia and the bottom luminosity class IV.1.3.6 InstabilitySome stars have times in their evolutionary track where they are not in equilibrium. <strong>The</strong>se stars pulsate, expandingand contracting like a lung. It is a battle between the thermal pressure in the star and its gravitational force. Whenstars are in this state of imbalance or instability, they are crossing an area called the Instability Strip on the H-Rdiagram. This is an area around 1000K wide that sits above the main sequence, as shown in Figure 5.Figure 5: <strong>The</strong> Instability Strip on the H-R <strong>Diagram</strong>.Stars called Cepheid Variables are an important type of star in this state. <strong>The</strong>y are used as distance indicators(standard candles) because the period of their pulsation varies in proportion with their luminosity. Cepheids arenear the top of the Instability Strip. Other notable stars in this region of the diagram are W Virginis Stars, aroundthe middle of the strip, and RR Lyrae Stars towards the bottom.5 / 9
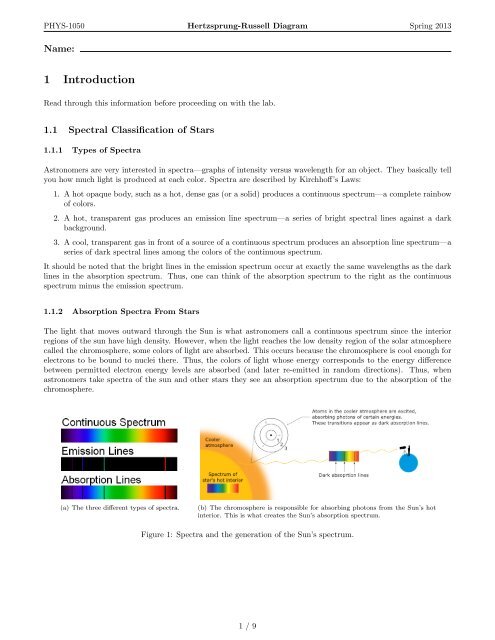
PHYS-1050 Hertzsprung-Russell <strong>Diagram</strong> Spring 20132 Pre-Lab Questions1. One can experiment with the relationships between spectral type, temperature, and color with the simple animationbelow. Use the Star Color Slider tool athttp://astro.unl.edu/naap/hr/animations/starColorSlider.swfto fill in Table 2. Drag the slider through different spectral types to see the change in temperature, color, andbrightness.SurfaceStar Temperature Spectral Type ColorBetelgueseM2Arcturus4,300 KSol G2 YellowProcyon F5 Yellow-WhiteSirius A A1 WhiteRigel A11,000 KDelta OrionisO9Table 2: Fill in the empty fields above.2. One can experiment with the relationships between luminosity, temperature (spectral type), and radius with astellar luminosity calculator. Use the calculator athttp://astro.unl.edu/classaction/animations/stellarprops/stellarlum.swfto fill in Table 3. <strong>The</strong> values given are in Solar Units (R ⊙ , T ⊙ , L ⊙ ).Radius (R ⊙ ) Temperature (T ⊙ ) Luminosity (L ⊙ )1 21 1/21 11 9Table 3: Fill in the empty fields above.3. <strong>The</strong> mass luminosity relation given in Equation (3) describes the approximate mathematical relationship betweenluminosity and mass for main sequence stars.L ∝ M 3.5Calculating the luminosity of a star with a given mass is straight-forward. To calculate the mass of a star witha given luminosity, however, requires the equation to be reversed.Use these two equations to complete Table 4.M ∝ 3.5√ L = L 1/3.5 (4)6 / 9
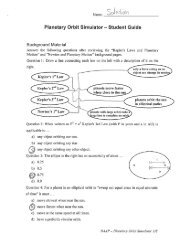
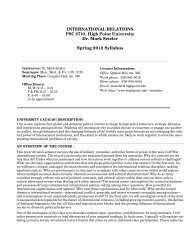
PHYS-1050 Hertzsprung-Russell <strong>Diagram</strong> Spring 20133 H-R <strong>Diagram</strong> ExplorerMass (M ⊙ ) Luminosity (L ⊙ )1/42105010010,000Table 4: Fill in the empty fields above.Open the NAAP H-R <strong>Diagram</strong> Explorer, shown in Figure 6, from this link:http://astro.unl.edu/naap/hr/animations/hr.htmlBegin by familiarizing yourself with the capabilities of the Hertzsprung-Russell <strong>Diagram</strong> Explorer through experimentation.Figure 6: NAAP H-R <strong>Diagram</strong> Explorer.− An actual H-R <strong>Diagram</strong> is provided in the upper right panel with an active location indicated by a red×. This active location can be dragged around the diagram. <strong>The</strong> options panel allows you to controlthe variables plotted on the x-axis: (temperature, B-V, or spectral type) and those plotted on the y-axis(luminosity or absolute magnitude). One can also show the main sequence, luminosity classes, isoradius lines,7 / 9
PHYS-1050 Hertzsprung-Russell <strong>Diagram</strong> Spring 2013or the instability strip. <strong>The</strong> Plotted Stars panel allows you to add various groups of stars to the diagram.− <strong>The</strong> Cursor Properties panel has sliders for the temperature and luminosity of the active location on theHR <strong>Diagram</strong>. <strong>The</strong>se can control the values of the active location or move in response to the active locationbegin dragged. <strong>The</strong> temperature and luminosity (in solar units) are used to solve for the radius of a star at theactive location.− <strong>The</strong> Size Comparison panel in the upper left illustrates the star corresponding to the active location on theHR <strong>Diagram</strong>. Note that the size of the sun remains constant.4 Analysis1. Drag the active location (the red ×) around on the H-R <strong>Diagram</strong>. Note the resulting changes in the temperatureand luminosity sliders. Now manipulate the temperature and luminosity sliders and note the correspondingchange in the active location. Check the appropriate region of the H-R diagram corresponding to each descriptionin Table 5. (Hint: you should have only one check for each row.)Description Top Right Bottom LeftHot stars are found at the:Faint stars are found at the:Luminous stars are found at the:Cool stars are found at the:Table 5: Fill in the empty fields above.2. Drag the active location around on the H-R <strong>Diagram</strong> once again. This time focus on the Size Comparison panel.Check the appropriate region of the H-R diagram corresponding to each description in Table 6. (Hint: youshould have only one check for each row.)Upper Upper Lower LowerDescription Left Right Right LeftLarge Blue stars are found at the:Small Red stars are found at the:Small Blue stars would be found at the:Really Large Red stars are found at the:Table 6: Fill in the empty fields above.3. Check show luminosity classes and show isoradius lines (if they are not already checked). <strong>The</strong> green region(Dwarfs (V)) is known as the main sequence and contains all stars that are fusing hydrogen into helium as theirprimary energy source. Over 90% of all stars fall in this region on the H-R diagram. Move the active cursor upand down the main sequence and explore the different values of stellar radius. Describe the sizes of stars alongthe main sequence. What are stars like near the top of the main sequence, the middle, and the bottom?8 / 9
PHYS-1050 Hertzsprung-Russell <strong>Diagram</strong> Spring 20134. Section 1.3.4 talked about the mass-luminosity relationship for stars on the main sequence by introducing Equation(3). What can you conclude about the masses of stars along the main sequence?5. Uncheck show luminosity classes and check show instability strip. Note that this region of the H-R<strong>Diagram</strong> indicates where pulsating stars are found, such as RR Lyrae stars and Cepheid variable stars. <strong>The</strong>sestars vary in brightness because they are pulsating—alternately growing bigger and smaller—which changes theirradii and surface temperatures and, thus, affects their luminosities. Describe the characteristics of stars thatare found in the instability strip. You should cover their range of temperatures, colors, luminosities, and sizes.(Hint: Comparing them to the sun is useful.) Are variable stars necessarily on the main sequence?6. Check the plotted stars option the nearest stars. Describe the characteristics of the nearest stars. You shouldcover their range of temperatures, colors, luminosities, and sizes.7. Change the plotted stars option from the nearest stars to the brightest stars. Why are these stars thebrightest in the sky? Three students debate this issue:Student A “I think it’s because these stars must be very close to us. That would make them appear brighterto us in the sky.”Student B “I think it’s because these stars are very luminous. <strong>The</strong>y are putting out a tremendous amount ofenergy.”Student C “I think it’s because these stars are very close and very luminous.”Use the tools of the H-R <strong>Diagram</strong> to support the views of one of the three students. Why are the stars weperceive as bright in the night sky really bright? (Hint: You may find the options labeled both the nearest andbrightest stars and the overlap useful.)9 / 9