The intonation of Saaremaa Estonian: in search of Swedish influence
The intonation of Saaremaa Estonian: in search of Swedish influence
The intonation of Saaremaa Estonian: in search of Swedish influence
Create successful ePaper yourself
Turn your PDF publications into a flip-book with our unique Google optimized e-Paper software.
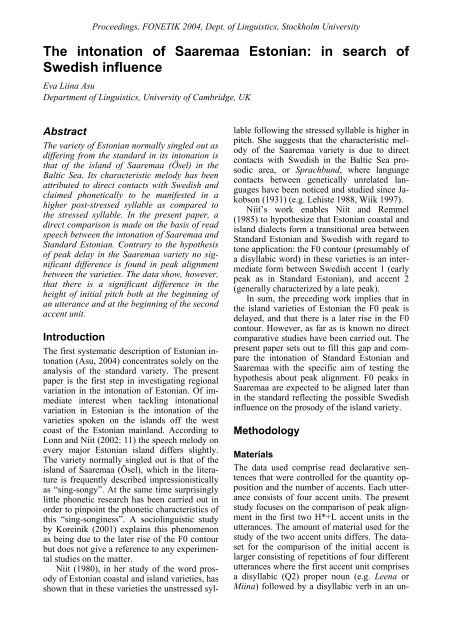
Proceed<strong>in</strong>gs, FONETIK 2004, Dept. <strong>of</strong> L<strong>in</strong>guistics, Stockholm Universitydifference between the data <strong>of</strong> the two varieties(t(5) = 1.048; p>0.05).0 10 20 30 40 50 60 70 80 90 100location <strong>of</strong> peak (% <strong>of</strong> the accent unit)Figure 2. Normalized <strong>in</strong>itial peak placement for thetwo varieties: Standard <strong>Estonian</strong> (dark gray bars),<strong>Saaremaa</strong> (light gray bars).Second peakFigure 3 displays the normalized location <strong>of</strong> thesecond peak expressed as a percentage <strong>of</strong> theaccent unit. In this case the peak is normalizedrelative to the length <strong>of</strong> the second accent unit(as measured from the onset <strong>of</strong> the /j/ sound <strong>in</strong>the word Jaanusega (‘with Jaanus’) to the midpo<strong>in</strong>tmeasurement <strong>in</strong> the last unstressed vowel/a/). <strong>The</strong> data <strong>of</strong> two speakers (one from eachvariety) are omitted because, as a result <strong>of</strong> theabove-mentioned switch to low accentuation <strong>in</strong>the course <strong>of</strong> the utterance, none <strong>of</strong> the secondaccent units <strong>in</strong> the data <strong>of</strong> these speakers wererealized as H*+L.Insufficient dataInsufficient dataStandard<strong>Saaremaa</strong>Standard<strong>Saaremaa</strong>0 10 20 30 40 50 60 70 80 90 100location <strong>of</strong> peak (% <strong>of</strong> the accent unit)Figure 3. Normalized second peak placement for thetwo varieties: Standard <strong>Estonian</strong> (dark gray bars)<strong>Saaremaa</strong> (light gray bars).<strong>The</strong> overall pattern<strong>in</strong>g <strong>of</strong> the data <strong>in</strong> Figure 3 issimilar to that <strong>of</strong> the first peak <strong>in</strong> Figure 2. <strong>The</strong>alignment <strong>of</strong> the peaks <strong>of</strong> the <strong>Saaremaa</strong> speakersseems to be on the whole slightly later <strong>in</strong>the accent unit than that <strong>of</strong> the Standard <strong>Estonian</strong>speakers. However, a paired samples t-testfails to give a significant result between the twovarieties (t(3)= 1.783; p>0.05).Pitch heightMore strik<strong>in</strong>g than the slight difference <strong>in</strong> peakalignment between the two averaged contours<strong>in</strong> Figure 1 is the difference <strong>in</strong> the height <strong>of</strong> <strong>in</strong>itialpitch. In order to compare this difference <strong>in</strong>a reliable way the <strong>in</strong>itial pitch height was expressedas a percentage <strong>of</strong> the span <strong>of</strong> an accentunit <strong>in</strong> relation to the F0 peak and the f<strong>in</strong>almeasurement <strong>in</strong> the accent unit. This was doneseparately for each accent unit.Figure 4 and Figure 5 show the results <strong>of</strong>normalized <strong>in</strong>itial pitch for the two accentunits. On the whole, for both accent units, the<strong>in</strong>itial pitch is higher for the speakers <strong>of</strong> Standard<strong>Estonian</strong> than that for the <strong>Saaremaa</strong>speakers.<strong>in</strong>itial pitch (% <strong>of</strong> span)<strong>in</strong>itial pitch (% <strong>of</strong> span)100806040200Figure 4. Normalized <strong>in</strong>itial pitch <strong>in</strong> the first accentunit: Standard <strong>Estonian</strong> (dark gray bars), <strong>Saaremaa</strong>(light gray bars).100806040200Insufficient dataStandardStandardFigure 5. Normalized <strong>in</strong>itial pitch <strong>in</strong> the second accentunit: Standard <strong>Estonian</strong> (dark gray bars),<strong>Saaremaa</strong> (light gray bars).Paired samples t-tests show that there is a significantdifference between the two varietieswith respect to the height <strong>of</strong> accent unit <strong>in</strong>itialpitch (t(5) = -2.709; p
Proceed<strong>in</strong>gs, FONETIK 2004, Dept. <strong>of</strong> L<strong>in</strong>guistics, Stockholm Universityunit, and t(3) = -3.638; p


