Vol. 10 No 3 - Pi Mu Epsilon
Vol. 10 No 3 - Pi Mu Epsilon
Vol. 10 No 3 - Pi Mu Epsilon
- No tags were found...

Create successful ePaper yourself
Turn your PDF publications into a flip-book with our unique Google optimized e-Paper software.
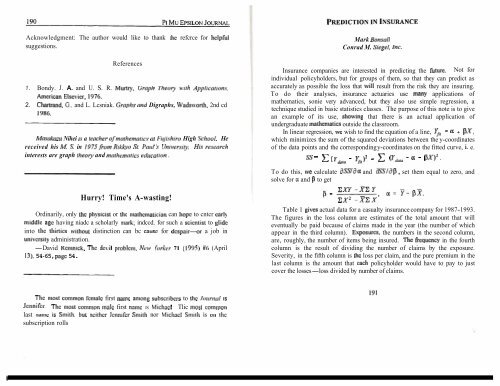
Acknowledgment: The author would like to thank thc refcrce for hclpfulsuggestions.References1. Bondy. J. A. and U. S. R. <strong>Mu</strong>try, Groph Theon) wth Apj~1icalion.v.American Elsevier, 1976.2. Chamand, G., and L. Lcsniak. Grophs ond Digraphs, Wads\vorth, 2nd cd1986.Mo.sokm11 Nihei is a teacher 0Jmathemalic.v fit I+j!/i.vhiro High S'chool. Hereceived his M. $5'. in 1975Jhm Rikhyo St. Pozd '.v Univer.siy, His researchinterests are graph theon) and molhemolics edidcolion, .Hurry! Time's A-wasting!Ordinarily, only thc pliysicist or thc ~iiathcniatician can hopc to cntcr carlymiddle agc having niadc a scholarly mark; indccd. for such a scientist to glidcinto tlic thirtics without distinction can bc causc for dcspair-r a job inunivcrsity administration.-David Rcmnick. Thc dc\-il problc~i~. New Yorker 71 (1995) #6 (April13). 54-65, pagc 54.Mark Bonsa//Conrad M. Siege/, Inc.Insurance companies are interested in predicting the hture. <strong>No</strong>t forindividual policyholders, but for groups of them, so that they can predict asaccurately as possible the loss that will result from the risk they are insuring.To do their analyses, insurance actuaries use many applications ofmathematics, sonie very advanced, but they also use simple regression, atechnique studied in basic statistics classes. The purpose of this note is to givean example of its use, sho~ving that there is an actual application ofundergraduate mathenlatics outside the classroom.In linear regression, we wish to find the equation of a line, 5, = a + p-y,which minimizes the sum of the squared deviations between the y-coordinatesof the data points and the corresponding y-coordinates on the fitted curve, i. e.ss =( ydafo - yfif )2 = (ydola - a - Px)* 'To do this, we calculate dSS/da and 8S/dp, set them equal to zero, andsolve for cz and 0 to getTable 1 gives actual data for a casualty insurance company for 1987-1993.The figures in the loss column are estimates of the total amount that willeventually be paid because of claims made in the year (the number of whichappear in the third column). Exposures, the numbers in the second column,are, roughly, the number of items being insured. The frequency in the fourthcolumn is the result of dividing the number of claims by the exposure.Severity, in the fifth column is thc loss per claim, and the pure premium in thelast column is the amount that cach policyholder would have to pay to justcover the losses-loss divided by number of claims.Thc niost conlnion fc~iialc first name among subscribers to tllc ./oz~rtid ISJcnnifcr, Thc 11<strong>10</strong>st conlnlon 111alc first name IS Micliacl Tlic 11<strong>10</strong>st co~il~iio~ilast name IS S~liitl~. but ncithcr Jcnn~fcr Sni~th nor Micliacl S1ii111is 011 tlicsubscription rolls