MEWAH INTERNATIONAL INC. Unaudited ... - Mewah Group
MEWAH INTERNATIONAL INC. Unaudited ... - Mewah Group
MEWAH INTERNATIONAL INC. Unaudited ... - Mewah Group
- No tags were found...

You also want an ePaper? Increase the reach of your titles
YUMPU automatically turns print PDFs into web optimized ePapers that Google loves.
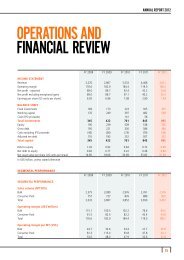
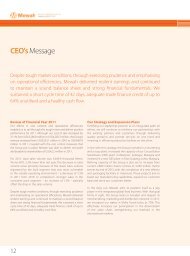
<strong>MEWAH</strong> <strong>INTERNATIONAL</strong> <strong>INC</strong>.(Incorporated in the Cayman Islands. Registration Number: CR-166055)<strong>Unaudited</strong> Financial Statements For The Second Quarter and Half Year Ended 30 June 2011Profit after taxFor Q2 2011, the <strong>Group</strong> achieved a profit after tax of US$5.1 million, 69.4% lower from Q2 2010. For H12011, the <strong>Group</strong> achieved a profit after tax of US$22.3 million, 36.8% lower from US$35.3 million in H12010.Profit after tax attributable to equity holders of the Company was US$6.0 million and US$23.1 millionfor Q2 2011 and H1 2011 respectively (Q2 2010: US$16.5 million and H1 2010: US35.3 million).Balance sheetInventoriesOn 30 Jun 2011, the <strong>Group</strong> had inventories of US$271.1 million representing inventories of 21.2 days(31 Dec 2010: US$244.0 million and 27.1 days respectively).Trade receivablesOn 30 Jun 2011, the <strong>Group</strong> had trade receivables of US$480.1 million representing trade receivables of36.6 days (31 Dec 2010: US$427.1 million and 44.1 days respectively).Trade payablesOn 30 Jun 2011, the <strong>Group</strong> had trade payables of US$218.0 million representing trade payables of 17.1days (31 Dec 2010: US$252.8 million and 28.2 days respectively).Cycle timeOn 30 Jun 2011, cycle time (inventories days add trade receivables days less trade payables days) was40.7 days (31 Dec 2010: 43.0 days).Other receivablesOn 30 Jun 2011, other receivables include US$15.5 million towards advance payments for capitalexpenditure projects (31 Dec 2010: US$9.5).Property, plant and equipmentProperty, plant and equipment increased from US$217.9 million on 31 Dec 2010 to US$258.2 million on30 Jun 2011, mainly as a result of the additions to capital expenditure for acquisition of industrial land inMalaysia, Consumer Pack Project to produce soap and shortening, Westport Expansion Project forexpanding specialty fats plant, Pasir Gudang Expansion project for a new specialty fats plant and SabahRefinery Project for building a new refinery.DebtOn 30 Jun 2011, <strong>Group</strong> borrowings were US$468.8 million giving debt to equity ratio of 0.88 (31 Dec2010: US$326.1 and 0.64 respectively).On 30 Jun 2011, net debt (Borrowings less cash and cash equivalents) was US$282.5 million, giving netdebt to equity ratio of 0.53 (31 Dec 2010: US$110.8 million and 0.22 respectively).15