Demographics Report - Sturgeon County
Demographics Report - Sturgeon County
Demographics Report - Sturgeon County
- No tags were found...
Create successful ePaper yourself
Turn your PDF publications into a flip-book with our unique Google optimized e-Paper software.
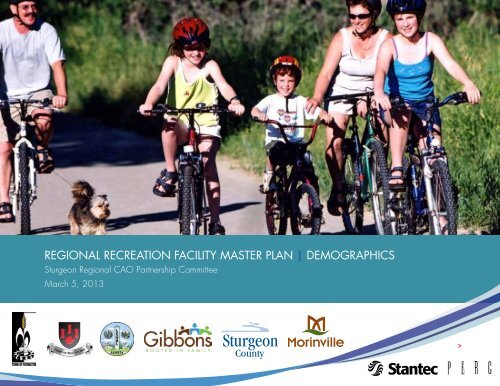
REGIONAL RECREATION facility MASTER PLAN | DEMOGRAPHICS<strong>Sturgeon</strong> Regional CAO Partnership CommitteeMarch 5, 2013
REGIONAL RECREATION FACILITY MASTER PLAN | DEMOGRAPHICS<strong>Sturgeon</strong> Regional CAO Partnership CommitteeTable of Contents01 Introduction............................................................................................. 102 Population and Age Groups.................................................................... 303 Population Growth Projections............................................................ 704 Family and Household Characteristics................................................ 1105 Future Census Releases............................................................................ 15LIST OF TABLESTable 1 Population of Partner Communities and Change 2006 - 2011......................... 3Table 2 Age Group Breakdowns* and Median Age in 2011 by Community................. 4Table 3 Age Group Shifts between 2006 and 2011 Census Periods............................ 5Table 4 Population Projections and Five Year Growth % from 2011 to 2031................. 8Table 5 Dwelling Types in 2011............................................................................ 11Table 6 Household Characteristics by % in 2011..................................................... 12Table 7 Types of Families in the SRP Communities.................................................... 13
REGIONAL RECREATION FACILITY MASTER PLAN | DEMOGRAPHICS<strong>Sturgeon</strong> Regional CAO Partnership Committee101 IntroductionThe following report was prepared to support thedevelopment of the <strong>Sturgeon</strong> Regional Recreation FacilityMaster Plan.The <strong>Sturgeon</strong> Regional Partnership (SRP) consists of sixmunicipalities that lie immediately north of St Albert,Edmonton and Strathcona <strong>County</strong>. The six municipalitiesinclude the towns of Bon Accord, Gibbons, Legal,Morinville and Redwater, as well as <strong>Sturgeon</strong> <strong>County</strong>.Together, the six municipalities had a combined populationof 35,805 in the May 2011 Census, and covered anarea of 2,132.73 sq km. The rural areas and smallunincorporated hamlets of <strong>Sturgeon</strong> <strong>County</strong> contributed2,088.55 sq km to that total, with the remaining 44.18 sqkm distributed between the five incorporated towns.1.1. Demographic Sources and LimitationsThe primary source of demographic data was derived fromStatistics Canada, and in particular the Census counts thatare held every five years. The last Census count occurredin May 2011 and only part of the data has been releasedto date. The information available for this demographicreview includes four releases:1) Population and Dwelling Counts2) Age and Sex3) Families, Households and Marital Status4) Structural Types of Dwellings and Collectives.Demographic data in these areas are provided on a national,provincial - territorial, and municipal and regional level. TheCommunity Profiles for municipalities are particularly useful andare a primary resource for this demographic profile of the sixSRP communities. It should be noted that Statistics Canada hasestimated that the Census count is 3.1% less than the actualpopulation (called the under-coverage estimate). StatisticsCanada provides ongoing quarterly estimates of the populationbetween Census periods, but only on a national and provincial– territorial basis. The April 2012 population estimate forCanada was 34,755,634 for Canada, and 38,447,119 forAlberta.A key challenge is that the Government of Canada eliminatedthe mandatory “Long Form” for the 2011 Census and replacedit with a voluntary long form process. Municipalities acrossCanada expressed their concern that valuable communityinformation on a number of variables may no longer be valid orcomplete. For this reason, data from the 2006 Census will beused to provide community information on a number of topicsincluding: income, immigration and citizenship, and ethnicity.Other sources used in this demographic analysis were theMunicipal Development Plans (MDP) of the six municipalities,projections by the Capital Region Board (CRB), and discussionswith municipal officials on projected growth patterns.
REGIONAL RECREATION FACILITY MASTER PLAN | DEMOGRAPHICS<strong>Sturgeon</strong> Regional CAO Partnership Committee302 Population and Age GroupsTable 1 shows the population in the six municipalities in2011 and 2006 and the shift between the two FederalCensus periods.Table 1 Population of Partner Communities and Change 2006 - 2011Community 2011 Census 2006 Census % Growth 06-11Bon Accord 1,488 1,534 -3.0%Gibbons 3,030 2,642 14.7%Legal 1,225 1,192 2.8%Morinville 8,569 6,775 26.5%Redwater 1,915 2,202 -13.0%*<strong>Sturgeon</strong> <strong>County</strong> 19,578 18,566 5.5%*SRR Partners 35,805 32,911 8.8%Alberta 3,645,257 3,290,350 10.8%*Noted by Statistics Canada that change could be partiallyattributable to boundary change.
4As a whole, the six <strong>Sturgeon</strong> Regional Partners municipalities grewby 8.8%, or 2,984 persons between 2006 and 2011. Four ofthe six communities grew in that period, with the highest growthrate occurring in Morinville at 26.5%. Gibbons (14.7%) alsoexceeded the provincial growth rate of 10.8%. The populationsof Redwater and Bon Accord declined by 287 (-13.0%) and 46(-3.0%) persons respectively over the same period. If the 3.1%undercount projection is applied, the population of the combinedSRP municipalities in 2011 would be closer to 36,915.Redwater Data: There is, however, a concern with the accuracyof the Redwater Census count by Statistics Canada. The Townnoted that there was a significant reduction of 90 private dwellings(and 54 occupied by the usual residents) between 2006 and2011, even though new dwellings had in fact been built, andthere had been no significant losses due to fire or demolition.It is highly unusual for the private dwelling counts to go downeven if the population does. Bon Accord, for example had apopulation reduction of 3% between 2006 and 2011, but still hadan increase of 18 private dwellings. It is likely that a number ofdwellings and their occupants may have been missed or includedwithin <strong>Sturgeon</strong> <strong>County</strong> rather than the Town of Redwater censuscounts. The Town had carried out its own municipal census in June2010 and had a population count of 2,081 or 166 more peoplethan in the 2011 Census. The Town also received responses from867 dwellings, (a further 56 did not respond and two refused), asopposed to the 844 dwelling count noted by Statistics Canada.While the Statistics Canada data for Redwater will still be usedin this demographic analysis, it is likely that the 2011 Redwaterpopulation was closer to 2,100 persons. This would mean that the2006-2011 population drop was closer to 102 persons than 287,and to -4.6% than -13.0%.Table 2 provides age group breakdowns and median ages of the<strong>Sturgeon</strong> Regional Partnership communities.Table 2 Age Group Breakdowns* and Median Age in 2011 byCommunity*It should be noted that agegroup counts are rounded to thenearest 5, so actual numbers mayvary slightly.Community 0-14 YEARS 15-24 YEARS 25-44 YEARS 45-64 YEARS 65+ YEARSBon Accord 335(22.5%)Gibbons 720(23.8%)Legal 290(23.7%)Morinville 1,885(22.0%)Redwater 320(16.7%)<strong>Sturgeon</strong> <strong>County</strong> 4,050(20.7%)190(12.8%)405(13.4%)160(13.1%)1,180(13.8%)260(13.6%)2,855(14.6%)460(30.9%)970(32.0%)345(28.2%)2,735(31.9%)440(23.0%)4,765(2 4.3%)415(27.9%)700(23.1%)295(24.1%)2,085(24.3%)585(30.5%)5,990(30.6%)80(5.4%)235(7.8%)145(11.8%)685(8.0%)305(15.9%)1,920(9.8%)MedIANAge33.8 years32.9 years34.4 years32.8 years42.2 years38.4 yearsAlberta Percentages 18.8% 13.6% 29.7% 22.3% 11.1% 36.5 years
REGIONAL RECREATION FACILITY MASTER PLAN | DEMOGRAPHICS<strong>Sturgeon</strong> Regional CAO Partnership Committee5With the exception of Redwater (16.7%), the other five SRPcommunities had a higher proportion of children aged birth to14, (ranging from 20.7% to23.8%) than the province of Alberta(18.8%). Alberta’s median age of 36.5 years, (the lowest of the tenprovinces and far below the 41.5 years for Canada as a whole),was exceeded only by Redwater (42.2 years) and <strong>Sturgeon</strong><strong>County</strong> (38.4 years). The other four communities ranged from 32.8to 34.4 years. Redwater had the highest older adult population(65+) of the SRP communities at 15.9%. In comparison, Albertahad 11.1% and Canada 14.8%.Redwater Data: The 2010 Town of Redwater census count useddifferent age categories, but had a count of 424 children aged0-15, which is higher than the Census (age 0-14) count of 320.Besides the inclusion of 15 year olds in the Town census, thedifference may be due to children living in the dwellings apparentlymissing in the 2011 Census. If an estimated thirty 15 year olds areremoved, the 0-14 child population in Redwater would be closerto 395 than 320, and the proportion of the projected 2,100 totalpopulation would be 18.8%, the same as the Alberta’s.Table 3 shows the shifts in the age groups in the SRP communities inthe period between the 2006 and 2011 Census. Both the actualnumbers and the percentage changes are provided for each agegroup.Table 3 Age Group Shifts between 2006 and 2011 Census PeriodsCommunity 0-14 YEARS 15-24 YEARS 25-44 YEARS 45-64 YEARS 65+ YEARSBon Accord385 (06) to215 (06) to 480 (06) to 460 390 (06) to 415 (11) 60 (06) to335 (11) (-13.0%) 190 (11) (-11.6%) (11) (-4.2%)(+6.4%) 80 (11) (+33.3%)Gibbons 660 (06) to 720(11) (+9.1%)Legal 300 (06) to 290(11) (-3.4%)Morinville 1,520 (06) to 1,885(11) (+24.0%)Redwater 435 (06) to 320(11) (-26.4%)<strong>Sturgeon</strong> <strong>County</strong> 3,940 (06) to 4,050(11) (+2.8%)SRP Totals 7,240 (06) to 7,600(11) (+5.0%)330 (06) to 405(11) (+22.7%)145 (06) to 160(11) (+10.3%)1,080 (06) to 1,180(11) (+9.3%)285 (06) to 260(11) (-8.8%)2,790 (06) to 2,855(11) (+2.3%)4,845 (06) to 5,050(11) (+4.2%)890 (06) to 970(11) (+9.0%)350 (06) to345 (11) (-1.4%)2,010 (06) to 2,735(11) (+36.1%)575 (06) to 440(11) (-23.5%)5,020 (06) to 4,765(11) (-5.1%)9,325 (06) to 9,715(11) (+5.2%)585 (06) to 700 (11)(+19.7%)270 (06) to 295 (11)(+9.3%)1,715 (06) to 2,085(11) (+21.6%)605 (06) to 585 (11)(-3.4%)5,295 (06) to 5,990(11) (+13.1%)8,860 (06) to 10,070(11) (+13.7%)175 (06) to 235(11) (+34.3%)135 (06) to 145(11) (+7.4%)540 (06) to 685(11) (+26.9%)285 (06) to 305(11) (+7.0%)1,590 (06) to 1,920(11) (+20.8%)2,785 (06) to 3,370(11) (+21.0%)
6All six communities saw the age 65+ population grow, either asindividuals living in the community moved to the next cohort, oradditional older adults moved into the community. The fast growingcommunities of Morinville and Gibbons showed positive growthin all age categories, while no or slow growth communities,especially Bon Accord and Redwater, showed reductions in agegroups lower than 45 years of age. The most dramatic growth inany age category occurred in the 25-44 age group in Morinvillewhich increased by 36.1%. This signifies an inflow of youngfamilies into the community from outside. The only other communityto show growth in this area was Gibbons at 5.2%.
REGIONAL RECREATION FACILITY MASTER PLAN | DEMOGRAPHICS<strong>Sturgeon</strong> Regional CAO Partnership Committee703 Population Growth ProjectionsAll communities of 3,500 persons in Alberta have tocomplete a Municipal Development Plan or MDP. WhileMorinville and <strong>Sturgeon</strong> <strong>County</strong> have completed a MDPas required, the other four communities, (Bob Accord,Gibbons, Legal and Redwater), have also developed aMDP even though not required to do so.In terms of future population projections, only Morinville hasincluded their own projections in their MDP which reflectthe CRB projections after correcting the base population;;the other communities primarily rely on projections carriedout by the Capital Regional Board (CRB). The CRBprojections, however, are identical for all five towns inthe <strong>Sturgeon</strong> Regional Partnership in spite of some verydifferent growth patterns between the communities. Assuch, their projections represent the CRB’s “desired growthpatterns” for communities outside of the Edmonton’s urbanarea. The CRB uses annual growth projections of 1.7%to 2014, 1.4% to 2019, 1.1% to 2029, and then 1.5%to 2044. The CRB used different growth predictions for<strong>Sturgeon</strong> <strong>County</strong> of 0.5% (2014), 1,7% (2019), 2,3%(2029), and 1.1% (2044). In this section, populationgrowth will be predicted for the Census dates of 2016,2021, 2026, and 2031. The predictions are based onthe current growth patterns and likely future growth trends.Table 4 provides the population growth projections for thesix <strong>Sturgeon</strong> Regional partnership communities betweenCanada Census periods. The projected population countsand the percent growth from the previous Census periodsare provided for each community. The 2011 Redwaterpopulation is based on the Town’s 2010 census count.It should be noted that the percent growth estimates arebased on growth over the five year period, using annualgrowth predictions. For example, Morinville grew 26.5%between 2006 and 2011. Because growth is cumulative,Morinville’s annual growth was approximately 4.8% duringthat period.
8Table 4 Population Projections and Five Year Growth % from 2011 to 2031Community2011Pop. %Growth2016Pop. %Growth2021Pop. %Growth2026 Pop.% Growth2031Pop. %GrowthBon Accord 1,488(-3.0%)1,525(2.5%)1,610(5.6%)1,700(5.6%)1,795(5.6%)Gibbons 3,030(14.7%)3,480(14.9)3,995(14.8%)4,585(14.8%)5,185(13.1%)Legal 1,225(2.8%)1,255(2.5%)1,325(5.6%)1,400(5.6%)1,480(5.6%)Morinville 8,569(26.5%)9,600(12.0%)10,455(8.9%)11,350(8.6%)12,350(8.8%)Redwater 2,100*(-4.6%)2,210(5.2%)2,430(10.1%)2,750(14.4%)3,020(9.8%)<strong>Sturgeon</strong><strong>County</strong>19,578(5.5%)20,860(6.6%)22,960(10.1%)25,725(12.0%)28,095(9.2%)*Statistics Canada identified the 2011 population of Redwater at1,915, a decline of 13.0% from 2006.Bon AccordBon Accord will likely reverse the small 2006-2011 populationloss and have slow growth between 2011 and 2016. This isdependent, however, on the current efforts to attract commercialemployers and/or an observatory to the community. Some interesthas been expressed by developers in the areas to the east andnortheast of the Town. Between 2016 and 2031, the CRB annualgrowth projection of 1.1% has been applied. This is dependent onattracting new commercial, continued developer interest, ongoingattraction of CFB Edmonton personnel, and potentially attractingsome population from the new NW Upgrader project.GibbonsThe town will continue to grow at the current annual pace of 2.8%until at least 2026. This growth has occurred in the south areas ofthe town. It is an attractive community and is well positioned toattract staff working at the new NW Upgrader plant. The additionof the new cultural centre under construction will be an asset inattracting new residents. In addition to the continued expansion ofhousing in the south of Gibbons, the <strong>Sturgeon</strong> River Valley to theeast will be a prime attractor for residential development.
REGIONAL RECREATION FACILITY MASTER PLAN | DEMOGRAPHICS<strong>Sturgeon</strong> Regional CAO Partnership Committee9LegalLegal will likely experience continued slow growth of approximately0.5% annually until 2016, and then the 1.1% annual growthprojected by the CRB until 2031. The Francophone character andheritage of the community, as well as the potential new Frenchschool, will continue to attract French speaking personnel from CFBEdmonton.MorinvilleThe Town had high growth between 2006 and 2011 of 26.5%or 4.8% annually. The Town has recently adopted a new MDPthat reflects a more modest pace than what occurred over the lastfive years. These growth rates have been adjusted to capture anaccurate base population and have been approved by the CRB.The Town predicted 2.3% growth to 2014, followed by 1.9% to2019, then to 1.5% until 2029 before rebounding to 2.0% to2044. These projections are used in Table 4. A number of newresidential growth areas have been identified in Morinville toaddress future growth needs. The new Cultural Centre and newlibrary will serve as continuing attractors for the community.<strong>Sturgeon</strong> <strong>County</strong>The highest growth area is in <strong>Sturgeon</strong> Valley which has a currentpopulation of 3,500. The other major community is Cardiff witha population of 1,100. A significant issue for the <strong>County</strong> is thestance taken by the CRB recently in denying a sub-division proposalfor Villeneuve. The hamlet currently has 225 people but has thepotential to be a major growth area; Villeneuve could reach 1,500people within 20 years. <strong>Sturgeon</strong> <strong>County</strong> had modest growthof 5.5% between 2006 and 2011. Its future growth could belimited to the CRB identified growth patterns if these are used ascontrols and not as guidelines. The population predictions identifiedfor <strong>Sturgeon</strong> region adhere to the CRB guidelines, but growthprojects in <strong>Sturgeon</strong> Valley and Villeneuve would cause these tobe exceeded. By 2031, the population of <strong>Sturgeon</strong> <strong>County</strong> isestimated at 28,095, based on CRB population forecasts.RedwaterThe NW Upgrader project will have an impact on the populationof several communities including Redwater, Ft. Saskatchewanand Gibbons. Redwater will begin to grow again by 2013, andthen increase annually by 1.9% from 2016 to 2021. Growthwill accelerate to 2.5% annually between 2021 and 2026 withan approximate population of 2,750. Annual growth will thenlikely slow to 1.9%. The Cultural Center and entire Pembina Placecomplex will serve as an attractor for new residents, along with theoutdoor pool and golf course.
10+ credit: Jay Procktor Photography
REGIONAL RECREATION FACILITY MASTER PLAN | DEMOGRAPHICS<strong>Sturgeon</strong> Regional CAO Partnership Committee1104 Family and Household CharacteristicsThe 2011 Census showed a number of household, familyand dwelling characteristics for the six communities withinthe <strong>Sturgeon</strong> Regional Partnership.Many of these reflect the same shifts that have beenoccurring nationally, including a greater diversity ofhousehold and family types. Table 5 provides an overviewof the dwelling characteristics by community, (note thatdwelling numbers are rounded to 5).As expected, single detached dwellings are thepredominant housing form throughout the <strong>Sturgeon</strong>Regional Partnership communities and account for 85% ormore of all the communities outside or Morinville (76%).Morinville has the most diverse mix of housing with thehighest proportion of apartment dwellers and those livingin other types of multi-family units. Table 6 shows thehousehold characteristics for the private dwellings in the sixPartnership communities.Table 5 Dwelling Types in 2011Community Total Dwellings Single Detached ApartmentsOther Multi-Family MoveableUnitsDwellingsBon Accord 540 465 (86.1%) 0 65 (12.0%) 15 2.8%Gibbons 1,075 955 (88.8%) 35 (3.3%) 35 (3.3%) 50 (4.7%)Legal 440 395 (89.8%) 5 (1.1%) 40 (9.1%) 0Morinville 3,080 2,335 (75.8%) 245 (8.0%) 430 (14.0%) 70 (2.3%)Redwater 775 655 (84.5%) 35 (4.5%) 50 (6.5%) 30 (3.9%)<strong>Sturgeon</strong> <strong>County</strong> 6,545 5,745 (87.8%) 0 310 (4.7%) 490 (7.5%)
12Table 6 Household Characteristics by % in 2011CommunityCouplesCouples withLone Parent One PersonwithoutChildrenHouseholds HouseholdsChildrenOther Types *Bon Accord 38.0% 28.7% 7.4% 16.7% 9.2%Gibbons 39.1% 25.5% 8.4% 18.6% 8.4%Legal 35.6% 26.4% 9.2% 21.8% 6.9%Morinville 37.5% 26.9% 7.6% 17.5% 10.4%Redwater 26.5% 29.0% 7.7% 27.1% 9.7%<strong>Sturgeon</strong> <strong>County</strong> 42.4% 33.0% 4.6% 12.3% 7.7%*Other Types includes other forms of shared accommodation.The households refer to the number of private dwellings in eachcategory as opposed to the number of individuals living in eachsetting. The <strong>County</strong> has the highest proportion of couples (marriedor common law), and with or without children. This reflects itsrural nature of many of its areas, along with the more affluentfamilies living in near-urban <strong>Sturgeon</strong> Valley. The <strong>County</strong> also haslowest proportion of both lone-parent and one person households.Redwater has the highest proportion of one person households,likely to some degree as a result of having workers from nearbyindustrial operations living in the community. Other than thesedifferences, the household proportions are similar across the sixcommunities.
REGIONAL RECREATION FACILITY MASTER PLAN | DEMOGRAPHICS<strong>Sturgeon</strong> Regional CAO Partnership Committee13Table 7 provides an overview of the types of families in thesix <strong>Sturgeon</strong> Partnership communities in 2011 in terms of thebreakdown between married, common-law and lone-parentfamilies.Table 7 Types of Families in the SRP CommunitiesCommunity # of Families Married Common-law Lone-ParentBon Accord 440 310 (70.5%) 80 (18.2%) 50 (11.4%)Gibbons 855 605 (70.8%) 145 (17.0%) 110 (12.9%)Legal 345 255 (73.9%) 45 (13.0%) 45 (13.0%)Morinville 2,470 1,780 (72.1%) 365 (14.8%) 330 (13.4%)Redwater 545 365 (67.0%) 100 (18.3%) 85 (15.6%)<strong>Sturgeon</strong> <strong>County</strong> 5,740 4,725 (82.3%) 585 (10.2%) 430 (7.5%)Alberta 999,530 719,360(72.0%)135,660(13.6%)144,510(14.5%)The profiles of the SRP communities are similar to Alberta as awhole, with the possible exception of <strong>Sturgeon</strong> <strong>County</strong> wherecommon-law and lone-parent families are less common. Theproportion of common-law families in Alberta at 13.6% bycomparison, is far lower than in Quebec where common-lawfamilies account for 31.5%.
14+ credit: Jay Procktor Photography
REGIONAL RECREATION FACILITY MASTER PLAN | DEMOGRAPHICS<strong>Sturgeon</strong> Regional CAO Partnership Committee1505 Future Census ReleasesAs stated in the introduction, the 2011 Census has onlyhad four releases and the available data is presented insections 2, 3 and 4. Future releases will be far less reliablebecause the compulsory Long Form Census was eliminatedfor 2011, and those responding voluntarily will likely notbe representative of the total population in communities.This includes income data, education levels, immigrationand ethnicity, mobility, and occupation and workplacecommunity data.
Stantec Consulting Ltd.400 - 655 Tyee RoadVictoria BC | V9A 6X5


