Predicting and Improving Dental Productivity - NNOHA.org : National ...
Predicting and Improving Dental Productivity - NNOHA.org : National ...
Predicting and Improving Dental Productivity - NNOHA.org : National ...
You also want an ePaper? Increase the reach of your titles
YUMPU automatically turns print PDFs into web optimized ePapers that Google loves.
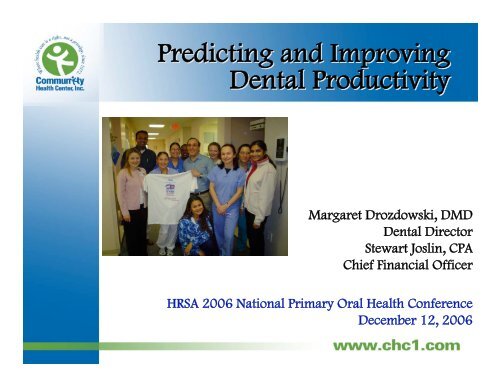
<strong>Predicting</strong> <strong>and</strong> <strong>Improving</strong><br />
<strong>Dental</strong> <strong>Productivity</strong><br />
Margaret Drozdowski, DMD<br />
<strong>Dental</strong> Director<br />
Stewart Joslin, CPA<br />
Chief Financial Officer<br />
HRSA 2006 <strong>National</strong> Primary Oral Health Conference<br />
December 12, 2006
Today’s Today s Objectives<br />
• Identify the factors that were used in the<br />
model to predict dental provider<br />
productivity using a linear regression<br />
model<br />
• Recognize how to select a c<strong>and</strong>idate that<br />
has a higher probability of being a<br />
productive asset<br />
• Recognize how open access scheduling <strong>and</strong><br />
other innovations can affect the dynamics<br />
of access to dental services
CHC Mission Statement<br />
Since 1972<br />
Community Health Center is a private, non-profit agency<br />
providing primary health care <strong>and</strong> social services.<br />
Its’ quality health care services are available to all, <strong>and</strong><br />
particularly to those who cannot gain access to such services<br />
elsewhere. The Community Health Center takes leadership in<br />
promoting interagency cooperation. It is based on consumer<br />
control <strong>and</strong> is committed to ensuring human rights <strong>and</strong><br />
respecting human dignity; as such, it<br />
strives to be a voice <strong>and</strong> vehicle<br />
for social change.
• Medical<br />
– Pediatrics<br />
– Internal medicine<br />
– Family practice<br />
– Family planning<br />
– Breast <strong>and</strong> Cervical Cancer Early<br />
Detection Program<br />
– Asthma management program<br />
– Prenatal program<br />
– Maternal-Infant program<br />
• <strong>Dental</strong><br />
– Preventative<br />
– Restorative<br />
– Emergency<br />
– Mobile dentistry in schools<br />
– Endodontics<br />
– Oral Surgery<br />
– Prosthetics<br />
Services We Provide<br />
• Behavioral Health<br />
– Children<br />
– Adults<br />
– Families<br />
• School Based Health Centers<br />
– Medical<br />
– Behavioral Health<br />
– <strong>Dental</strong> HIV/AIDS<br />
– AIDS/HIV Services<br />
– Medical, behavioral, social<br />
• Domestic Violence Services<br />
– Domestic Violence Services<br />
– Battered Women’s Shelter<br />
• Community Contributions<br />
– Vinnie’s Jump & Jive<br />
– HomeRoom after school program<br />
– Family Wellness Center
CHC <strong>Dental</strong> Clinic<br />
Background<br />
• 8 Towns: exp<strong>and</strong>ing to 3 additional towns in 2007<br />
• Mobile sites<br />
– New London: 13 schools<br />
– New Britain: 10 schools <strong>and</strong> NBHS<br />
– Meriden: 12 schools, OB clinic, Head Start<br />
– Middletown<br />
– Stamford: Head Start <strong>and</strong> WIC<br />
– Norwalk: 2 Head Start Centers<br />
• 13 FTE dentists<br />
• 9 FTE hygienists<br />
• 31 chairs
Dentistry At CHC<br />
�Quantity: 52,000 dental visits annually at CHC<br />
�Quality: All CHC dentists have completed general<br />
practice residencies, practice full scope dentistry,<br />
<strong>and</strong> participate in ongoing peer review <strong>and</strong><br />
performance improvement activities<br />
�Comprehensive: We believe that extracting a tooth<br />
represents a failure of prevention. CHC staff make<br />
all efforts to save a tooth, including endodontics<br />
on–site.
What is the scope?<br />
• Basic restorative for all ages<br />
• Oral surgery<br />
• Endodontics<br />
– Including molar endodontic treatment<br />
– PT endodontist on staff<br />
– GP utilize rotary instrumentation<br />
• Prosthetics<br />
– Crown <strong>and</strong> Bridge<br />
– Full <strong>and</strong> partial dentures<br />
• Pediatric dentistry<br />
– FT pediatric dentist on staff
Challenges In Dentistry<br />
� Dentistry is a specialized, high risk service, expensive to<br />
deliver.<br />
� Infection control procedures alone are very costly<br />
� Lab fees regularly run hundreds of dollars per prosthesis<br />
� Pediatric dentistry sometimes requires Operating Room<br />
intervention, with general anesthesia…scarce service<br />
<strong>and</strong> long waiting times<br />
� Specialty care, such as endodontics; very difficult to<br />
access…<br />
� Patients need a dental home—with continuity,<br />
coordination, <strong>and</strong> access—just like they need a medical<br />
home.
CHC Responses To The Problem<br />
Macro level look<br />
� Exp<strong>and</strong>ed dental capacity: CHC expansion efforts<br />
� Maximize existing clinical space usage<br />
� Addition of specialists<br />
� Development of mobile dentistry capacity <strong>and</strong> role of care<br />
coordinator across locales<br />
� Partnership with UCONN School of <strong>Dental</strong> Medicine, CT<br />
Health Foundation, <strong>and</strong> others<br />
� Daily <strong>Productivity</strong>, capacity <strong>and</strong> utilization monitoring<br />
� Implementation of Advanced Access Scheduling Public-<br />
Private Partnerships<br />
� Priority focus on children’s dental health
What we tried to accomplish with this<br />
model besides the objectives<br />
Micro level look<br />
• Identify the factors that were used in the model to predict dental<br />
provider productivity<br />
• Recognize how to select a c<strong>and</strong>idate that has a higher probability of<br />
being a productive asset<br />
• Recognize how open access scheduling <strong>and</strong> other innovations can<br />
affect the dynamics of access to dental services<br />
• <strong>Dental</strong> is always budgeted to lose money (drives me crazy!!!)<br />
• Look for opportunities to improve productivity<br />
• In order to attempt to decrease the shortfall you first need to<br />
underst<strong>and</strong> why you have one in the first place<br />
• The answer is not that we need to work harder, but that we need to<br />
work smarter<br />
• Need to find the special mix of procedures/provider ratio to<br />
maximize our efforts<br />
• All we need to do is break even <strong>and</strong> hopefully make a little profit…
Definition<br />
Linear Regression<br />
A technique in which a straight line is fitted to a set<br />
of data points to measure the effect of a single<br />
independent variable. The slope of the line is the<br />
measured impact of that variable.<br />
The steeper the slope the more impact a variable has<br />
on the X value.<br />
The sign of the slope reveals if the variable has a<br />
positive or negative effect on the X value.
Our Linear Regression model<br />
answers the question: what factors effect<br />
the productivity of a dental provider?<br />
• Factors tested<br />
– Panel size<br />
– Continuity rate<br />
– NS rate<br />
– RVU/visit<br />
– Years since graduation<br />
• Data Collection<br />
– 2 separate 18 month periods<br />
– All five measures collected from centricity billing system<br />
– Mathematically equalized each provider to FTE<br />
• Our expectations<br />
– “Experienced providers with stable patient panels <strong>and</strong> low no<br />
show rate are more productive”
Motivation for creating a linear<br />
regression model<br />
• Numerical representation of provider behavior as explained<br />
by various variables<br />
• Which variables are actually controllable by admin<br />
processes <strong>and</strong> front desk functions?<br />
– panel size<br />
– continuity rate<br />
– provider clinical experience<br />
– no show rate<br />
– RVU per visit<br />
• beyond the financial benefits to the health center: patient<br />
care improved<br />
– completed <strong>and</strong> expedited treatment,<br />
– better patient flow, <strong>and</strong><br />
– less under utilized time as with a no show rate.
• Panel<br />
Variable definitions<br />
– the number of patients who over a period of 18<br />
months have seen a particular provider the<br />
majority of the time<br />
– Measure of “quantity”<br />
– relatively unused measure<br />
• Continuity rate<br />
– the percentage of time a patient was seen by<br />
their primary provider<br />
– Measure of “quality”
Variable definitions cont… cont<br />
• Years since graduation<br />
– a positive relationship on productivity<br />
– threshold number of 5 years post graduation<br />
• No Show rate<br />
– a low no show rate is indicative of patient compliance <strong>and</strong> adherence<br />
to treatment plans<br />
– the number of appointments that were broken by the patient as a<br />
percentage of their total productivity.<br />
• Average RUV/visit or panel stratification<br />
– the amount of relative value units (RVU) delivered by the provider per<br />
each visit delivered<br />
– st<strong>and</strong>ard units assigned to each ADA procedure codes<br />
– complexity or panel stratification<br />
In this sample, the RVU/visit, ranged from 1.80 to 3.52, for providers<br />
who differed in experience by 25 years
What we expect from our<br />
• FTE Equivalent dentist 3200 visits/yr<br />
– Roughly translates into 14 pt encounters/day<br />
– 30 minute slots in a 8.5 hr day<br />
– All slots are equal*<br />
– “catch up” time at the end of the day<br />
• FTE hygienist 2100 visits/yr<br />
– 30/60 or 40 slots (more variability based on local<br />
practice factors)<br />
• Preset templates<br />
• Daily measures to access available slots,<br />
percentage utilization against capacity<br />
• Not all providers <strong>and</strong> all visits are equal<br />
providers
Factors effecting individual<br />
productivity<br />
• “global” factors: each provider has to deal with them<br />
– NS rate when we have a heavy snow fall or the first nice day<br />
in the spring<br />
– Front desk efficiency in filling open/cancelled slots<br />
– Admin support/expectations<br />
• “individual <strong>and</strong> intangible” factors<br />
– Provider tenure, yrs of experience<br />
– Yrs with CHC<br />
– FT vs PT status<br />
– Personality traits<br />
– Language ability<br />
– Actual procedures performed reflected in RVU/visit count<br />
– Panel size
Linear regression table<br />
Regression Statistics on Combined Periods<br />
• Multiple R 0.79<br />
• R Square 0.62<br />
• Adjusted R Square 0.57<br />
• St<strong>and</strong>ard Error 424.80<br />
• Observations 40.00
SUMMARY OUTPUT<br />
Regression Statistics<br />
Multiple R 0.79<br />
R Square 0.62<br />
Adjusted R Square 0.57<br />
St<strong>and</strong>ard Error 424.80<br />
Observations 40.00<br />
ANOVA<br />
df SS MS F<br />
Regression 5.00 10,069,783 2,013,957 11.16<br />
Residual 34.00<br />
Total 39.00<br />
Coefficients<br />
Intercept 1,741.31<br />
Panel 0.58<br />
Continuity (1,836.22)<br />
N/S rate (total n/s / Raw Prod) (1,295.16)<br />
Avg RVU per visit 862.23<br />
Years Since Grad (14.35)<br />
Regression Summary Output<br />
6,135,370<br />
16,205,153<br />
St<strong>and</strong>ard<br />
180,452<br />
Significance<br />
F<br />
0.00<br />
Error t Stat P-value Lower 95% Upper 95%<br />
966.84 1.80 0.0806 (223.54) 3,706.16<br />
0.15<br />
1,286.36<br />
496.44<br />
234.22<br />
11.94<br />
3.88<br />
(1.43)<br />
(2.61)<br />
3.68<br />
(1.20)<br />
0.0005<br />
0.1626<br />
0.0134<br />
0.0008<br />
0.2375<br />
0.28<br />
(4,450.41)<br />
(2,304.05)<br />
386.23<br />
(38.61)<br />
0.89<br />
777.97<br />
(286.27)<br />
1,338.22<br />
9.91<br />
Lower<br />
95.0%<br />
(223.54)<br />
0.28<br />
(4,450.41)<br />
(2,304.05)<br />
386.23<br />
(38.61)<br />
Upper<br />
95.0%<br />
3,706.16<br />
0.89<br />
777.97<br />
(286.27)<br />
1,338.22<br />
9.91
4,000<br />
3,500<br />
3,000<br />
2,500<br />
2,000<br />
1,500<br />
1,000<br />
multivariate chart: relatively flat…<br />
62% predictability<br />
500<br />
-<br />
Residual Output of the Five Variables<br />
- 10 20 30 40 50<br />
Final Results<br />
Residuals<br />
Linear<br />
(Residuals)
Results <strong>and</strong> interpretation<br />
• All data collected from two time periods was<br />
combined<br />
• All observations were then grouped together <strong>and</strong><br />
analyzed with linear regression in a combined<br />
periods regression analysis.<br />
• The R square is .62, meaning that 62% of the<br />
variation in the productivity of the dentist can be<br />
explained by the five explanatory variables.<br />
• Only two variables had statistically significant pvalues<br />
<strong>and</strong> st<strong>and</strong>ard error: panel size <strong>and</strong> average<br />
RVU/visit.
• Panel size: POSITIVE<br />
Results in a nutshell… nutshell<br />
• Continuity rate: flat slope<br />
• N/S rate: NEGATIVE<br />
• Experience: POSITIVE<br />
• RVU/Visit: POSITIVE
Panel Size <strong>and</strong> <strong>Productivity</strong><br />
•Strong positive relationship<br />
•If we keep a stable panel, our providers do better<br />
•Be careful, how you assign a panel because of hygiene<br />
visits only<br />
1800<br />
1600<br />
1400<br />
1200<br />
1000<br />
800<br />
600<br />
400<br />
200<br />
0<br />
Panel Size <strong>and</strong> <strong>Productivity</strong><br />
- 1,000 2,000 3,000 4,000<br />
Panel<br />
Linear<br />
(Panel)
100%<br />
90%<br />
80%<br />
70%<br />
60%<br />
50%<br />
Continuity Rate <strong>and</strong> Provider <strong>Productivity</strong><br />
- 1,000 2,000 3,000 4,000<br />
Continuity Rate<br />
•Measure of “quality”<br />
•Very little effect on productivity: Surprising result!<br />
Continuity<br />
Linear<br />
(Continuity)
120%<br />
100%<br />
80%<br />
60%<br />
40%<br />
20%<br />
0%<br />
N/S rate effect on provider productivity<br />
- 1,000 2,000 3,000 4,000<br />
No Show Rate<br />
•High no show rate is BAD no matter how you look at it!<br />
•Low no show rate = better patient compliance & Tx plan<br />
adherence<br />
•Fairly strong negative relationship<br />
N/S rate<br />
(total n/s /<br />
Raw Prod)<br />
Linear (N/S<br />
rate (total<br />
n/s / Raw<br />
Prod))
30<br />
25<br />
20<br />
15<br />
10<br />
5<br />
0<br />
Years since graduation <strong>and</strong> <strong>Productivity</strong><br />
- 1,000 2,000 3,000 4,000<br />
Years Since Graduation<br />
•positive relationship on productivity<br />
•appears to be a threshold of 5 years post graduation where little<br />
additional effect on productivity is seen<br />
Years<br />
Since<br />
Grad<br />
Linear<br />
(Years<br />
Since<br />
Grad)<br />
14<br />
12<br />
10<br />
8<br />
6<br />
4<br />
2<br />
0<br />
12 yrs of less since Graduation <strong>and</strong> <strong>Productivity</strong><br />
- 1,000 2,000 3,000 4,000<br />
Years<br />
Since<br />
Grad<br />
Linear<br />
(Years<br />
Since<br />
Grad)
3.50<br />
3.00<br />
2.50<br />
2.00<br />
1.50<br />
1.00<br />
0.50<br />
-<br />
RVU per vist <strong>and</strong> provider productivity<br />
- 1,000 2,000 3,000 4,000<br />
Avg RVU<br />
per visit<br />
Linear<br />
(Avg RVU<br />
per visit)<br />
RVU Impact<br />
•RUV/visit was expected to have a negative relationship<br />
•complexity or panel stratification<br />
•positive relationship between provider productivity <strong>and</strong> RVU’s attained per<br />
visit<br />
• RVU analysis details the complexity of procedures<br />
•Coupled with encounter counts provides a better insight into the true<br />
productivity<br />
In this sample, the<br />
RVU/visit, ranged<br />
from 1.80 to 3.52,<br />
for providers who<br />
differed in<br />
experience by 25<br />
years
• Obtain the “best possible” hire<br />
• Optimize the panel size<br />
• Minimize the NS rate<br />
How do we now use this<br />
• Monitor RVU/Visit in addition to visit<br />
count…know what your docs are doing<br />
information…<br />
information<br />
• don't limit the procedures that the dentist can<br />
do…keep them interested in working, happy<br />
dentist * = productive dentist<br />
*employee satisfaction…
Further analysis… analysis<br />
• Strip out the outliers<br />
• Looks for other tangible variables<br />
– Additional data points needed<br />
– Increased length of time?<br />
• Examine intangible variables: 38%<br />
– Personality<br />
– Language ability<br />
– Special skills<br />
– Special interests<br />
• Local factors in each community<br />
– Different towns = different communities with different needs<br />
– What if any is the effect on provider productivity<br />
– Mobile vs permanent sites<br />
• Prospective analysis of each provider hired against predicted<br />
productivity
• Advanced Access<br />
• Physical flow of patients<br />
• Instrumentation changes<br />
• Increased Use of Specialists<br />
• Monitoring <strong>and</strong> Reporting<br />
Techniques to improve<br />
efficiency/productivity
Physical Flow of Patients<br />
• Floater DA’s<br />
• Created DA “schedule” 30 min ahead of<br />
DMD schedule to allow for more efficient<br />
pt intake, FMX films HAS ISSUES<br />
• At least 2 ops per dentist<br />
• If possible 2 ops for RDH, floater helps with<br />
films, ect<br />
• Lab cases recalled
• Improved patient satisfaction<br />
Specialists<br />
• Able to keep patient care “in-house”<br />
• Endodontist: complicated rcts are done<br />
more efficiently by specialist than GP, so<br />
GP has more slots for other procedures<br />
• Pediatric dentist<br />
• Externship in oral surgery
Instrumentation<br />
• Rotary endo <strong>and</strong> obturation systems<br />
• Cavitrons for hygienists<br />
• Busy offices have duplicate<br />
equipment; autoclave <strong>and</strong> film<br />
processor to improve efficiency<br />
• Centralized equipment processing<br />
• Use of cassettes
Principles Of Advanced<br />
Access<br />
• Dem<strong>and</strong> for appointments is fixed <strong>and</strong> predictable<br />
• Match your daily dem<strong>and</strong> for visits with appropriate supply of<br />
providers<br />
• >75% of patients will be delighted with a “same-day”<br />
appointment when offered<br />
• Schedule patients on or near the same day whenever possible<br />
• Patients should see their own provider whenever possible<br />
• Patients have a right to determine if <strong>and</strong> when they need to see a<br />
healthcare provider<br />
• Active (hour by hour) template management<br />
• Clear contractual agreements on clinical hours <strong>and</strong> schedules<br />
• Daily feedback<br />
– capacity, dem<strong>and</strong>, utilization
Groundwork for Advanced<br />
• Dem<strong>and</strong> study: How many requests for visits per day?<br />
• Adjust schedules, FTEs to match supply with dem<strong>and</strong><br />
• Cross train staff to focus on phones in the am<br />
Access<br />
• Start putting patients in recall instead of booking out beyond “go-<br />
live” date<br />
• Meriden <strong>Dental</strong> March 2004<br />
• New London <strong>Dental</strong> August 2004<br />
• Middletown <strong>Dental</strong> November 2004<br />
• New Britain <strong>Dental</strong> January 2005<br />
• Old Say Brook <strong>Dental</strong> February 2005<br />
• Stamford <strong>Dental</strong> mid 2007
How Does Advanced<br />
Access Work?<br />
• Patients are encouraged to schedule appointments on<br />
the day they want to be seen, or within 24-48 hours<br />
• After each visit, patients given a reminder card for<br />
follow up, <strong>and</strong> asked to call on or around the day the<br />
provider wants them back<br />
• Patients recalled if they don’t do so: particularly<br />
important in lab cases<br />
• Appointments rarely scheduled out further than<br />
1-2 weeks
The New System<br />
• Advanced Access<br />
- the system formerly known as Open Access<br />
• Doing today’s work today<br />
• Patients offered an appointment with their<br />
own PCP on or near the day that they call<br />
• We got rid off…<br />
– No Show rate of 40% - Reduced to 13%!<br />
– Double booking<br />
– Long waits for visits, especially preventive care<br />
– Low patient <strong>and</strong> provider satisfaction<br />
– Defined our “importance” based on length of our backlog
Does Advanced Access work in<br />
Dentistry?<br />
• First principal is violated – matching capacity<br />
to dem<strong>and</strong><br />
– Dem<strong>and</strong> far outstrips our capacity<br />
– At times we had to go further out into the future<br />
• Changes the dynamic of WHO is seen as a<br />
patient <strong>and</strong> is willing to navigate the system<br />
– Motivated patients<br />
– Same day ER patients
How does it help with<br />
access to care?<br />
� No new cost outlays, but basic technical expertise.<br />
� No show rate down from average of 30-40% to 10-15%<br />
<strong>and</strong> less<br />
� Eliminates appointments booked out for months<br />
� Increased patient satisfaction<br />
� Improved patients/provider continuity<br />
� Available slots for same day ER patients<br />
� MOST OF OUR CLINICS<br />
ARE AT OR BEYOND CAPACITY
Lessons learned… learned<br />
• Need to match supply <strong>and</strong> dem<strong>and</strong><br />
– Very difficult when the system is already overloaded<br />
– May need to alter the new patient intake<br />
– Optimize panels for each provider<br />
• Need to rely heavily on recall system<br />
– Appointments need to be entered when patient leaves<br />
– Weekly/Monthly resolution of recall lists<br />
– Tendency to create a “Lottery” for appointments<br />
• Patient/Staff need to “trust” the system<br />
• Need to allow for flexibility<br />
– Transportation problems<br />
– Translation problems<br />
– Scheduling difficulties
How Do You Support (Or Impede)<br />
Support<br />
�<br />
�<br />
�<br />
�<br />
�<br />
3 exam rooms/medical provider<br />
2-3 operatories per dentist<br />
<strong>Productivity</strong>?<br />
1 medical ass’t per medical provider<br />
1 RN for every 2 medical providers<br />
1 dental ass’t per dentist plus a “floater”<br />
for more than 3 dentists<br />
automated recall postcards <strong>and</strong> nightly<br />
phone calls (July Soft)<br />
Language Line in every room vs. pulling<br />
staff to translate (100k per yr)<br />
low turnover, especially key receptionist<br />
positions<br />
Impede<br />
�<br />
�<br />
�<br />
�<br />
�
Monitoring <strong>and</strong> Reporting<br />
• Keeping a “score card” in front of people<br />
can increase awareness of the overall<br />
goal (Overall Profitability! Exp<strong>and</strong>ed<br />
Services!)<br />
• Frequent Reporting <strong>and</strong> goal setting<br />
yields information about current status<br />
– Instead of “what went wrong last month”<br />
we have “I have a problem that needs to be<br />
addressed today.”
Measure, Communicate,<br />
Investigate<br />
• Are we utilizing the resources that we have<br />
in place <strong>and</strong> available today as efficiently<br />
as possible?<br />
• Leaving a chair vacant is a waste of scarce<br />
resources<br />
• Looking to measure against “Budget” can<br />
frustrate providers<br />
– PTO / CME / Sick time utilization is not<br />
factored as a measurement in the budget<br />
– How did We do today with the resources<br />
available?
Measure, Communicate,<br />
Investigate<br />
• On a daily basis an email is sent measuring<br />
how well or poorly each component used<br />
the assets at h<strong>and</strong>.<br />
• Total Number of “slots” or 30 minute<br />
appointments available (14 for dentist)<br />
against how many slots were filled.<br />
• Hygiene st<strong>and</strong>ard is eleven 45 minute<br />
“slots”
Daily Reporting of Capacity<br />
Utilization<br />
Visits Week ending 12/08/2006<br />
2007<br />
<strong>Dental</strong> Mon Tue Wed Thur Fri Totals Budget<br />
New London 13.5<br />
Meriden 17.0<br />
New Britain 27.0<br />
Middletown 33.0<br />
Old Saybrook 14.0<br />
Stamford 17.0<br />
Totals 121.5<br />
24.5<br />
27.0<br />
49.0<br />
34.0<br />
12.0<br />
22.0<br />
168.5<br />
24.0<br />
24.0<br />
48.5<br />
24.0<br />
15.0<br />
20.0<br />
155.5<br />
0.0<br />
12.0<br />
25.5<br />
35.0<br />
15.0<br />
19.0<br />
106.5<br />
27.5<br />
13.0<br />
41.0<br />
36.0<br />
14.0<br />
8.0<br />
139.5<br />
89.5<br />
93.0<br />
191.0<br />
162.0<br />
70.0<br />
86.0<br />
691.5<br />
Available Slots Mon Tue Wed Thur Fri Totals<br />
New London 14<br />
Meriden 19<br />
New Britain 28<br />
Middletown 42<br />
Old Saybrook 14<br />
Stamford 20<br />
Totals 137<br />
28<br />
26<br />
50<br />
42<br />
14<br />
20<br />
180<br />
28<br />
24<br />
55<br />
28<br />
14<br />
20<br />
169<br />
0<br />
15<br />
25<br />
42<br />
14<br />
20<br />
116<br />
28<br />
12<br />
45<br />
42<br />
14<br />
20<br />
161<br />
98<br />
96<br />
203<br />
196<br />
70<br />
100<br />
763<br />
Percentage Capacity Mon Tue Wed Thur Fri Totals<br />
New London 96% 88% 86% 100% 98% 91%<br />
Meriden 89% 104% 100% 80% 108% 97%<br />
New Britain 96% 98% 88% 102% 91% 94%<br />
Middletown 79% 81% 86% 83% 86% 83%<br />
Old Saybrook 100% 86% 107% 107% 100% 100%<br />
Stamford 85% 110% 100% 95% 40% 86%<br />
Totals 89% 94% 92% 92% 87% 91%<br />
106<br />
110<br />
199<br />
159<br />
55<br />
95<br />
736
Measure, Communicate,<br />
Investigate<br />
• On a weekly basis, through email, the sites<br />
are sent an overall look at how each site<br />
did relative to the others<br />
• Capacity trends are also sent weekly for<br />
both Hygiene <strong>and</strong> <strong>Dental</strong> visit utilization<br />
– Questions as to what went right or wrong for<br />
the week<br />
– Corrective action can be more immediate <strong>and</strong><br />
effective
350<br />
300<br />
250<br />
200<br />
150<br />
100<br />
50<br />
0<br />
<strong>Dental</strong> & Hygiene Visits by Week<br />
Holiday<br />
Week<br />
Holiday<br />
Week<br />
<strong>Dental</strong> & Hygiene Visits by Week<br />
Holiday<br />
Week<br />
Holiday<br />
Week<br />
New London<br />
Meriden<br />
New Britain<br />
Middletown<br />
Old Saybrook<br />
Stamford<br />
Norwalk
110.0%<br />
105.0%<br />
100.0%<br />
95.0%<br />
90.0%<br />
85.0%<br />
May 5<br />
Weekly Capacity Reporting<br />
May 26<br />
<strong>Dental</strong> & Hygiene Percentage of Capacity<br />
June 16<br />
July 7<br />
July 28<br />
Aug 18<br />
9/8/2006<br />
9/29/2006<br />
10/20/2006<br />
11/10/2006<br />
12/1/2006<br />
<strong>Dental</strong><br />
Hygiene
Effective Communication of the<br />
Goal <strong>and</strong> Progress towards it<br />
• Utilize as many forms of<br />
communication as possible to convey<br />
the same message in different formats<br />
– Intranet – Internal website<br />
– Emails<br />
– Video conferencing<br />
– Wall boards<br />
– H<strong>and</strong>outs in meetings
Tie it all Together<br />
• Effective hiring in selecting for known<br />
variables that have a high likelihood of<br />
increasing productivity<br />
• Actively managing to traits that strongly affect<br />
productivity:<br />
– Panel Management<br />
• Assigning patients as they are added to the practice to the<br />
providers with under filled panels<br />
– Reduction in No-show rates<br />
• Utilization of Advanced Access Scheduling<br />
– RVU Analysis<br />
• No limitations on complexity of procedures. Varied work<br />
day increases overall provider satisfaction
Tie it all Together<br />
• Recruit <strong>and</strong> utilize specialists within your<br />
own practice<br />
– Endodontics / Pediatric / Specialty Training in<br />
Oral Surgery<br />
• Optimize the workflow<br />
– Increased <strong>Dental</strong> Assistants<br />
– Ensure minimum two rooms per Dentist<br />
• Invest in Instrumentation that improves<br />
productivity<br />
– Rotary Endo / Cassettes / Multiple Autoclaves
Tie it all Together<br />
• Report <strong>and</strong> Act upon the Results<br />
– Involve as many individuals as possible<br />
– Information is simply Information, it is<br />
not personal<br />
– Convey that <strong>Productivity</strong> is a means to a<br />
Goal, not a Measure for Punishment.<br />
– Transparency <strong>and</strong> Timeliness of Data is<br />
an Absolute necessity
Tie it all Together<br />
• Increased <strong>Productivity</strong> will allow<br />
Exp<strong>and</strong>ed <strong>Dental</strong> Care to the under<br />
served<br />
• “No Margin No Mission”<br />
• Finding <strong>and</strong> maintaining the break<br />
even point
<strong>Productivity</strong> data is for planning,<br />
projecting – not for Punishment
Contact Information<br />
Stewart Joslin, CPA, CFO<br />
860.347.6971 x3607 stew@chc1.com<br />
Margaret Drozdowski, DMD, <strong>Dental</strong> Director<br />
860.224.3642 x5167 maggie@chc1.com<br />
For a copy of this presentation go to:<br />
www.chc1.com-<br />
Click on: Arizona presentation


